Activity-Based Costing (ABC) - U-M Personal World …venky/teach/abc.pdfAgenda • Introduction to...
36
Activity-Based Costing (ABC)
Transcript of Activity-Based Costing (ABC) - U-M Personal World …venky/teach/abc.pdfAgenda • Introduction to...

Activity-Based Costing (ABC)

Agenda
• Introduction to Shared Resources
• A hospice example: Hospice of Central Kentucky
• Mechanics of Activity-based costing (ABC)
• Strategy and Costing
• A manufacturing example: Ross Parts
• Takeaway

Two-Stage Cost Systems
• Recall the two-stage cost system
– Stage 1: Partition shared resources into pools
• Move “BIG and DIFFERENT” resource to a separate pool
– Stage 2: Allocate each pool using the relevant allocation base
• How to design two-stage cost systems for any given company?
• Activity Based Costing (ABC) provides a systematic approach
– It relies on a thorough understanding of the production process

HCK Example
• The Hospice of Central Kentucky (HCK) traditional cost system computed administrative cost per patient-day by dividing total administrative cost by total patient-days.
• Reported administrative cost per patient day
• $112,565 ÷ 3,593 patient-days = $31.33.
• How accurately does this cost number track the costs of servicing patients using the modern technologies of terminal care?
Source: Sidney J. Baxendale and Victoria Dornbusch, “Activity-Based Costing for a Hospice,” Strategic Finance, March 2000, pp. 65-70. www.imanet.org. The case does not disclose the time period over which the costs were measured (e.g., monthly).

Business Model of HCK
AdmitProcess
CareDischarge
Cost Cost Cost
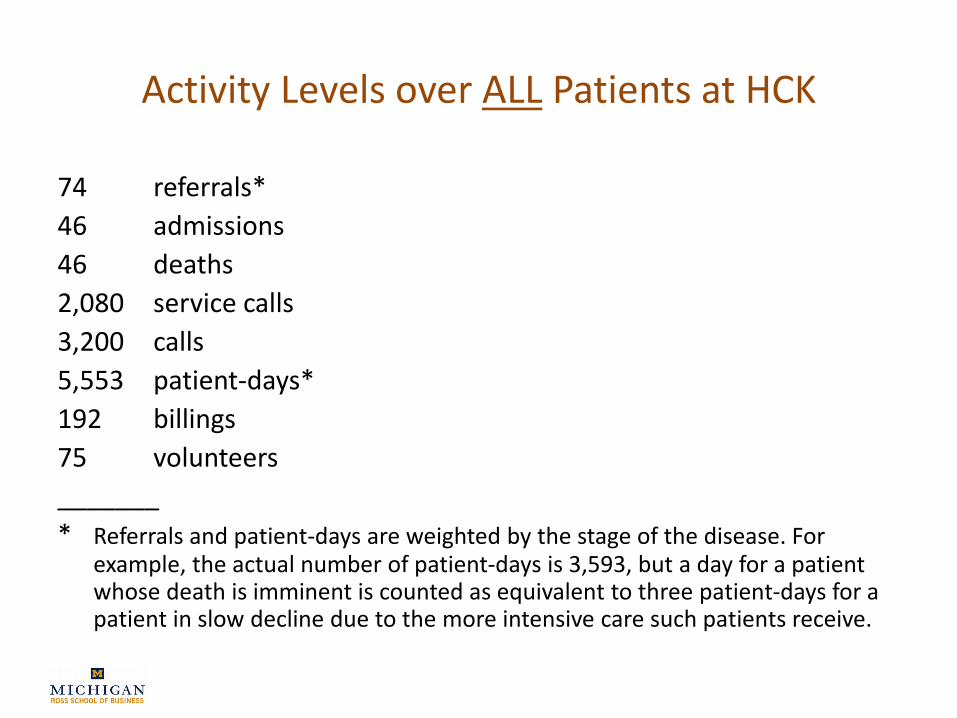
Activity Levels over ALL Patients at HCK
74 referrals*
46 admissions
46 deaths
2,080 service calls
3,200 calls
5,553 patient-days*
192 billings
75 volunteers
_______
* Referrals and patient-days are weighted by the stage of the disease. For example, the actual number of patient-days is 3,593, but a day for a patient whose death is imminent is counted as equivalent to three patient-days for a patient in slow decline due to the more intensive care such patients receive.
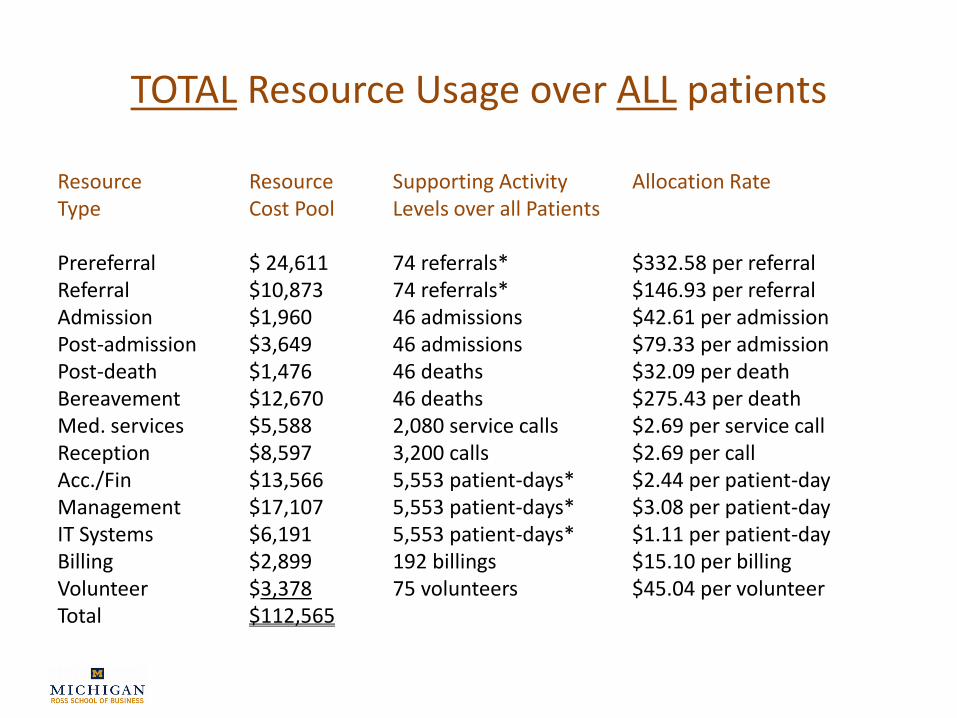
TOTAL Resource Usage over ALL patients
Resource Resource Supporting Activity Allocation RateType Cost Pool Levels over all Patients
Prereferral $ 24,611 74 referrals* $332.58 per referralReferral $10,873 74 referrals* $146.93 per referralAdmission $1,960 46 admissions $42.61 per admissionPost-admission $3,649 46 admissions $79.33 per admissionPost-death $1,476 46 deaths $32.09 per deathBereavement $12,670 46 deaths $275.43 per deathMed. services $5,588 2,080 service calls $2.69 per service callReception $8,597 3,200 calls $2.69 per callAcc./Fin $13,566 5,553 patient-days* $2.44 per patient-dayManagement $17,107 5,553 patient-days* $3.08 per patient-dayIT Systems $6,191 5,553 patient-days* $1.11 per patient-dayBilling $2,899 192 billings $15.10 per billingVolunteer $3,378 75 volunteers $45.04 per volunteerTotal $112,565

True cost of an INDIVIDUAL Patient
• A patient’s administrative cost is that patient’s use of administrative resources times the usage charge
• Consider a patient who had one referral, one admission, one call, no service call, 4 billings, 5 volunteers, stayed for two
days and died.
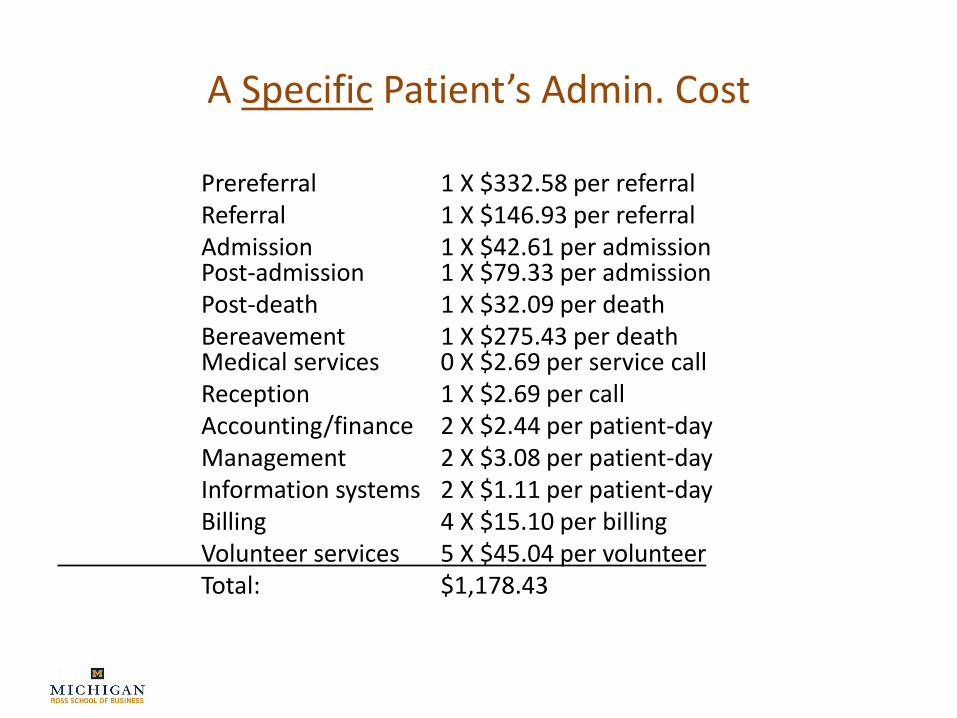
A Specific Patient’s Admin. Cost
Prereferral 1 X $332.58 per referralReferral 1 X $146.93 per referralAdmission 1 X $42.61 per admissionPost-admission 1 X $79.33 per admissionPost-death 1 X $32.09 per deathBereavement 1 X $275.43 per deathMedical services 0 X $2.69 per service callReception 1 X $2.69 per callAccounting/finance 2 X $2.44 per patient-dayManagement 2 X $3.08 per patient-dayInformation systems 2 X $1.11 per patient-dayBilling 4 X $15.10 per billingVolunteer services 5 X $45.04 per volunteerTotal: $1,178.43

Summary of Cost Analyses at HCK
• Traditional cost data
• $112,565 ÷ 3,593 patient-days = $31.33
• The management then measured the levels of resource consumption by various categories of patients. The estimates of the average cost per patient-day for patients in various stages of their diseases are:
• Stage of Disease Cost per Patient-Day
Slow decline $27.39
Rapid decline $29.84
Imminent death $62.88
Death $381.57

Why should HCK do the costing exercise?
• Why not just charge everyone $31 plus some markup?

Strategy and Costing
• Why care about efficiencies?
– Healthcare
– Automobile Insurance
– Monopoly (utilities and solar power)
– Credit cards
• Strategy and industry structure
– Buffett vs 3G

2012 Insurer operating expenses (in millions)
0%
10%
20%
30%
40%
50%
60%
70%
80%
90%
100%
Aetna UnitedHealth Wellpoint
Medical Costs Administrative Costs Net Profit (after taxes)
$23,729
$6,876
$1,657 $5,526
$17,306
$80,226 $48,213
$2,655
$8,738
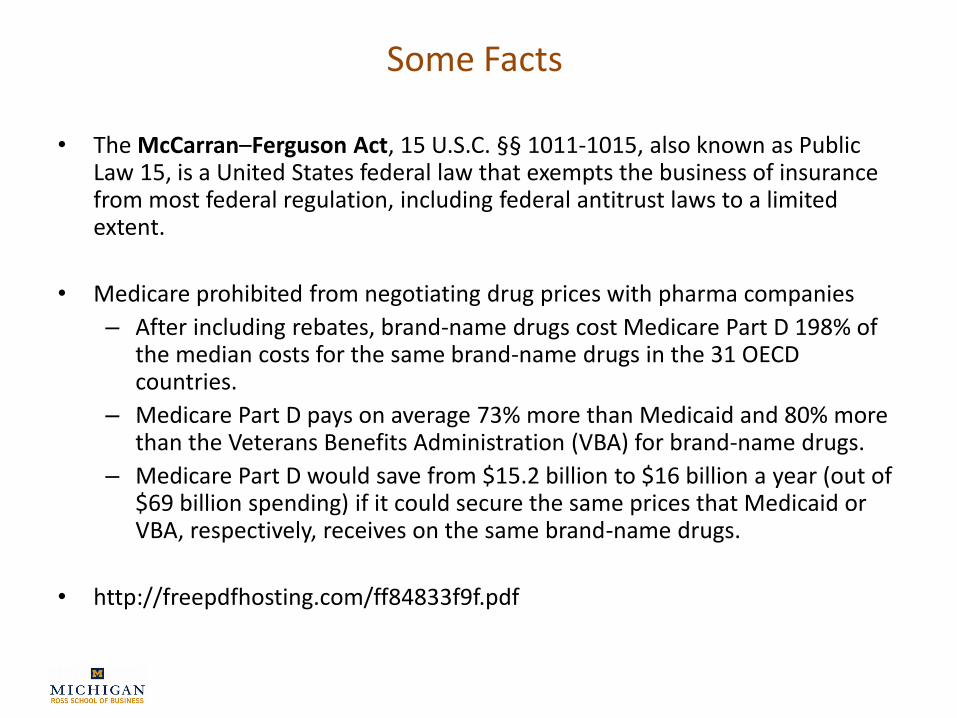
Some Facts
• The McCarran–Ferguson Act, 15 U.S.C. §§ 1011-1015, also known as Public Law 15, is a United States federal law that exempts the business of insurance from most federal regulation, including federal antitrust laws to a limited extent.
• Medicare prohibited from negotiating drug prices with pharma companies
– After including rebates, brand-name drugs cost Medicare Part D 198% of the median costs for the same brand-name drugs in the 31 OECD countries.
– Medicare Part D pays on average 73% more than Medicaid and 80% more than the Veterans Benefits Administration (VBA) for brand-name drugs.
– Medicare Part D would save from $15.2 billion to $16 billion a year (out of $69 billion spending) if it could secure the same prices that Medicaid or VBA, respectively, receives on the same brand-name drugs.
• http://freepdfhosting.com/ff84833f9f.pdf

IMPACT OF THE ACA ON HOSPITALS AND INSURERS
1) Access – particularly expanding Medicaid and creating health insurance exchanges
2) Cost control – including accountable care organizations (ACOs) bundled payments, the “Cadillac” tax, the Center for Medicare and Medicaid Innovation, and the Independent Payment Advisory Board
3) Quality improvement – including reduction in hospital-acquired infections and readmissions, electronic health records, and the establishment of the Patient-Center Outcomes Institute
4) Prevention – including the coverage of preventive services without co-payments, menu labeling, and employer wellness programs
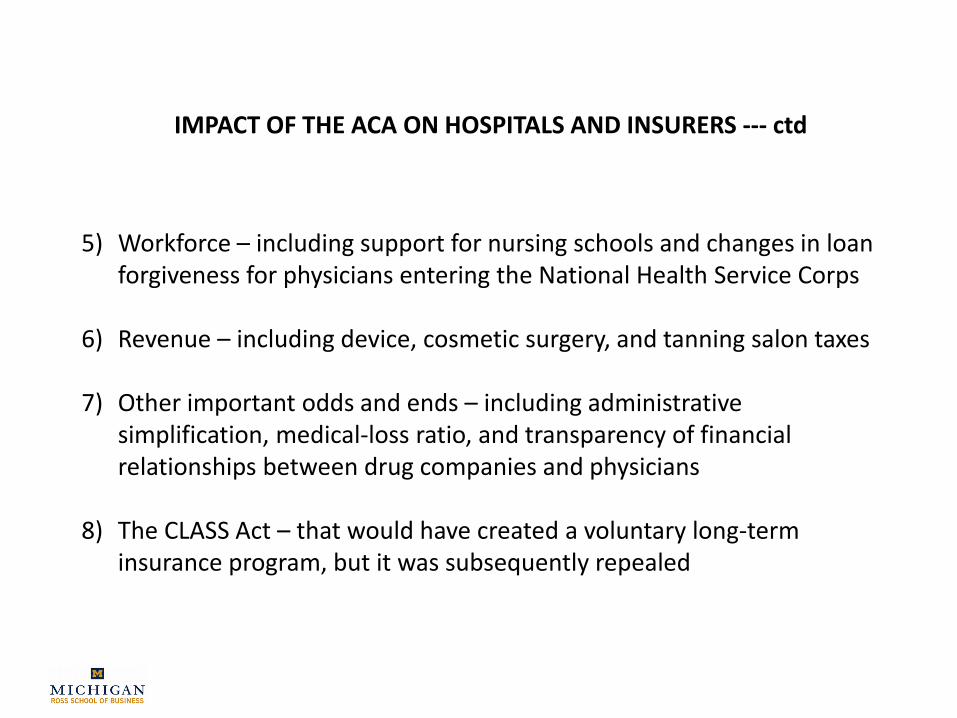
IMPACT OF THE ACA ON HOSPITALS AND INSURERS --- ctd
5) Workforce – including support for nursing schools and changes in loan forgiveness for physicians entering the National Health Service Corps
6) Revenue – including device, cosmetic surgery, and tanning salon taxes
7) Other important odds and ends – including administrative simplification, medical-loss ratio, and transparency of financial relationships between drug companies and physicians
8) The CLASS Act – that would have created a voluntary long-term insurance program, but it was subsequently repealed

Six megatrends
MEGATREND CHANGEEFFECTIVE
DATE
End of insurance companies as we know them
Insurance companies will either become purveyors of management, analytics, and actuarial services or integrated delivery systems actually employing (or contracting with) hospitals, physicians, and other providers to render patient care.
2025
VIP care for the chronically and mentally ill
Physicians and hospitals will focus on keeping patients with chronic illnesses healthy and out of the emergency room and hospital, thereby decreasing the frequency of avoidable complications and rate of hospitalization. Then they will begin routinely screening for depression and other mental health problems and develop standardized rapid interventions.
2020

MEGATREND CHANGEEFFECTIVE
DATE
The emergence of digital medicine and closure of hospitals
Over 1,000 acute-care hospitals will close. We will see a slew of new technologies for remote monitoring, testing, and treating patients in real time outside of the hospital and physician’s offices.
2020
End of employer-sponsored health insurance
Fewer than 20% of workers in the private sector will receive traditional employer-sponsored health insurance.
2025
End of health care inflation Health care inflation will be GDP+0%. 2020
Transformation of medical education
Medical education will be transformed in 4 fundamental ways: (1) three-year medical schools and shorter residencies; (2) half of medical school clinical training will be outside of hospitals; (3) integration of nurses, pharmacists, social workers with medical students in multi-professional team training; and (4) formal incorporation of population health and management skills in training.
2025

Activity-Based Costing (ABC)
• Activity-Based Costing: Shared resources are mapped to products by analyzing the production processes:
Shared Resources Products
ProductionProcesses
Mapping

Steps of ABC
1. Identify key activities that are required to produce the good or service by analyzing the production processes.
2. Assign the overhead costs to the different activities.
3. Identify the cost driver (allocation base) for each activity.
4. Calculate the overhead rate for each activity:
(Rate = Overhead cost ÷ Cost driver volume)
5. Using the activity rates, charge each product based on the amount of activities it uses as it moves through the production process.

Takeaway
• Resource level
– ABC assumes resources arise from activities
– ABC then divides each resource’s cost by the total level of activities it supports
– This division calculation yields a activity charge for each activity
• Product level
– As the product progresses through the production process, it accumulates costs based on how much activities it uses
• The product cost thus more accurately reflects its true use of shared resources

Costing Overview

Another Example: Ross Parts
• Manufacture two (substitutable) parts
– D-12 and M-24
• Current production information
D-12 M-24
Units produced annually 100,000 25,000
Material costs per unit $10 $12
Direct labor hours per unit 0.8 0.8
Direct labor rate per hour $20 $20
Machine-hours per unit 2.0 2.0
Set-up hours per run (batch) 5.0 5.0
Annual production runs 110 10
Wastewater generated per unit (liters) 10.0 0.0

Ross Parts Example
• Overhead cost by department and category
Department/CategoryAnnual
Budgeted Overhead
Supervision $ 240,000
Material handling 325,000
Wastewater treatment 250,000
Equipment depreciation 625,000
Setup labor 60,000
Total $1,500,000

Ross Parts Example
• Company uses a single overhead pool
– Allocation base is direct-labor cost
• Which product is less costly to produce?
– Total labor hours = 100,000
(= 100,000 x 0.8 + 25,000 x 0.8)
– Total labor cost = $2,000,000
(= 100,000 hours x $20/hour)
– Overhead rate = 75% (= $1,500,000 ÷ $2,000,000)

Ross Parts Example
• Unit product costs under this system
D-12 M-24
Direct material $10.00 $12.00
Direct labor 16.00 16.00
Overhead (@ 75% of direct labor) 12.00 12.00
Unit cost $38.00 $40.00
Decision: Only produce D-12
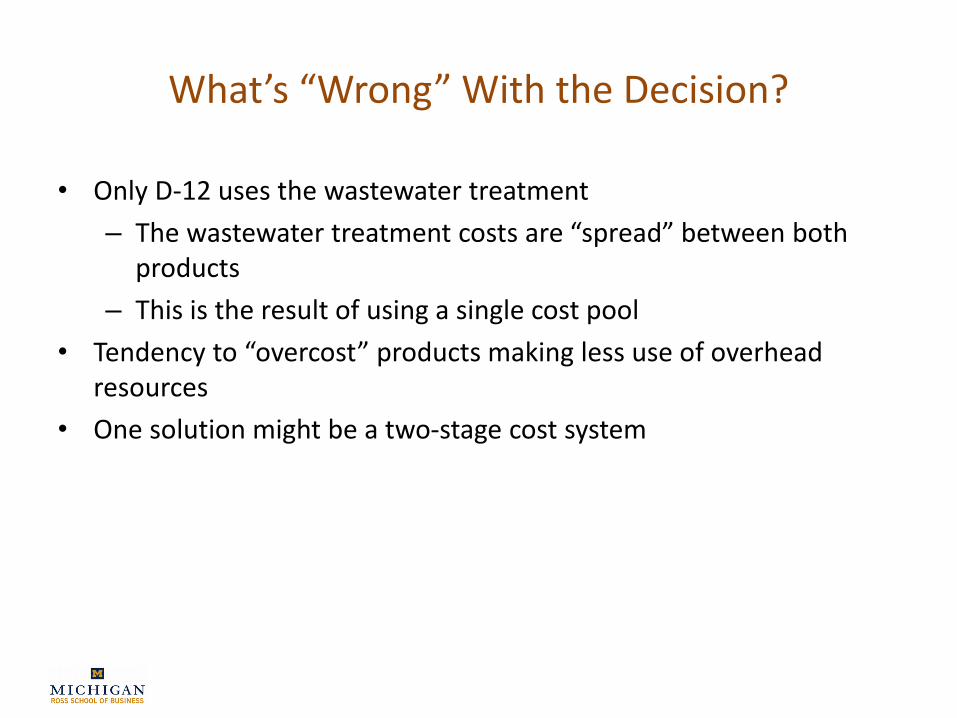
What’s “Wrong” With the Decision?
• Only D-12 uses the wastewater treatment
– The wastewater treatment costs are “spread” between both products
– This is the result of using a single cost pool
• Tendency to “overcost” products making less use of overhead resources
• One solution might be a two-stage cost system

Two-Stage Cost System
Materials Labor Overhead
D-12
Direct
Machine hours
Direct
M-24
WastewaterTreatment
OtherOverhead
Wastewater

Two-Stage Overhead Rates
• The rates for the two overhead pools:
Cost Pool Costs ÷ Allocation Base = Overhead rate
Wastewater $250,000 ÷ 1,000,000 liters = $0.25/liter
Other overhead $1,250,000 ÷ 250,000 machine-hours
= $5.00/hour
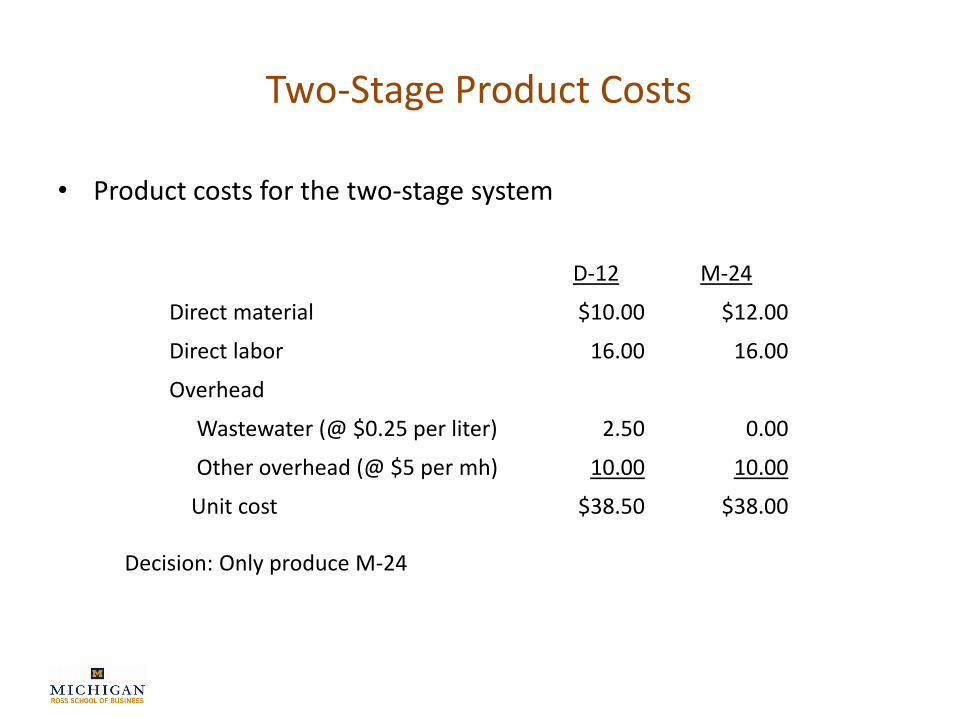
Two-Stage Product Costs
• Product costs for the two-stage system
D-12 M-24
Direct material $10.00 $12.00
Direct labor 16.00 16.00
Overhead
Wastewater (@ $0.25 per liter) 2.50 0.00
Other overhead (@ $5 per mh) 10.00 10.00
Unit cost $38.50 $38.00
Decision: Only produce M-24

What’s “Wrong” Now?
• Company produces M-24 in “longer” runs, requiring fewer set-ups
• But, M-24 uses more expensive material, which might require different handling
• However, the overhead costs are based entirely on volumes produced

A Thought Experiment
• Two production areas (buildings) within a single plant that produce identical numbers (volumes) of markers
• One building only produces black markers (by far the most popular model)
• The second produces all the other colors
• Both buildings use the same amount of direct labor, machine hours, and material cost

A Thought Experiment
• What do you observe in the multi-color building relative to the black marker building?
– More machine set-ups
– More material handling
• To and from the production line
– More inventory movement
– More orders
– In general, a lot more activity

ABC Cost System Diagram
Direct Costs Overhead
D-12
Direct
Setup hours
M-24
SetupSupervise Handle …
Material $Labor $

ABC Overhead Rates
• There are five overhead pools
Cost Pool Costs ÷ Total Activity* = Overhead rate
Supervise $240,000 ÷ 100,000 hours = $2.40/hour
Handle material $325,000 ÷ $1,300,000 = 25% material $
Treat wastewater $250,000 ÷ 1,000,000 liters = $0.25/liter
Use equipment $625,000 ÷ 250,000 hours = $2.50/hour
Setup $60,000 ÷ 600 hours = $100/hour
Cost Pool *Total Activity
Supervision (labor hours) 100,000 units x 0.8 hours + 25,000 units x 0.8 hours
Handle material (material dollars) 100,000 units x $10 + 25,000 units x $12
Treat wastewater (wastewater) 100,000 units x 10 liters + 25,000 units x 0 liters
Use equipment (machine hours) 100,000 units x 2 hours + 25,000 units x 2 hours
Setup machines (setup hours) 110 runs x 5 hours + 10 runs x 5 hours

ABC Product Costs
• Unit product costs for the ABC system
D-12 M-24
Direct material $10.00 $12.00
Direct labor 16.00 16.00
Overhead
Supervise (@ $2.40 per hour) 1.92 1.92
Handle material (@25% material $) 2.50 3.00
Treat wastewater (@ $0.25 per liter) 2.50 0.00
Use equipment (@2.50 per machine-hour) 5.00 5.00
Setup machines (@ $100 per setup hour) 0.55* 0.20
Unit cost $38.47 $38.12
*Because these are unit costs, we need to first determine cost of setups andthen divide by the number of units produced (e.g., 0.55 = [110 x 5 x $100] ÷ 100,000).