Activity 9: Sun Charts - Solar 4R Schools Charts.pdf · Activity 9: Sun Charts ACTIVITY TYPE: ......
11
135 Solar 4R Schools Activity Guide & Teacher Manual L3: Grades 10-12 SECTION 3 ACTIVITIES Activity 9: Sun Charts ACTIVITY TYPE: Worksheet OVERVIEW: This is a two-part activity. In Part I, students are introduced to sun charts, sun angles, and the role of shading in solar-electric systems. In Part II, students perform a site assessment of their school’s solar-electric system. GOAL: Students learn how to determine the angle of the sun in the sky and how to interpret sun charts. SUBJECTS: Math and Science TIME PART I: 20-30 minutes TIME PART II: 30-45 minutes SETTING PART II: Classroom SETTING PART II: Outside on a sunny day MATERIALS PART I: Sun Chart Worksheet: Part 1 MATERIALS PART II: Sun Chart Worksheet: Part 2, Elevation and Azimuth Angle Gage Template (2 copies per student), internet access, printer, elevation gage or protractor, cardboard, glue, small nails, small weights (e.g., nuts or bolts), compass, and string. KEY VOCABULARY: Azimuth, solar altitude, and sun chart. CORRELATIONS TO STANDARDS NATIONAL Science as Inquiry – 1c: Using tools to measure results. Physical Science – 3g: The sun is the major source of energy for changes on the earth’s surface. IDAHO Science – Goal 1.1: Understand systems, order, and organization. OREGON Science – The Earth in Space: Explain how mass and distances affect the interaction between Earth and other objects in space. WASHINGTON Science – Inquiry 2.1 Investigating Systems: Develop the knowledge and skills necessary to do scientific inquiry. Math – 1.1: Understand and apply concepts and procedures from number sense— number and numeration, computation, estimation. ABOUT THE AUTHORS: Founded in 1998, Bonneville Environmental Foundation (BEF) is essentially a non-profit business. Through the sales and marketing of green power products (known as carbon offsets) BEF gives individuals and businesses a way to participate in solving our most pressing environmental issues. All of the net revenues, or “profits,” that the organization makes are reinvested in projects that restore damaged watersheds and support the development and understanding of renewable energy technologies such as solar, wind, and biomass. ACTIVITY 9: SUN CHARTS source: Bonneville Environmental Foundation (BEF)
Transcript of Activity 9: Sun Charts - Solar 4R Schools Charts.pdf · Activity 9: Sun Charts ACTIVITY TYPE: ......
135Solar 4R Schools Activity Guide & Teacher Manual L3: Grades 10-12
SECTIon 3 ACTIVITIES
Activity 9: Sun Charts
ACTIVITY TYPE: Worksheet
oVERVIEW: This is a two-part activity. In Part I, students are introduced to sun charts, sun angles, and the role of shading in solar-electric systems. In Part II, students perform a site assessment of their school’s solar-electric system.
GoAL: Students learn how to determine the angle of the sun in the sky and how to interpret sun charts.
SUBjECTS: Math and Science
TIME PART I: 20-30 minutes TIME PART II: 30-45 minutes
SETTInG PART II: Classroom SETTInG PART II: Outside on a sunny day
MATERIALS PART I: Sun Chart Worksheet: Part 1 MATERIALS PART II: Sun Chart Worksheet: Part 2, Elevation and Azimuth Angle Gage Template (2 copies per student), internet access, printer, elevation gage or protractor, cardboard, glue, small nails, small weights (e.g., nuts or bolts), compass, and string.
KEY VoCABULARY: Azimuth, solar altitude, and sun chart.
CoRRELATIonS To STAnDARDS
nATIonAL
Science as Inquiry – 1c: Using tools to measure results.
Physical Science – 3g: The sun is the major source of energy for changes on the earth’s surface.
IDAHo Science – Goal 1.1: Understand systems, order, and organization.
oREGonScience – The Earth in Space: Explain how mass and distances affect the interaction between Earth and other objects in space.
WASHInGTon
Science – Inquiry 2.1 Investigating Systems: Develop the knowledge and skills necessary to do scientific inquiry.
Math – 1.1: Understand and apply concepts and procedures from number sense— number and numeration, computation, estimation.
ABoUT THE AUTHoRS: Founded in 1998, Bonneville Environmental Foundation (BEF) is essentially a non-profit business. Through the sales and marketing of green power products (known as carbon offsets) BEF gives individuals and businesses a way to participate in solving our most pressing environmental issues. All of the net revenues, or “profits,” that the organization makes are reinvested in projects that restore damaged watersheds and support the development and understanding of renewable energy technologies such as solar, wind, and biomass.
ACTIvITY 9: SUN ChArTS source: Bonneville Environmental Foundation (BEF)
136 Solar 4R Schools Activity Guide & Teacher Manual L3: Grades 10-12
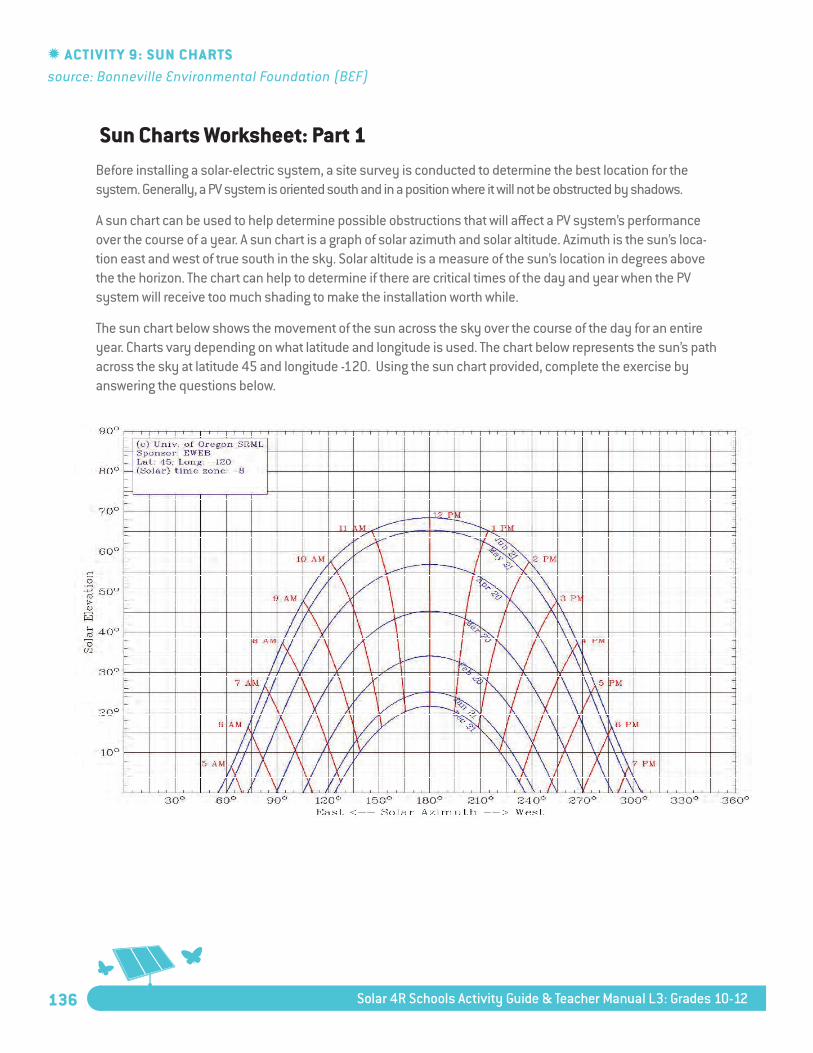
Sun Charts Worksheet: Part 1Before installing a solar-electric system, a site survey is conducted to determine the best location for the system. Generally, a PV system is oriented south and in a position where it will not be obstructed by shadows.
A sun chart can be used to help determine possible obstructions that will affect a PV system’s performance over the course of a year. A sun chart is a graph of solar azimuth and solar altitude. Azimuth is the sun’s loca-tion east and west of true south in the sky. Solar altitude is a measure of the sun’s location in degrees above the the horizon. The chart can help to determine if there are critical times of the day and year when the PV system will receive too much shading to make the installation worth while.
The sun chart below shows the movement of the sun across the sky over the course of the day for an entire year. Charts vary depending on what latitude and longitude is used. The chart below represents the sun’s path across the sky at latitude 45 and longitude -120. Using the sun chart provided, complete the exercise by answering the questions below.
ACTIvITY 9: SUN ChArTS source: Bonneville Environmental Foundation (BEF)
137Solar 4R Schools Activity Guide & Teacher Manual L3: Grades 10-12
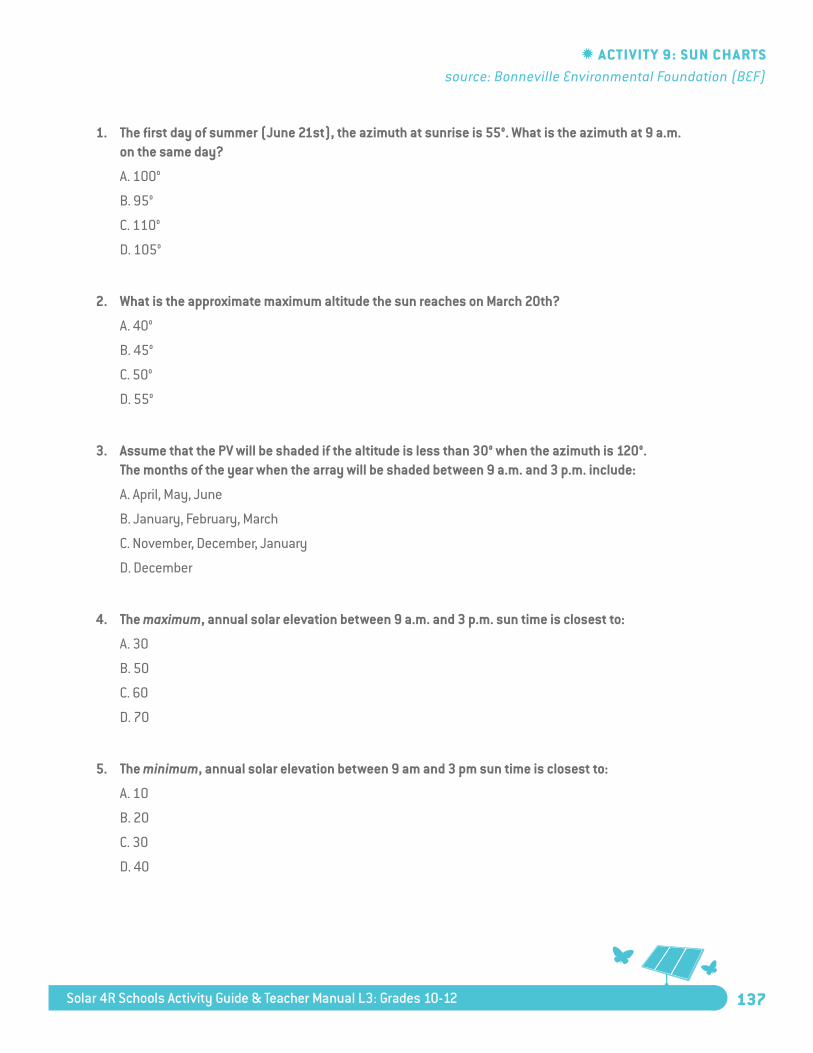
1. The first day of summer (june 21st), the azimuth at sunrise is 55°. What is the azimuth at 9 a.m. on the same day?
A. 100°
B. 95°
C. 110°
D. 105°
2. What is the approximate maximum altitude the sun reaches on March 20th?
A. 40°
B. 45°
C. 50°
D. 55°
3. Assume that the PV will be shaded if the altitude is less than 30° when the azimuth is 120°. The months of the year when the array will be shaded between 9 a.m. and 3 p.m. include:
A. April, May, June
B. January, February, March
C. November, December, January
D. December
4. The maximum, annual solar elevation between 9 a.m. and 3 p.m. sun time is closest to:
A. 30
B. 50
C. 60
D. 70
5. The minimum, annual solar elevation between 9 am and 3 pm sun time is closest to:
A. 10
B. 20
C. 30
D. 40
ACTIvITY 9: SUN ChArTS source: Bonneville Environmental Foundation (BEF)
138 Solar 4R Schools Activity Guide & Teacher Manual L3: Grades 10-12
Sun Charts Worksheet: Part 2 AnSWER KEY
1. The first day of summer (june 21st), the azimuth at sunrise is 55°. What is the azimuth at 9 a.m. on the same day?
A. 100°
B. 95°
C. 110°
D. 105°
2. What is the approximate maximum altitude the sun reaches on March 20th?
A. 40°
B. 45°
C. 50°
D. 55°
3. Assume that the PV will be shaded if the altitude is less than 30° when the azimuth is 120°. The months of the year when the array will be shaded between 9 a.m. and 3 p.m. include:
A. April, May, June
B. January, February, March
C. november, December, january
D. December
4. The maximum, annual solar elevation between 9 a.m. and 3 p.m. sun time is closest to:
A. 30
B. 50
C. 60
D. 70
5. The minimum, annual solar elevation between 9 am and 3 pm sun time is closest to:
A. 10
B. 20
C. 30
D. 40
ACTIvITY 9: SUN ChArTS source: Bonneville Environmental Foundation (BEF)

136 Solar 4R Schools Activity Guide & Teacher Manual L3: Grades 10-12
Sun Charts Worksheet: Part 1Before installing a solar-electric system, a site survey is conducted to determine the best location for the system. Generally, a PV system is oriented south and in a position where it will not be obstructed by shadows.
A sun chart can be used to help determine possible obstructions that will affect a PV system’s performance over the course of a year. A sun chart is a graph of solar azimuth and solar altitude. Azimuth is the sun’s loca-tion east and west of true south in the sky. Solar altitude is a measure of the sun’s location in degrees above the the horizon. The chart can help to determine if there are critical times of the day and year when the PV system will receive too much shading to make the installation worth while.
The sun chart below shows the movement of the sun across the sky over the course of the day for an entire year. Charts vary depending on what latitude and longitude is used. The chart below represents the sun’s path across the sky at latitude 45 and longitude -120. Using the sun chart provided, complete the exercise by answering the questions below.
ACTIvITY 9: SUN ChArTS source: Bonneville Environmental Foundation (BEF)

137Solar 4R Schools Activity Guide & Teacher Manual L3: Grades 10-12
1. The first day of summer (june 21st), the azimuth at sunrise is 55°. What is the azimuth at 9 a.m. on the same day?
A. 100°
B. 95°
C. 110°
D. 105°
2. What is the approximate maximum altitude the sun reaches on March 20th?
A. 40°
B. 45°
C. 50°
D. 55°
3. Assume that the PV will be shaded if the altitude is less than 30° when the azimuth is 120°. The months of the year when the array will be shaded between 9 a.m. and 3 p.m. include:
A. April, May, June
B. January, February, March
C. November, December, January
D. December
4. The maximum, annual solar elevation between 9 a.m. and 3 p.m. sun time is closest to:
A. 30
B. 50
C. 60
D. 70
5. The minimum, annual solar elevation between 9 am and 3 pm sun time is closest to:
A. 10
B. 20
C. 30
D. 40
ACTIvITY 9: SUN ChArTS source: Bonneville Environmental Foundation (BEF)

138 Solar 4R Schools Activity Guide & Teacher Manual L3: Grades 10-12
Sun Charts Worksheet: Part 2 AnSWER KEY
1. The first day of summer (june 21st), the azimuth at sunrise is 55°. What is the azimuth at 9 a.m. on the same day?
A. 100°
B. 95°
C. 110°
D. 105°
2. What is the approximate maximum altitude the sun reaches on March 20th?
A. 40°
B. 45°
C. 50°
D. 55°
3. Assume that the PV will be shaded if the altitude is less than 30° when the azimuth is 120°. The months of the year when the array will be shaded between 9 a.m. and 3 p.m. include:
A. April, May, June
B. January, February, March
C. november, December, january
D. December
4. The maximum, annual solar elevation between 9 a.m. and 3 p.m. sun time is closest to:
A. 30
B. 50
C. 60
D. 70
5. The minimum, annual solar elevation between 9 am and 3 pm sun time is closest to:
A. 10
B. 20
C. 30
D. 40
ACTIvITY 9: SUN ChArTS source: Bonneville Environmental Foundation (BEF)
139Solar 4R Schools Activity Guide & Teacher Manual L3: Grades 10-12
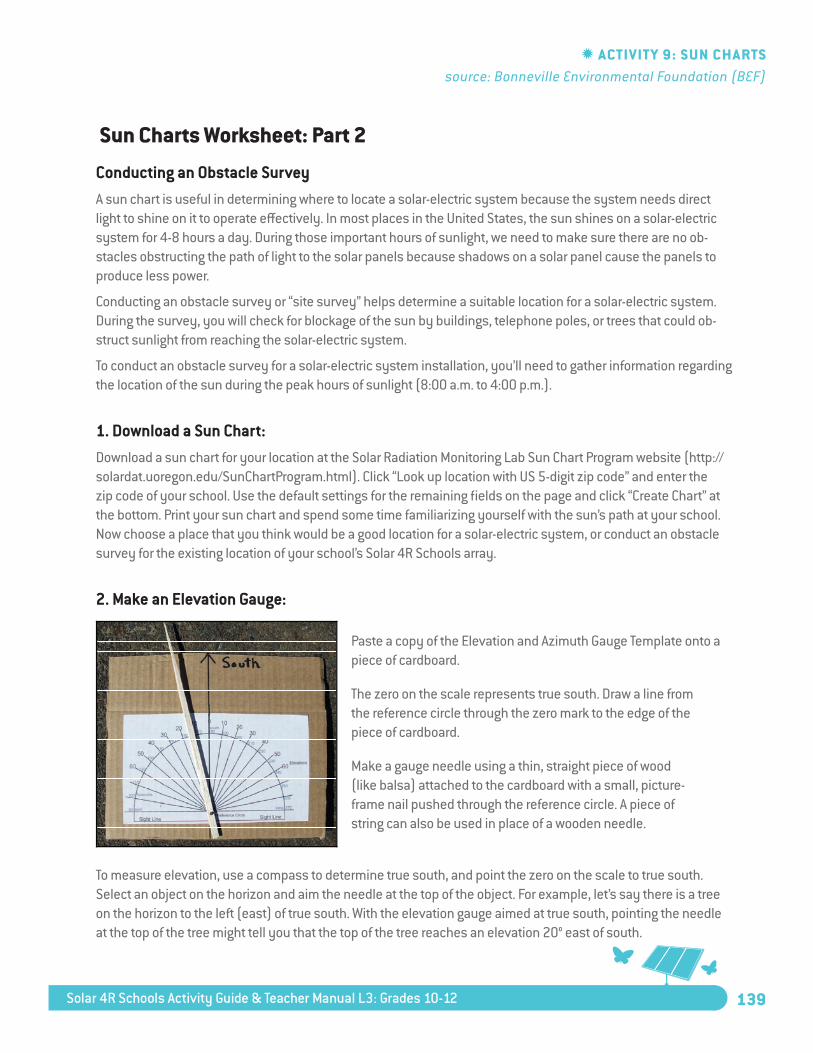
Sun Charts Worksheet: Part 2
Conducting an obstacle Survey A sun chart is useful in determining where to locate a solar-electric system because the system needs direct light to shine on it to operate effectively. In most places in the United States, the sun shines on a solar-electric system for 4-8 hours a day. During those important hours of sunlight, we need to make sure there are no ob-stacles obstructing the path of light to the solar panels because shadows on a solar panel cause the panels to produce less power.
Conducting an obstacle survey or “site survey” helps determine a suitable location for a solar-electric system. During the survey, you will check for blockage of the sun by buildings, telephone poles, or trees that could ob-struct sunlight from reaching the solar-electric system.
To conduct an obstacle survey for a solar-electric system installation, you’ll need to gather information regarding the location of the sun during the peak hours of sunlight (8:00 a.m. to 4:00 p.m.).
1. Download a Sun Chart: Download a sun chart for your location at the Solar Radiation Monitoring Lab Sun Chart Program website (http://solardat.uoregon.edu/SunChartProgram.html). Click “Look up location with US 5-digit zip code” and enter the zip code of your school. Use the default settings for the remaining fields on the page and click “Create Chart” at the bottom. Print your sun chart and spend some time familiarizing yourself with the sun’s path at your school. Now choose a place that you think would be a good location for a solar-electric system, or conduct an obstacle survey for the existing location of your school’s Solar 4R Schools array.
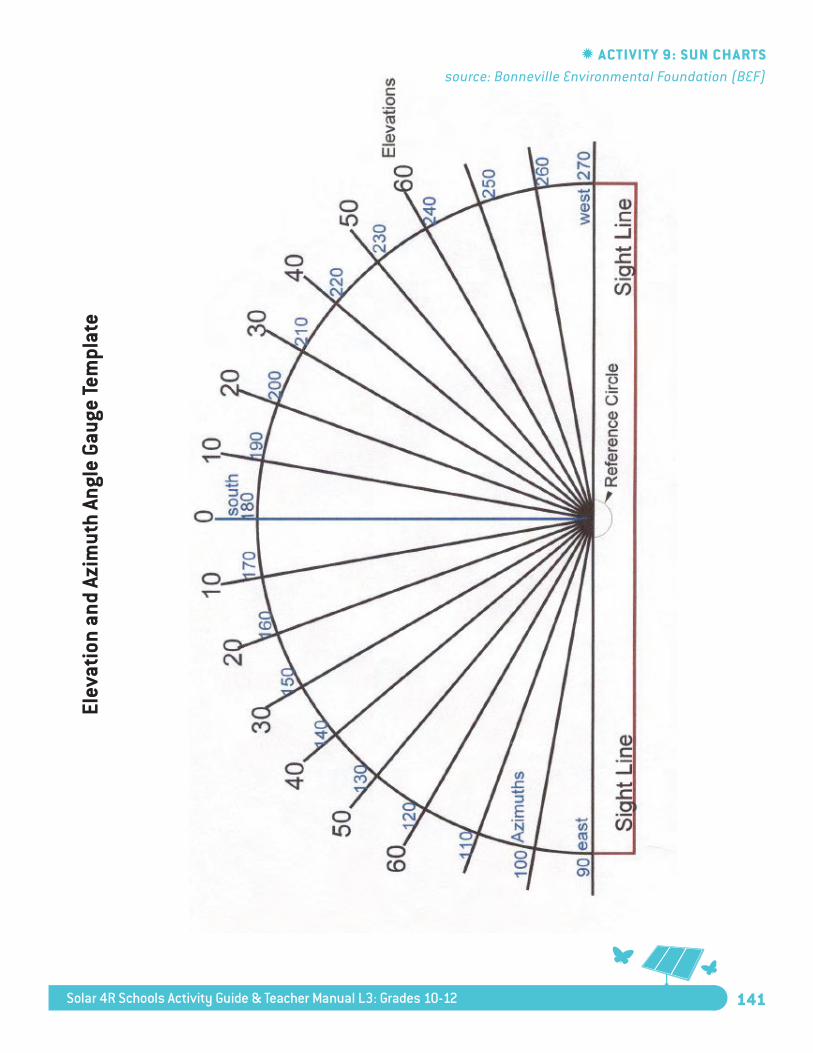
2. Make an Elevation Gauge:
Paste a copy of the Elevation and Azimuth Gauge Template onto a piece of cardboard.
The zero on the scale represents true south. Draw a line from the reference circle through the zero mark to the edge of the piece of cardboard.
Make a gauge needle using a thin, straight piece of wood (like balsa) attached to the cardboard with a small, picture- frame nail pushed through the reference circle. A piece of string can also be used in place of a wooden needle.
To measure elevation, use a compass to determine true south, and point the zero on the scale to true south. Select an object on the horizon and aim the needle at the top of the object. For example, let’s say there is a tree on the horizon to the left (east) of true south. With the elevation gauge aimed at true south, pointing the needle at the top of the tree might tell you that the top of the tree reaches an elevation 20° east of south.
ACTIvITY 9: SUN ChArTS source: Bonneville Environmental Foundation (BEF)
140 Solar 4R Schools Activity Guide & Teacher Manual L3: Grades 10-12
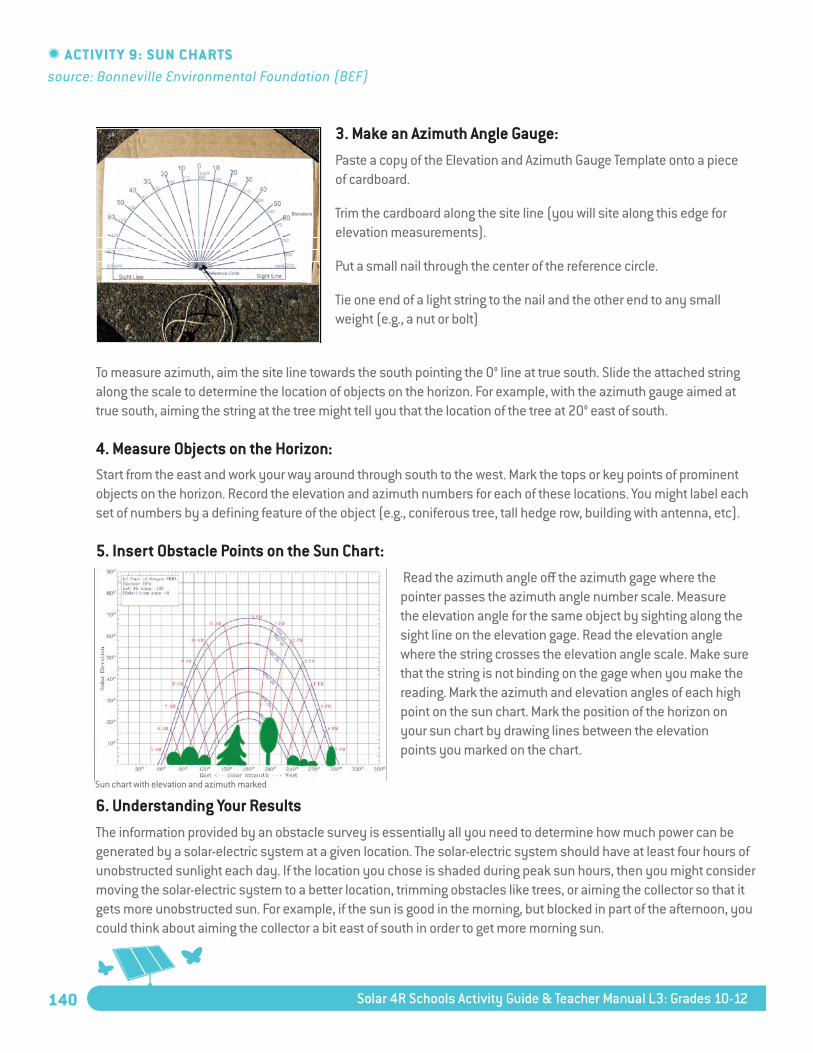
3. Make an Azimuth Angle Gauge: Paste a copy of the Elevation and Azimuth Gauge Template onto a piece of cardboard.
Trim the cardboard along the site line (you will site along this edge for elevation measurements).
Put a small nail through the center of the reference circle.
Tie one end of a light string to the nail and the other end to any small weight (e.g., a nut or bolt)
To measure azimuth, aim the site line towards the south pointing the 0° line at true south. Slide the attached string along the scale to determine the location of objects on the horizon. For example, with the azimuth gauge aimed at true south, aiming the string at the tree might tell you that the location of the tree at 20° east of south.
4. Measure objects on the Horizon: Start from the east and work your way around through south to the west. Mark the tops or key points of prominent objects on the horizon. Record the elevation and azimuth numbers for each of these locations. You might label each set of numbers by a defining feature of the object (e.g., coniferous tree, tall hedge row, building with antenna, etc).
5. Insert obstacle Points on the Sun Chart: Read the azimuth angle off the azimuth gage where the pointer passes the azimuth angle number scale. Measure the elevation angle for the same object by sighting along the sight line on the elevation gage. Read the elevation angle where the string crosses the elevation angle scale. Make sure that the string is not binding on the gage when you make the reading. Mark the azimuth and elevation angles of each high point on the sun chart. Mark the position of the horizon on your sun chart by drawing lines between the elevation points you marked on the chart.
6. Understanding Your ResultsThe information provided by an obstacle survey is essentially all you need to determine how much power can be generated by a solar-electric system at a given location. The solar-electric system should have at least four hours of unobstructed sunlight each day. If the location you chose is shaded during peak sun hours, then you might consider moving the solar-electric system to a better location, trimming obstacles like trees, or aiming the collector so that it gets more unobstructed sun. For example, if the sun is good in the morning, but blocked in part of the afternoon, you could think about aiming the collector a bit east of south in order to get more morning sun.
ACTIvITY 9: SUN ChArTS source: Bonneville Environmental Foundation (BEF)
Sun chart with elevation and azimuth marked
141Solar 4R Schools Activity Guide & Teacher Manual L3: Grades 10-12
Elev
atio
n an
d Az
imut
h An
gle
Gaug
e Te
mpl
ate
ACTIvITY 9: SUN ChArTS source: Bonneville Environmental Foundation (BEF)

142 Solar 4R Schools Activity Guide & Teacher Manual L3: Grades 10-12