Active Vibration Isolation System for Launch Load Alleviation · least with whole satellites, that...
18
Active Vibration Isolation System for Launch Load Alleviation Michael E. Evert, Paul C. Janzen, Eric H. Anderson CSA Engineering, Inc. 2565 Leghorn Street, Mountain View, California Charlotte Gerhart and B. Kyle Henderson Air Force Research Laboratory Albuquerque, NM Smart Structures and Materials 2004: Industrial and Commercial Applications of Smart Structures Technologies, Paper 5388-05 San Diego, CA March 2004 Copyright 2004 Society of Photo-Optical Instrumentation Engineers. This paper was published in the Proceedings of SPIE Volume 5388-05, Smart Structures and Materials, Damping and Isolation 2004, and is made available as an electronic reprint (preprint) with permission of SPIE. One print or electronic copy may be made for personal use only. Systematic or multiple reproduction, distribution to multiple locations via electronic or other means, duplication of any material in this paper for a fee or for commercial purposes, or modification of the content of the paper are prohibited.
-
Upload
hoangthien -
Category
Documents
-
view
216 -
download
0
Transcript of Active Vibration Isolation System for Launch Load Alleviation · least with whole satellites, that...

Active Vibration Isolation System for Launch Load Alleviation
Michael E. Evert, Paul C. Janzen, Eric H. AndersonCSA Engineering, Inc.
2565 Leghorn Street, Mountain View, California
Charlotte Gerhart and B. Kyle HendersonAir Force Research Laboratory
Albuquerque, NM
Smart Structures and Materials 2004:Industrial and Commercial Applications of
Smart Structures Technologies, Paper 5388-05San Diego, CA
March 2004
Copyright 2004 Society of Photo-Optical Instrumentation Engineers. This paper was published in the Proceedings of SPIEVolume 5388-05, Smart Structures and Materials, Damping and Isolation 2004, and is made available as an electronic reprint (preprint) with permission of SPIE. One print or electronic copy may be made for personal use only. Systematic or multiple reproduction, distribution to multiple locations via electronic or other means, duplication of any material in this paper for a fee or for commercial purposes, or modification of the content of the paper are prohibited.

Report Documentation Page Form ApprovedOMB No. 0704-0188
Public reporting burden for the collection of information is estimated to average 1 hour per response, including the time for reviewing instructions, searching existing data sources, gathering andmaintaining the data needed, and completing and reviewing the collection of information. Send comments regarding this burden estimate or any other aspect of this collection of information,including suggestions for reducing this burden, to Washington Headquarters Services, Directorate for Information Operations and Reports, 1215 Jefferson Davis Highway, Suite 1204, ArlingtonVA 22202-4302. Respondents should be aware that notwithstanding any other provision of law, no person shall be subject to a penalty for failing to comply with a collection of information if itdoes not display a currently valid OMB control number.
1. REPORT DATE MAR 2004 2. REPORT TYPE
3. DATES COVERED 00-03-2004 to 00-03-2004
4. TITLE AND SUBTITLE Acitve Vibration Isolation System for Launch Load Alleviation
5a. CONTRACT NUMBER
5b. GRANT NUMBER
5c. PROGRAM ELEMENT NUMBER
6. AUTHOR(S) 5d. PROJECT NUMBER
5e. TASK NUMBER
5f. WORK UNIT NUMBER
7. PERFORMING ORGANIZATION NAME(S) AND ADDRESS(ES) CSA Engineering,2565 Leghorn Street,Mountain View,CA,94043
8. PERFORMING ORGANIZATIONREPORT NUMBER
9. SPONSORING/MONITORING AGENCY NAME(S) AND ADDRESS(ES) 10. SPONSOR/MONITOR’S ACRONYM(S)
11. SPONSOR/MONITOR’S REPORT NUMBER(S)
12. DISTRIBUTION/AVAILABILITY STATEMENT Approved for public release; distribution unlimited
13. SUPPLEMENTARY NOTES The original document contains color images.
14. ABSTRACT see report
15. SUBJECT TERMS
16. SECURITY CLASSIFICATION OF: 17. LIMITATION OF ABSTRACT
18. NUMBEROF PAGES
17
19a. NAME OFRESPONSIBLE PERSON
a. REPORT unclassified
b. ABSTRACT unclassified
c. THIS PAGE unclassified
Standard Form 298 (Rev. 8-98) Prescribed by ANSI Std Z39-18

Smart Structures and Materials 2004: Industrial and Commercial Applications of Smart Structures Technologies, Paper 5388-05
1
Active Vibration Isolation System for Launch Load Alleviation
Michael E. Everta, Paul C. Janzena, Eric H. Andersona, Charlotte Gerhartb and B. Kyle Hendersonb aCSA Engineering Inc., Mountain View, CA 94043
bAir Force Research Laboratory, Albuquerque, NM, 87117
ABSTRACT
Payloads delivered to orbit by expendable launch vehicles experience high levels of vibration. This vibration can cause component failures, or more frequently, lead to extra weight that would otherwise be useful for added functions on orbit. Vibration isolation systems have been flown to protect various components as well as entire spacecraft, dramatically reducing launch loads and saving costs in redesign and tests. Future spacecraft and components may benefit from further load reduction through the use of higher performance active isolation systems. These active systems are capable of introducing compliance in selected axes, while maintaining required rigidity in others. They can also produce excellent isolation without large amplification. Passive and active vibration isolation systems were developed for the Vibro Acoustic Launch Protection Experiment (VALPE) and flew aboard sounding rockets. The paper describes the design and development of the isolation systems, actuation and isolation architectures and control strategies. Integration of two flight experiments is summarized. Ground test results are presented for passive and active systems. Results of the experiments are provided, and recommendations for active vibration isolation are offered.
Keywords: launch vibration, vibration isolation, shock isolation, active vibration isolation, VALPE
INTRODUCTION
In the last 50 years, the capability and reliability of launch vehicles have improved dramatically, while launch vehicle-induced vibration and shock environments have not lessened significantly. Propulsion systems, motor ignitions and shutdowns, stage separations, fairing separation, payload separations and spacecraft deployment often produce high shock and vibration levels. Excessive vibration and shock can cause permanent damage to satellite electronics, optics, and other sensitive equipment. To compensate for the environment, payloads must be designed and tested to high vibration and shock levels, greatly increasing the cost of many components. An excellent alternative is to reduce the launch loads through the use of isolation systems.
Early isolation systems protected individual components. Sensors, instruments and other devices considered particularly susceptible to shock and vibration were identified and then mechanical components were designed to support them. Although this practice has never been common, it was effective and continues to be so. Whole spacecraft isolation is a more recent approach.1 This method attempts to reduce loads on an entire spacecraft by mechanical modification of the spacecraft/launch vehicle interface, sometimes called a “payload attachment fitting.”
One design for a whole-spacecraft shock isolation system is a continuous ring made of a series of highly damped flexures. The designed-in compliance, high damping, contorted shock path, and joints all combine to make this an effective lightweight shock and vibration isolation system. This ShockRing™2 design forms the basis for an isolation system that was part of the Vibro-Acoustic Launch Protection Experiment (VALPE).3
LIMITATIONS OF PASSIVE ISOLATION AND POTENTIAL BENEFITS ACTIVE SYSTEMS
Passive vibration and shock isolation systems have only begun to demonstrate their possibilities. With several successful flights, and additional ground test data, the benefits of isolation are clear. Passive isolation is moving toward the point where it is built in to the launch vehicle, and reduced launch environments are reflected in payload planners

Smart Structures and Materials 2004: Industrial and Commercial Applications of Smart Structures Technologies, Paper 5388-05
2
guides. But while passive systems are highly effective, they have physical limitations. An all-mechanical passive system is constrained in at least two ways. When the geometry and stiffness of one component are determined, it is likely that isolation properties in multiple axes are affected. Further, there are fundamental limits that couple passive isolation performance with deformation under static load. Consider each of these two limitations in greater detail.
In passive systems, compliance in one axis often results in compliance in other axes. Isolation systems work by stopping transmission and softening connections between subsystems. It is common that high vibration or shock levels along the primary axis of a rocket can benefit from isolation in the vertical direction. However, it is also common, at least with whole satellites, that the center of gravity of the isolated system is well above the attachment fitting where the isolation system is located. Thus the introduction of a soft axial or lateral isolation system necessarily results in a soft support in the two rocking or tip and tilt axes. That’s a concern for at least two reasons. First, there is often little clearance between satellite components and the inner walls of the fairing or shroud. Second, these low frequency isolation/suspension system modes tend to couple well into the launch vehicle attitude control system (ACS).
In passive systems, isolation performance is coupled to deformation under static or quasi-static loads. In the simplest case of the isolator as pure spring, the isolation corner frequency is proportional to the square root of the stiffness, whereas the deformation under static load is inversely proportional to the stiffness. A more compliant system gives better isolation performance (lower corner frequency) but allows much more static deformation. For launch systems, the steady acceleration may be several gees, and thus deformation and stresses in a soft isolator can be quite large.
Both of these limitations constrain passive isolation designs to be satisfactory for some vehicle-payload combinations, especially smaller launch vehicles, but not completely satisfactory for others. Large vehicles such as EELV potentially can benefit from greater performance than even the best passive systems can provide.
The basic limitations of passive isolation systems can be addressed directly by use of an active system. Active vibration isolation is increasingly used in terrestrial applications that require the highest performance, for example in semiconductor manufacturing and inspection equipment. It has also been used to a limited extent in on-orbit regulation of instrument platform motion.4 Active isolation and suspension for launch vehicles is a natural extension of all-mechanical passive systems.5 As noted below, there are additional costs that come with increased performance, but consider first how an active system can address directly the noted shortfalls of passive systems.
In active systems, it is possible to control compliance for each axis separately. Conceptually, the active system, through feedback for example, can allow the designer to specify the isolation properties for each axis. In particular, the isolation system design can be considered as several (six) separate designs in which properties are set electronically, augmenting the baseline mechanical system. Thus, it is conceivable to have an isolation system that is soft axially and stiff in rocking. Flexible modes of launch vehicles and satellites make this non-trivial in practice.
In active systems, isolation performance is de-coupled from deformation under static or quasi-static loads. This is relevant to the high gee quasi-static acceleration of launch. One common method is to begin with a passive isolator, and to actively soften that system. The “softening” applies to the isolation properties – the corner frequency drops – and not to static load carrying ability and any resulting quasi-static motion.
Additionally, in active systems, damping in a suspension mode is not necessarily coupled to the rate of transmissibility rolloff with frequency. The active system can damp the mode or modes, but leave unchanged the desirable high frequency isolation characteristics.
Of course, the greater performance of active systems comes with costs. An active system is likely to be larger and heavier. Actuators, especially those required to produce large forces that may be required in launch vehicles, can be large and heavy, as can their power amplifiers and supplies. Active isolation systems potentially have lower reliability. While common electronic systems and transducers are extremely reliable, specialized systems may not be, especially in the harsh environment of launch. Any active system must be designed to be fail safe, and this can lead to higher mass as well. Monetary cost is also higher. Greater complexity, concern about fail safety, and a need to minimize mass all drive cost up. The design process will be longer, and testing may be more comprehensive. Thus, it is easy to imagine the cost of an active isolation system outstripping that of a passive one by more than an order of magnitude.
An adaptive-passive or semi-active isolation system could achieve some of the benefits of a fully active system while avoiding some of the weight, complexity and cost. The semi-active system could switch the passive system between a small number of states during different parts of the flight regime. It could modify the stiffness of the isolators during a limited number of shock events. Or, the semi-active system could adapt passive parameters continuously.

Smart Structures and Materials 2004: Industrial and Commercial Applications of Smart Structures Technologies, Paper 5388-05
3
It is obvious that a good active system will be designed with a good passive system as the starting point. The best designs would simultaneously consider both the passive and active elements in the isolation system. The Vibro Acoustic Launch Protection Experiment (VALPE) program3 afforded an opportunity for co-design of passive and active systems, flight of a passive system, and then flight of an active system under nearly the same conditions.
GOALS FOR THE ISOLATION SYSTEM DEVELOPMENT
This section summarizes the goals for the VALPE isolation systems. The overall goals were:
• Accomplish substantial risk reduction towards the use of active systems for launch load alleviation in current and future launch vehicles and spacecraft payloads.
• Identify a launch vehicle suitable for flight demonstration of the passive and active isolation systems.
• Build and fly vibration isolation systems and successfully downlink data showing their effectiveness.
• Establish viability of a passive isolation system based on the ShockRing™ design architecture that can be used directly as a component in future flights of a particular launch vehicle.
In support of the overall goal of risk reduction for future active isolation, the following specific goals were established:
• Fly an active system with at least one axis of active vibration isolation.
• Reduce vibration by a factor of two compared to levels achieved with the baseline passive system.
• Accomplish a co-design of the active system with underlying mechanical stiffness and damping properties.
• Package all necessary components of an active system in a self-contained unit, including actuators, sensors, power systems and control.
• Extrapolate from results to quantify size, weight, complexity, risk and cost of future systems. Most of these goals were met through a combination of ground tests and flight tests on two sounding rockets.
LAUNCH VEHICLE AND CONCEPTUAL DESIGN OF PASSIVE ISOLATION SYSTEM
Flight test demonstration of the new passive and active isolation concepts obviously required a launch vehicle. The Terrier Improved-Orion (TI-O) vehicle served as the platform for the two VALPE flight tests and strongly influenced the direction of the development Key TI-O specifications are summarized below, with emphasis on the information that impacted isolation system design, including the launch vibration environment.
Figure 1: Flight events in a Terrier-Improved Orion sounding rocket; right graph shows early part of flight

Smart Structures and Materials 2004: Industrial and Commercial Applications of Smart Structures Technologies, Paper 5388-05
4
The flight profile of a TI-O is shown in Figure 1. The TI-O is a two-stage rocket with the Orion motor having been modified to improve performance in the early 1990s. The first TI-O flew in 1994 and the VALPE flight 1 and flight 2 were the 39th and 40th launches. Total height of the payload section is 203 inches, with a 17-inch maximum diameter. As Figure 1 shows, there are several key points in the 6.5 minute flight of the rocket. The events prior to burnout are especially important in their effects on the launch environment. The TI-O offers a particularly rough ride, creating challenges for the demonstration of an active launch vibration isolation system.
Figure 2 Acceleration data from Terrier Lynx sounding rocket
Data was provided for the Terrier-Lynx and Terrier Improved-Orion rockets (TI-O). Plots of the three acceleration time histories for a Terrier-Lynx are shown in Figure 2. The largest acceleration values come during the first stage burn of the Terrier motor. The Terrier burnout after 5 seconds is apparent, as are the higher levels during second stage burn, and finally the reduced levels before final burnout. Note that vibration in the two lateral (x and y) axes is similar and that the z-axis or axial vibration is largest. These levels were used in the development of a vibration isolation system.
Figure 3: Concept for vibration isolation experiment
A schematic view of the vibration isolation system concept is shown in Figure 3. Based upon the available volume for the flight experiment, and with a bias towards a design based on a ShockRing™, initial design guidelines were set for a 60 lbm (27.3 kg) payload, an isolator bolt circle diameter of 11.5 inches, an axial bounce mode at 80-100 Hz, and lateral modes at 70-90 Hz. The 60-lb payload could represent a component on a satellite, or a complete small satellite.

Smart Structures and Materials 2004: Industrial and Commercial Applications of Smart Structures Technologies, Paper 5388-05
5
Peak accelerations from the flight data were 22 g lateral and 69 g axial. Design load factors were obtained using the shock response spectra (SRS) of the flight data. The SRS represents the peak dynamic responses of second order systems at all frequencies subjected to the acceleration time history as a base input. Damping of 8% critical was used to calculate the axial SRS, slightly conservative compared to the design goal of 10% critical, and 6% damping was used to calculate the lateral SRS. Final load factors for design were 36.9 g axial and 15.1 g lateral.
CONCEPT FOR ACTIVE SYSTEM AND EXPERIMENT GUIDELINES
The concept development for the active system planned for the second flight centered on definition of the physical layout and quantification of force requirements. Since one of the principal benefits of active vibration isolation is the ability to control properties separately in different axes, options for multi-axis control were considered first. Initial ideas addressed the possibility of a payload with three actuators acting in parallel with the lateral/axial passive isolation. It was determined that the limited available volume would not allow three actuators of sufficient size to be integrated within the rocket shroud under the payload. An alternative multi-axis concept, in which the axial and one or both lateral axes would be controlled, was also considered. But the high loading during the much of the powered flight, and the physical volume available, led to the first major conclusion for the active system:
Experiment Guideline 1: The active isolation system will operate only in the axial direction.
Another consideration was the type of actuation. Table 1 summarizes the assessment, where the different methods are ranked from 1 (best) to 5 (worst).
Table 1: Comparison of actuation types considered for active isolation system
Type Control Bandwidth Mass Volume Rugged Power Manuf. Avg. Electromagnetic 1 3 3 2 2 1 1 1.9 Hydraulic 5 4 5 5 1 5 5 4.3 Magnetostrictive 4 2 3 3 4 2 3 3.0 Piezoelectric 2 1 2 1 5 3 3 2.4 Pneumatic 3 4 1 4 3 4 2 3.0
Based on this semi-heuristic assessment, and evaluating important non-technical metrics such as overall development risk, schedule and cost, the following conclusion was made:
Experiment Guideline 2: Electromagnetic actuation is preferred.
Voice coilforce
generator
Passiveisolator
Payloadacceleration
Base deckaccelerat ion
Controlsystem
Voice coilforce
generator
Passiveisolator
Payloadaccelerat ion
Base deckacceleration
Co ntrolsystem
Proofmass
PARALLEL ACTUATION REACTION MASS ACTUATION (RMA)
Figure 4: Two actuation architectures considered in the concept design; parallel actuation was used

Smart Structures and Materials 2004: Industrial and Commercial Applications of Smart Structures Technologies, Paper 5388-05
6
Several alternate architectures were explored within the context of electromagnetic actuation. In general, the concepts considered a compliant passive isolation system based on a ShockRing.™ The most viable actuator options were of two types: a soft actuator with no explicit mechanical stiffness to be integrated in parallel with the passive isolator, or a reaction mass actuator (RMA) connected to the isolated payload or possibly the base (Figure 4).
The parallel approach is capable of static control of the payload, although this feature would not likely be used in the experiment. The RMA approach might require additional mass, but if the output force requirement is over a narrow range, then the added mass could be small. Matlab models using flight vibration data were employed to explore tradeoffs between the two concepts. A conclusion was made based on simulation results and packaging considerations:
Experiment Guideline 3: The electromagnetic actuation should be a soft system in parallel with the passive isolator.
Forc
e to
ach
ieve
dam
ping
(N)
Estimated actuator peak output
For
ce to
ach
ieve
zet
a =
0.2
(N)
Figure 5: Peak and rms force requirements to increase modal damping from 0.1 to higher level (left) and initial assessment of force output required during powered flight to achieve increase in damping ratio from 0.1 to 0.2 (right)
The simulations considered several control methods, with an eye towards the force requirements given the available base vibration inputs and the properties of the passive isolation system. Assuming a passive axial isolation frequency of 80 Hz, and axial mode damping ratio of 0.1, it was possible to compute the actuator force requirement to increase damping. As Figure 5 shows, there is a large ratio between the peak force required over the 40-second flight, and the rms over the flight duration. An initial conservative estimate of the force output of an electromagnetic actuator of a size compatible with the volume available is shown with dashed lines. These initial assessments were later modified based on Flight 1 data, bringing the expectation of greater performance from the active system. The simulation results also led to the final three guidelines.
Experiment Guideline 4: The control system will act to damp the axial suspension mode resonant response, and soften the axial support if possible, while also leaving higher frequency passive isolation performance largely unchanged.
Experiment Guideline 5: The force requirements for an active system could be reduced, by using a softer passive system, and 80 Hz was set as the maximum feasible bounce frequency.
Experiment Guideline 6: The possibility that the actuator would saturate during some small portion of the flight must be admitted to save mass and volume and force capacity for the majority of the flight.
For flight 1, these guidelines influenced sizing of mass simulators for the actuator, controller, electronic subsystems and batteries. After flight 1, with new vibration data and time for further consideration, the active system design evolved, as described in the section on flight 2.
FLIGHT 1: PASSIVE ISOLATION
Finite element models of the payload and isolator were developed and exercised. The initial sizing of a ShockRing™ and isolator interface plates, was done with a satellite emulator (Figure 6). With pressure to reduce the force

Smart Structures and Materials 2004: Industrial and Commercial Applications of Smart Structures Technologies, Paper 5388-05
7
requirements for flight 2, the design was modified to reduce isolation system stiffness, bringing the axial bounce mode frequency below 80 Hz. Several configurations of viscoelastic materials (VEMs) were analyzed to find the best combination of stiffness and damping. Secondary modes were at significantly higher frequencies.
Figure 6 ShockRing™ concept for axial isolation (left) and finite element model of the payload (right)
The baseline ring isolator as seen in Figure 6 had bolt circle diameter of 11.5 inches, outside diameter of 12.47 inches, height of 2.09 inches, and a mass of 5.0 lbm. Predicted modal damping was 14.8%, 14.8% and 13% for the two rocking and bounce modes. Maximum strain in the viscoelastic was estimated to be 0.58, and RMS strain in the VEM was predicted to be maximum in the y direction, at 5.2%. Lateral (x and y) stroke was predicted to be 7 mils.
Figure 7: VALPE flight 1 system on fixture stand with ShockRing™ isolator
The completed flight 1 (F1) experiment assembly, is shown in Figure 7. The stiff experiment base plate ties into the aft transition section skin. The interface for the fairing is a clamp band at the front end of the vehicle aft transition skin.
The experiment included 11 accelerometers, seven on the base, and four on the payload, and four rate sensors. The 16-channel Trig-Tek 216A was used as signal conditioning for the accelerometers. The F1 mass simulators were designed to be replaced in F2 by the electromagnetic actuator mounted concentrically between aluminum interface flanges. A center slug of aluminum simulated the mass loading of the battery, amplifier and control electronics. The “avionics isolators” units were ultimately removed for flight when additional testing showed rigid mounting would be acceptable. The power requirements of F1 were small, with the conditioning electronics using only 0.55 A of the 1.5 A budget.

Smart Structures and Materials 2004: Industrial and Commercial Applications of Smart Structures Technologies, Paper 5388-05
8
Figure 8: Integration to aft transition section and further integration of vehicle experiment section
A pneumatic shock test system was used to test one version of the F1 isolator. Accelerations are measured on both the “base” and the “payload” steel block. Another series of tests determined the workmanship of the sensor conditioning units under vibration conditions traceable to the flight vibration environment. The test articles underwent both swept sine and random vibration acceptance tests. After integration (Figure 8), flight qualification testing took place at NASA Wallops Flight Facility. The tests included sine and random inputs and lateral direction swept sine tests of 7 g RMS between 35 and 105 Hz.
Figure 9: Qualification test data show accelerometers (left) and rate sensors (right) above and below isolation system
The measured levels below and above the isolation system (Figure 9) showed a significant reduction in the overall levels and proved basic effectiveness of the isolation. However, after the lateral qualification runs, the data had severe dropouts at high vibration levels. The dropouts were attributed to possible damage from failure of the isolation system that held the Trig-Tek conditioning unit. With other constraints on the flight, the mission proceeded.

Smart Structures and Materials 2004: Industrial and Commercial Applications of Smart Structures Technologies, Paper 5388-05
9
Figure 10 Flight data showing isolation performance (Red-base, Blue-isolated)
The November 2002 flight data included significant dropouts at high amplitudes (Figure 10) below and above the passive isolation system, but the system clearly performed as intended. The data also clearly showed that the flight loads were lower than anticipated and not on the same level as the loads experienced during qualification.
Despite the dropouts, large amounts of data were returned and provided performance information on the ShockRing™ system. For flight 2 it was important to remove such data anomalies and “zoom in” the full-scale ranges of the sensors to validate the performance of the system. Based on the development process and the flight, the following conclusions were made:
• The axial and lateral isolation was effective, with an axial bounce frequency of approximately 65 Hz. • This design architecture appears to be a viable candidate for the Terrier vehicles. • Improvements in reliability and elimination of dropouts would be required before flight 2. • The actual vibration levels measured at the base deck were lower than the predicted levels. This suggested that
the active system performance might be increased compared to the predictions from the concept designs.
FLIGHT 2: ACTIVE ISOLATION
This section describes the VALPE Flight 2 (F2) system design, development, test, integration and flight. System mass was roughly constant, as aluminum mass simulators were replaced with circuit boards, magnets, wires, and cables.
PayloadAccelerom eter
Actuator
+14 Volts
-14 Volts0 Volts
Amp
AmpCoil 1
Coil 2
+14V 0V -14V
Battery
DSP
Sig/Cond
Accel
DAC
+5V
TM_CMD
R/S
TM_STATUS
TM_ACC
EndevcoS/C
Analog Out
Analog Out
Enable
Enable
+28V
Figure 11: Basic layout of the flight 2 active system
Design No major modifications were made to the ShockRing™ passive isolation system. Active components fit easily within the allotted volume. Flight 1 payload mass was 25.7 kg and flight 2 mass was 25.1 kg, both close to the 27.3 kg (60.0 lbm) using in initial concept models. The purpose of the active vibration control system was to add damping to the primary bounce mode introduced by the compliance of the shock ring. The system performed this vibration reduction

Smart Structures and Materials 2004: Industrial and Commercial Applications of Smart Structures Technologies, Paper 5388-05
10
by measuring the acceleration of the payload with an accelerometer and providing a control force through an electromagnetic actuator. The active system included the major components shown in Figure 7.
The basic design approach was reviewed in light of data from flight 1 and additional understanding of actuator, amplifier and battery capability. The F1 data showed vibration levels significantly lower than those from earlier flights. The F2 goal remained active damping, with the assumption that the passive system alone would produce a dynamic amplification, Q, in the axial suspension mode of 5 (ζ = 10%). This assumption was based on available flight data combined with expectations for some eddy current damping from the actuator itself.
Figure 12 Peak and rms force requirements (solid lines) and actuator capability (dashed lines) to increase modal damping in the bounce mode from 0.1 to higher level
Figure 12 summarizes the design predictions in a form similar to that used for F1, with lower vibration levels resulting in reduced force requirements compared to those of Figure 5. The new models indicated that the same force levels would produce greater damping. Given new information on the actuator volume and geometry, the force capability (peak or rms) of the physical actuator could be determined. These constant values are plotted as horizontal lines. The required force needed (again, peak or rms) is plotted with solid lines. Considering the more demanding case where peak force requirements are determining, the models predict the damping ratio can be doubled to 20% (Q decreased from 5 to 2.5) with no saturation. Since the peak response occurs over only a small portion of the flight, the actual damping ratio, averaged over the flight, could certainly be increased further.
The important information from the simulations was that active damping was feasible with full flight loads, making relatively conservative assumptions. The following section describes actuator, controller and power system developments. The design of these subsystems remained relatively conservative, with an emphasis on risk reduction.
Major Subsystems and Control A 2-D magnetic model of the axisymmetric actuator was developed. At less than 0.2 T, the flux density was quite low for actuators of this type. This is due primarily to the large gap between the magnets and the coil that is driven by payload rocking under high loads. The actuator is in parallel with the passive isolator and depends on that isolator to maintain the gap. The coil design and the power amplifier design were closely coupled. Considerable effort was spent in evaluating amplifier heating and supply rail voltage. The final actuator used two coils, keeping the current under 15 Amps and the inductance was minimized to keep the voltage required under the 28 volt limit of the batteries. .
Using laboratory amplifiers, the actuator was driven with a random input and the ShockRing™ on a fixed base, with a payload simulator, and the transfer function from amplifier command to payload acceleration was measured. The data highlighted the isolation system response at 60-65 Hz, with a damping of about 15% of critical.
Smart Structures and Materials 2004: Industrial and Commercial Applications of Smart Structures Technologies, Paper 5388-05
11
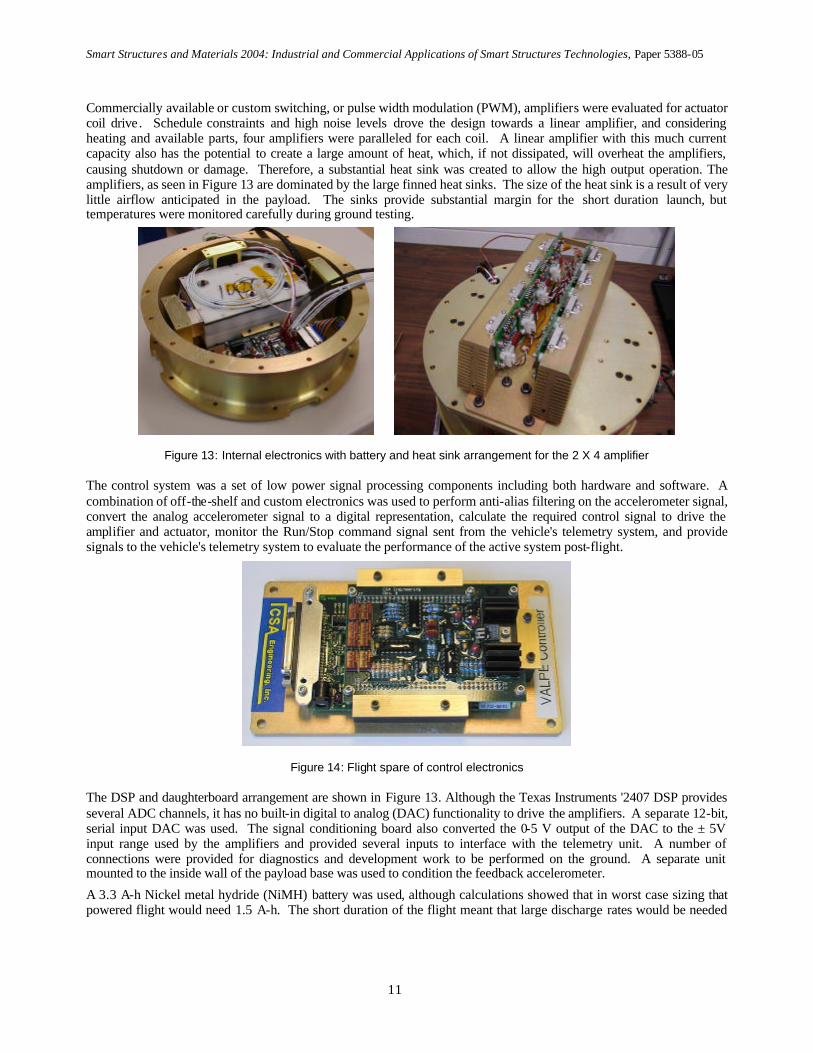
Commercially available or custom switching, or pulse width modulation (PWM), amplifiers were evaluated for actuator coil drive. Schedule constraints and high noise levels drove the design towards a linear amplifier, and considering heating and available parts, four amplifiers were paralleled for each coil. A linear amplifier with this much current capacity also has the potential to create a large amount of heat, which, if not dissipated, will overheat the amplifiers, causing shutdown or damage. Therefore, a substantial heat sink was created to allow the high output operation. The amplifiers, as seen in Figure 13 are dominated by the large finned heat sinks. The size of the heat sink is a result of very little airflow anticipated in the payload. The sinks provide substantial margin for the short duration launch, but temperatures were monitored carefully during ground testing.
Figure 13: Internal electronics with battery and heat sink arrangement for the 2 X 4 amplifier
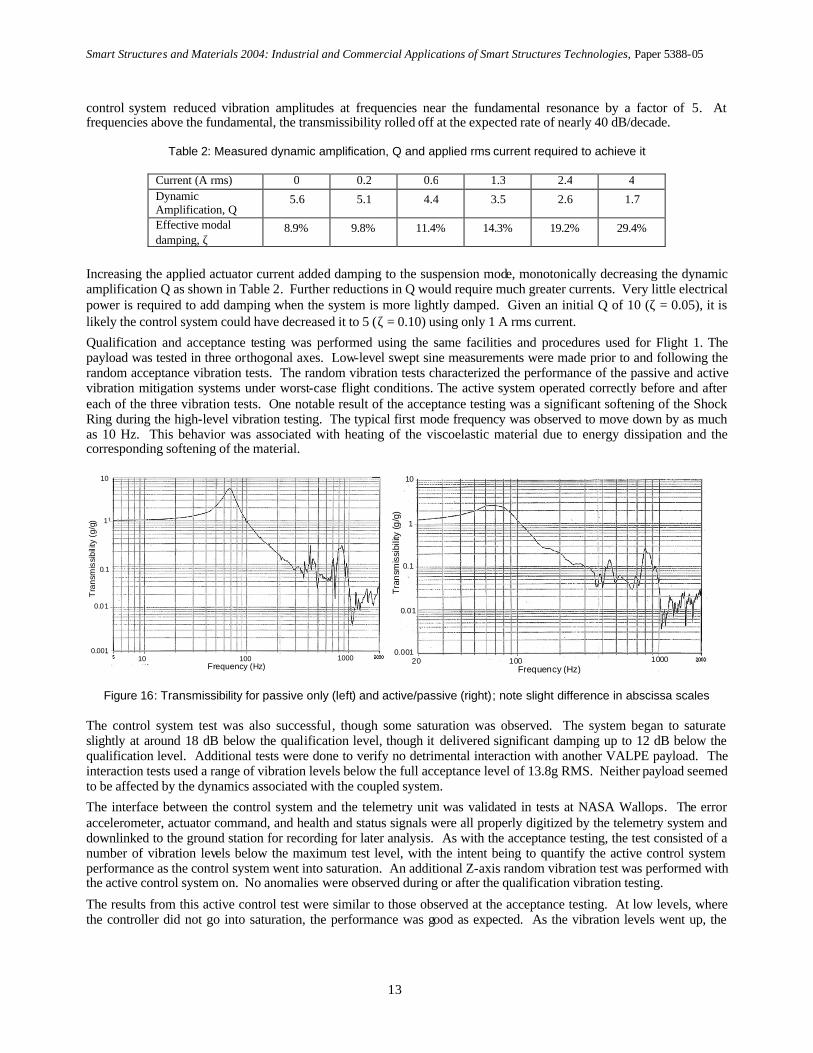
The control system was a set of low power signal processing components including both hardware and software. A combination of off-the-shelf and custom electronics was used to perform anti-alias filtering on the accelerometer signal, convert the analog accelerometer signal to a digital representation, calculate the required control signal to drive the amplifier and actuator, monitor the Run/Stop command signal sent from the vehicle's telemetry system, and provide signals to the vehicle's telemetry system to evaluate the performance of the active system post-flight.
Figure 14: Flight spare of control electronics
The DSP and daughterboard arrangement are shown in Figure 13. Although the Texas Instruments '2407 DSP provides several ADC channels, it has no built-in digital to analog (DAC) functionality to drive the amplifiers. A separate 12-bit, serial input DAC was used. The signal conditioning board also converted the 0-5 V output of the DAC to the ± 5V input range used by the amplifiers and provided several inputs to interface with the telemetry unit. A number of connections were provided for diagnostics and development work to be performed on the ground. A separate unit mounted to the inside wall of the payload base was used to condition the feedback accelerometer.
A 3.3 A-h Nickel metal hydride (NiMH) battery was used, although calculations showed that in worst case sizing that powered flight would need 1.5 A-h. The short duration of the flight meant that large discharge rates would be needed

Smart Structures and Materials 2004: Industrial and Commercial Applications of Smart Structures Technologies, Paper 5388-05
12
(~30 A). Special requirements included the ability to test the system numerous times and then re-charge quickly during ground testing. Cost was also a driver. Despite a lower energy density than Lithium Ion, the fast charge capability, and durability of the NiMH made it the superior choice. The pack consists of 24 GP330 NiMH cells wired in series and held in a frame. The flight batteries were a little different in that they were center tapped to produce ±14 V poles.
The actual feedback control algorithm is relatively simple. Implementation of the algorithm was more difficult, and the design included several tradeoffs. First and foremost, there is a tradeoff between performance and actuator requirements. The higher the current requested from the amplifier, the better the performance can be. However, the actuator has a finite range, and asking for more current than the amplifier and actuator can provide causes clipping and in the worst case can cause a net increase in vibration. Furthermore, high current requirements could cause the battery to discharge before the end of the flight.
The plant transfer function was measured using the flight accelerometer, amplifier, and DSP; the DSP was programmed to pass through the command on its auxiliary analog input to the amplifier and the resulting acceleration was recorded. As expected, the primary feature of the plant dynamics was the fundamental bounce mode near 70 Hz.
Classical control design techniques were employed, and the resulting controller was quite simple: a second-order compensator with a peak at around 30 Hz. With a controller of this form, the designer has two parameters to work with: the frequency of the peak and the overall gain. Increasing the peak frequency makes the controller less susceptible to saturation during the major shock events at launch and stage separation. However, it reduces stability around the frequency of the primary mode. Likewise, increasing the overall gain increases the system performance but reduces stability margins. The combination of the 30 Hz peak and the overall gain was arrived at through predictions of the response of the system to the data recorded from Flight 1 as well as a number of ground tests (Figure 15).
Figure 15: Active control system compensator and performance for test input
The implemented active controller added significant damping to the fundamental mode, as shown in Figure 15. The primary bounce mode is no longer recognizable because of the high damping. With large phase margins at the two crossover frequencies, the system stability robustness is excellent, even through possible saturation events.
Testing The experiment was tested by using a hydraulic shaker to drive the base of the experiment, and the response of the error accelerometer was measured. As the electronics and software developed, these tests were repeated with configurations increasingly close to the final flight configuration. The flight amplifier, accelerometer, signal conditioning, and DSP were all tested individually and in the system as a whole. The DSP was programmed to have a mode where it sampled the signal on its auxiliary analog input and summed that signal immediately before delivering it to the actuator.
The transmissibility of the combined active and passive system was measured, both with control off and with control on. The controller was able to add a significant amount of damping to the fundamental mode. At low amplitudes, the
Smart Structures and Materials 2004: Industrial and Commercial Applications of Smart Structures Technologies, Paper 5388-05
13
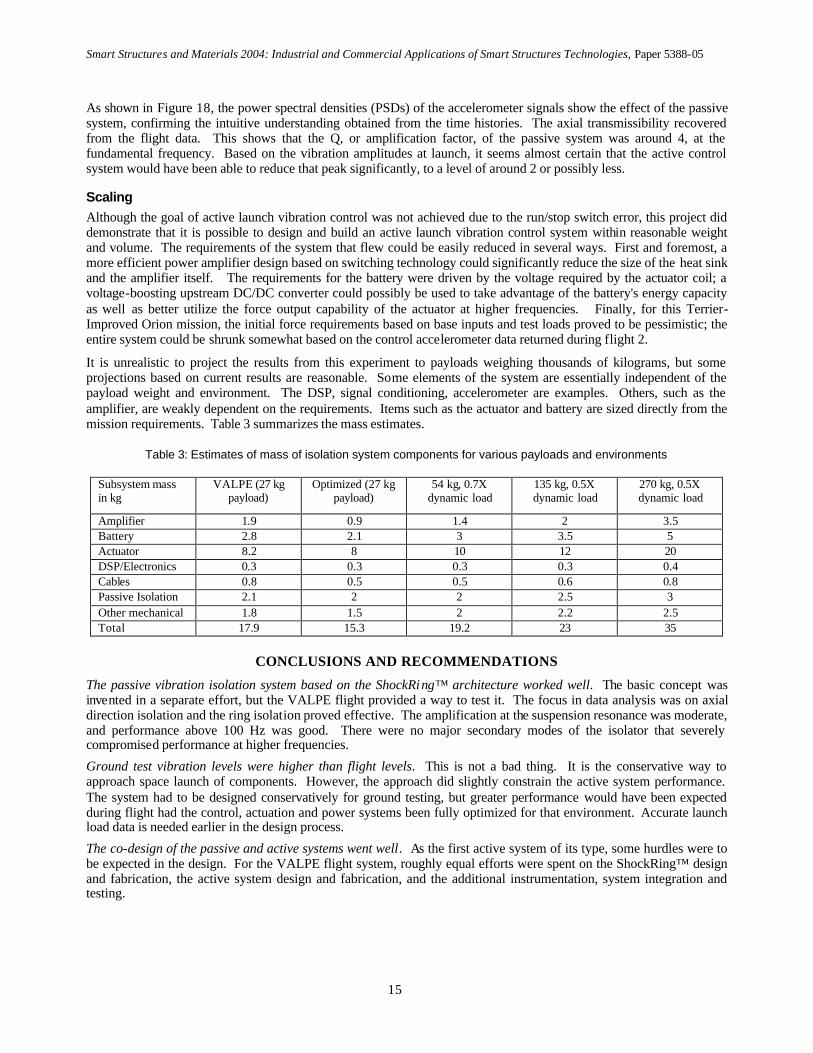
control system reduced vibration amplitudes at frequencies near the fundamental resonance by a factor of 5. At frequencies above the fundamental, the transmissibility rolled off at the expected rate of nearly 40 dB/decade.
Table 2: Measured dynamic amplification, Q and applied rms current required to achieve it
Current (A rms) 0 0.2 0.6 1.3 2.4 4 Dynamic Amplification, Q
5.6 5.1 4.4 3.5 2.6 1.7
Effective modal damping, ζ
8.9% 9.8% 11.4% 14.3% 19.2% 29.4%
Increasing the applied actuator current added damping to the suspension mode, monotonically decreasing the dynamic amplification Q as shown in Table 2. Further reductions in Q would require much greater currents. Very little electrical power is required to add damping when the system is more lightly damped. Given an initial Q of 10 (ζ = 0.05), it is likely the control system could have decreased it to 5 (ζ = 0.10) using only 1 A rms current.
Qualification and acceptance testing was performed using the same facilities and procedures used for Flight 1. The payload was tested in three orthogonal axes. Low-level swept sine measurements were made prior to and following the random acceptance vibration tests. The random vibration tests characterized the performance of the passive and active vibration mitigation systems under worst-case flight conditions. The active system operated correctly before and after each of the three vibration tests. One notable result of the acceptance testing was a significant softening of the Shock Ring during the high-level vibration testing. The typical first mode frequency was observed to move down by as much as 10 Hz. This behavior was associated with heating of the viscoelastic material due to energy dissipation and the corresponding softening of the material.
Frequency (Hz) 10 100 1000
10
1
0.1
0.01
0.001
Tra
nsm
issi
bilit
y (g
/g)
Frequency (Hz) 100 20 1000
10
1
0.1
0.01
Tra
nsm
issi
bilit
y (g
/g)
0.001
Figure 16: Transmissibility for passive only (left) and active/passive (right); note slight difference in abscissa scales
The control system test was also successful, though some saturation was observed. The system began to saturate slightly at around 18 dB below the qualification level, though it delivered significant damping up to 12 dB below the qualification level. Additional tests were done to verify no detrimental interaction with another VALPE payload. The interaction tests used a range of vibration levels below the full acceptance level of 13.8g RMS. Neither payload seemed to be affected by the dynamics associated with the coupled system.
The interface between the control system and the telemetry unit was validated in tests at NASA Wallops. The error accelerometer, actuator command, and health and status signals were all properly digitized by the telemetry system and downlinked to the ground station for recording for later analysis. As with the acceptance testing, the test consisted of a number of vibration levels below the maximum test level, with the intent being to quantify the active control system performance as the control system went into saturation. An additional Z-axis random vibration test was performed with the active control system on. No anomalies were observed during or after the qualification vibration testing.
The results from this active control test were similar to those observed at the acceptance testing. At low levels, where the controller did not go into saturation, the performance was good as expected. As the vibration levels went up, the

Smart Structures and Materials 2004: Industrial and Commercial Applications of Smart Structures Technologies, Paper 5388-05
14
controller was able to provide some performance, but was hampered by its available force capacity. However, the comparisons of the qualification levels with the real flight data from the previous flight showed that the active system should be effective throughout much, if not all, of the flight.
Once the payload was integrated to the motors, and moved to the launch site, it was attached to the launch rail in went through final testing and was launched. After the launch, the ground crew met for a post flight meeting to go over the flight. All indications were that the mission went well, and that data on all channels was good. However, on further inspection, the active system Run/Stop relay was observed to have been 0V, or off, for the duration of the flight. At 30 seconds prior to launch that relay was to have been switched to ‘on’ by ground personnel (thus showing a 5 volt signal) and the active system would have been activated. Unfortunately it was not turned on at that instant or after. To protect against such instances, a lanyard back up that will enable all relays when the rocket leaves the rail is typically used. However, this was not used on this channel, and the active system was never turned ‘on’. The solution to such a situation in the future is to not rely on the ground personnel for the system start-up. After power-up, the active system can enable itself at a predetermined time.
Figure 17 Axial (left) and lateral (right) acceleration of the base (red) and of the isolated payload (blue)
All indications show that the DSP, amplifiers, feedback sensor, and batteries held the null state without any failures for the duration of the flight. Additionally the ShockRing™ performance recovered for the flight was excellent. Figure 17 shows the axial accelerations above and below the isolation system. As expected, the shock ring significantly attenuates the high-frequency disturbance experienced by the payload.
101
102
10310
-4
10-3
10-2
10-1
100
101
102
Frequency, Hz
Acc
eler
atio
n sp
ectr
um,
g2 /Hz
Axial acceleration PSD
Base accelerationPayload acceleration
Figure 18: Acceleration spectra and transmissibility from flight 2 showing isolation effectiveness
Smart Structures and Materials 2004: Industrial and Commercial Applications of Smart Structures Technologies, Paper 5388-05
15
As shown in Figure 18, the power spectral densities (PSDs) of the accelerometer signals show the effect of the passive system, confirming the intuitive understanding obtained from the time histories. The axial transmissibility recovered from the flight data. This shows that the Q, or amplification factor, of the passive system was around 4, at the fundamental frequency. Based on the vibration amplitudes at launch, it seems almost certain that the active control system would have been able to reduce that peak significantly, to a level of around 2 or possibly less.
Scaling Although the goal of active launch vibration control was not achieved due to the run/stop switch error, this project did demonstrate that it is possible to design and build an active launch vibration control system within reasonable weight and volume. The requirements of the system that flew could be easily reduced in several ways. First and foremost, a more efficient power amplifier design based on switching technology could significantly reduce the size of the heat sink and the amplifier itself. The requirements for the battery were driven by the voltage required by the actuator coil; a voltage-boosting upstream DC/DC converter could possibly be used to take advantage of the battery's energy capacity as well as better utilize the force output capability of the actuator at higher frequencies. Finally, for this Terrier-Improved Orion mission, the initial force requirements based on base inputs and test loads proved to be pessimistic; the entire system could be shrunk somewhat based on the control accelerometer data returned during flight 2.
It is unrealistic to project the results from this experiment to payloads weighing thousands of kilograms, but some projections based on current results are reasonable. Some elements of the system are essentially independent of the payload weight and environment. The DSP, signal conditioning, accelerometer are examples. Others, such as the amplifier, are weakly dependent on the requirements. Items such as the actuator and battery are sized directly from the mission requirements. Table 3 summarizes the mass estimates.
Table 3: Estimates of mass of isolation system components for various payloads and environments
Subsystem mass in kg
VALPE (27 kg payload)
Optimized (27 kg payload)
54 kg, 0.7X dynamic load
135 kg, 0.5X dynamic load
270 kg, 0.5X dynamic load
Amplifier 1.9 0.9 1.4 2 3.5 Battery 2.8 2.1 3 3.5 5 Actuator 8.2 8 10 12 20 DSP/Electronics 0.3 0.3 0.3 0.3 0.4 Cables 0.8 0.5 0.5 0.6 0.8 Passive Isolation 2.1 2 2 2.5 3 Other mechanical 1.8 1.5 2 2.2 2.5 Total 17.9 15.3 19.2 23 35
CONCLUSIONS AND RECOMMENDATIONS
The passive vibration isolation system based on the ShockRing™ architecture worked well. The basic concept was invented in a separate effort, but the VALPE flight provided a way to test it. The focus in data analysis was on axial direction isolation and the ring isolation proved effective. The amplification at the suspension resonance was moderate, and performance above 100 Hz was good. There were no major secondary modes of the isolator that severely compromised performance at higher frequencies.
Ground test vibration levels were higher than flight levels. This is not a bad thing. It is the conservative way to approach space launch of components. However, the approach did slightly constrain the active system performance. The system had to be designed conservatively for ground testing, but greater performance would have been expected during flight had the control, actuation and power systems been fully optimized for that environment. Accurate launch load data is needed earlier in the design process.
The co-design of the passive and active systems went well. As the first active system of its type, some hurdles were to be expected in the design. For the VALPE flight system, roughly equal efforts were spent on the ShockRing™ design and fabrication, the active system design and fabrication, and the additional instrumentation, system integration and testing.

Smart Structures and Materials 2004: Industrial and Commercial Applications of Smart Structures Technologies, Paper 5388-05
16
Electromagnetic actuation can be viable for launch load alleviation. There is continuing concern that electromagnetic actuation is heavy, but it compares favorably with several alternatives. The actuator designed for VALPE was rugged and relatively efficient. There will be an ongoing trade between ability to handle launch loads and efficiency of electromagnetic circuits, particularly in the area of air gap specification within the actuators.
The electronic subsystems directly supporting the isolation system worked well. In general, the design and implementation of the control electronics was quite successful. The overall architecture and implementation worked well and was capable of meeting mission requirements. The batteries were effective, the amplifier was well matched to the load and the short duration flight, and the control system performed its task as required. Packaging size was quite reasonable for a first flight.
The procedure for the initiation of the flight experiment was inadequate. This conclusion is an obvious one. The active system, expected based on ground test to work well, was not initiated in the pre-launch sequence. Several factors may have been involved, including the multiple steps required for the different experiments. Because integration of other experiments extended to a time closer to the launch than was anticipated, there was not adequate time to review the initiation procedure.
Steps should be taken to minimize weight and increase reliability of active launch load alleviation systems . Weight reductions could be achieved by better understanding the launch environment, use of even more efficient batteries, switching amplifiers, and short duration overdriving of the actuator. Reliability and fail safety of active systems will always be a concern. An effort to address reliability by design and ground testing would reduce risk in future systems.
A three-axis active system should be considered for the next flight test. The one-axis axial isolation worked well in ground testing. A re-flight of the system would be expected to produce good results during flight. However, a major benefit of active vibration isolation is the ability to selectively soften or stiffen in different axes. Test and flight of an active system that is soft axially and stiffer in the two rocking modes (tip and tilt) would be valuable.
Semi-active isolation systems should be considered. The VALPE system is fully active in that it uses actuators and sensors to control vibrations in real time. A semi-active or adaptive-passive system could potentially achieve similar performance, but also have greater fail safety. An active system that only adjusts passive properties may also be lighter weight and probably would be more reliable.
ACKNOWLEDGEMENTS
The paper describes research performed under contract F29601-98-C-0044, administered by the Air Force Research Laboratory. The authors also thank Keith Denoyer, Emily Fowler, Jim Goodding, and Paul Wilke.
REFERENCES
1. C.D. Johnson and P.S. Wilke, “The Whole-Spacecraft Vibration Isolation System: Its Time Has Come,” AIAA Space Technology Conference, Albuquerque, NM, Sept. 1999.
2. P. S. Wilke, C. D. Johnson and S. C. Pendleton, Passive, Multi-Axis Highly Damped Shock Isolation Mounts for Spacecraft, US Patent 6202961.
3. Gerhart, C., Henderson, K., Griffin, S., Lazzaro, A., Evert, M. and McCrary, W. “Vibro-acoustic launch protection experiment overview and flight results summary,” Smart Structure and Materials 2004: Industrial and Commercial Applications of Smart Structures Technologies, SPIE Paper 5388-05, Eric H. Anderson, ed.
4. L.A. Sullivan, R. S. Erwin and K. K. Denoyer, “Experiences with smart structures for on-orbit vibration isolation, Proc. SPIE Vol. 3991, pp. 122-130, Smart Structure and Materials 2000: Industrial and Commercial Applications of Smart Structures Technologies, Jack H. Jacobs, ed.
5. D. L. Edberg, C. D. Johnson, L. P. Davis and E. R. Fosness, “Development of a launch vibration isolation system,” SPIE Paper 3045-08, p. 31-37, Smart Structures and Materials 1997: Passive Damping and Isolation; L. Porter Davis; Ed.