Active Share: A Misunderstood Measure in Manager · PDF filegauge of active management...
12
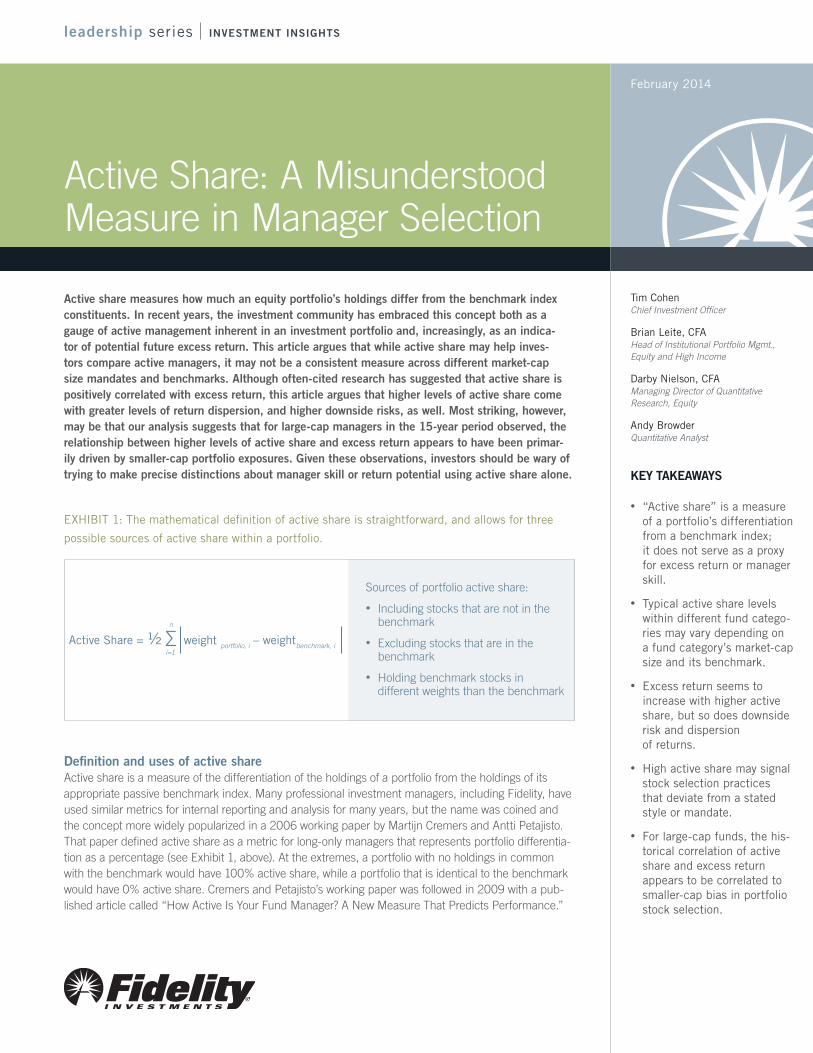
leadership series Active share measures how much an equity portfolio’s holdings differ from the benchmark index constituents. In recent years, the investment community has embraced this concept both as a gauge of active management inherent in an investment portfolio and, increasingly, as an indica- tor of potential future excess return. This article argues that while active share may help inves- tors compare active managers, it may not be a consistent measure across different market-cap size mandates and benchmarks. Although often-cited research has suggested that active share is positively correlated with excess return, this article argues that higher levels of active share come with greater levels of return dispersion, and higher downside risks, as well. Most striking, however, may be that our analysis suggests that for large-cap managers in the 15-year period observed, the relationship between higher levels of active share and excess return appears to have been primar- ily driven by smaller-cap portfolio exposures. Given these observations, investors should be wary of trying to make precise distinctions about manager skill or return potential using active share alone. Definition and uses of active share Active share is a measure of the differentiation of the holdings of a portfolio from the holdings of its appropriate passive benchmark index. Many professional investment managers, including Fidelity, have used similar metrics for internal reporting and analysis for many years, but the name was coined and the concept more widely popularized in a 2006 working paper by Martijn Cremers and Antti Petajisto. That paper defined active share as a metric for long-only managers that represents portfolio differentia- tion as a percentage (see Exhibit 1, above). At the extremes, a portfolio with no holdings in common with the benchmark would have 100% active share, while a portfolio that is identical to the benchmark would have 0% active share. Cremers and Petajisto’s working paper was followed in 2009 with a pub- lished article called “How Active Is Your Fund Manager? A New Measure That Predicts Performance.” Active Share: A Misunderstood Measure in Manager Selection February 2014 Tim Cohen Chief Investment Officer Brian Leite, CFA Head of Institutional Portfolio Mgmt., Equity and High Income Darby Nielson, CFA Managing Director of Quantitative Research, Equity Andy Browder Quantitative Analyst KEY TAKEAWAYS • “Active share” is a measure of a portfolio’s differentiation from a benchmark index; it does not serve as a proxy for excess return or manager skill. • Typical active share levels within different fund catego- ries may vary depending on a fund category’s market-cap size and its benchmark. • Excess return seems to increase with higher active share, but so does downside risk and dispersion of returns. • High active share may signal stock selection practices that deviate from a stated style or mandate. • For large-cap funds, the his- torical correlation of active share and excess return appears to be correlated to smaller-cap bias in portfolio stock selection. INVESTMENT INSIGHTS EXHIBIT 1: The mathematical definition of active share is straightforward, and allows for three possible sources of active share within a portfolio. Sources of portfolio active share: • Including stocks that are not in the benchmark • Excluding stocks that are in the benchmark • Holding benchmark stocks in different weights than the benchmark n i=1 Active Share = ½ ∑ weight portfolio, i – weight benchmark, i
Transcript of Active Share: A Misunderstood Measure in Manager · PDF filegauge of active management...
leadership series
Active share measures how much an equity portfolio’s holdings differ from the benchmark index constituents. In recent years, the investment community has embraced this concept both as a gauge of active management inherent in an investment portfolio and, increasingly, as an indica-tor of potential future excess return. This article argues that while active share may help inves-tors compare active managers, it may not be a consistent measure across different market-cap size mandates and benchmarks. Although often-cited research has suggested that active share is positively correlated with excess return, this article argues that higher levels of active share come with greater levels of return dispersion, and higher downside risks, as well. Most striking, however, may be that our analysis suggests that for large-cap managers in the 15-year period observed, the relationship between higher levels of active share and excess return appears to have been primar-ily driven by smaller-cap portfolio exposures. Given these observations, investors should be wary of trying to make precise distinctions about manager skill or return potential using active share alone.
Definition and uses of active share Active share is a measure of the differentiation of the holdings of a portfolio from the holdings of its appropriate passive benchmark index. Many professional investment managers, including Fidelity, have used similar metrics for internal reporting and analysis for many years, but the name was coined and the concept more widely popularized in a 2006 working paper by Martijn Cremers and Antti Petajisto. That paper defined active share as a metric for long-only managers that represents portfolio differentia-tion as a percentage (see Exhibit 1, above). At the extremes, a portfolio with no holdings in common with the benchmark would have 100% active share, while a portfolio that is identical to the benchmark would have 0% active share. Cremers and Petajisto’s working paper was followed in 2009 with a pub-lished article called “How Active Is Your Fund Manager? A New Measure That Predicts Performance.”
Active Share: A Misunderstood Measure in Manager Selection
February 2014
Tim CohenChief Investment Officer
Brian Leite, CFAHead of Institutional Portfolio Mgmt., Equity and High Income
Darby Nielson, CFAManaging Director of Quantitative Research, Equity
Andy BrowderQuantitative Analyst
KEY TAKEAWAYS
• “Active share” is a measure of a portfolio’s differentiation from a benchmark index; it does not serve as a proxy for excess return or manager skill.
• Typical active share levels within different fund catego-ries may vary depending on a fund category’s market-cap size and its benchmark.
• Excess return seems to increase with higher active share, but so does downside risk and dispersion of returns.
• High active share may signal stock selection practices that deviate from a stated style or mandate.
• For large-cap funds, the his-torical correlation of active share and excess return appears to be correlated to smaller-cap bias in portfolio stock selection.
INVESTMENT INSIGHTS
EXHIBIT 1: The mathematical definition of active share is straightforward, and allows for three
possible sources of active share within a portfolio.
Sources of portfolio active share:
• Including stocks that are not in the benchmark
• Excluding stocks that are in the benchmark
• Holding benchmark stocks in different weights than the benchmark
n
i=1
Active Share = ½ ∑ weight portfolio, i – weightbenchmark, i
2
Historically, the industry has used tracking error as the best measure of active risk in a portfolio. Tracking error quantifies the volatility of a portfolio’s relative returns (returns different from the benchmark’s). Cremers and Petajisto’s article argues that tracking error alone is not the best indicator of how actively managed a portfolio is in terms of “stock selection,” because “factor timing” (changing a portfolio’s exposures to systemic risk factors such as industries, sectors, or other criteria) can influ-ence tracking error as much as or more than a manager’s stock-selection practices. According to them, active share—which focuses on the composition of the portfolio itself and not on returns—can be used to get a better indication of a manager’s degree of active management.
Increasingly, institutional clients and consultants are using active share as a tool to help determine whether an equity strategy justifies active management fees. This approach makes intuitive sense, because active share can seemingly be compared with management fees to estimate exactly how much active manage-ment the fee obtains. If a portfolio is purported to be actively managed but has an extremely low active share, an investor may prefer to substitute a low-cost passive index fund instead of pay-ing for management that is not really active.
However, the converse assumption—that actively managed funds with very high levels of active share are a better value for inves-tors than actively managed funds with moderate levels of active share—is not necessarily true, and should be examined more thoroughly. In particular, the source of a portfolio’s active share should be an important consideration for investors, as we explain later in this article.
Part of the confusion stems from Cremers and Petajisto’s observa-tion of a positive historical correlation between higher active share and higher excess return (returns above those of the benchmark). Following the implications of that work, some investors and advi-sors have begun to use active share as an explicit proxy for a man-ager’s potential to generate excess return in the future. With that hypothesis has come the assumption that only managers with the highest levels of active share should be considered for the active portion of an investor’s equity allocation.
Later in this article, we argue that other measures of risk should be an important consideration alongside active share, and we call the correlation of active share and excess return into question, at least for large-cap portfolios. To support our argument empiri-cally, we studied data on quarterly returns, active share, bench-mark, and holdings for more than 2,000 U.S. funds, over the period from Dec. 1997 to Mar. 2013. Additionally, we segmented the data into large-cap and small-cap subsets to examine the effects of benchmark selection, and cleaned the data to eliminate index funds erroneously listed as active and funds evaluated by inappropriate benchmarks (see the methodology section below for more information).
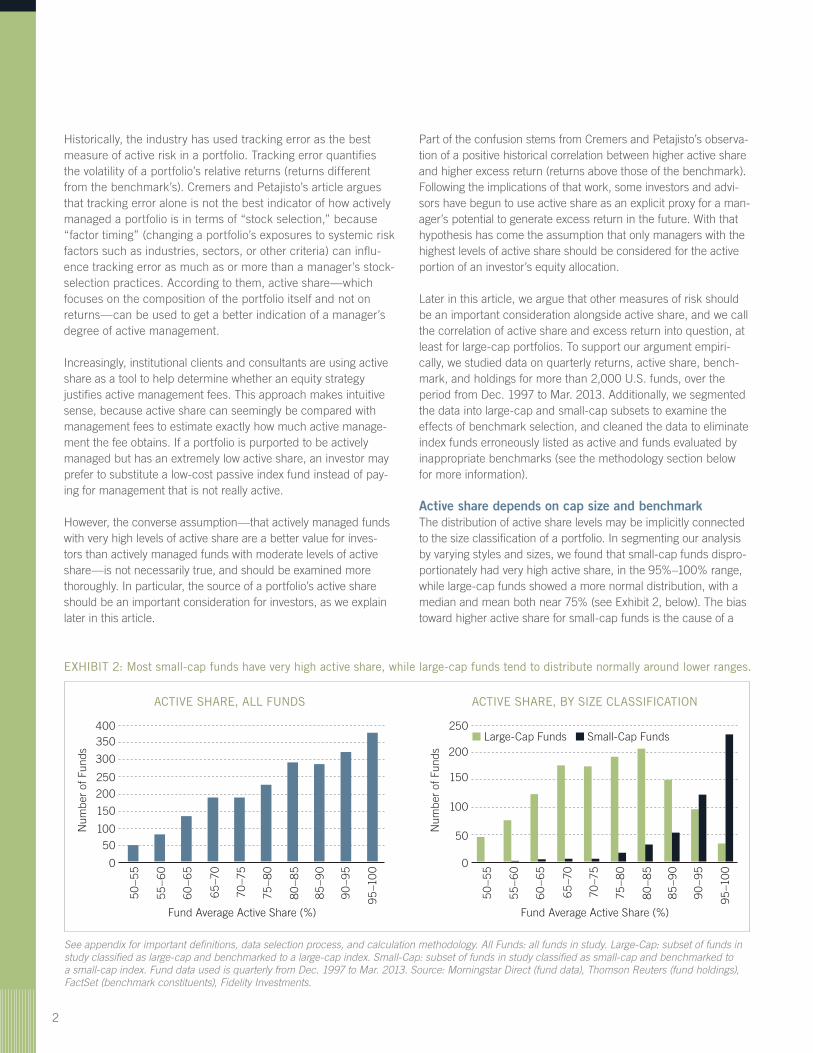
Active share depends on cap size and benchmarkThe distribution of active share levels may be implicitly connected to the size classification of a portfolio. In segmenting our analysis by varying styles and sizes, we found that small-cap funds dispro-portionately had very high active share, in the 95%–100% range, while large-cap funds showed a more normal distribution, with a median and mean both near 75% (see Exhibit 2, below). The bias toward higher active share for small-cap funds is the cause of a
ACTIVE SHARE, ALL FUNDS ACTIVE SHARE, BY SIZE CLASSIFICATION
EXHIBIT 2: Most small-cap funds have very high active share, while large-cap funds tend to distribute normally around lower ranges.
See appendix for important definitions, data selection process, and calculation methodology. All Funds: all funds in study. Large-Cap: subset of funds in study classified as large-cap and benchmarked to a large-cap index. Small-Cap: subset of funds in study classified as small-cap and benchmarked to a small-cap index. Fund data used is quarterly from Dec. 1997 to Mar. 2013. Source: Morningstar Direct (fund data), Thomson Reuters (fund holdings), FactSet (benchmark constituents), Fidelity Investments.
0
50
100
150
200
250
300
350400
Num
ber
of F
unds
50
–55
55–6
0
60
–65
65–7
0
70–7
5
75–8
0
80
–85
85
–90
90
–95
95–1
00
Fund Average Active Share (%)
0
50
100
150
200
250
Num
ber
of F
unds
50
–55
55–6
0
60
–65
65–7
0
70–7
5
75–8
0
80
–85
85
–90
90
–95
95–1
00
Fund Average Active Share (%)
Large-Cap Funds Small-Cap Funds
3
more moderate but observable skew when examining all funds in aggregate.
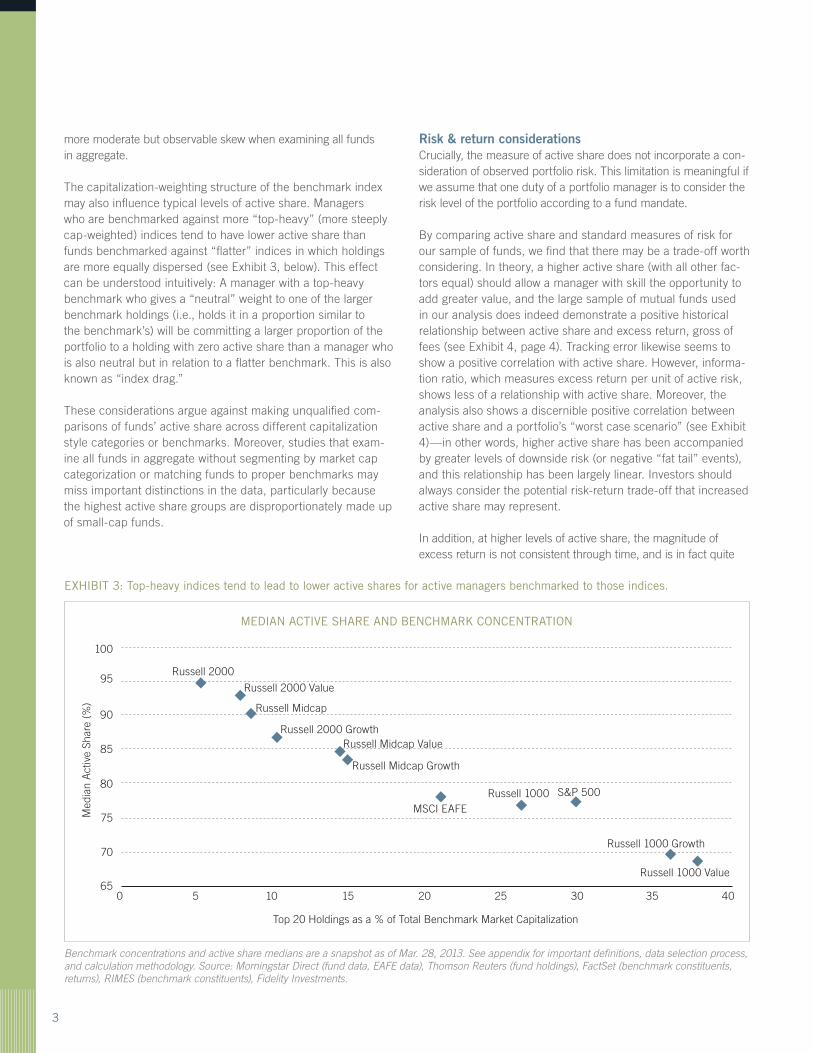
The capitalization-weighting structure of the benchmark index may also influence typical levels of active share. Managers who are benchmarked against more “top-heavy” (more steeply cap-weighted) indices tend to have lower active share than funds benchmarked against “flatter” indices in which holdings are more equally dispersed (see Exhibit 3, below). This effect can be understood intuitively: A manager with a top-heavy benchmark who gives a “neutral” weight to one of the larger benchmark holdings (i.e., holds it in a proportion similar to the benchmark’s) will be committing a larger proportion of the portfolio to a holding with zero active share than a manager who is also neutral but in relation to a flatter benchmark. This is also known as “index drag.”
These considerations argue against making unqualified com-parisons of funds’ active share across different capitalization style categories or benchmarks. Moreover, studies that exam-ine all funds in aggregate without segmenting by market cap categorization or matching funds to proper benchmarks may miss important distinctions in the data, particularly because the highest active share groups are disproportionately made up of small-cap funds.
Risk & return considerations Crucially, the measure of active share does not incorporate a con-sideration of observed portfolio risk. This limitation is meaningful if we assume that one duty of a portfolio manager is to consider the risk level of the portfolio according to a fund mandate.
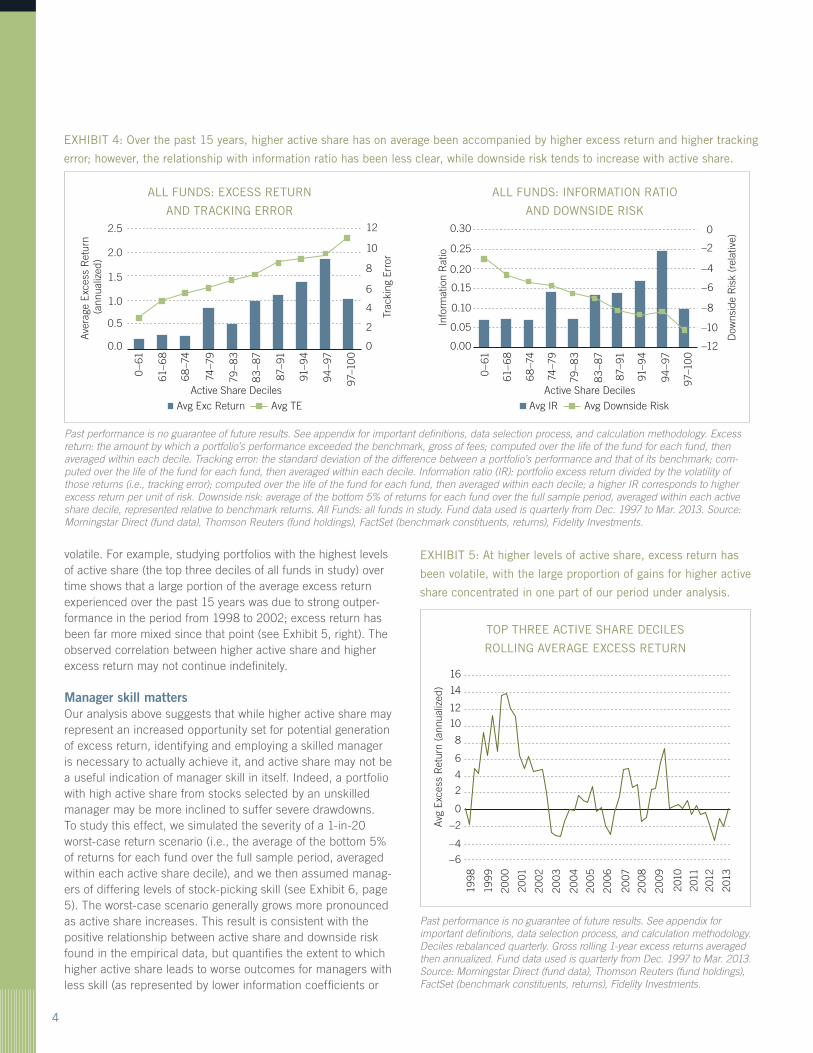
By comparing active share and standard measures of risk for our sample of funds, we find that there may be a trade-off worth considering. In theory, a higher active share (with all other fac-tors equal) should allow a manager with skill the opportunity to add greater value, and the large sample of mutual funds used in our analysis does indeed demonstrate a positive historical relationship between active share and excess return, gross of fees (see Exhibit 4, page 4). Tracking error likewise seems to show a positive correlation with active share. However, informa-tion ratio, which measures excess return per unit of active risk, shows less of a relationship with active share. Moreover, the analysis also shows a discernible positive correlation between active share and a portfolio’s “worst case scenario” (see Exhibit 4)—in other words, higher active share has been accompanied by greater levels of downside risk (or negative “fat tail” events), and this relationship has been largely linear. Investors should always consider the potential risk-return trade-off that increased active share may represent.
In addition, at higher levels of active share, the magnitude of excess return is not consistent through time, and is in fact quite
MEDIAN ACTIVE SHARE AND BENCHMARK CONCENTRATION
EXHIBIT 3: Top-heavy indices tend to lead to lower active shares for active managers benchmarked to those indices.
Benchmark concentrations and active share medians are a snapshot as of Mar. 28, 2013. See appendix for important definitions, data selection process, and calculation methodology. Source: Morningstar Direct (fund data, EAFE data), Thomson Reuters (fund holdings), FactSet (benchmark constituents, returns), RIMES (benchmark constituents), Fidelity Investments.
0
Top 20 Holdings as a % of Total Benchmark Market Capitalization
5 10 15 20 25 30 35 40
Med
ian
Act
ive
Shar
e (%
)
65
70
75
80
85
90
95
100
Russell 2000
Russell 2000 Value
Russell Midcap
Russell 2000 GrowthRussell Midcap Value
Russell Midcap Growth
MSCI EAFERussell 1000 S&P 500
Russell 1000 Growth
Russell 1000 Value
4
ALL FUNDS: EXCESS RETURN
AND TRACKING ERROR
ALL FUNDS: INFORMATION RATIO
AND DOWNSIDE RISK
EXHIBIT 4: Over the past 15 years, higher active share has on average been accompanied by higher excess return and higher tracking
error; however, the relationship with information ratio has been less clear, while downside risk tends to increase with active share.
Past performance is no guarantee of future results. See appendix for important definitions, data selection process, and calculation methodology. Excess return: the amount by which a portfolio’s performance exceeded the benchmark, gross of fees; computed over the life of the fund for each fund, then averaged within each decile. Tracking error: the standard deviation of the difference between a portfolio’s performance and that of its benchmark; com-puted over the life of the fund for each fund, then averaged within each decile. Information ratio (IR): portfolio excess return divided by the volatility of those returns (i.e., tracking error); computed over the life of the fund for each fund, then averaged within each decile; a higher IR corresponds to higher excess return per unit of risk. Downside risk: average of the bottom 5% of returns for each fund over the full sample period, averaged within each active share decile, represented relative to benchmark returns. All Funds: all funds in study. Fund data used is quarterly from Dec. 1997 to Mar. 2013. Source: Morningstar Direct (fund data), Thomson Reuters (fund holdings), FactSet (benchmark constituents, returns), Fidelity Investments.
volatile. For example, studying portfolios with the highest levels of active share (the top three deciles of all funds in study) over time shows that a large portion of the average excess return experienced over the past 15 years was due to strong outper-formance in the period from 1998 to 2002; excess return has been far more mixed since that point (see Exhibit 5, right). The observed correlation between higher active share and higher excess return may not continue indefinitely.
Manager skill mattersOur analysis above suggests that while higher active share may represent an increased opportunity set for potential generation of excess return, identifying and employing a skilled manager is necessary to actually achieve it, and active share may not be a useful indication of manager skill in itself. Indeed, a portfolio with high active share from stocks selected by an unskilled manager may be more inclined to suffer severe drawdowns. To study this effect, we simulated the severity of a 1-in-20 worst-case return scenario (i.e., the average of the bottom 5% of returns for each fund over the full sample period, averaged within each active share decile), and we then assumed manag-ers of differing levels of stock-picking skill (see Exhibit 6, page 5). The worst-case scenario generally grows more pronounced as active share increases. This result is consistent with the positive relationship between active share and downside risk found in the empirical data, but quantifies the extent to which higher active share leads to worse outcomes for managers with less skill (as represented by lower information coefficients or
TOP THREE ACTIVE SHARE DECILES
ROLLING AVERAGE EXCESS RETURN
EXHIBIT 5: At higher levels of active share, excess return has
been volatile, with the large proportion of gains for higher active
share concentrated in one part of our period under analysis.
Past performance is no guarantee of future results. See appendix for important definitions, data selection process, and calculation methodology. Deciles rebalanced quarterly. Gross rolling 1-year excess returns averaged then annualized. Fund data used is quarterly from Dec. 1997 to Mar. 2013. Source: Morningstar Direct (fund data), Thomson Reuters (fund holdings), FactSet (benchmark constituents, returns), Fidelity Investments.
0
–2
–4
–6
2
4
6
8
10
12
14
16
Avg
Exc
ess
Ret
urn
(ann
ualiz
ed)
1998
199
9
200
0
2001
2002
200
3
200
4
2005
200
6
2007
200
8
200
9
2010
2011
2012
2013
Ave
rage
Exc
ess
Ret
urn
(ann
ualiz
ed)
Trac
king
Err
or
Avg TE
0.0
0.5
1.0
1.5
2.0
2.5
0
2
4
6
8
10
12
Active Share Deciles Active Share Deciles
0–6
1
61–6
8
68
–74
74–7
9
79–8
3
83
–87
87–9
1
91–9
4
94
–97
Avg Exc Return
97–1
00
Info
rmat
ion
Rat
io
Dow
nsid
e R
isk
(rel
ativ
e)
Avg Downside Risk
0.00
0.05
0.10
0.15
0.20
0.25
0.30
–12
–10
–8
–6
–4
–2
0
0–6
1
61–6
8
68
–74
74–7
9
79–8
3
83
–87
87–9
1
91–9
4
94
–97
Avg IR
97–1
00
5
“batting averages”). Without perfect foresight as to a manager’s level of skill—and given the fact that even skilled managers do not have completely consistent batting averages—an investor must again weigh the trade-offs implicit in choosing managers with higher levels of active share.
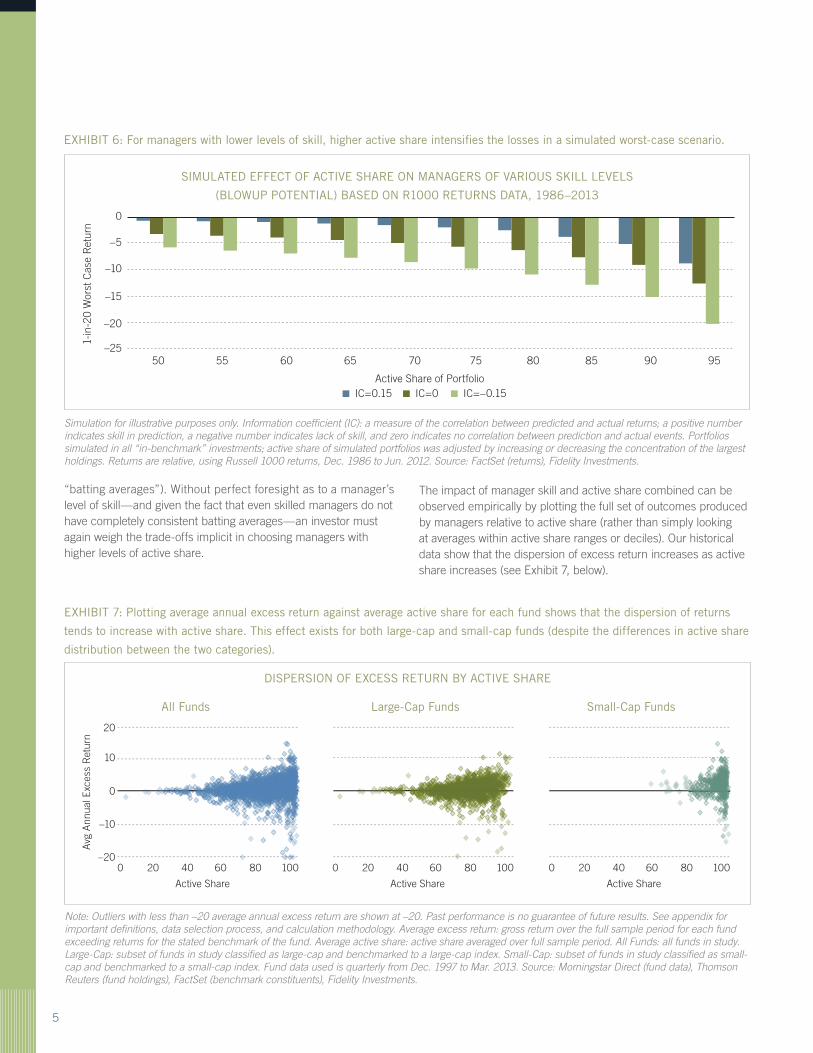
The impact of manager skill and active share combined can be observed empirically by plotting the full set of outcomes produced by managers relative to active share (rather than simply looking at averages within active share ranges or deciles). Our historical data show that the dispersion of excess return increases as active share increases (see Exhibit 7, below).
SIMULATED EFFECT OF ACTIVE SHARE ON MANAGERS OF VARIOUS SKILL LEVELS
(BLOWUP POTENTIAL) BASED ON R1000 RETURNS DATA, 1986–2013
All Funds Large-Cap Funds
DISPERSION OF EXCESS RETURN BY ACTIVE SHARE
Small-Cap Funds
EXHIBIT 6: For managers with lower levels of skill, higher active share intensifies the losses in a simulated worst-case scenario.
EXHIBIT 7: Plotting average annual excess return against average active share for each fund shows that the dispersion of returns
tends to increase with active share. This effect exists for both large-cap and small-cap funds (despite the differences in active share
distribution between the two categories).
Simulation for illustrative purposes only. Information coefficient (IC): a measure of the correlation between predicted and actual returns; a positive number indicates skill in prediction, a negative number indicates lack of skill, and zero indicates no correlation between prediction and actual events. Portfolios simulated in all “in-benchmark” investments; active share of simulated portfolios was adjusted by increasing or decreasing the concentration of the largest holdings. Returns are relative, using Russell 1000 returns, Dec. 1986 to Jun. 2012. Source: FactSet (returns), Fidelity Investments.
Note: Outliers with less than –20 average annual excess return are shown at –20. Past performance is no guarantee of future results. See appendix for important definitions, data selection process, and calculation methodology. Average excess return: gross return over the full sample period for each fund exceeding returns for the stated benchmark of the fund. Average active share: active share averaged over full sample period. All Funds: all funds in study. Large-Cap: subset of funds in study classified as large-cap and benchmarked to a large-cap index. Small-Cap: subset of funds in study classified as small-cap and benchmarked to a small-cap index. Fund data used is quarterly from Dec. 1997 to Mar. 2013. Source: Morningstar Direct (fund data), Thomson Reuters (fund holdings), FactSet (benchmark constituents), Fidelity Investments.
–25
–20
–15
–10
–5
0
1-in
-20
Wor
st C
ase
Ret
urn
50
IC=0.15
55 60 65 70 75 80 85 90 95
IC=0Active Share of Portfolio
IC=–0.15
0 20 40 60 80 100
Active Share
–20
–10
0
10
20
Avg
Ann
ual E
xces
s R
etur
n
0 20 40 60 80 100
Active Share
0 20 40 60 80 100
Active Share
6
The implication of the data is that while higher active share may allow a skilled portfolio manager a greater opportunity set from which to generate excess return, the trade-off has been an increase in downside or “blow-up” risk and an unclear effect on risk-adjusted returns overall. Different investors may evaluate these trade-offs differently, each making informed and rational decisions. However, a selection process based predominantly upon maximizing active share neglects the crucial element of considering potential return in the context of risk.
Consistency of mandateBy definition, active share does not tell us about a fund manager’s consistency in adhering to the stated fund mandate and style. Because active share can be increased by out-of-benchmark hold-ings, a very high active share may in fact arise from out-of-mandate holdings in the fund (e.g., a large-cap core fund buying small-cap equities, or a U.S. mid-cap fund buying international equities).
How a manager seeks to achieve active share is an important consideration; investors should have a clear understanding of where a manager’s active share tends to originate, and whether these choices are consistent with the portfolio’s professed philoso-phy, process, and mandate. In an extreme example, a manager determined to achieve 100% active share could not invest in any securities in the fund’s benchmark—despite the maximum active share measure, the result may be a portfolio inconsistent with investor objectives (and may in fact narrow the manager’s in-mandate opportunity set, by ruling out benchmark holdings).
Although out-of-benchmark exposures may in some cases signal manager skill in selecting investments opportunistically, they may also create unanticipated fund exposures and factor bets when they are not well-matched to the benchmark’s type of invest-ments, which could impact an investor’s overall portfolio structure and risk controls. Investors seeking to optimize the exposures of a portfolio containing multiple managers should therefore evaluate how much of each manager’s active share arises from out-of-mandate holdings, which may indicate style drift or an inappropri-ate benchmark.
Large-cap portfolios, excess return, and smaller-cap biasHistorically, an important source of active share for managers of funds classified as large-cap (and benchmarked to a large-cap index) seems to have been holdings in smaller-cap stocks. Intuitively, it makes sense that many active managers may attempt to outperform a capitalization-weighted benchmark (where larger-cap stocks receive proportionately more weight) by managing a portfolio that has a weighted market-cap smaller than that of the index.
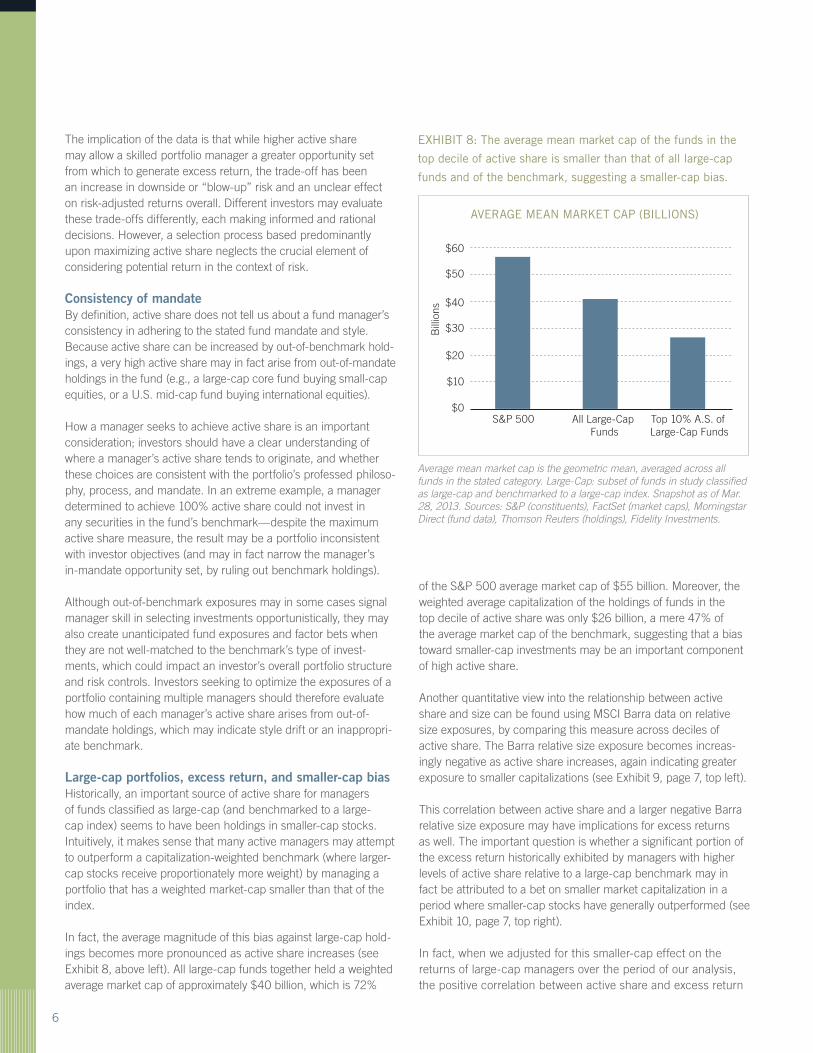
In fact, the average magnitude of this bias against large-cap hold-ings becomes more pronounced as active share increases (see Exhibit 8, above left). All large-cap funds together held a weighted average market cap of approximately $40 billion, which is 72%
of the S&P 500 average market cap of $55 billion. Moreover, the weighted average capitalization of the holdings of funds in the top decile of active share was only $26 billion, a mere 47% of the average market cap of the benchmark, suggesting that a bias toward smaller-cap investments may be an important component of high active share.
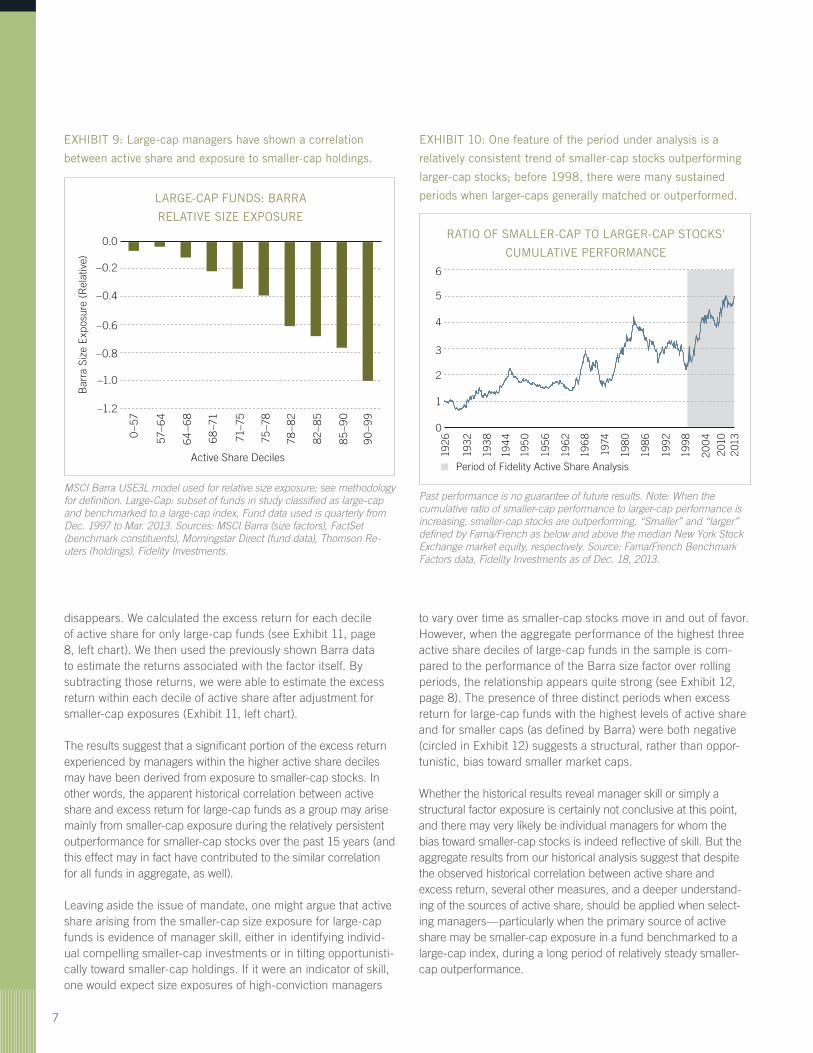
Another quantitative view into the relationship between active share and size can be found using MSCI Barra data on relative size exposures, by comparing this measure across deciles of active share. The Barra relative size exposure becomes increas-ingly negative as active share increases, again indicating greater exposure to smaller capitalizations (see Exhibit 9, page 7, top left).
This correlation between active share and a larger negative Barra relative size exposure may have implications for excess returns as well. The important question is whether a significant portion of the excess return historically exhibited by managers with higher levels of active share relative to a large-cap benchmark may in fact be attributed to a bet on smaller market capitalization in a period where smaller-cap stocks have generally outperformed (see Exhibit 10, page 7, top right).
In fact, when we adjusted for this smaller-cap effect on the returns of large-cap managers over the period of our analysis, the positive correlation between active share and excess return
AVERAGE MEAN MARKET CAP (BILLIONS)
EXHIBIT 8: The average mean market cap of the funds in the
top decile of active share is smaller than that of all large-cap
funds and of the benchmark, suggesting a smaller-cap bias.
Average mean market cap is the geometric mean, averaged across all funds in the stated category. Large-Cap: subset of funds in study classified as large-cap and benchmarked to a large-cap index. Snapshot as of Mar. 28, 2013. Sources: S&P (constituents), FactSet (market caps), Morningstar Direct (fund data), Thomson Reuters (holdings), Fidelity Investments.
$0
$10
$20
$30
$40
$50
$60
S&P 500
Bill
ions
All Large-Cap Funds
Top 10% A.S. of Large-Cap Funds
7
disappears. We calculated the excess return for each decile of active share for only large-cap funds (see Exhibit 11, page 8, left chart). We then used the previously shown Barra data to estimate the returns associated with the factor itself. By subtracting those returns, we were able to estimate the excess return within each decile of active share after adjustment for smaller-cap exposures (Exhibit 11, left chart).
The results suggest that a significant portion of the excess return experienced by managers within the higher active share deciles may have been derived from exposure to smaller-cap stocks. In other words, the apparent historical correlation between active share and excess return for large-cap funds as a group may arise mainly from smaller-cap exposure during the relatively persistent outperformance for smaller-cap stocks over the past 15 years (and this effect may in fact have contributed to the similar correlation for all funds in aggregate, as well).
Leaving aside the issue of mandate, one might argue that active share arising from the smaller-cap size exposure for large-cap funds is evidence of manager skill, either in identifying individ-ual compelling smaller-cap investments or in tilting opportunisti-cally toward smaller-cap holdings. If it were an indicator of skill, one would expect size exposures of high-conviction managers
RATIO OF SMALLER-CAP TO LARGER-CAP STOCKS’
CUMULATIVE PERFORMANCE
EXHIBIT 10: One feature of the period under analysis is a
relatively consistent trend of smaller-cap stocks outperforming
larger-cap stocks; before 1998, there were many sustained
periods when larger-caps generally matched or outperformed.
Past performance is no guarantee of future results. Note: When the cumulative ratio of smaller-cap performance to larger-cap performance is increasing, smaller-cap stocks are outperforming. “Smaller” and “larger” defined by Fama/French as below and above the median New York Stock Exchange market equity, respectively. Source: Fama/French Benchmark Factors data, Fidelity Investments as of Dec. 18, 2013.
0
1
2
3
4
5
6
Period of Fidelity Active Share Analysis
1926
1932
193
8
194
4
195
0
195
6
1962
196
8
1974
198
0
198
6
1992
1998
200
4
2010
2013
to vary over time as smaller-cap stocks move in and out of favor. However, when the aggregate performance of the highest three active share deciles of large-cap funds in the sample is com-pared to the performance of the Barra size factor over rolling periods, the relationship appears quite strong (see Exhibit 12, page 8). The presence of three distinct periods when excess return for large-cap funds with the highest levels of active share and for smaller caps (as defined by Barra) were both negative (circled in Exhibit 12) suggests a structural, rather than oppor-tunistic, bias toward smaller market caps.
Whether the historical results reveal manager skill or simply a structural factor exposure is certainly not conclusive at this point, and there may very likely be individual managers for whom the bias toward smaller-cap stocks is indeed reflective of skill. But the aggregate results from our historical analysis suggest that despite the observed historical correlation between active share and excess return, several other measures, and a deeper understand-ing of the sources of active share, should be applied when select-ing managers—particularly when the primary source of active share may be smaller-cap exposure in a fund benchmarked to a large-cap index, during a long period of relatively steady smaller-cap outperformance.
LARGE-CAP FUNDS: BARRA
RELATIVE SIZE EXPOSURE
EXHIBIT 9: Large-cap managers have shown a correlation
between active share and exposure to smaller-cap holdings.
MSCI Barra USE3L model used for relative size exposure; see methodology for definition. Large-Cap: subset of funds in study classified as large-cap and benchmarked to a large-cap index. Fund data used is quarterly from Dec. 1997 to Mar. 2013. Sources: MSCI Barra (size factors), FactSet (benchmark constituents), Morningstar Direct (fund data), Thomson Re-uters (holdings), Fidelity Investments.
–1.2
Active Share Deciles
–1.0
–0.8
–0.6
–0.4
–0.2
0.0
Bar
ra S
ize
Exp
osur
e (R
elat
ive)
0–5
7
57–6
4
64
–68
68
–71
78–8
2
82–8
5
85
–90
90
–99
75–7
8
71–7
5
8
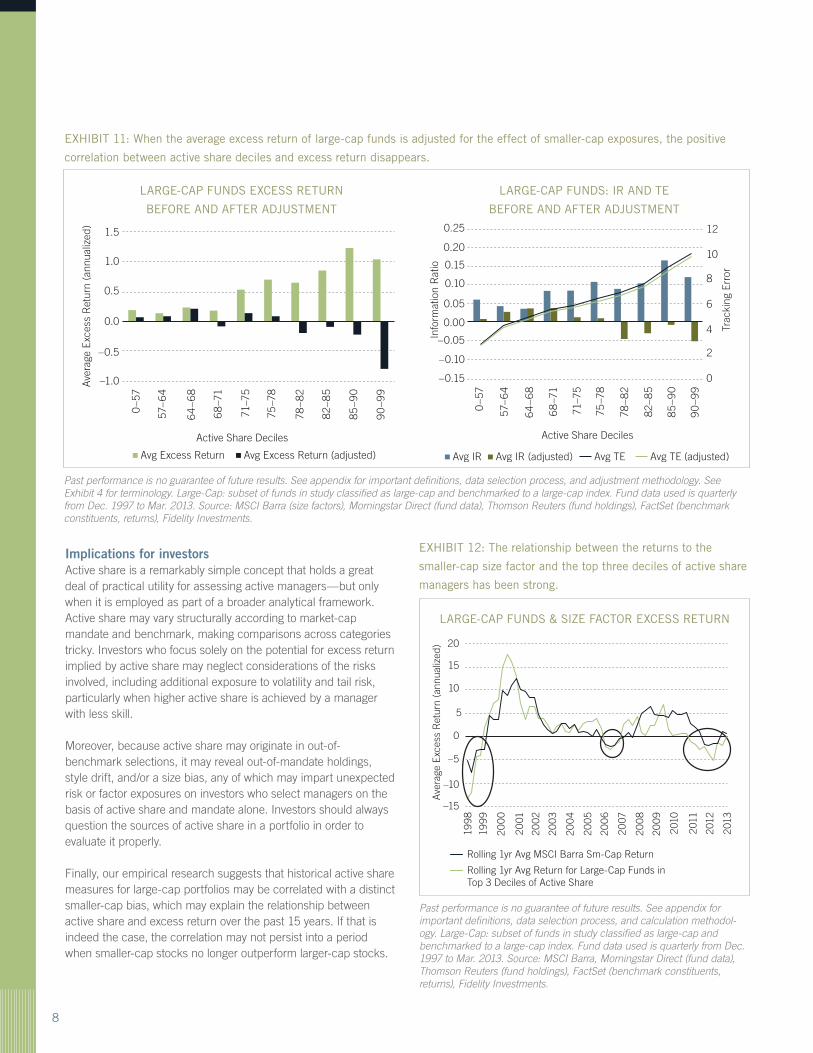
Implications for investors Active share is a remarkably simple concept that holds a great deal of practical utility for assessing active managers—but only when it is employed as part of a broader analytical framework. Active share may vary structurally according to market-cap mandate and benchmark, making comparisons across categories tricky. Investors who focus solely on the potential for excess return implied by active share may neglect considerations of the risks involved, including additional exposure to volatility and tail risk, particularly when higher active share is achieved by a manager with less skill.
Moreover, because active share may originate in out-of-benchmark selections, it may reveal out-of-mandate holdings, style drift, and/or a size bias, any of which may impart unexpected risk or factor exposures on investors who select managers on the basis of active share and mandate alone. Investors should always question the sources of active share in a portfolio in order to evaluate it properly.
Finally, our empirical research suggests that historical active share measures for large-cap portfolios may be correlated with a distinct smaller-cap bias, which may explain the relationship between active share and excess return over the past 15 years. If that is indeed the case, the correlation may not persist into a period when smaller-cap stocks no longer outperform larger-cap stocks.
LARGE-CAP FUNDS EXCESS RETURN
BEFORE AND AFTER ADJUSTMENT
LARGE-CAP FUNDS: IR AND TE
BEFORE AND AFTER ADJUSTMENT
EXHIBIT 11: When the average excess return of large-cap funds is adjusted for the effect of smaller-cap exposures, the positive
correlation between active share deciles and excess return disappears.
Past performance is no guarantee of future results. See appendix for important definitions, data selection process, and adjustment methodology. See Exhibit 4 for terminology. Large-Cap: subset of funds in study classified as large-cap and benchmarked to a large-cap index. Fund data used is quarterly from Dec. 1997 to Mar. 2013. Source: MSCI Barra (size factors), Morningstar Direct (fund data), Thomson Reuters (fund holdings), FactSet (benchmark constituents, returns), Fidelity Investments.
LARGE-CAP FUNDS & SIZE FACTOR EXCESS RETURN
EXHIBIT 12: The relationship between the returns to the
smaller-cap size factor and the top three deciles of active share
managers has been strong.
Past performance is no guarantee of future results. See appendix for important definitions, data selection process, and calculation methodol-ogy. Large-Cap: subset of funds in study classified as large-cap and benchmarked to a large-cap index. Fund data used is quarterly from Dec. 1997 to Mar. 2013. Source: MSCI Barra, Morningstar Direct (fund data), Thomson Reuters (fund holdings), FactSet (benchmark constituents, returns), Fidelity Investments.
–15
Rolling 1yr Avg MSCI Barra Sm-Cap Return
–10
–5
0
5
10
15
20
Ave
rage
Exc
ess
Ret
urn
(ann
ualiz
ed)
1998
199
9
200
0
2001
2002
200
3
200
4
2005
200
6
2007
200
8
200
9
2010
2011
2012
2013
Rolling 1yr Avg Return for Large-Cap Funds in Top 3 Deciles of Active Share
–1.0
–0.5
0.0
0.5
1.0
1.5
Ave
rage
Exc
ess
Ret
urn
(ann
ualiz
ed)
90
–99
Active Share Deciles
0–5
7
57–6
4
64
–68
68
–71
71–7
5
75–7
8
78–8
2
82–8
5
85
–90
Avg Excess Return Avg Excess Return (adjusted)
Active Share Deciles
–0.15
–0.10
–0.05
0.00
0.05
0.10
0.15
0.20
0.25
0
2
4
6
8
10
12
Avg IR
Info
rmat
ion
Rat
io
Trac
king
Err
or
0–5
7
57–6
4
64
–68
68
–71
71–7
5
75–7
8
78–8
2
82–8
5
85
–90
90
–99
Avg IR (adjusted) Avg TE Avg TE (adjusted)

9
Tim CohenChief Investment Officer
Tim Cohen is a chief investment officer for Fidelity Management & Research Company (FMRCo), the investment advisor for Fidelity’s family of mutual funds. In that role, he serves as chief investment officer for FMRCo’s International and Emerging Markets equity funds. Mr. Cohen assumed his current position in March 2013. He joined Fidelity Investments in 1996.
Brian Leite, CFAHead of Institutional Portfolio Management, Equity and High Income
Brian Leite is the head of institutional portfolio management on the Equity/High Income Team at Fidelity Management & Research Company (FMRCo), the investment advisor for Fidelity’s family of mutual funds, In this role, he is responsible for leading the team that works closely with portfolio managers and CIOs to help ensure that portfolios are managed in accordance with client expectations, and represents the investment team to clients, consultants, and internal partners. Mr. Leite assumed this position in March 2013. He joined Fidelity in 2000.
AuthorsDarby Nielson, CFAManaging Director of Quantitative Research, Equity
Darby Nielson is managing director of quantitative research for the equity division of Fidelity Management & Research Company (FMRCo), the investment advisor for Fidelity’s family of mutual funds. He manages a team of analysts conducting quantita-tive research in alpha generation and portfolio construction to enhance investment decisions impacting Fidelity Investment’s equity strategies. Mr. Nielson assumed this position in 2011. He joined Fidelity in 2007.
Andy BrowderQuantitative Analyst
Andy Browder is a quantitative analyst at Fidelity Management & Research Company (FMRCo), the investment advisor for Fidelity’s family of mutual funds. In this role, he is responsible for building and researching alpha models for the quant team, as well as for analyzing and modeling portfolio risk. Mr. Browder joined Fidelity in August 2013.
Quantitative Associate Misha Escovitz and Quantitative Intern Zhitong Zhang also contributed to this article. Vice President and Senior Investment Writer Vic Tulli provided editorial direction.

10
Views expressed are as of the date indicated, based on the information available at that time, and may change based on market and other conditions. Unless otherwise noted, the opinions provided are those of the authors and not necessarily those of Fidelity Investments or its affiliates. Fidelity does not assume any duty to update any of the information.
Investment decisions should be based on an individual’s own goals, time horizon, and tolerance for risk.
Past performance is no guarantee of future results.
All indices are unmanaged, and the performance of the indices includes the reinvestment of dividends and interest income, and is not illustrative of any particular investment. An investment cannot be made in an index.
Diversification/asset allocation does not ensure a profit or guarantee against a loss.
Investing involves risk, including risk of loss.
Stock markets, especially foreign markets, are volatile and can decline significantly in response to adverse issuer, political, regulatory, market, or economic developments.
The securities of smaller, less well-known companies can be more volatile than those of larger companies.
ReferenceCremers, K.J. Martijn, and Antti Petajisto, “How Active Is Your Fund Manager? A New Measure That Predicts Performance.” Review of Financial Studies, Yale School of Management. Mar. 2009.
DefinitionsExcess return: the amount by which a portfolio’s performance exceeded the benchmark, gross of fees, in percentage points. Tracking error: the standard deviation of the difference between a portfolio’s performance and that of its benchmark. Information ratio: portfolio excess return divided by the volatility of those returns (i.e., tracking error); a higher IR corresponds to higher excess return per unit of risk. Downside risk: average of the bottom 5% of returns for each fund over the full sample period, represented relative to benchmark returns, in percentage points. Information coefficient: a measure of the correlation between predicted and actual returns; a positive number indicates skill in prediction, a nega-tive number indicates lack of skill, and a measurement of zero indicates no correlation between prediction and actual events.
Methodology—general active share analysisData and sources: Thomson Reuters – fund-level holdings data; Morningstar (Morningstar Direct) – full list of funds with fund absolute and excess returns (quarterly and gross of fees), funds’ associated benchmarks; FactSet – benchmark holdings. The dataset ranged quarterly from Dec. 1997 (the earliest period for which we could get complete information) to Mar. 2013. Funds that stopped reporting returns between those dates are included in the dataset, to reduce survivorship bias.
Fund selection: We started out with all 3,233 funds that have Morningstar benchmark data and that exist in Thomson Reuters database. We removed all funds that lack sufficient holdings data, bringing the list to 2,329 funds. We manually excluded funds-of-funds, derivative-based funds, international funds, and index funds mistakenly classified as actively managed. Funds with holdings data that did not line up with quarter-end dates were not used. Funds holding fewer than 10 equity positions on average were excluded to try to eliminate funds using futures contracts or other index funds to track an index (which would cause miscalculation of active share). We also eliminated S&P 500 benchmarked funds with a non-Large Cap Morningstar categorization. These exclusions reduced the list to 2,079 funds.
All funds in study: 2,079 (average active share decile size: 208). Large-cap funds in study: 1,288 (average active share decile size: 128). Small-cap funds in study: 445 (average active share decile size: 44).
“All funds” category is made up of all funds remaining in the dataset after the exclusions noted above. “Large-cap funds” category is made up of funds that are classified by Morningstar as large-cap growth, value, or blend, and are also benchmarked to generally large-cap indices (i.e., S&P 500, Russell 1000, Russell 1000 Value, Russell 1000 Growth, Russell 3000, etc.); funds categorized as large-cap by Morningstar but benchmarked to explicitly small-cap indices such as the Russell 2000 were excluded from this category. “Small-cap funds” category is made up of funds classified as small-cap growth, value, or blend by Morningstar.
Dataset benchmarks: S&P 500, Russell 2000 Value, Russell 2000 Growth, Russell 2000, Russell Midcap, Russell Midcap Growth, Russell Midcap Value, Russell 3000, Russell 3000 Growth, Russell 3000 Value, Russell 1000 Growth, Russell 1000 Value, Russell 1000.
Fund active share is defined as the average active share over the full sample period, or full portion of the sample period for which the fund existed in the case of funds that began reporting after Dec. 1997 or stopped before Mar. 2013. Active share calculations were made quarterly.
Annualized Excess Return is defined as the difference between the annualized cumulative absolute return of the fund and the annualized cumulative return of the benchmark over the full span of the fund’s existence within the study period. All fund returns were quarterly and gross of fees.
The information ratio was calculated as the annualized excess return of the fund divided by the annualized standard deviation of the quarterly return (tracking error).
Methodology—adjustment for smaller-cap exposureWe used the MSCI Barra USE3L equity risk model for smaller-cap exposures.
The Barra size exposure is the weighted average of the holdings for each fund exposure to the Barra size factor (which is based upon the market capitalization of each individual security). The exposure is then made relative by subtracting the relevant benchmark’s Barra size exposure.
To adjust for the smaller-cap effect, we multiply each fund’s relative size exposure by the Barra size return for each quarter and then subtract that figure from the realized return. The Barra size factor is negative when smaller-cap outperforms larger-cap.
Please note two important considerations:
1. The Barra hit rate is the percentage of the portfolio that is matched from the Thomson Reuters data to the Barra holdings in the USE3L model. It varies based on fund type and tends to be lower (i.e., more missing securities) with higher average active share levels of the fund. Average hit rate across all funds was 96.2%.
2. Mutual funds often reported holdings semiannually in the first part of the dataset (1998–2003), which results in gaps in the data. Because it is not possible to determine Barra smaller-cap exposure for those quarters, we estimate the Barra smaller-cap exposures over single-quarter gaps by using the average of the previous and following quarters.
Index definitionsThe MSCI Europe, Australasia, Far East (EAFE) Index is an unmanaged market capitalization-weighted index designed to represent the performance of developed stock markets outside the United States and Canada.
The Russell 1000 Value Index is an unmanaged market capitalization-weighted index of those stocks of the 1,000 largest U.S.-domiciled companies that exhibit value-oriented characteristics. The Russell 1000 Growth (Value) Index is an unmanaged market capitalization-weighted index of those stocks of the 1,000 largest U.S.-domiciled companies that exhibit growth-oriented (value-oriented) characteristics. The Russell 1000 Value Index is an unmanaged market capitalization-weighted index of those stocks of the 1,000 largest U.S.-domiciled companies

11
that exhibit value-oriented characteristics. The Russell 2000 Index is an unmanaged market capitalization-weighted index of the stocks of the 2,000 smallest companies included in the 3,000 largest U.S.- domiciled companies. The Russell 2000 Growth (Value) Index is an unmanaged market capitalization-weighted index of the stocks of the 2,000 smallest companies included in the 3,000 largest U.S.- domiciled companies that exhibit growth-oriented (value-oriented) characteristics. The Russell 3000 Index is an unmanaged market capitalization-weighted index of those stocks of the 3,000 largest U.S.-domiciled companies that exhibit growth-oriented characteristics. The Russell 3000 Growth (Value) Index is an unmanaged market capitalization-weighted index of those stocks of the 3,000 largest U.S.-domiciled companies that exhibit growth-oriented (value-oriented) characteristics. The Russell Midcap Value Index is an unmanaged market capitalization-weighted index of the smallest 800 companies included in the Russell 1000 Index. The Russell Midcap (Growth) Value Index is an unmanaged market capitalization-weighted index of the smallest 800 companies included in the The Russell 1000 Index that exhibit growth-oriented (value-oriented) characteristics.
The S&P 500®, a market capitalization-weighted index of common stocks, is a registered service mark of The McGraw-Hill Companies, Inc.,
and has been licensed for use by Fidelity Distributors Corporation and its affiliates.
Third-party marks are the property of their respective owners; all other marks are the property of FMR LLC.
If receiving this piece through your relationship with Fidelity Financial Advisor Solutions (FFAS), this publication is provided to investment professionals, plan sponsors, institutional investors, and individual investors by Fidelity Investments Institutional Services Company, Inc.
If receiving this piece through your relationship with Fidelity Personal & Workplace Investing (PWI), Fidelity Family Office Services (FFOS), or Fidelity Institutional Wealth Services (IWS), this publication is provided through Fidelity Brokerage Services LLC, Member NYSE, SIPC.
If receiving this piece through your relationship with National Financial or Fidelity Capital Markets, this publication is FOR INSTITUTIONAL INVESTOR USE ONLY. Clearing and custody services are provided through National Financial Services LLC, Member NYSE, SIPC.

660338.1.0
© 2014 FMR LLC. All rights reserved.