Active Participation of FACTS Devices in Wholesale Electricity
21
Active Participation of FACTS Devices in Wholesale Electricity Markets Mostafa Sahraei-Ardakani and Seth Blumsack ([email protected]; [email protected]) Lone Family Department of Energy and Mineral Engineering, Pennsylvania State University Keywords: FACTS devices, electricity markets, Supply Function Equilibrium (SFE), admittance pricing, transmission markets. Abstract Traditionally, electric system operators have dispatched generation to minimize total production costs, assuming a fixed transmission topology within the dispatch horizon. Implementation of smart-grid systems could allow operators to co-optimize transmission topology alongside generator dispatch; the technologies that would enable such co-optimization are still regulated as part of the monopoly transmission system. Recent work (Gribik et al., 2005; O’Neill, et al., 2008) has proposed mechanisms for compensating transmission owners based on flexible electrical characteristics and availability; and integrating transmission into “complete” real -time electricity markets. We study two different designs for the market-based operation of Flexible Alternating Current Transmission Systems (FACTS), which allows some control over the electrical topology of transmission lines. The first market design compensates FACTS devices based on differences in locational prices (effectively with Financial Transmission Rights), while the second allows FACTS devices to submit supply offers just as generators would, being paid a market-clearing price for additional transfer capacity provided to the system. The variable social
Transcript of Active Participation of FACTS Devices in Wholesale Electricity
Active Participation of FACTS Devices in Wholesale
Electricity Markets
Mostafa Sahraei-Ardakani and Seth Blumsack
([email protected]; [email protected])
Lone Family Department of Energy and Mineral Engineering, Pennsylvania State University
Keywords: FACTS devices, electricity markets, Supply Function Equilibrium (SFE), admittance
pricing, transmission markets.
Abstract
Traditionally, electric system operators have dispatched generation to minimize total production
costs, assuming a fixed transmission topology within the dispatch horizon. Implementation of
smart-grid systems could allow operators to co-optimize transmission topology alongside
generator dispatch; the technologies that would enable such co-optimization are still regulated as
part of the monopoly transmission system. Recent work (Gribik et al., 2005; O’Neill, et al.,
2008) has proposed mechanisms for compensating transmission owners based on flexible
electrical characteristics and availability; and integrating transmission into “complete” real-time
electricity markets. We study two different designs for the market-based operation of Flexible
Alternating Current Transmission Systems (FACTS), which allows some control over the
electrical topology of transmission lines. The first market design compensates FACTS devices
based on differences in locational prices (effectively with Financial Transmission Rights), while
the second allows FACTS devices to submit supply offers just as generators would, being paid a
market-clearing price for additional transfer capacity provided to the system. The variable social

costs of FACTS devices are modeled as the additional losses associated with changes in
electrical characteristics of transmission lines.
Our problem formulation for a simple two-node system suggests a number of regulatory
implications for flexible transmission architecture. First, we find that the marginal cost functions
for FACTS device dispatch are increasing, suggesting that flexible transmission technologies
may not possess the same natural-monopoly characteristics as the wires themselves. Second, the
additional transfer capacity offered by FACTS devices may effectively clear the real-time market
in some circumstances (i.e., the additional transfer capacity displaces higher-cost generation),
suggesting that FACTS devices have the power to set prices. Third, if FACTS devices are
compensated based on locational price differentials, the owners of such devices will not have
incentives to offer the socially optimal amount of transfer capacity to the system operator.
1. Introduction
The annual revenue of the US electricity industry is around 350 billion dollars (EIA). The very
large economic size of the industry emphasizes the need for efficient operation of the whole
system. The industry was considered to be a natural monopoly before 1990s and was operated
under regulation. One of the goals of restructuring, which began in the 1990s, is to decentralize
the decision making process and hopefully improve the system’s efficiency.
Currently, the operation decisions in electric transmission are made centrally by the system
operator. Payments to regulated transmission owners are also made according to a regulated rate
of return that does not necessarily reflect the economic value of a certain transmission line to the
system. The implementation of the “smart grid” could enable the deployment of flexible and

adaptive transmission networks, thus allowing for the transmission topology to be optimized
depending on electricity demand and other system conditions. One technology that would allow
this is Flexible Alternating Current Transmission Systems (FACTS).
In an analogy to the water networks FACTS devices act similar to water pumps (Fairley, 2011).
Without water pumps, water only flows from higher altitudes to the lower altitudes based on the
pressure difference which may not always be efficient in a network. Similarly electricity flows
based on voltage and angle differences which may not be economically efficient. Economic
inefficiencies can occur in the form of loop flows or counter intuitive flows from a cheap node to
an expensive one. FACTS devices make it possible to control the flows and avoid such
economically inefficient phenomena.
Recently some studies have suggested implementing market-based mechanisms for transmission
sector. This would allow transmission owners to offer their services to the system operator on a
bid basis, as generators currently do in deregulated electricity markets. Such a market has been
termed a “complete real-time electricity market” (O’Neill et al., 2008). They conclude that it is
not clear whether the FACTS devices are natural monopoly and provide a strong theoretical
background for designing markets with active transmission participation. The existing literature,
however, does not provide any insight as to how the equilibrium in a complete real-time market
would be different than that of current markets, where supply offers are limited to generators
(and to some degree demand response). Existing work has stopped at formulating the
Independent System Operator (ISO)’s cost minimization problem. It should be noted that
generating and transmission companies have their own profit maximization problem. In order to
find the market equilibrium both the ISO level and firm level problems should be solved together

simultaneously.
Here we explore the equilibrium conditions using supply function equilibrium (SFE) model
when transmission participation in the market is allowed. This market problem is best modeled
as a Mathematical Program with Equilibrium Constraints (MPEC), where individual decision
makers maximize their profit considering the total cost minimization problem of the system
operator as a constraint. We formulate and model the problem in a very simple system with two
nodes and two parallel transmission lines. Although the system is simple, it is still suitable for
initial study of bid-based dispatchable FACTS devices’ impact on market equilibrium and social
welfare.
The rest of this paper is organized as follows: Section 2 reviews the relevant literature. The two-
node test system is presented and modeled in section 3 considering the existence of the FACTS
devices. Two market mechanisms for FACTS devices and equilibrium conditions are presented
in sections 4 and 5. Section 6 includes a numerical example and finally section 7 concludes this
paper.
2. Literature Review
By utilizing communication and automation potentials of smart grids the transmission system
topology can be controlled in real-time, either by the system operator or distributed decision-
makers such as FACTS device owners. Recently some studies have suggested co-optimizing
generation and transmission network topology to obtain a more efficient level of operation. The
majority of research has focused on switching transmission lines (Hedman et al., 2008; Fisher et
al., 2008; Khodaei and Shahidehpour, 2010). Based on the distribution of load and generation on
the power grid switching a line off the network can reduce loop flows. This can help reducing the
power flow on some congested lines resulting to a lower total operating cost for the system. The
findings show that switching the transmission lines can significantly save energy costs.
The switching control can be improved by using FACTS devices. A Thyristor Controlled Series
Compensator (TCSC) can continuously control the reactance of a transmission line (Hug, 2008;
Hug and Anderson, 2005). This technology allows for some amount of control over the power
flowing through the line.
O’Neill et al. used this concept in their complete real-time market design which allows for
transmission bidding (O’Neill et al., 2008). Their design has so far the most complete
formulation to our knowledge. They allow for transmission owners to bid in the market for using
their FACTS devices to change the admittance of their lines. However they limit their study to
the case where transmission lines are price taker and bid zero into the system. They argue that
the right way to compensate transmission owners is to pay them the difference between nodal
prices times the power flowing along the line. Their research is a step towards decentralizing the
centrally made optimization decisions regarding the transmission system. We build our research
on their work and address two important problems. First, their design has an incentive problem
which does not allow full utilization of the installed FACTS capacity. We explain this in more
details in the next section. Second, they have only formulated the social welfare maximization
problem of the system operator. In order to have a complete view of the market we need to
consider the profit maximization problems of the firms as well. Consideration of firm level
problems makes the total system a mathematical program with equilibrium constraints (MPEC).
This technique has been used in the literature to analyze the potential strategic gaming (Hobbs et
al., 2000). Here we try to address both of these problems in a simple system.
(Ernst et al., 2004) used a dynamic method to analyze how a relatively simple transmission
market works considering decision making of the firms. They use a dynamic Bertrand model for
transmission and assume full controllability of the power flow. Here, we use a SFE model and
base our payment mechanism on additional transfer capacity considering limited controllability
to make our model more realistic.
There is another relevant trend in the literature about merchant transmission investment. Unlike
regulated transmission, a merchant transmission project recovers its costs via market
mechanisms such as Financial Transmission Rights (FTR). Hogan argues that transmission
projects are alternatives to local generation projects. Therefore having regulatory mechanism for
one spreads out to the other (Hogan, 2003). Yet, merchant transmission faces different classes of
problems (Joskow and Tirole, 2004; Joskow and Tirole, 2005). (Brunekreeft, 2004) argues that
these problems do not exist in the case of controllable flows such as HVDC lines or AC lines
equipped with FACTS devices. A good market design for lines equipped with FACTS devices
can potentially support the idea of merchant transmission.
When dealing with transmission lines, the payments can be based on different properties of a
line. A method is introduced in (Gribik et al., 2005) for defining transmission rights under which
the owner of the line (or the holder of the transmission right) receives payments based on the
line’s capacity and its admittance. Currently transmission rights such as FTRs have positive
value only when congestion makes the nodal prices at the delivery bus larger than at the source
bus. The authors argue that capacity is not the only valuable characteristic of a transmission line
and admittance should also be taken into account. In our model we use the concept of admittance

payment.
3. The two-node system with FACTS devices
3.1. The two-node system
We start the discussion with a simple two node system. The nodes are connected through two
transmission lines. The example is taken from O’Neill et al (2008). The system is shown in
Figure 1.
Figure 1. The two-node, two-line system.
X indicates reactance of the lines and K shows their thermal capacity. Assume the marginal cost
of production is lower for G1 than G2 and the thermal capacity is 400 MW for K1 and 480 MW
for K2. Suppose that the generators have unlimited capacity and both lines have equal base
reactances. They are both equipped with TCSC so they can adjust their reactance. The net
reactances of the lines are shown in Equation 1:
where n shows the percentage by which the transmission line has adjusted its reactance. The

current technology allows for one percent change in reactance [3]. Considering the thermal limit
of 400 MW on line one, the maximum amount of power which can flow over line two would be
400 MW. However by adjusting the reactance of the lines the power flowing along line two can
be increased up to 480 MW which is its thermal capacity. The total transfer capacity from node 1
to node 2 can be calculated according to Ohm’s law. It is shown in Equation 2.
If the FACTS device on line 1 is used and the FACTS device on line 2 is not used, Equation 2
suggests a linear relationship between n1 and the transfer capacity. The relationship between n2
and the transfer capacity, however, is non-linear. The transfer capacity is depicted versus n1 and
n2 in Figure 2.
If the FATCS devices on both of the lines are used the transfer capacity increases non-linearly
with the change in reactances. We can use the linear part of the Taylor series to get a linear
approximation. Figure 2 shows that the approximation is valid for small values of n. Linear
approximation means that we assume both lines behave like line 1 and the effect of using both
FACTS devices is double the effect of line 1.

Figure 2. The transfer capacity when both the FACTS devices are used. It is assumed in this figure that n1=n2.
We assume linear marginal cost of production at the two nodes of the system. They are shown in
Equation 3 with q being the power produced.
Based on the thermal limit of the lines, the nodal prices can be calculated. We assume that
generator 2 is more expensive at the scale of this problem for all the values of demand. The
nodal prices are calculated for the case when generator 2 is needed for serving the load.
TC0 is the transfer capacity between the two nodes without using the FACTS devices.
The formulation developed by O’Neill et al. suggests paying the price difference times the
800
810
820
830
840
850
860
870
880
890
900
0 0.5 1 1.5 2 2.5 3 3.5 4 4.5 5 5.5 6 6.5 7 7.5 8 8.5 9 9.5 10
Tran
sfe
r C
apac
ity
(MW
)
Percentage Change in Reactance
Real Capacity
Linear Approximation

quantity flowing over the line to the transmission lines. However this type of payment removes
the incentive for Line 1 to use its FACTS devices in order to increase the transfer capacity. As
discussed earlier no matter which line uses its FACTS device the additional power flows along
line 2. According to O’Neill et al. line 2 would be rewarded for the actions taken by line 1. This
is a serious incentive problem with their formulation when independent companies own the
FACTS devices.
The payment method we use is based on the incremental transfer capacity. Each FACTS device
owner is paid the market price for reactance change times the amount of change. We use SFE
which is a game theoretic model to analyze market equilibrium under this transmission operation
policy. We assume that generators bid their marginal cost. FACTS device owners are paid the
market clearing price for the FACTS devices based on the bids they submit to the ISO. This price
comes out of the competition with the other FACTS device owners that could offer the same
service, and alternative generators.
3.2. Cost Function Structure
Here we model the variable cost associated with FACTS devices as the costs associated with
resistive power losses. The loss in a transmission line is presented in Equation 5.
R is the line’s resistance, P is the transmitted power and V is the line’s voltage. This equation can
be used to describe the marginal system cost of FACTS device utilization. Assume the FACTS
devices change the reactance of the lines by n1 and n2 percent respectively. The additional loss

associated with the FACTS devices are calculated in Equation 23.
TC represents transfer capacity. Superscript 0 represents the state before using FACTS devices
and 1 is when they are used. The total cost of using the FACTS devices can be calculated by
multiplying losses from Equation 6 by the price of electricity at the source node. It should be
noted that Equation 6 shows a non-linear relationship between reactance change and losses. The
non-linearity creates computational challenges and more importantly does not support
superposition principle. Therefore it is not easy to distribute the losses to the individual FACTS
devices. For the sake of simplicity we assume that the relative changes in losses due to the effect
of FACTS devices can be approximated by a linear relationship. Linearization of Equation 6
using first-order Taylor expansion is presented in Equation 7.
Not only does the linear approximation make the problem computationally easier but also it
obviously makes the superposition principle hold. From Equation 7 one can see that unlike
Equation 6 the losses associated with each FACTS device can be separated.
To calculate the cost associated with the losses we need to multiply each term of Equation 7 by
the price at the source node. In the two node system the resulting cost functions would be:

Marginal cost functions can be calculated by taking the derivative of the cost functions with
respect to the related control variable.
Equation 8 and 9 are valid only when the price at node 1 is less than the price at node 2 and the
capacity of FACTS devices is not overused beyond the point that congestion is completely
relieved (4n1+4n2 ≤ L-TC0). An important property of marginal cost functions shown in Equation
9 is that they are increasing functions. Moreover the average variable cost functions which can
be calculated from Equation 8 are increasing as well. Therefore one can conclude that the
FACTS devices are not natural monopolies and operation decisions can be made in a market-
mechanism.
4. LMP based compensation – Cournot model
First we model the market for FACTS devices as a Cournot game. We assume that each FACTS
device owner is paid the nodal price difference times the incremental transfer capacity facilitated
by the use of the FACTS device. We also assume that the generators bid their marginal cost.
From Equation 4 we can calculate the nodal price difference.
Firms that own FACTS devices are assumed to be profit maximizers. The profit functions are
presented in Equation 11.

To find Nash-Cournot equilibrium for this game the following conditions should hold:
The solution to the above set of equation is presented in Equation 13.
Since the FACTS device owners are paid the nodal price difference the equilibrium shown in
Equation 13 never relieves the congestion. The term epsilon ensures that the prices are different
at the two nodes of the system and FACTS devices have positive value.
5. SFE model for FACTS devices
Here we assume that each FACTS device owner bids a linear affine function to the market which
puts a price on percentage change in reactance. Then ISO clears the market and specifies the
market clearing price based on the submitted bids. The bid functions are shown in Equation 14.
B is the bid function and gets the unit of dollar per percentage change in reactance. a and b are

the parameters of the bid functions. We assume that the slope of the bid function (a) equals the
slope of the marginal cost function and the decision variable is the intercept (b). For loads larger
than TC0 it is economical to use the FACTS devices to relieve the congestion. Having the bid
functions ISO finds the cheapest way of relieving the congestion.
The set of dispatched FACTS capacity calculated in Equation 15 results in the price for the
operation of FACTS devices shown in Equation 16.
Not only do the FACTS devices compete against each other but also they compete with
generator 2. Thus the marginal cost of generator 2 imposes an ad hoc cap on the FACTS device
bids. The price cap for the market would be the difference between nodal prices if generator 2
was marginal. If the FACTS owners asked for more than that it would be better to buy from
generator 2 instead of asking FACTS devices to relieve the congestion. The profit functions are
shown in Equation 17.
To find Nash-SFE we need to maximize each profit function with respect to the related player’s

decision variable. The set of equations presented in Equation 18 determines the conditions for
Nash-SFE.
The solution to above set of equations specifies Nash equilibrium strategies for FACTS devices
owners. At the equilibrium we have:
If the solution provided in Equation 16 resulted in a price higher than market cap, the ISO would
automatically pay the FACTS owner the market cap. In the case that market cap constraint is
active we have a corner solution. We assume that marginal cost would never be higher than
market cap which means the cost of marginal losses is always smaller than the marginal benefits
of using FACTS devices. This means that even when the bids are reduced to the market cap, the
players still make money.
6. Numerical example
We discuss how our FACTS device market would work in the context of a numerical example.
Assume that line 1 has a thermal capacity of 400 MW which makes the TC0 equal 800 MW. The
other parameters of the system are presented in Table 1.

TABLE I- PHYSICAL CHARACTERISTICS OF THE SYSTEM.
R V α1 β1 α2 β2
5 Ω 400 KV 0.05 $/MW2 18.5 $/MW 0.1 $/MW
2 65 $/MW
We increase the load at node 2 from 800 MW to 856MW. We look at different market variables
such as equilibrium quantities (% reactance changes); nodal prices; FACTS profits; overall social
welfare improvement; congestion rent. The first set of results is shown in Figure 3.
Figure 3. (a) top: total amount of reactance change at equilibrium. (b) bottom left: Clearing price for FACTS
devices. (c) bottom righ: The profit for FACTS device owners.
Figure 3 shows that at equilibrium in SFE model, enough FACTS capacity is offered to relieve
the congestion. However in Cournot model the device owners strategically withhold some of
their capacity in order to increase their profit. It seems from part (a) of figure 3 that SFE and
Cournot give the same capacity at equilibrium when load is lower than 828 MW. However, it
should be noticed that the capacity offered under Cournot is always slightly below SFE because
of the epsilon in Equation 13. This is why the both prices and profits for FACTS device owners
are larger when they are paid based on LMP difference under a Cournot model.
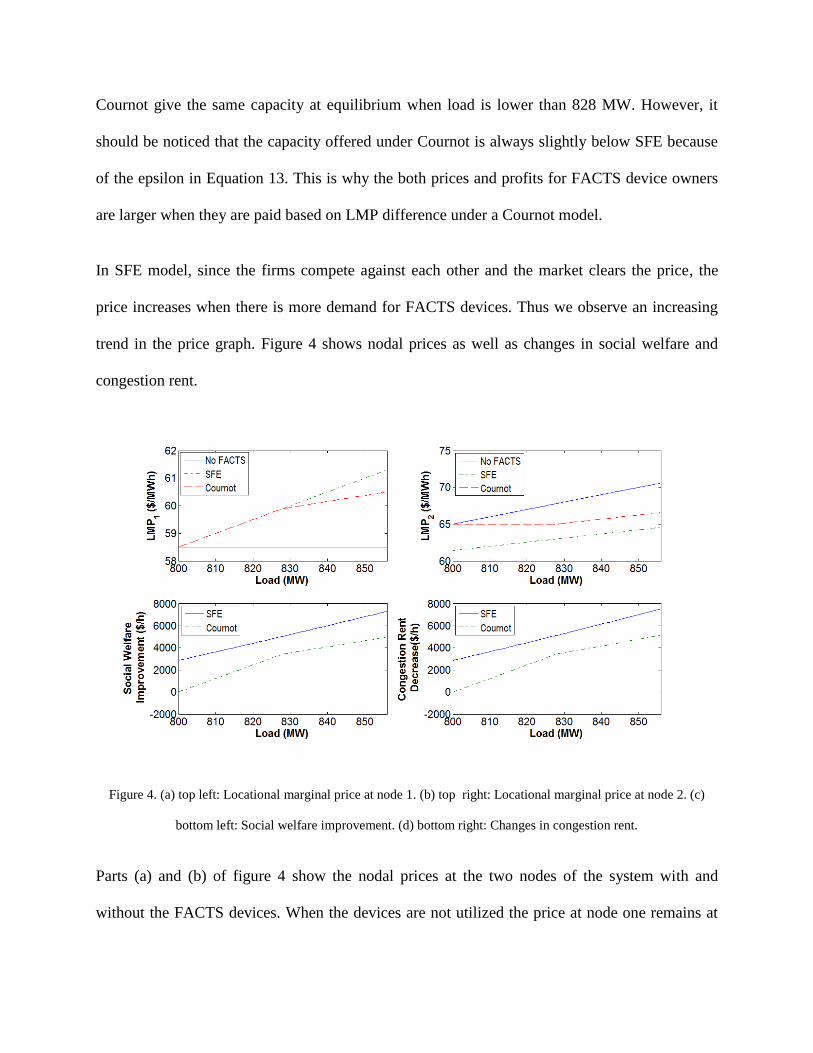
In SFE model, since the firms compete against each other and the market clears the price, the
price increases when there is more demand for FACTS devices. Thus we observe an increasing
trend in the price graph. Figure 4 shows nodal prices as well as changes in social welfare and
congestion rent.
Figure 4. (a) top left: Locational marginal price at node 1. (b) top right: Locational marginal price at node 2. (c)
bottom left: Social welfare improvement. (d) bottom right: Changes in congestion rent.
Parts (a) and (b) of figure 4 show the nodal prices at the two nodes of the system with and
without the FACTS devices. When the devices are not utilized the price at node one remains at

58.5 $/MWh which is the marginal cost of production at node 1 when the production level is
800MW. The price at node 2 without having the FACTS devices comes from the marginal cost
of production at node 2. When the devices are utilized, SFE gives lower nodal price at node 2. In
this case the price at node 2 equals the price at node 1 plus the price charged by FACTS devices.
LMP based compensation results in a larger price at node 2 compared to the case when the
device owners are allowed to actively bid into the market. This is because of the strategic
capacity withholding which occurs under LMP compensation. Parts (c) and (d) of figure 4 show
that both Cournot and SFE models increase the social welfare and reduce the congestion rent.
However as the results show, SFE model makes the society better off by providing more FACTS
capacity.
7. Conclusion and future work
With the smart grid technology transmission topology can be optimized with generation
simultaneously. Here we study the possibility of having a market for FACTS devices in order to
control the admittance of the lines. It was shown that if the device owners are charged the cost of
the additional loss their device imposes on the system, they end up with an increasing marginal
and average variable cost function. Under such circumstance they do not fall into the problem of
natural monopoly and a market mechanism can be employed for operation of the FACTS
devices. We investigated two different market structures for compensating FACTS devices: first,
they were paid based on the LMP differences similar to FTR. Second: They were allowed to
submit their offers to the market which means they put prices on the percentage changes in the
admittance of the line. The design was formulated and simulated on a simple two-node system. It
was shown that both designs can be beneficial to the system and also to the players. However

bid-based FACTS market was more efficient for the society compared to LMP compensation
design. It was shown that when the device owners are being paid based on LMP differences they
strategically withhold some capacity and deviate from socially optimal point.
In future we need to expand our study on larger test systems to be able to better understand how
such a market would work on a more realistic scale. We also need to consider how employment
of FACT devices would affect the current revenues coming from current Financial Transmission
Rights (FTRs).
References
G. Brunekreeft, 2004 “Market-based investment in electricity transmission networks:
controllable flow.” Utilities Policy, Vol. 12 (4), pp. 269-281
EIA, “Revenue from Retail Sales of Electricity to Ultimate Customers: Total by End-Use
Sector”, Retrieved from http://www.eia.doe.gov/cneaf/electricity/epm/table5_2.html
D. Ernst, A. Minoia, and M. Ilic, 2004, “Market dynamics driven by the decision-making of
both power producers and transmission owners,” In proc. of IEEE Power Engineering
Society General Meeting, pp. 255-260
P. Fairley, January 2011, “Flecible AC Transmission: The FACTS Machine,” IEEE
Spectrum Magazine

E. B. Fisher, R. P. O'Neill, and M. C. Ferris, 2008, “Optimal Transmission Switching,” IEEE
Transactions on Power Systems, Vol. 23 (3), pp. 1346-1355,
P. R. Gribik, D. Shirmohammadi, J. S. Graves, and J. G. Kritikson, 2005, “Transmission
Rights and Transmission Expansion,” IEEE Transactions on Power Systems, Vol. 20 (4), pp.
1728-1737
K. W. Hedman, R. P. O'Neill, E. B. Fisher, and S. S. Oren, 2008, “Optimal Transmission
Switching-Sensitivity Analysis and Extensions,” IEEE Transactions on Power Systems, Vol.
23 (3), pp. 1469-1479
B. F. Hobbs, C. B. Metzler, and J. S. Pang, 2000, “Strategic Gaming Analysis for Electric
Power Systems: An MPEC Approach,” IEEE Transactions on Power System, Vol. 15 (2), pp.
638-645
W. Hogan, 2003, “Transmission Market Design,” KSG Working Paper No. RWP03-040,
Available at SSRN: http://ssrn.com/abstract=453483 or doi:10.2139/ssrn.453483
G.G. Hug, 2008, “Coordinated Power Flow Control to Enhance Steady State Security in
Power Systems” Swiss Federal Institute of Technology, PhD Dissertation, Zurich
G. G. Hug and G. Andersson, 2005, “Coordinated Control of FACTS Devices based on
Optimal Power Flow,” In Proc. of37th Annual North American Power Symposium, pp. 141-
148,2005.
P L. Joskow, and J. Tirole, 2000 “Transmission Rights and Market Power on Electric Power
Networks,” RAND Journal of Economics, Vol. 31 (3), pp. 450-487

P. L. Joskow, and J. Tirole, 2005, “Merchant Transmission Investment,” The Journal of
Industrial Economics, Vol. 53 (2), pp. 233-264
A. Khodaei, and M. Shahidehpour, 2010, “Transmission Switching in Security-Constrained
Unit Commitment,” IEEE Transactions on Power Systems, Vol. 25 (4), pp. 1937-1945
R. P.O ' Neill, E. B. Fisher, B. F. Hobbs,and R. Baldick, 2008 “Towards a Compelete Real-
Time Electricity Market Design,” Journal of Regulatory Economics, Vol. 34, pp. 220-250