Active out-of-sequence thrust faulting in the central Nepalese Himalaya
4
must be linked significantly (correlation P-value ,0.1 after correction for serial autocorrelation) to the US ACE index over each sub-period 1950–76 and 1977–2003, and for each year 1950 to 2003 after data excluding a 5-yr block centred on the year in question are excluded. This rule simulates the predictor selection process in an actual forecast situation. Linear regression modelling The US ACE index has a positively skewed (generalized Pareto) distribution. To satisfy the assumptions for using ordinary least squares regression, we transform this distribution to a normal distribution using the log(1þUS ACE index) transform. We test for normality using the Kolmogorov–Smirnov test. The linear regression modelling is performed on these transformed data to produce hindcasts, which are then transformed back before the hindcast skill is computed. This procedure ensures that the observations are drawn from a normal distribution, and that the hindcast errors are normally distributed with a mean of zero (both requirements of linear regression modelling 22,23 ). A one-way analysis of variance (F-test) shows that the variance of the transformed observations and the variance of the hindcast errors are both constant in time (a further assumption of linear regression modelling 22,23 ). The regression modelling is performed with a single predictor variable (the July wind index) rather than as a multiple regression with two or more predictor variables. Multiple regression is found always to give lower hindcast skill, the skill reduction increasing as the number of parameters increases. The single predictor (wind index) approach offers greater skill through better strengthening of the predictive signals and better removal of noise. Cross-validated hindcasts Cross-validated hindcasts are made with block elimination 20,21 . The US ACE index of each year is hindcast by training the linear regression model on all data excluding a 5 yr block centred on the year of interest. The block is tapered at the time series ends. Block elimination is used to minimize potential skill inflation that might arise from multi- annual persistence. Cross-validation provides the best available estimate of forecast skill for the 54-yr sample. Spearman rank correlation The Spearman rank correlation coefficient is used as a robust and resistant alternative to the Pearson product–moment correlation coefficient 22 . The rank correlation is robust to deviations from linearity in a relationship, and is resistant to the influence of outliers. Received 7 April 2004; accepted 31 January 2005; doi:10.1038/nature03454. 1. Benfield Industry Analysis and Research Team, Catastrophe Losses (Benfield, London, 2004). 2. Diaz, H. F. & Pulwarty, R. S. Hurricanes: Climate and Socioeconomic Impacts (Springer, Berlin, 1997). 3. Pielke, R. A. Jr & Landsea, C. W. Normalised hurricane damage in the United States: 1925–1995. Weath. Forecast. 13, 621–631 (1998). 4. Lehmiller, G. S., Kimberlain, T. B. & Elsner, J. B. Seasonal prediction models for North Atlantic basin hurricane location. Mon. Weath. Rev. 125, 1780–1791 (1997). 5. Gray, W. M., Landsea, C. W., Mielke, P. W. Jr & Berry, K. J. Predicting Atlantic basin seasonal tropical cyclone activity by 1 August. Weath. Forecast. 8, 73–86 (1993). 6. Gray, W. M. Atlantic seasonal hurricane frequency. Part II: Forecasting its variability. Mon Weath. Rev. 112, 1669–1683 (1984). 7. Klotzbach, P. J. & Gray, W. M. Forecasting September Atlantic basin tropicalcyclone activity. Weath. Forecast. 18, 1109–1128 (2003). 8. Bove, M. C., Elsner, J. B., Landsea, C. W., Niu, X. & O’Brien, J. J. Effect of El Nin ˜o on U.S. landfalling hurricanes revisited. Bull. Am. Meteorol. Soc. 79, 2477–2482 (1998). 9. Pielke, R. A. Jr & Pielke, R. A. Sr. La Nin ˜a, El Nin ˜o and Atlantic hurricane damages in the United States. Bull. Am. Meteorol. Soc. 80, 2027–2034 (1999). 10. Saunders, M. A., Chandler, R. E., Merchant,C. J. & Roberts, F. P. Atlantic andNW Pacific typhoons: ENSO spatial impacts on occurrence and landfall. Geophys. Res. Lett. 27, 1147–1150 (2000). 11. Lyons, S. W. U. S. tropical cyclone landfall variability 1950–2002. Weath. Forecast. 19, 473–480 (2004). 12. Waple, A. M. et al. Climate assessment for 2001. Bull. Am. Meteorol. Soc. 83, S1–S62 (2001). 13. Neumann, C. J., Jarvinen, B. R., McAdie, C. J. & Hammer, G. R. Tropical Cyclones of the North Atlantic Ocean 1871–1998 (Historical Climatology Series 6–2, National Oceanic and Atmospheric Administration, Asheville, 1999). 14. Kalnay, E. et al. The NCEP/NCAR 40-year reanalysis. Bull. Am. Meteorol. Soc. 77, 437–471 (1996). 15. Dong, K. & Neumann, C. J. The relationship between tropical cyclone motion and environmental geostrophic flows. Mon. Weath. Rev. 114, 115–122 (1986). 16. Franklin, J. L., Feuer, S. E., Kaplan, J. & Aberson,S. Tropical cyclone motion and surrounding flow relationships: searching for beta gyres in Omega dropwindsonde datasets. Mon. Weath. Rev. 124, 64–84 (1996). 17. Collins, D. J. & Lowe, S. P. A macro validation dataset for U.S. hurricane models. 217–252 (Casualty Actuarial Society, Winter Forum, 2001); available from CAS at khttp://www.casact.org/pubsl. 18. Davis, R. E. Predictability of sea surface temperatures and sea level pressure anomalies over the North Pacific Ocean. J. Phys. Oceanogr. 6, 249–266 (1976). 19. Chen, W. Y. Fluctuations in northern hemisphere 700mb height field associated with the Southern Oscillation. Mon. Weath. Rev. 110, 808–823 (1982). 20. Elsner, J. B. & Schmertmann, C. P. Assessing forecast skill through cross-validation. Weath. Forecast. 9, 619–624 (1994). 21. Standardised verification system (SVS) for long-range forecasts (LRF). New Attachment II-9 to the Manual on the GDPS (WMO-No. 485), Vol. 1 (WMO, Geneva, 2002). 22. Wilks, D. S. Statistical Methods in the Atmospheric Sciences (Academic, San Diego, 1995). 23. Freund, R. J. & Wilson, W. J. Regression Analysis: Statistical Modeling of a Response Variable (Academic, San Diego, 1998). 24. Hilti, N., Saunders, M. A. & Lloyd-Hughes, B. Forecasting stronger profits. Glob. Reinsurance 6–7 (July/August 2004). Acknowledgements We thank B. Lloyd-Hughes for helpwith Table 3 and other aspects of the work. J. B. Elsner, C. W. Landsea, F. Vitart, J. Heming and I. M. Mason are thanked for comments on the manuscript. This work is supported by the TSR (Tropical Storm Risk) venture sponsored by Benfield (an independent reinsurance intermediary), Royal & SunAlliance (an insurance group), and Crawford & Company (a claims management solutions company). We acknowledge NOAA-CIRES, Climate Diagnostics Center, Boulder, Colorado, for the NCEP/NCAR Global Reanalysis Project data, and NOAA’s Hurricane Research Division for the HURDAT North Atlantic hurricane database. Competing interests statement The authors declare that they have no competing financial interests. Correspondence and requests for materials should be addressed to M.A.S. ([email protected]). .............................................................. Active out-of-sequence thrust faulting in the central Nepalese Himalaya Cameron Wobus 1 , Arjun Heimsath 2 , Kelin Whipple 1 & Kip Hodges 1 1 Department of Earth, Atmospheric and Planetary Sciences, Massachusetts Institute of Technology, Cambridge, Massachusetts 02139, USA 2 Department of Earth Sciences, Dartmouth College, Hanover, New Hampshire 03755, USA ............................................................................................................................................................................. Recent convergence between India and Eurasia is commonly assumed to be accommodated mainly along a single fault —the Main Himalayan Thrust (MHT) —which reaches the surface in the Siwalik Hills of southern Nepal 1–3 . Although this model is consistent with geodetic 4,5 , geomorphic 6 and microseismic data 7 , an alternative model incorporating slip on more northerly sur- face faults has been proposed to be consistent with these data as well 8–10 . Here we present in situ cosmogenic 10 Be data indicating a fourfold increase in millennial timescale erosion rates occurring over a distance of less than 2 km in central Nepal, delineating for the first time an active thrust fault nearly 100 km north of the surface expression of the MHT. These data challenge the view that rock uplift gradients in central Nepal reflect only passive transport over a ramp in the MHT. Instead, when combined with previously reported 40 Ar– 39 Ar data 9 , our results indicate persist- ent exhumation above deep-seated, surface-breaking structures at the foot of the high Himalaya. These results suggest that strong dynamic interactions between climate, erosion and tectonics have maintained a locus of active deformation well to the north of the Himalayan deformation front. The central Nepalese Himalaya is a textbook example of con- tinent–continent collision, in which the underthrusting of India has been concentrated on several roughly east–west-trending fault zones within a belt about 100 km wide. The northernmost of these fault zones is the Main Central Thrust (MCT), which marks a transition from the high-grade metamorphic Greater Himalayan Sequence in the north to the lower-grade Lesser Himalayan Sequence in the south. Geochronologic data indicate that the MCT is also the oldest structure, with evidence for initial activity on this thrust fault by 23–20 Myr ago 11 . More southerly structures — the Main Boundary Thrust (MBT) and the Main Frontal Thrust (MFT) —developed progressively in a north–south sequence, con- sistent with observations in foreland fold and thrust belts world- wide 12 (Fig. 1a). Most researchers working in the Nepal orogen assume that recent surface faulting has been concentrated at the trace of the MFT, which defines the southern limit of deformation in the Himalayan system. In this model, the MFT absorbs almost all slip on the MHT. However, this interpretation does not provide a letters to nature NATURE | VOL 434 | 21 APRIL 2005 | www.nature.com/nature 1008 © 2005 Nature Publishing Group
Transcript of Active out-of-sequence thrust faulting in the central Nepalese Himalaya
must be linked significantly (correlation P-value ,0.1 after correction for serialautocorrelation) to the US ACE index over each sub-period 1950–76 and 1977–2003, andfor each year 1950 to 2003 after data excluding a 5-yr block centred on the year in questionare excluded. This rule simulates the predictor selection process in an actual forecastsituation.
Linear regression modellingThe US ACE index has a positively skewed (generalized Pareto) distribution. To satisfy theassumptions for using ordinary least squares regression, we transform this distribution toa normal distribution using the log(1þUS ACE index) transform. We test for normalityusing the Kolmogorov–Smirnov test. The linear regression modelling is performed onthese transformed data to produce hindcasts, which are then transformed back before thehindcast skill is computed. This procedure ensures that the observations are drawn from anormal distribution, and that the hindcast errors are normally distributed with a mean ofzero (both requirements of linear regression modelling22,23). A one-way analysis ofvariance (F-test) shows that the variance of the transformed observations and the varianceof the hindcast errors are both constant in time (a further assumption of linear regressionmodelling22,23).
The regression modelling is performed with a single predictor variable (the July windindex) rather than as a multiple regression with two or more predictor variables. Multipleregression is found always to give lower hindcast skill, the skill reduction increasing as thenumber of parameters increases. The single predictor (wind index) approach offers greaterskill through better strengthening of the predictive signals and better removal of noise.
Cross-validated hindcastsCross-validated hindcasts are made with block elimination20,21. The US ACE index of eachyear is hindcast by training the linear regression model on all data excluding a 5 yr blockcentred on the year of interest. The block is tapered at the time series ends. Blockelimination is used to minimize potential skill inflation that might arise from multi-annual persistence. Cross-validation provides the best available estimate of forecast skillfor the 54-yr sample.
Spearman rank correlationThe Spearman rank correlation coefficient is used as a robust and resistant alternative tothe Pearson product–moment correlation coefficient22. The rank correlation is robust todeviations from linearity in a relationship, and is resistant to the influence of outliers.
Received 7 April 2004; accepted 31 January 2005; doi:10.1038/nature03454.
1. Benfield Industry Analysis and Research Team, Catastrophe Losses (Benfield, London, 2004).
2. Diaz, H. F. & Pulwarty, R. S. Hurricanes: Climate and Socioeconomic Impacts (Springer, Berlin, 1997).
3. Pielke, R. A. Jr & Landsea, C. W. Normalised hurricane damage in the United States: 1925–1995.
Weath. Forecast. 13, 621–631 (1998).
4. Lehmiller, G. S., Kimberlain, T. B. & Elsner, J. B. Seasonal prediction models for North Atlantic basin
hurricane location. Mon. Weath. Rev. 125, 1780–1791 (1997).
5. Gray, W. M., Landsea, C. W., Mielke, P. W. Jr & Berry, K. J. Predicting Atlantic basin seasonal tropical
cyclone activity by 1 August. Weath. Forecast. 8, 73–86 (1993).
6. Gray, W. M. Atlantic seasonal hurricane frequency. Part II: Forecasting its variability. Mon Weath. Rev.
112, 1669–1683 (1984).
7. Klotzbach, P. J. & Gray, W. M. Forecasting September Atlantic basin tropical cyclone activity. Weath.
Forecast. 18, 1109–1128 (2003).
8. Bove, M. C., Elsner, J. B., Landsea, C. W., Niu, X. & O’Brien, J. J. Effect of El Nino on U.S. landfalling
hurricanes revisited. Bull. Am. Meteorol. Soc. 79, 2477–2482 (1998).
9. Pielke, R. A. Jr & Pielke, R. A. Sr. La Nina, El Nino and Atlantic hurricane damages in the United
States. Bull. Am. Meteorol. Soc. 80, 2027–2034 (1999).
10. Saunders, M. A., Chandler, R. E., Merchant, C. J. & Roberts, F. P. Atlantic and NW Pacific typhoons:
ENSO spatial impacts on occurrence and landfall. Geophys. Res. Lett. 27, 1147–1150 (2000).
11. Lyons, S. W. U. S. tropical cyclone landfall variability 1950–2002. Weath. Forecast. 19, 473–480 (2004).
12. Waple, A. M. et al. Climate assessment for 2001. Bull. Am. Meteorol. Soc. 83, S1–S62 (2001).
13. Neumann, C. J., Jarvinen, B. R., McAdie, C. J. & Hammer, G. R. Tropical Cyclones of the North Atlantic
Ocean 1871–1998 (Historical Climatology Series 6–2, National Oceanic and Atmospheric
Administration, Asheville, 1999).
14. Kalnay, E. et al. The NCEP/NCAR 40-year reanalysis. Bull. Am. Meteorol. Soc. 77, 437–471 (1996).
15. Dong, K. & Neumann, C. J. The relationship between tropical cyclone motion and environmental
geostrophic flows. Mon. Weath. Rev. 114, 115–122 (1986).
16. Franklin, J. L., Feuer, S. E., Kaplan, J. & Aberson, S. Tropical cyclone motion and surrounding flow
relationships: searching for beta gyres in Omega dropwindsonde datasets. Mon. Weath. Rev. 124,
64–84 (1996).
17. Collins, D. J. & Lowe, S. P. A macro validation dataset for U.S. hurricane models. 217–252 (Casualty
Actuarial Society, Winter Forum, 2001); available from CAS at khttp://www.casact.org/pubsl.18. Davis, R. E. Predictability of sea surface temperatures and sea level pressure anomalies over the North
Pacific Ocean. J. Phys. Oceanogr. 6, 249–266 (1976).
19. Chen, W. Y. Fluctuations in northern hemisphere 700 mb height field associated with the Southern
Oscillation. Mon. Weath. Rev. 110, 808–823 (1982).
20. Elsner, J. B. & Schmertmann, C. P. Assessing forecast skill through cross-validation. Weath. Forecast. 9,
619–624 (1994).
21. Standardised verification system (SVS) for long-range forecasts (LRF). New Attachment II-9 to the
Manual on the GDPS (WMO-No. 485), Vol. 1 (WMO, Geneva, 2002).
22. Wilks, D. S. Statistical Methods in the Atmospheric Sciences (Academic, San Diego, 1995).
23. Freund, R. J. & Wilson, W. J. Regression Analysis: Statistical Modeling of a Response Variable (Academic,
San Diego, 1998).
24. Hilti, N., Saunders, M. A. & Lloyd-Hughes, B. Forecasting stronger profits. Glob. Reinsurance 6–7
(July/August 2004).
Acknowledgements We thank B. Lloyd-Hughes for help with Table 3 and other aspects of the
work. J. B. Elsner, C. W. Landsea, F. Vitart, J. Heming and I. M. Mason are thanked for comments
on the manuscript. This work is supported by the TSR (Tropical Storm Risk) venture sponsored
by Benfield (an independent reinsurance intermediary), Royal & SunAlliance (an insurance
group), and Crawford & Company (a claims management solutions company). We acknowledge
NOAA-CIRES, Climate Diagnostics Center, Boulder, Colorado, for the NCEP/NCAR Global
Reanalysis Project data, and NOAA’s Hurricane Research Division for the HURDAT North
Atlantic hurricane database.
Competing interests statement The authors declare that they have no competing financial
interests.
Correspondence and requests for materials should be addressed to M.A.S. ([email protected]).
..............................................................
Active out-of-sequence thrustfaulting in the centralNepalese HimalayaCameron Wobus1, Arjun Heimsath2, Kelin Whipple1 & Kip Hodges1
1Department of Earth, Atmospheric and Planetary Sciences, MassachusettsInstitute of Technology, Cambridge, Massachusetts 02139, USA2Department of Earth Sciences, Dartmouth College, Hanover, New Hampshire03755, USA.............................................................................................................................................................................
Recent convergence between India and Eurasia is commonlyassumed to be accommodated mainly along a single fault—theMain Himalayan Thrust (MHT)—which reaches the surface inthe Siwalik Hills of southern Nepal1–3. Although this model isconsistent with geodetic4,5, geomorphic6 and microseismic data7,an alternative model incorporating slip on more northerly sur-face faults has been proposed to be consistent with these data aswell8–10. Here we present in situ cosmogenic 10Be data indicating afourfold increase in millennial timescale erosion rates occurringover a distance of less than 2 km in central Nepal, delineating forthe first time an active thrust fault nearly 100 km north of thesurface expression of the MHT. These data challenge the viewthat rock uplift gradients in central Nepal reflect only passivetransport over a ramp in the MHT. Instead, when combined withpreviously reported 40Ar–39Ar data9, our results indicate persist-ent exhumation above deep-seated, surface-breaking structuresat the foot of the high Himalaya. These results suggest that strongdynamic interactions between climate, erosion and tectonicshave maintained a locus of active deformation well to the northof the Himalayan deformation front.
The central Nepalese Himalaya is a textbook example of con-tinent–continent collision, in which the underthrusting of India hasbeen concentrated on several roughly east–west-trending faultzones within a belt about 100 km wide. The northernmost ofthese fault zones is the Main Central Thrust (MCT), which marksa transition from the high-grade metamorphic Greater HimalayanSequence in the north to the lower-grade Lesser HimalayanSequence in the south. Geochronologic data indicate that theMCT is also the oldest structure, with evidence for initial activityon this thrust fault by 23–20 Myr ago11. More southerly structures—the Main Boundary Thrust (MBT) and the Main Frontal Thrust(MFT)—developed progressively in a north–south sequence, con-sistent with observations in foreland fold and thrust belts world-wide12 (Fig. 1a). Most researchers working in the Nepal orogenassume that recent surface faulting has been concentrated at thetrace of the MFT, which defines the southern limit of deformation inthe Himalayan system. In this model, the MFT absorbs almost allslip on the MHT. However, this interpretation does not provide a
letters to nature
NATURE | VOL 434 | 21 APRIL 2005 | www.nature.com/nature1008© 2005 Nature Publishing Group
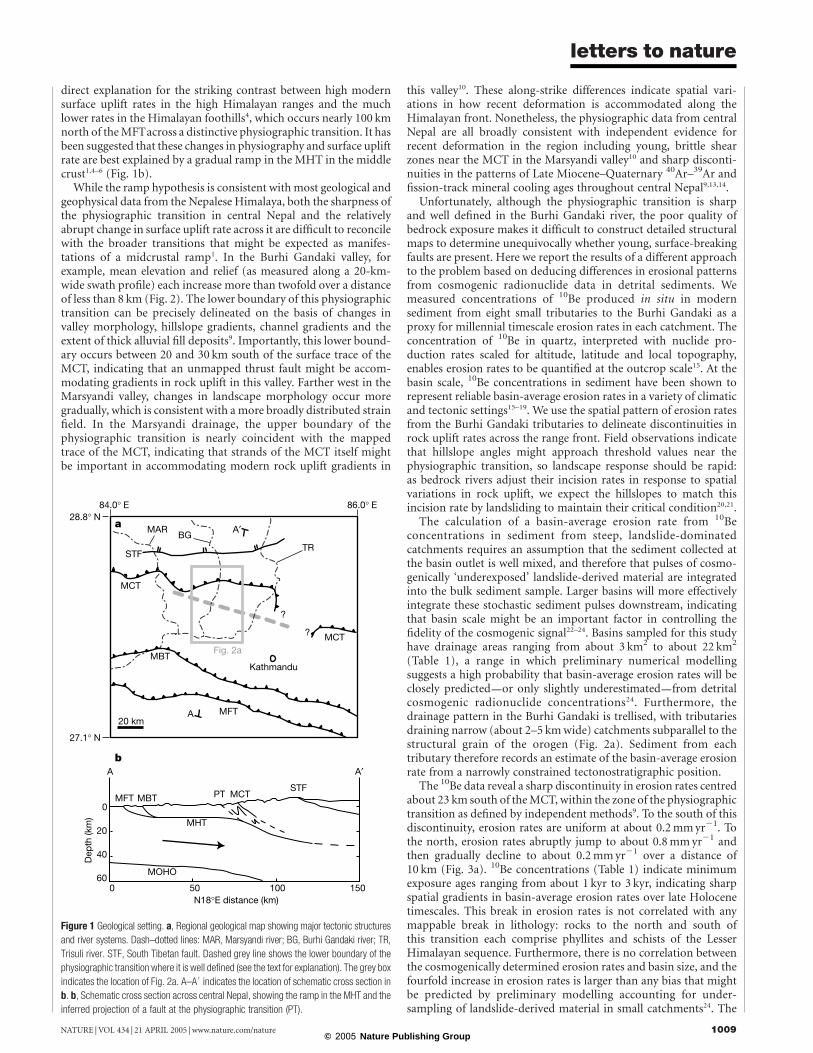
direct explanation for the striking contrast between high modernsurface uplift rates in the high Himalayan ranges and the muchlower rates in the Himalayan foothills4, which occurs nearly 100 kmnorth of the MFTacross a distinctive physiographic transition. It hasbeen suggested that these changes in physiography and surface upliftrate are best explained by a gradual ramp in the MHT in the middlecrust1,4–6 (Fig. 1b).
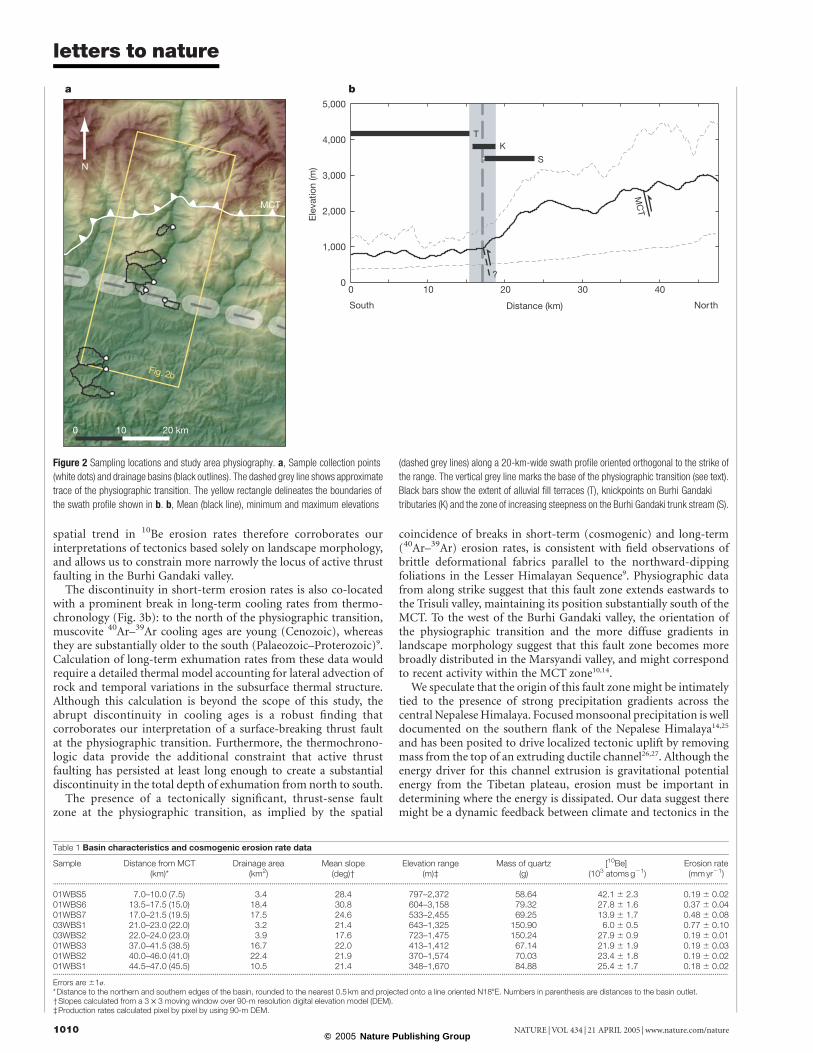
While the ramp hypothesis is consistent with most geological andgeophysical data from the Nepalese Himalaya, both the sharpness ofthe physiographic transition in central Nepal and the relativelyabrupt change in surface uplift rate across it are difficult to reconcilewith the broader transitions that might be expected as manifes-tations of a midcrustal ramp1. In the Burhi Gandaki valley, forexample, mean elevation and relief (as measured along a 20-km-wide swath profile) each increase more than twofold over a distanceof less than 8 km (Fig. 2). The lower boundary of this physiographictransition can be precisely delineated on the basis of changes invalley morphology, hillslope gradients, channel gradients and theextent of thick alluvial fill deposits9. Importantly, this lower bound-ary occurs between 20 and 30 km south of the surface trace of theMCT, indicating that an unmapped thrust fault might be accom-modating gradients in rock uplift in this valley. Farther west in theMarsyandi valley, changes in landscape morphology occur moregradually, which is consistent with a more broadly distributed strainfield. In the Marsyandi drainage, the upper boundary of thephysiographic transition is nearly coincident with the mappedtrace of the MCT, indicating that strands of the MCT itself mightbe important in accommodating modern rock uplift gradients in
this valley10. These along-strike differences indicate spatial vari-ations in how recent deformation is accommodated along theHimalayan front. Nonetheless, the physiographic data from centralNepal are all broadly consistent with independent evidence forrecent deformation in the region including young, brittle shearzones near the MCT in the Marsyandi valley10 and sharp disconti-nuities in the patterns of Late Miocene–Quaternary 40Ar–39Ar andfission-track mineral cooling ages throughout central Nepal9,13,14.
Unfortunately, although the physiographic transition is sharpand well defined in the Burhi Gandaki river, the poor quality ofbedrock exposure makes it difficult to construct detailed structuralmaps to determine unequivocally whether young, surface-breakingfaults are present. Here we report the results of a different approachto the problem based on deducing differences in erosional patternsfrom cosmogenic radionuclide data in detrital sediments. Wemeasured concentrations of 10Be produced in situ in modernsediment from eight small tributaries to the Burhi Gandaki as aproxy for millennial timescale erosion rates in each catchment. Theconcentration of 10Be in quartz, interpreted with nuclide pro-duction rates scaled for altitude, latitude and local topography,enables erosion rates to be quantified at the outcrop scale15. At thebasin scale, 10Be concentrations in sediment have been shown torepresent reliable basin-average erosion rates in a variety of climaticand tectonic settings15–19. We use the spatial pattern of erosion ratesfrom the Burhi Gandaki tributaries to delineate discontinuities inrock uplift rates across the range front. Field observations indicatethat hillslope angles might approach threshold values near thephysiographic transition, so landscape response should be rapid:as bedrock rivers adjust their incision rates in response to spatialvariations in rock uplift, we expect the hillslopes to match thisincision rate by landsliding to maintain their critical condition20,21.
The calculation of a basin-average erosion rate from 10Beconcentrations in sediment from steep, landslide-dominatedcatchments requires an assumption that the sediment collected atthe basin outlet is well mixed, and therefore that pulses of cosmo-genically ‘underexposed’ landslide-derived material are integratedinto the bulk sediment sample. Larger basins will more effectivelyintegrate these stochastic sediment pulses downstream, indicatingthat basin scale might be an important factor in controlling thefidelity of the cosmogenic signal22–24. Basins sampled for this studyhave drainage areas ranging from about 3 km2 to about 22 km2
(Table 1), a range in which preliminary numerical modellingsuggests a high probability that basin-average erosion rates will beclosely predicted—or only slightly underestimated—from detritalcosmogenic radionuclide concentrations24. Furthermore, thedrainage pattern in the Burhi Gandaki is trellised, with tributariesdraining narrow (about 2–5 km wide) catchments subparallel to thestructural grain of the orogen (Fig. 2a). Sediment from eachtributary therefore records an estimate of the basin-average erosionrate from a narrowly constrained tectonostratigraphic position.
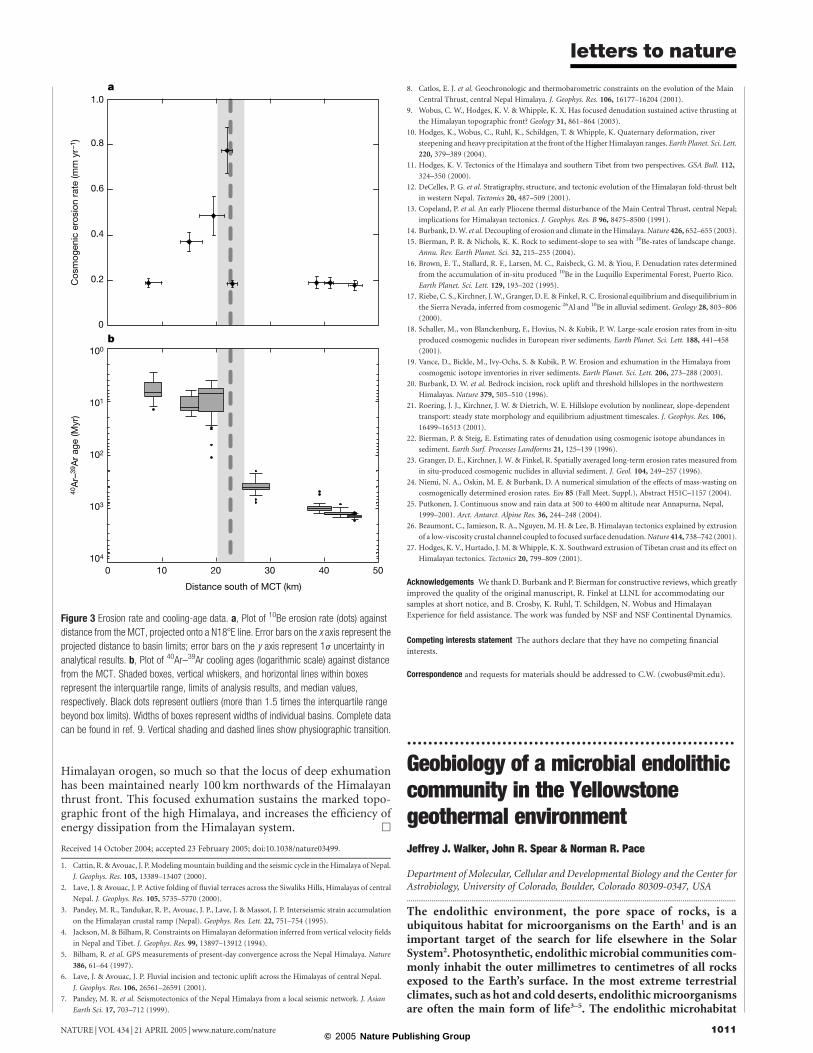
The 10Be data reveal a sharp discontinuity in erosion rates centredabout 23 km south of the MCT, within the zone of the physiographictransition as defined by independent methods9. To the south of thisdiscontinuity, erosion rates are uniform at about 0.2 mm yr21. Tothe north, erosion rates abruptly jump to about 0.8 mm yr21 andthen gradually decline to about 0.2 mm yr21 over a distance of10 km (Fig. 3a). 10Be concentrations (Table 1) indicate minimumexposure ages ranging from about 1 kyr to 3 kyr, indicating sharpspatial gradients in basin-average erosion rates over late Holocenetimescales. This break in erosion rates is not correlated with anymappable break in lithology: rocks to the north and south ofthis transition each comprise phyllites and schists of the LesserHimalayan sequence. Furthermore, there is no correlation betweenthe cosmogenically determined erosion rates and basin size, and thefourfold increase in erosion rates is larger than any bias that mightbe predicted by preliminary modelling accounting for under-sampling of landslide-derived material in small catchments24. The
Figure 1 Geological setting. a, Regional geological map showing major tectonic structures
and river systems. Dash–dotted lines: MAR, Marsyandi river; BG, Burhi Gandaki river; TR,
Trisuli river. STF, South Tibetan fault. Dashed grey line shows the lower boundary of the
physiographic transition where it is well defined (see the text for explanation). The grey box
indicates the location of Fig. 2a. A–A0indicates the location of schematic cross section in
b. b, Schematic cross section across central Nepal, showing the ramp in the MHT and the
inferred projection of a fault at the physiographic transition (PT).
letters to nature
NATURE | VOL 434 | 21 APRIL 2005 | www.nature.com/nature 1009© 2005 Nature Publishing Group
spatial trend in 10Be erosion rates therefore corroborates ourinterpretations of tectonics based solely on landscape morphology,and allows us to constrain more narrowly the locus of active thrustfaulting in the Burhi Gandaki valley.
The discontinuity in short-term erosion rates is also co-locatedwith a prominent break in long-term cooling rates from thermo-chronology (Fig. 3b): to the north of the physiographic transition,muscovite 40Ar–39Ar cooling ages are young (Cenozoic), whereasthey are substantially older to the south (Palaeozoic–Proterozoic)9.Calculation of long-term exhumation rates from these data wouldrequire a detailed thermal model accounting for lateral advection ofrock and temporal variations in the subsurface thermal structure.Although this calculation is beyond the scope of this study, theabrupt discontinuity in cooling ages is a robust finding thatcorroborates our interpretation of a surface-breaking thrust faultat the physiographic transition. Furthermore, the thermochrono-logic data provide the additional constraint that active thrustfaulting has persisted at least long enough to create a substantialdiscontinuity in the total depth of exhumation from north to south.
The presence of a tectonically significant, thrust-sense faultzone at the physiographic transition, as implied by the spatial
coincidence of breaks in short-term (cosmogenic) and long-term(40Ar–39Ar) erosion rates, is consistent with field observations ofbrittle deformational fabrics parallel to the northward-dippingfoliations in the Lesser Himalayan Sequence9. Physiographic datafrom along strike suggest that this fault zone extends eastwards tothe Trisuli valley, maintaining its position substantially south of theMCT. To the west of the Burhi Gandaki valley, the orientation ofthe physiographic transition and the more diffuse gradients inlandscape morphology suggest that this fault zone becomes morebroadly distributed in the Marsyandi valley, and might correspondto recent activity within the MCT zone10,14.
We speculate that the origin of this fault zone might be intimatelytied to the presence of strong precipitation gradients across thecentral Nepalese Himalaya. Focused monsoonal precipitation is welldocumented on the southern flank of the Nepalese Himalaya14,25
and has been posited to drive localized tectonic uplift by removingmass from the top of an extruding ductile channel26,27. Although theenergy driver for this channel extrusion is gravitational potentialenergy from the Tibetan plateau, erosion must be important indetermining where the energy is dissipated. Our data suggest theremight be a dynamic feedback between climate and tectonics in the
Figure 2 Sampling locations and study area physiography. a, Sample collection points
(white dots) and drainage basins (black outlines). The dashed grey line shows approximate
trace of the physiographic transition. The yellow rectangle delineates the boundaries of
the swath profile shown in b. b, Mean (black line), minimum and maximum elevations
(dashed grey lines) along a 20-km-wide swath profile oriented orthogonal to the strike of
the range. The vertical grey line marks the base of the physiographic transition (see text).
Black bars show the extent of alluvial fill terraces (T), knickpoints on Burhi Gandaki
tributaries (K) and the zone of increasing steepness on the Burhi Gandaki trunk stream (S).
Table 1 Basin characteristics and cosmogenic erosion rate data
Sample Distance from MCT(km)*
Drainage area(km2)
Mean slope(deg)†
Elevation range(m)‡
Mass of quartz(g)
[10Be](103 atoms g21)
Erosion rate(mm yr21)
...................................................................................................................................................................................................................................................................................................................................................................
01WBS5 7.0–10.0 (7.5) 3.4 28.4 797–2,372 58.64 42.1 ^ 2.3 0.19 ^ 0.0201WBS6 13.5–17.5 (15.0) 18.4 30.8 604–3,158 79.32 27.8 ^ 1.6 0.37 ^ 0.0401WBS7 17.0–21.5 (19.5) 17.5 24.6 533–2,455 69.25 13.9 ^ 1.7 0.48 ^ 0.0803WBS1 21.0–23.0 (22.0) 3.2 21.4 643–1,325 150.90 6.0 ^ 0.5 0.77 ^ 0.1003WBS2 22.0–24.0 (23.0) 3.9 17.6 723–1,475 150.24 27.9 ^ 0.9 0.19 ^ 0.0101WBS3 37.0–41.5 (38.5) 16.7 22.0 413–1,412 67.14 21.9 ^ 1.9 0.19 ^ 0.0301WBS2 40.0–46.0 (41.0) 22.4 21.9 370–1,574 70.03 23.4 ^ 1.8 0.19 ^ 0.0201WBS1 44.5–47.0 (45.5) 10.5 21.4 348–1,670 84.88 25.4 ^ 1.7 0.18 ^ 0.02...................................................................................................................................................................................................................................................................................................................................................................
Errors are ^1j.*Distance to the northern and southern edges of the basin, rounded to the nearest 0.5 km and projected onto a line oriented N188E. Numbers in parenthesis are distances to the basin outlet.†Slopes calculated from a 3 £ 3 moving window over 90-m resolution digital elevation model (DEM).‡Production rates calculated pixel by pixel by using 90-m DEM.
letters to nature
NATURE | VOL 434 | 21 APRIL 2005 | www.nature.com/nature1010© 2005 Nature Publishing Group
Himalayan orogen, so much so that the locus of deep exhumationhas been maintained nearly 100 km northwards of the Himalayanthrust front. This focused exhumation sustains the marked topo-graphic front of the high Himalaya, and increases the efficiency ofenergy dissipation from the Himalayan system. A
Received 14 October 2004; accepted 23 February 2005; doi:10.1038/nature03499.
1. Cattin, R. & Avouac, J. P. Modeling mountain building and the seismic cycle in the Himalaya of Nepal.
J. Geophys. Res. 105, 13389–13407 (2000).
2. Lave, J. & Avouac, J. P. Active folding of fluvial terraces across the Siwaliks Hills, Himalayas of central
Nepal. J. Geophys. Res. 105, 5735–5770 (2000).
3. Pandey, M. R., Tandukar, R. P., Avouac, J. P., Lave, J. & Massot, J. P. Interseismic strain accumulation
on the Himalayan crustal ramp (Nepal). Geophys. Res. Lett. 22, 751–754 (1995).
4. Jackson, M. & Bilham, R. Constraints on Himalayan deformation inferred from vertical velocity fields
in Nepal and Tibet. J. Geophys. Res. 99, 13897–13912 (1994).
5. Bilham, R. et al. GPS measurements of present-day convergence across the Nepal Himalaya. Nature
386, 61–64 (1997).
6. Lave, J. & Avouac, J. P. Fluvial incision and tectonic uplift across the Himalayas of central Nepal.
J. Geophys. Res. 106, 26561–26591 (2001).
7. Pandey, M. R. et al. Seismotectonics of the Nepal Himalaya from a local seismic network. J. Asian
Earth Sci. 17, 703–712 (1999).
8. Catlos, E. J. et al. Geochronologic and thermobarometric constraints on the evolution of the Main
Central Thrust, central Nepal Himalaya. J. Geophys. Res. 106, 16177–16204 (2001).
9. Wobus, C. W., Hodges, K. V. & Whipple, K. X. Has focused denudation sustained active thrusting at
the Himalayan topographic front? Geology 31, 861–864 (2003).
10. Hodges, K., Wobus, C., Ruhl, K., Schildgen, T. & Whipple, K. Quaternary deformation, river
steepening and heavy precipitation at the front of the Higher Himalayan ranges. Earth Planet. Sci. Lett.
220, 379–389 (2004).
11. Hodges, K. V. Tectonics of the Himalaya and southern Tibet from two perspectives. GSA Bull. 112,
324–350 (2000).
12. DeCelles, P. G. et al. Stratigraphy, structure, and tectonic evolution of the Himalayan fold-thrust belt
in western Nepal. Tectonics 20, 487–509 (2001).
13. Copeland, P. et al. An early Pliocene thermal disturbance of the Main Central Thrust, central Nepal;
implications for Himalayan tectonics. J. Geophys. Res. B 96, 8475–8500 (1991).
14. Burbank, D. W. et al. Decoupling of erosion and climate in the Himalaya. Nature 426, 652–655 (2003).
15. Bierman, P. R. & Nichols, K. K. Rock to sediment-slope to sea with 10Be-rates of landscape change.
Annu. Rev. Earth Planet. Sci. 32, 215–255 (2004).
16. Brown, E. T., Stallard, R. F., Larsen, M. C., Raisbeck, G. M. & Yiou, F. Denudation rates determined
from the accumulation of in-situ produced 10Be in the Luquillo Experimental Forest, Puerto Rico.
Earth Planet. Sci. Lett. 129, 193–202 (1995).
17. Riebe, C. S., Kirchner, J. W., Granger, D. E. & Finkel, R. C. Erosional equilibrium and disequilibrium in
the Sierra Nevada, inferred from cosmogenic 26Al and 10Be in alluvial sediment. Geology 28, 803–806
(2000).
18. Schaller, M., von Blanckenburg, F., Hovius, N. & Kubik, P. W. Large-scale erosion rates from in-situ
produced cosmogenic nuclides in European river sediments. Earth Planet. Sci. Lett. 188, 441–458
(2001).
19. Vance, D., Bickle, M., Ivy-Ochs, S. & Kubik, P. W. Erosion and exhumation in the Himalaya from
cosmogenic isotope inventories in river sediments. Earth Planet. Sci. Lett. 206, 273–288 (2003).
20. Burbank, D. W. et al. Bedrock incision, rock uplift and threshold hillslopes in the northwestern
Himalayas. Nature 379, 505–510 (1996).
21. Roering, J. J., Kirchner, J. W. & Dietrich, W. E. Hillslope evolution by nonlinear, slope-dependent
transport: steady state morphology and equilibrium adjustment timescales. J. Geophys. Res. 106,
16499–16513 (2001).
22. Bierman, P. & Steig, E. Estimating rates of denudation using cosmogenic isotope abundances in
sediment. Earth Surf. Processes Landforms 21, 125–139 (1996).
23. Granger, D. E., Kirchner, J. W. & Finkel, R. Spatially averaged long-term erosion rates measured from
in situ-produced cosmogenic nuclides in alluvial sediment. J. Geol. 104, 249–257 (1996).
24. Niemi, N. A., Oskin, M. E. & Burbank, D. A numerical simulation of the effects of mass-wasting on
cosmogenically determined erosion rates. Eos 85 (Fall Meet. Suppl.), Abstract H51C–1157 (2004).
25. Putkonen, J. Continuous snow and rain data at 500 to 4400 m altitude near Annapurna, Nepal,
1999–2001. Arct. Antarct. Alpine Res. 36, 244–248 (2004).
26. Beaumont, C., Jamieson, R. A., Nguyen, M. H. & Lee, B. Himalayan tectonics explained by extrusion
of a low-viscosity crustal channel coupled to focused surface denudation. Nature 414, 738–742 (2001).
27. Hodges, K. V., Hurtado, J. M. & Whipple, K. X. Southward extrusion of Tibetan crust and its effect on
Himalayan tectonics. Tectonics 20, 799–809 (2001).
Acknowledgements We thank D. Burbank and P. Bierman for constructive reviews, which greatly
improved the quality of the original manuscript, R. Finkel at LLNL for accommodating our
samples at short notice, and B. Crosby, K. Ruhl, T. Schildgen, N. Wobus and Himalayan
Experience for field assistance. The work was funded by NSF and NSF Continental Dynamics.
Competing interests statement The authors declare that they have no competing financial
interests.
Correspondence and requests for materials should be addressed to C.W. ([email protected]).
..............................................................
Geobiology of a microbial endolithiccommunity in the Yellowstonegeothermal environmentJeffrey J. Walker, John R. Spear & Norman R. Pace
Department of Molecular, Cellular and Developmental Biology and the Center forAstrobiology, University of Colorado, Boulder, Colorado 80309-0347, USA.............................................................................................................................................................................
The endolithic environment, the pore space of rocks, is aubiquitous habitat for microorganisms on the Earth1 and is animportant target of the search for life elsewhere in the SolarSystem2. Photosynthetic, endolithic microbial communities com-monly inhabit the outer millimetres to centimetres of all rocksexposed to the Earth’s surface. In the most extreme terrestrialclimates, such as hot and cold deserts, endolithic microorganismsare often the main form of life3–5. The endolithic microhabitat
Figure 3 Erosion rate and cooling-age data. a, Plot of 10Be erosion rate (dots) against
distance from the MCT, projected onto a N188E line. Error bars on the x axis represent the
projected distance to basin limits; error bars on the y axis represent 1j uncertainty in
analytical results. b, Plot of 40Ar–39Ar cooling ages (logarithmic scale) against distance
from the MCT. Shaded boxes, vertical whiskers, and horizontal lines within boxes
represent the interquartile range, limits of analysis results, and median values,
respectively. Black dots represent outliers (more than 1.5 times the interquartile range
beyond box limits). Widths of boxes represent widths of individual basins. Complete data
can be found in ref. 9. Vertical shading and dashed lines show physiographic transition.
letters to nature
NATURE | VOL 434 | 21 APRIL 2005 | www.nature.com/nature 1011© 2005 Nature Publishing Group