
Active-Crop Sensor Calibration Using the Virtual-Reference Concept K. H. Holland (Holland...
34
Active-Crop Sensor Calibration Using the Virtual-Reference Concept K. H. Holland (Holland Scientific) J. S. Schepers (USDA-ARS, retired) 8 th ECPA Conference 201
-
Upload
angelina-nichols -
Category
Documents
-
view
239 -
download
5
Transcript of Active-Crop Sensor Calibration Using the Virtual-Reference Concept K. H. Holland (Holland...

Active-Crop Sensor Calibration Using the
Virtual-Reference Concept
K. H. Holland (Holland Scientific)
J. S. Schepers (USDA-ARS, retired)
8th ECPA Conference 2011

“N-Rich” Reference
• Postage-stamp calibration
• Ramped calibration strip
• Randomized calibration block(field strips)
check
N-richother N rates

Modified Postage Stamp
• Combine-width plots
• Randomized except check plot
• Each block of treatments should have minimal soil variability
• Repeated replications
check

Modified Calibration Ramp
• Standard ramp of plots
• No randomization
• Each N rate in the ramp has a nearby check and adequate N reference
• Could randomize N rates in the ramp strip
check
N-Rich

Commercial applicators and large producers - - TELL US :
• N-rich strips are problematic– May be hard to locate (legal problems)– Need to move each year
• Can not expect operators to understand how the algorithm and sensor calibration work
• Need a “turn-key” approach that does not require N-rich strip or highly-skilled operator
• Algorithm needs to be simple, versatile, and easy to adapt for local conditions

Algorithms
1) based on predicted yield potential(Oklahoma State University) (GreenSeeker)
2) based on producer-set minimum and maximum N rates (Europe & Missouri)
3) based on extension of crop N-response function (Holland and Schepers)
Note: All algorithms use sensor data that are normalized to “healthy crops” .

In-Season N Management
Crop vigor during the growing season
is proportional to
yield at harvest

How to Characterize Healthy Crops ?
• N-Rich Strip (or Ramp Calibration Strip)average (as with plot studies)
programmed (highest 3 consecutive seconds)
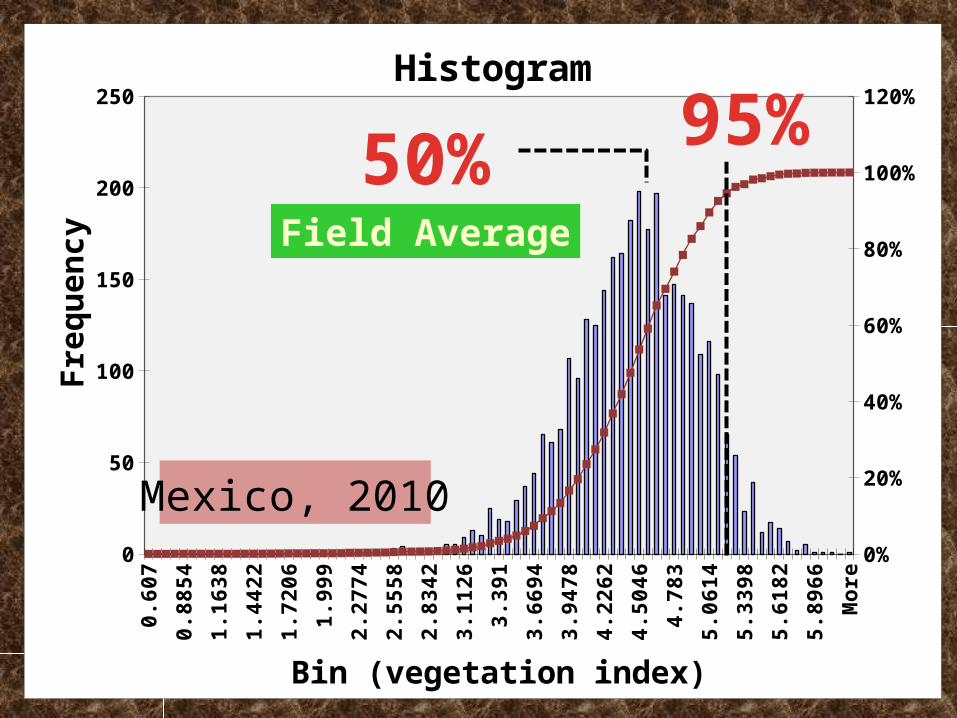
• Normal Field Transectsidentify healthy plants from frequency distribution of all plants (histogram) (MS Excel)


3-second Running Average
0
1
2
3
4
5
6
1 459 917 1375 1833 2291 2749 3207 3665 4123 4581 5039 5497 5955 6413
Number of Readings
CI
red
-ed
ge
Mexico - White Corn, 2010 Crop Circle
600 m @ ~6 kmph

0.6
07
0.8
15
81
.02
46
1.2
33
41
.44
22
1.6
51
1.8
59
82
.06
86
2.2
77
42
.48
62
2.6
95
2.9
03
83
.11
26
3.3
21
43
.53
02
3.7
39
3.9
47
84
.15
66
4.3
65
44
.57
42
4.7
83
4.9
91
85
.20
06
5.4
09
45
.61
82
5.8
27
6.0
35
8
0
50
100
150
200
250
0%
20%
40%
60%
80%
100%
120%
Histogram
Bin (vegetation index)
Fre
qu
en
cy
Mexico, 2010
95%“Happy Corn”

Gustavo Field
0
1
2
3
4
5
6
7
1 453 905 1357 1809 2261 2713 3165 3617 4069 4521 4973 5425 5877 6329
Number of Readings
CI
red
-ed
ge
Mexico - White Corn, 2010
600 m @ ~6 kmph
Crop Circle
95 Percentile
3-second Running Average = 5.057
95 Percentile = 5.206
3% lower
0.6
07
0.8
15
81
.02
46
1.2
33
41
.44
22
1.6
51
1.8
59
82
.06
86
2.2
77
42
.48
62
2.6
95
2.9
03
83
.11
26
3.3
21
43
.53
02
3.7
39
3.9
47
84
.15
66
4.3
65
44
.57
42
4.7
83
4.9
91
85
.20
06
5.4
09
45
.61
82
5.8
27
6.0
35
8
0
50
100
150
200
250
0%
20%
40%
60%
80%
100%
120%Histogram
Bin (vegetation index)
Fre
qu
en
cy
Mexico, 2010
95%50%Field Average

0.6
07
0.8
85
41
.16
38
1.4
42
21
.72
06
1.9
99
2.2
77
42
.55
58
2.8
34
23
.11
26
3.3
91
3.6
69
43
.94
78
4.2
26
24
.50
46
4.7
83
5.0
61
45
.33
98
5.6
18
25
.89
66
Mo
re
0
50
100
150
200
250
0%
20%
40%
60%
80%
100%
120%Histogram
Bin (vegetation index)
Fre
qu
en
cy
95%50%
4.47
5.21SI = = 0.85

N CreditsPreplant N
EONRProducer Optimum
N Accumulation(based on growth stage)
Sufficiency Index
Back-Off Strategy SI to start cutback SI to cut-off
Algorithm
SpatialSoil / Topography
Adjustment0
2
4
6
8
10
12
14
0 50 100 150 200 250 300
Fertilizer N Rate, kg/ha
Yie
ld, M
g/h
a
FieldReference

Holland K.H. and J.S. Schepers. 2010. Derivation of a variable rate nitrogen application model for in-season fertilization of corn. Agronomy Journal 102:1415-1424.
S e e
Nappl = ( Nopt – Ncred )
√
√ (1 – SI)
∆ SI
Farmer Rateor NEONR

6 3310
20
40
60
80
100
120
140
160
180
200
Distance or Time
N ra
te A
pplie
d, k
g/ha
Mexico, 2010

6 3310
20
40
60
80
100
120
140
160
180
200
Distance or Time
N ra
te A
pplie
d, k
g/ha
Mexico, 2010
Uniform Rate

N Rates (0, 50, 100, 150, 200 kg/ha)

OptRx
Check Plot
SoybeanPrevious
Year

Histogram
0
50
100
150
200
250
0.27
1
0.38
43142
86
0.49
76285
71
0.61
09428
57
0.72
42571
43
0.83
75714
29
0.95
08857
14
1.06
42
1.17
75142
86
1.29
08285
71
1.40
41428
57
1.51
74571
43
1.63
07714
29
1.74
40857
14
1.85
74
1.97
07142
86
2.08
40285
71
2.19
73428
57
CI red-edge
Fre
qu
ency
0%
20%
40%
60%
80%
100%
120%Frequency
Cumulative %
95 Percentile

3-Second Running Average
0.000
0.200
0.400
0.600
0.800
1.0001.200
1.400
1.600
1.800
2.000
1 372 743 1114 1485 1856 2227 2598 2969 3340 3711 4082 4453 4824
Sample Number
CI
red
-ed
ge
CI red-edge values : 95 percentile 1.9853-second average 1.889
5% lower
GreenSeeker

0
20
40
60
80
100
120
140
160
180
200
1 3 5 7 9 11 13 15 17 19 21 23 25 27 29 31
200 N
150 N
100 N
50 N
0 N
Chlorophyll Index Bins (0.7 to 2.2)
Oc
cu
rre
nc
eIrrigated Corn - 2009
V9 Growth Stage
95 percentile

1 2 3 4 5 6 7 8 9 10 11 12 13 14 15 16 17 18 19 20 21 22 23 240
10
20
30
40
50
60
70
80
90
100
Drive First
Drive & Apply
Plot Order (400 m)
N R
ate
(kg
/ha)
V12
Virtual Reference Strip (0-200 kg N/ha preplant)
check
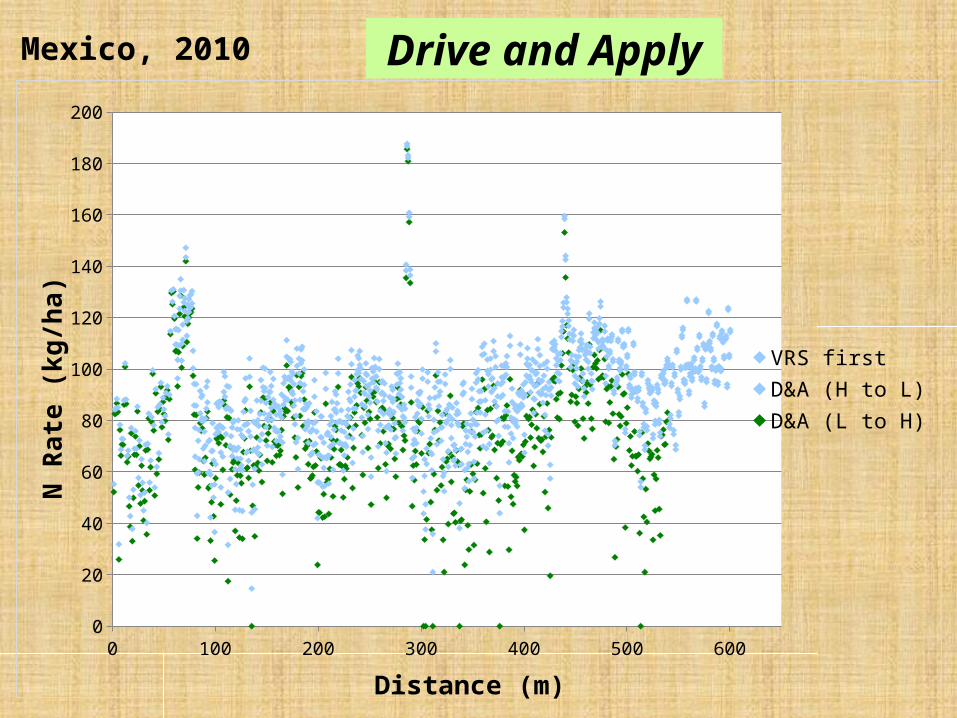
0 100 200 300 400 500 6000
20
40
60
80
100
120
140
160
180
200
VRS firstD&A (H to L)D&A (L to H)
Distance (m)
N R
ate
(kg/
ha)
Mexico, 2010 Drive and Apply

There’s Probably a Lot More Information in a Histogram than We Realize !
• Where’s it at ?
• How to get it out ?

Mexico 2010 - Irrigated Corn
V5 Growth Stage
SI = 0.7
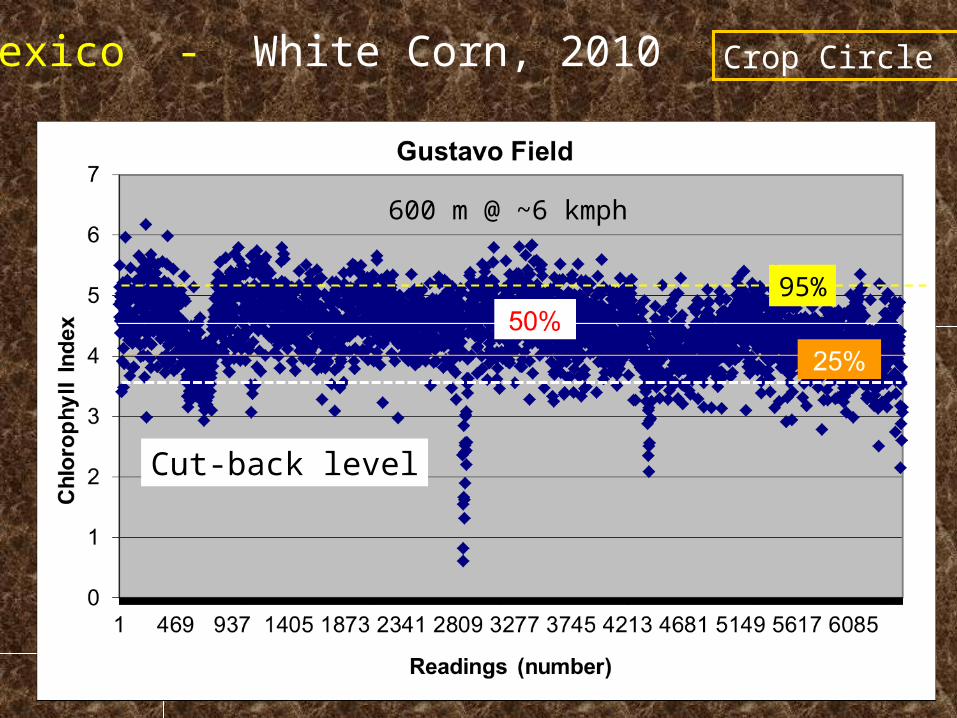
Mexico - White Corn, 2010
600 m @ ~6 kmph
Crop Circle
95%
Cut-back level

Conclusions• The virtual reference concept offers producers a convenient
approach to quantify the vigor and chlorophyll status of crops for in-season N applications.
• Histograms of active sensor data and related analyses offer a quick glimpse of where to focus management efforts.
New sensors and tools will be
needed to help fine tune
management decisions.


Historic Perspective
• N-Rich treatment was initially used to normalize data from plot studies and allow leaf N concentration comparisons across time, fields, cultivars, etc. (1988)
• Extended to normalization concept to SPAD meters. (1990)
• Adapted to field situations and N-Rich strips to accommodate crop canopy sensors. (~2000)

Historic Perspective
• N-Rich plot concept extended to postage stamp arrangement with multiple N rates. (2002)
• Ramped calibration strip with multiple N rates introduced. (2005)
• Need for active sensor calibration technique to accommodate commercial applications. (2007)