Action Research Deployment Teams March, 2007. Agenda Team reflection Completing the PDSA cycle ...
41
Action Research Action Research Deployment Teams Deployment Teams March, 2007 March, 2007
-
Upload
monica-candice-mccormick -
Category
Documents
-
view
218 -
download
1
Transcript of Action Research Deployment Teams March, 2007. Agenda Team reflection Completing the PDSA cycle ...

Action Research Action Research Deployment TeamsDeployment Teams
March, 2007March, 2007
AgendaAgendaTeam reflectionTeam reflectionCompleting the PDSA cycleCompleting the PDSA cycleTeam planning for continuous Team planning for continuous
improvementimprovement

Reflection…Reflection…Thinking about PDSA as a Thinking about PDSA as a
school improvement model this school improvement model this year…year… What has worked well?What has worked well? What did you learn?What did you learn? What would you do differently What would you do differently
next year?next year?

Where did we Where did we leave off again?leave off again?
A quick review of A quick review of last sessionlast session

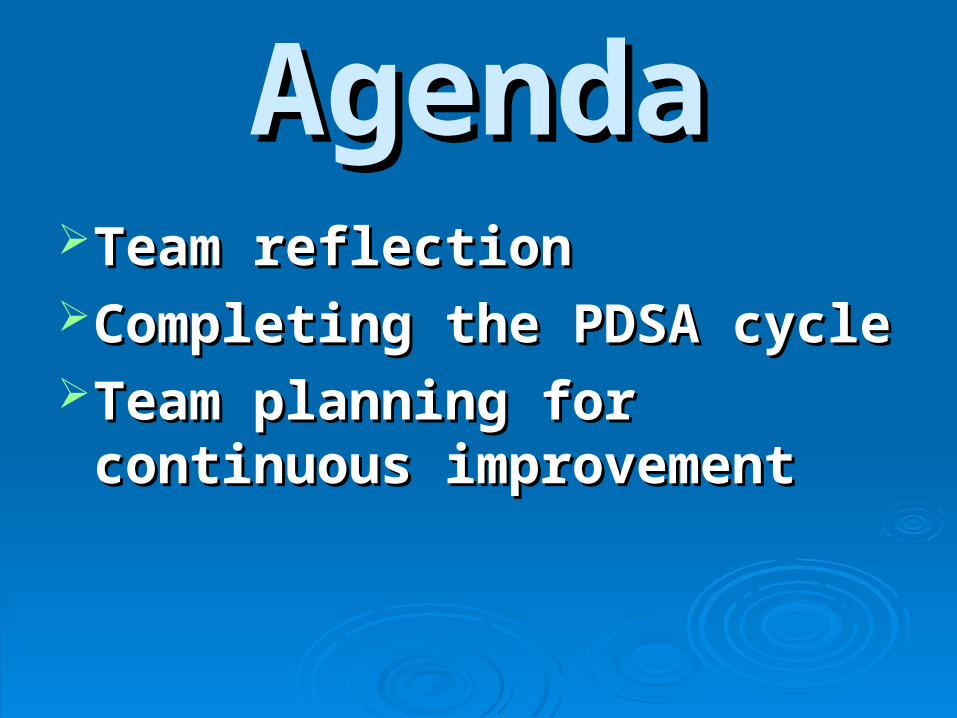
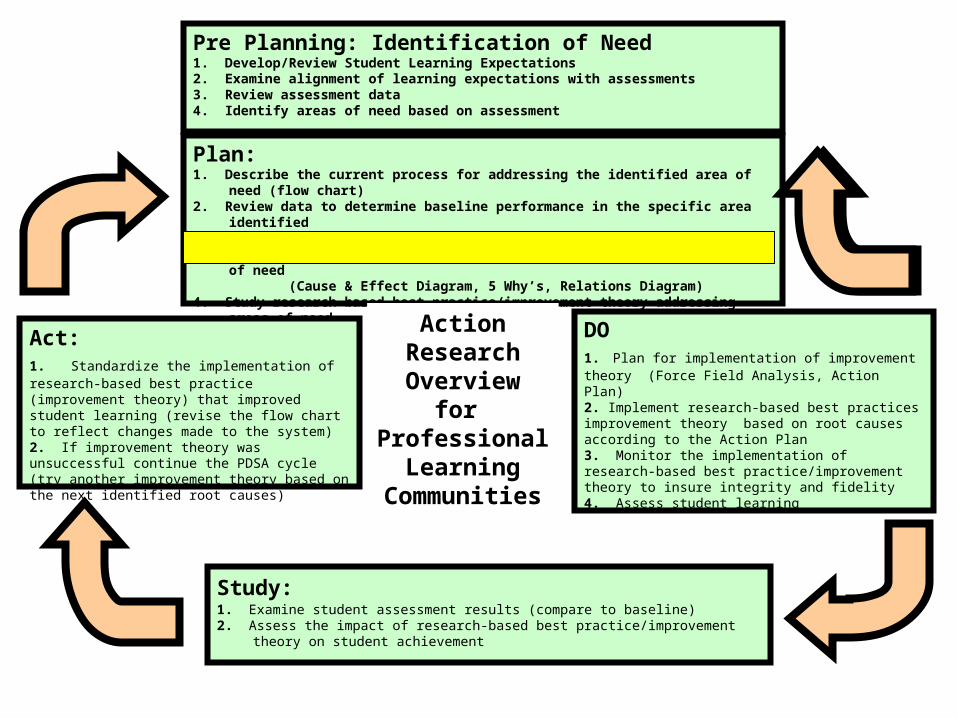
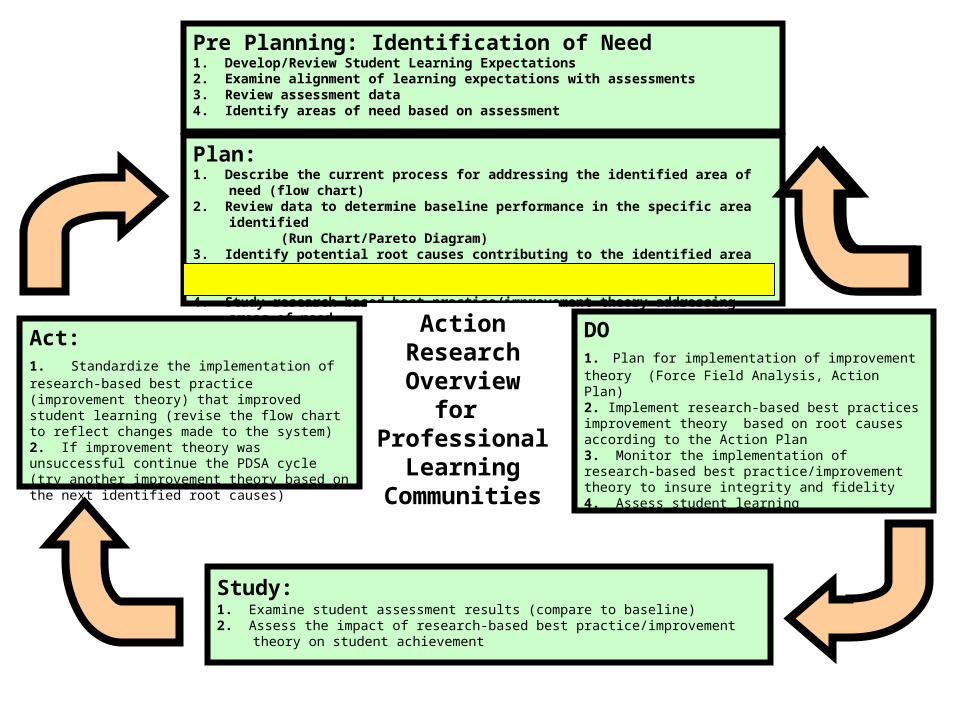
Pre Planning: Identification of Need1. Develop/Review Student Learning Expectations2. Examine alignment of learning expectations with assessments3. Review assessment data4. Identify areas of need based on assessment
Plan:1. Describe the current process for addressing the identified area of need
(flow chart) 2. Review data to determine baseline performance in the specific area
identified (Run Chart/Pareto Diagram)3. Identify potential root causes contributing to the identified area of need (Cause & Effect Diagram, 5 Why’s, Relations Diagram)4. Study research-based best practice/improvement theory addressing areas
of need
DO1. Plan for implementation of improvement theory (Force Field Analysis, Action Plan)2. Implement research-based best practices improvement theory based on root causes according to the Action Plan3. Monitor the implementation of research-based best practice/improvement theory to insure integrity and fidelity4. Assess student learning
Study:1. Examine student assessment results (compare to baseline)2. Assess the impact of research-based best practice/improvement theory on
student achievement
Act:1. Standardize the implementation of research-based best practice (improvement theory) that improved student learning (revise the flow chart to reflect changes made to the system)2. If improvement theory was unsuccessful continue the PDSA cycle (try another improvement theory based on the next identified root causes)
Action ResearchOverview
for Professional
Learning Communitie
s

In-Process Measure Example

Estimation Check Sheet Weekly
Class Errors
Hour 1 - Mr. Albert
Strategy 1 2 3 4 5 6
Total1-6
Week12-Sep
19-Sep
29-Sep 3-Oct
10-Oct 17-Oct
Addition 2 2 1 1 0 0 6
Subtraction 2 2 3 1 2 1 11
Multiplication 7 8 7 8 7 7 44
Division 10 11 10 11 12 10 64
Application 11 11 10 11 12 12 67
28 students
Total Errors 32 34 31 32 33 30 192
Number of Students 28 28 28 28 28 28

Estimation Check SheetHour 1 - Class Errors
15
20
25
30
35
40
9/12 9/19 9/26 10/3 10/10 10/17
To
tal N
um
ber
of E
rro
rs

Estimation Check Sheet SkillsWeeks 1- 6
67 64 44 11 6 192
35%
68%
91%
97%100%
0
20
40
60
80
100
120
140
160
180
Application Division Multiplication Subtraction Addition Total N
Item
Nu
mb
e o
f E
rro
rs
0%
10%
20%
30%
40%
50%
60%
70%
80%
90%
100%
Per
cen
tag
e
This bar represents the total (N
) of your pareto.
Pre Planning: Identification of Need1. Develop/Review Student Learning Expectations2. Examine alignment of learning expectations with assessments3. Review assessment data4. Identify areas of need based on assessment
Plan:1. Describe the current process for addressing the identified area of need
(flow chart) 2. Review data to determine baseline performance in the specific area
identified (Run Chart/Pareto Diagram)3. Identify potential root causes contributing to the identified area of need (Cause & Effect Diagram, 5 Why’s, Relations Diagram)4. Study research-based best practice/improvement theory addressing areas
of need
DO1. Plan for implementation of improvement theory (Force Field Analysis, Action Plan)2. Implement research-based best practices improvement theory based on root causes according to the Action Plan3. Monitor the implementation of research-based best practice/improvement theory to insure integrity and fidelity4. Assess student learning
Study:1. Examine student assessment results (compare to baseline)2. Assess the impact of research-based best practice/improvement theory on
student achievement
Act:1. Standardize the implementation of research-based best practice (improvement theory) that improved student learning (revise the flow chart to reflect changes made to the system)2. If improvement theory was unsuccessful continue the PDSA cycle (try another improvement theory based on the next identified root causes)
Action ResearchOverview
for Professional
Learning Communitie
s

Identifying Root Cause!
• 3 Quality Tools–Cause and Effect Diagram
–Relations Diagram
–5 Whys


Relations Diagram
Pre Planning: Identification of Need1. Develop/Review Student Learning Expectations2. Examine alignment of learning expectations with assessments3. Review assessment data4. Identify areas of need based on assessment
Plan:1. Describe the current process for addressing the identified area of need
(flow chart) 2. Review data to determine baseline performance in the specific area
identified (Run Chart/Pareto Diagram)3. Identify potential root causes contributing to the identified area of need (Cause & Effect Diagram, 5 Why’s, Relations Diagram)4. Study research-based best practice/improvement theory addressing areas
of need
DO1. Plan for implementation of improvement theory (Force Field Analysis, Action Plan)2. Implement research-based best practices improvement theory based on root causes according to the Action Plan3. Monitor the implementation of research-based best practice/improvement theory to insure integrity and fidelity4. Assess student learning
Study:1. Examine student assessment results (compare to baseline)2. Assess the impact of research-based best practice/improvement theory on
student achievement
Act:1. Standardize the implementation of research-based best practice (improvement theory) that improved student learning (revise the flow chart to reflect changes made to the system)2. If improvement theory was unsuccessful continue the PDSA cycle (try another improvement theory based on the next identified root causes)
Action ResearchOverview
for Professional
Learning Communitie
s

Root Cause Identified
• Once root cause is identified… it is time to select a research-based improvement theory
• Consult books, articles, web sites, Curriculum Facilitators and other resources

What are we doing today?
Completing the PDSA Cycle

Pre Planning: Identification of Need1. Develop/Review Student Learning Expectations2. Examine alignment of learning expectations with assessments3. Review assessment data4. Identify areas of need based on assessment
Plan:1. Describe the current process for addressing the identified area of need
(flow chart) 2. Review data to determine baseline performance in the specific area
identified (Run Chart/Pareto Diagram)3. Identify potential root causes contributing to the identified area of need (Cause & Effect Diagram, 5 Why’s, Relations Diagram)4. Study research-based best practice/improvement theory addressing areas
of need
DO1. Plan for implementation of improvement theory (Force Field Analysis, Action Plan)2. Implement research-based best practices improvement theory based on root causes according to the Action Plan3. Monitor the implementation of research-based best practice/improvement theory to insure integrity and fidelity4. Assess student learning
Study:1. Examine student assessment results (compare to baseline)2. Assess the impact of research-based best practice/improvement theory on
student achievement
Act:1. Standardize the implementation of research-based best practice (improvement theory) that improved student learning (revise the flow chart to reflect changes made to the system)2. If improvement theory was unsuccessful continue the PDSA cycle (try another improvement theory based on the next identified root causes)
Action ResearchOverview
for Professional
Learning Communitie
s

Research Based Strategies• Research Based Strategies
• NCTM (National Council of Teachers of Mathematics)– Research & Standards
• Elementary and Middle School Mathematics– By John A Van De Walle– Professor Emeritus, Virginia Commonwealth
University, Mathematics Education Consultant

Implement the Improvement Theory
• If we… model and practice with contextual estimation problems a minimum of 30 minutes a week
• Then we…. will see an increase in the correct application of estimation skills
• As measured… by the weekly estimation check tests
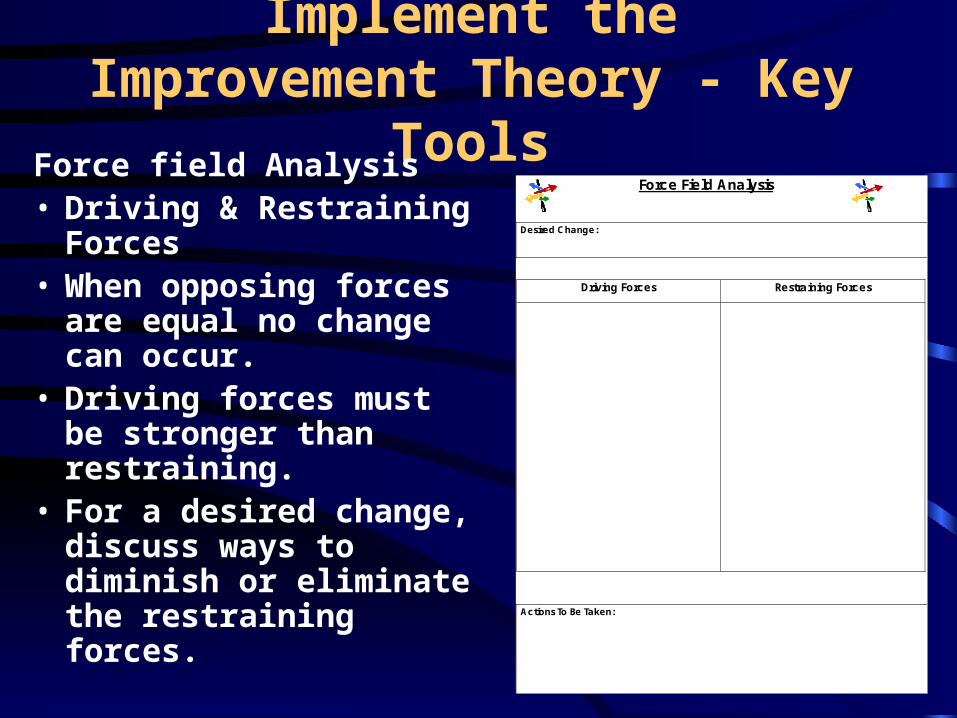
Implement the Improvement Theory - Key Tools
Force field Analysis • Driving & Restraining
Forces• When opposing forces are
equal no change can occur.
• Driving forces must be stronger than restraining.
• For a desired change, discuss ways to diminish or eliminate the restraining forces.
Force Field Analysis
Desired Change:
Driving Forces
Restraining Forces
Actions To Be Taken:

Status (complete or in-progress)
Person Responsible
Due Date
John Friday 10/20
Carrie Friday 10/20
All Friday 10/20
All
March 23rd and ongoing
Sue Friday 10/20
All 24-Oct
All December 5th
Begin Improvement Theory
Resume Check tests
Check Everyday Mathematics for contextual estimation problems
Look through Math Boxes for the possiblity of using with a little alteration
Create a bank of contextual application estimation problems
Develop to propose time schedule to include 30 minutes of practice per week for purposes of discussion
SMART Goal: During the 06-07 school year, students will accurately answer application estimation check test questions correctly 95% of the time.
Action Plan
Task/Activity
Call Bonnie Spaight regarding the GUESS boxes
Action Plan Example

Pre Planning: Identification of Need1. Develop/Review Student Learning Expectations2. Examine alignment of learning expectations with assessments3. Review assessment data4. Identify areas of need based on assessment
Plan:1. Describe the current process for addressing the identified area of need
(flow chart) 2. Review data to determine baseline performance in the specific area
identified (Run Chart/Pareto Diagram)3. Identify potential root causes contributing to the identified area of need (Cause & Effect Diagram, 5 Why’s, Relations Diagram)4. Study research-based best practice/improvement theory addressing areas
of need
DO1. Plan for implementation of improvement theory (Force Field Analysis, Action Plan)2. Implement research-based best practices improvement theory based on root causes according to the Action Plan3. Monitor the implementation of research-based best practice/improvement theory to insure integrity and fidelity4. Assess student learning
Study:1. Examine student assessment results (compare to baseline)2. Assess the impact of research-based best practice/improvement theory on
student achievement
Act:1. Standardize the implementation of research-based best practice (improvement theory) that improved student learning (revise the flow chart to reflect changes made to the system)2. If improvement theory was unsuccessful continue the PDSA cycle (try another improvement theory based on the next identified root causes)
Action ResearchOverview
for Professional
Learning Communitie
s
Next Steps?
Continue improving math estimation
Or
Select another area for improvement?

Discussion Items - Planning• SIP update process
– Gather information from SIP goal teams– Update SMART goal/actions if needed
• Rotation of leadership team (BLT, QL, ARDT)
• How to look at data?– Over time – Cohort groups– Sub groups)

Growth in National Grade EquivalentCoHort Group - Regular Education Students
I TBS Testing Fall of 2002-2003-2004
0
0.5
1
1.5
2
2.5
3
3.5
4
4.5
Comprehension Language Total Math Total Computation
ITB
S
Nati
on
al G
rad
e E
qu
ivale
nt
Expected growth is 2 years.
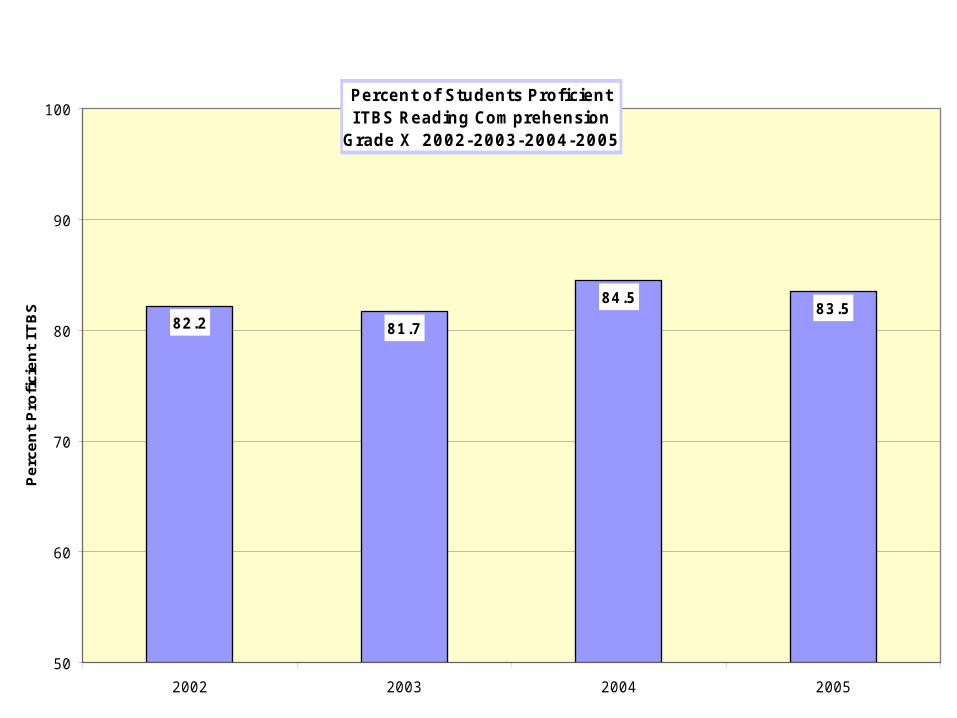
Percent of Students ProficientI TBS Reading Comprehension
Grade X 2002-2003-2004-2005
82.2 81.7
84.583.5
50
60
70
80
90
100
2002 2003 2004 2005
Perc
en
t P
rofi
cien
t IT
BS


Team TimeTeam Time Use the Use the
planning toolplanning tool Determine next Determine next
stepssteps Ready to update Ready to update
the SIP?the SIP? Leave with a Leave with a
plan!plan!

Share Some Highlights…Share Some Highlights…Be prepared to share some of Be prepared to share some of
the highlights of your team the highlights of your team discussiondiscussion Were there any particular items Were there any particular items
that the team struggled with?that the team struggled with? Were there any “a ha” moments?Were there any “a ha” moments? How complete is your plan?How complete is your plan?

Next steps…• Use the “Organizing and Planning for
Continuous Improvement” tool • Prepare to update your SIP (next session
team time will be given)• Set and communicate direction!
• Please complete the table evaluation for today’s session