Action Plan for Solid Waste Management
56
ACTION PLAN FOR SOLID WASTE MANAGEMENT Mysore City Corporation Mysore
Transcript of Action Plan for Solid Waste Management

ACTION PLAN FOR SOLID WASTE MANAGEMENT
Mysore City Corporation
Mysore

1
Contents Page
Contents Page............................................................................................................................ 1
List of Tables ............................................................................................................................ 3
List of Maps .............................................................................................................................. 3
Part 1: Status Report ................................................................................................................. 4
1. Introduction .................................................................................................................. 4
2. Report objectives and Methodology............................................................................. 4
3. Profile of Mysore.......................................................................................................... 5
3.1 Overall data about the city ................................................................................... 5
3.2 Ward profile ......................................................................................................... 6
4. Current SWM practise ................................................................................................ 15
4.1 Overview............................................................................................................ 15
4.2 SWM staffing ..................................................................................................... 16
4.3 Vehicle data........................................................................................................ 17
4.4 Privatisation........................................................................................................ 18
4.5 Financial aspects ................................................................................................ 19
4.6 Biomedical and industrial wastes....................................................................... 19
4.7 Processing and disposal...................................................................................... 20
4.8 Special efforts and innovations .......................................................................... 20
4.9 Waste management support facilities................................................................. 20
4.10 Activities undertaken under Nirmal Nagara programme ................................... 21
5. Waste Estimates.......................................................................................................... 21
5.1 Normative assessment of waste generation........................................................ 21
5.2 Waste transported per day.................................................................................. 21
5.3 Quantity of waste generated in Mysore.............................................................. 22
Part II: Detailed Action Plan............................................................................................ 23
6. Strategy for SWM for Mysore.................................................................................... 23
7. Detailed plans ............................................................................................................. 23
7.1 Primary collection of waste................................................................................ 28
7.2 Secondary storage sites ...................................................................................... 34
7.3 Plan for transport of wastes................................................................................ 35
7.4 Biomedical and industrial waste handling ......................................................... 36
7.5 Processing and disposal plan.............................................................................. 36
7.6 IEC Activities in Mysore.................................................................................... 37
7.7 Redeployment of existing staff and vehicles...................................................... 38
2
7.8 Private sector participation................................................................................. 39
8. Financial aspects......................................................................................................... 40
8.1 Total investments required ................................................................................. 40
8.2 Cost of Municipal solid waste management ...................................................... 41
Annexure
1. SWM Command Areas ………………………………………………………………42
2. List of RWA's & SHG"s ..……………………………………………………………47
3. P.K. Deployment…………………………………………………………………
4. List of Bulk Generators …………………………………………………………

3
List of Tables
1. Salient data about Mysore city
2. Growth in Population and Population density
3. Ward wise population and households
4. Ward wise waste generating establishments
5. Slums of Mysore
6. Ward wise details on dustbin infrastructure
7. Ward wise details of road length and drain length
8. Source wise waste generation table
9 Staff available for SWM
10 Wards managed by different Sanitary Inspectors
11 List of vehicles used for Solid Waste Management
12 Details of Solid Waste Management contracts
13 Budget of the City Corporation
14 Expenditure on Solid waste Management
15 Waste transported per day
16 Requirement of Street Sweeping staff
17 Sweeping managed by Municipal staff and task based contracts
18 Tools required for Street Sweeping staff
19 Ward wise Resident Welfare Association’s List & SHG’s List
20 Primary collection of waste (Non slum Households)
21 Requirement of Primary collection equipments
22 Staff and equipment deployment for slums
23 Collection group for slum households
24 Requirement of storage containers
25 List of Dumper placer Lifting containers
26 list of wards covered by de-centralised and centralised processing facilities
27 Staff redeployment plan
28 Vehicle redeployment plan
29 List of agreements and tenders to be floated
30 Additional investment on Solid Waste facilities
31 Operational costs of SWM system for MCC
List of Maps
1. Map showing Population density.
2. Map showing Slums of Mysore
3. Map showing out sourced wards, market and main roads.
4. Map showing container locations, associated dumper placer and Central &
Decentralised composting wards
5. Map showing locations of Bulk Generators
6. All 65 ward maps showing road length A,B,C details
4
Part 1: Status Report
1. Introduction
Mysore is located at about 140 Km from Bangalore by road on SH 17 and 132
Km by rail. Nearest airport to Mysore is at Bangalore airport at a distance of 155 Km.
There is an existing airfield in Mysore which is not used, there is a proposal for an
airport near Mandakally in Mysore. There is a four-track road under construction
connecting Bangalore and Mysore, which is almost completed.
Mysore is situated to the south of Karnataka state at latitude of 12.18N and a
longitude of 76.39E. It has an average annual rainfall of 798.2 mm. The administrative
area of Mysore City Corporation is 128.42 Sq. Km. The Mysore City Corporation has
65 administrative wards.
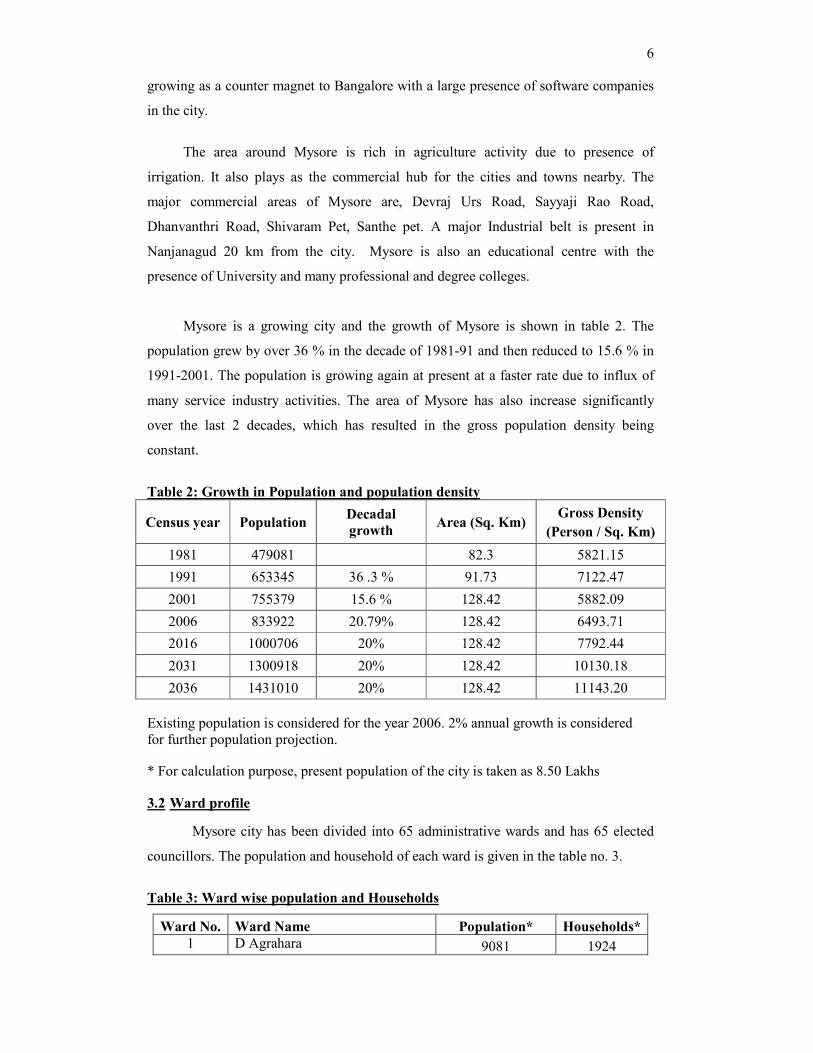
Mysore is well known historical, tourist and now active centre for production and
service industry. It is serving as a significant counter magnet to Bangalore and is
poised for significant growth. The salient data about Mysore is given in table no. 1
Table 1: Salient data about Mysore city
Type of Municipal Body City corporation
Population (2001) 755379
Households (2001) 158472
Present Population 8,33,922
Present Households 174956
Area 128.42 sq. km
Height (MSL) 770 Meters above MSL
Latitude 12.18 North
Longitude 76.39 East
Number of wards 65
By Road: 140 Km from Bangalore on SH-17
By Rail : 132 Km from Bangalore
Connectivity
By Air : 155 Km from Bangalore HAL Airport
Main tourist spot Mysore Palace, Jaganmohana Palace,
Brindavan Gardens–KRS, Rajendra vilas Palace,
Mysore Zoo, Chamundi Hills
Annual Rainfall 798.2mm
2. Report objectives and Methodology
Mysore City Corporation and the residents have been taking up many innovative
initiatives to mange the solid waste in the city. As part of the ADB assisted Karnataka
5
Urban Infrastructure Development Program, a compost plant has been set up in
Mysore. A decentralised system of collection of waste and its processing has been set
up at Mysore successfully. As part of the Nirmal Nagara program, the city Corporation
has been promoting various initiatives in solid waste management. A significant effort
is being put in to develop an overall plan for management of solid waste which would
serve as the blue print for the process over 5 year period. The effort has involved the
participation of the city corporation health department staff and the residents of the
city. Based on these interactions the present document has been prepared detailing the
present status of solid waste management in the city and the reorganisation proposed.
The objectives of the present report are as follows:
a. Detailing the current status of solid waste management of the city.
b. Detailing the proposed system for solid waste management in the city.
The Methodology followed for meeting the objectives involves the organisation of
the available data of the city corporation supported by collection of additional data
about the city to prepare the baseline information about the city and the current practise
of solid waste management. This has been presented in part 1 of the report. Starting
from the current situation and innovative experiences in the city, the expectations of the
state policy on solid waste management, the central Municipal solid waste management
rules (M & H) 2000 and finally the recommendations of the Supreme court committee
on solid waste management in class I cities ,a detailed plan has been prepared for future
management of the solid waste.
3. Profile of Mysore
Mysore is the second largest city in Karnataka after Bangalore. Mysore was the
Capital of Mysore state until 1956, when the capital was shifted from Mysore to
Bangalore. It was the capital for the rulers of the Wodeyar Dynasty. Mysore is
endowed with a salubrious climate, adequate land and water availability and is a major
destination for various activities in the state.
3.1 Overall data about the city
Mysore is a city of Palaces and many tourists visit the city. Mysore Palace,
Jaganmohana Palace, Mysore zoo, Krishna Raja Sagara, St. Philomena’s Church,
Chamundi Hills are few of the locations of tourist importance. The Mysore Dasara is a
well-known event attracts large number of tourists. The city is the connective point to
Kerala and also to few locations in Tamilnadu from Bangalore. The city has also been
6
growing as a counter magnet to Bangalore with a large presence of software companies
in the city.
The area around Mysore is rich in agriculture activity due to presence of
irrigation. It also plays as the commercial hub for the cities and towns nearby. The
major commercial areas of Mysore are, Devraj Urs Road, Sayyaji Rao Road,
Dhanvanthri Road, Shivaram Pet, Santhe pet. A major Industrial belt is present in
Nanjanagud 20 km from the city. Mysore is also an educational centre with the
presence of University and many professional and degree colleges.
Mysore is a growing city and the growth of Mysore is shown in table 2. The
population grew by over 36 % in the decade of 1981-91 and then reduced to 15.6 % in
1991-2001. The population is growing again at present at a faster rate due to influx of
many service industry activities. The area of Mysore has also increase significantly
over the last 2 decades, which has resulted in the gross population density being
constant.
Table 2: Growth in Population and population density
Census year Population Decadal
growth Area (Sq. Km)
Gross Density
(Person / Sq. Km)
1981 479081 82.3 5821.15
1991 653345 36 .3 % 91.73 7122.47
2001 755379 15.6 % 128.42 5882.09
2006 833922 20.79% 128.42 6493.71
2016 1000706 20% 128.42 7792.44
2031 1300918 20% 128.42 10130.18
2036 1431010 20% 128.42 11143.20
Existing population is considered for the year 2006. 2% annual growth is considered
for further population projection.
* For calculation purpose, present population of the city is taken as 8.50 Lakhs
3.2 Ward profile
Mysore city has been divided into 65 administrative wards and has 65 elected
councillors. The population and household of each ward is given in the table no. 3.
Table 3: Ward wise population and Households
Ward No. Ward Name Population* Households*
1 D Agrahara 9081 1924

7
2 Agrahara (S Matha) 10243 2073
3 Sunnada Keri 5106 975
4 Laxmipuram 10133 2273
5 Chamundipuram (Mader Block) 9034 1824
6 Hosa Bandikeri 10201 2067
7 Fort Mohalla 8602 1973
8 Gundurao Nagar 12747 2805
9 VidyaranyaPuram 9754 2268
10 VidyaranyaPuram 10179 2210
11 Vishweshwara Nagar 9660 2144
12 JP Nagar (N Palya) 20879 4504
13 Ashok Puram 14968 2822
14 Ashok Puram (KR Vana) 7372 1361
15 Jayanagar 13620 3176
16 Kuvempu Nagar (KG Koppal) 12839 3013
17 Kuvempu Nagar 16593 3924
18 Sri Rampura (Madhuvana) 29891 7040
19 Dattagalli 25569 6043
20 Thonachikoppal 16524 3829
21 Manasa Gangothri 14829 2707
22 Saraswati Puram 10444 2297
23 Chamarajapuram 10025 2215
24 Subbarayana Keri 6605 1414
25 Devaraja Mohalla 6289 1132
26 Devaraja Mohalla(Jaladarshini) 6364 1186
27 Kumbarageri 4736 877
28 Lashker Mohalla 11558 2058
29 Kamatageri 9103 1769
30 Bamboo Bazar 7476 1419
31 Yadavagiri 7314 1714
32 Yadavagiri (MN Pura) 13051 2802
33 Metagalli 15467 3588
34 MG Koppal (Hebbal) 38904 9641
35 Kumbarakoppal 15175 3680
36 Jayalaxmipuram 12175 2842
37 VV Puram 13692 3336
38 Vontikoppal 11112 2496
39 Paduvarahalli 12446 2790
40 Kylasapuram 12052 2045
41 Mandi Mohalla 7493 1234
42 Mohammed Sait Block 10653 1780
43 Tilak Nagar 9888 1867
44 Bannimantap Extn. 8818 1684

8
45 Bannimantap 19274 3602
46 Rajendra Nagar 12988 2217
47 Kesare 17433 3404
48 Rajendra Nagar 10649 2185
49 NR Mohalla 5187 1106
50 Veeranagere 9707 1718
51 Gandhinagar (Jalapuri) 13200 2517
52 Gandhinagar 8699 1561
53 AJ/AG Block 10482 1994
54 Ganesh Nagar 9701 2121
55 Udayagiri 14252 2718
56 Shanti Nagar 25129 4623
57 Kyathamaranahalli 23090 4509
58 KN Pura 10785 2196
59 Ghousia Nagar 11022 2168
60 Gayathripuram 18082 3740
61 Nazarbad 9780 1982
62 Ittigegud 8273 1675
63 Kurubarahalli 14932 3197
64 Siddhartha Nagar 15925 3501
65 Kalyanagiri Nagar 26668 5401
Total 833922 174956
*Population & Household projected to 2006 using average growth rate of last 2
decades.
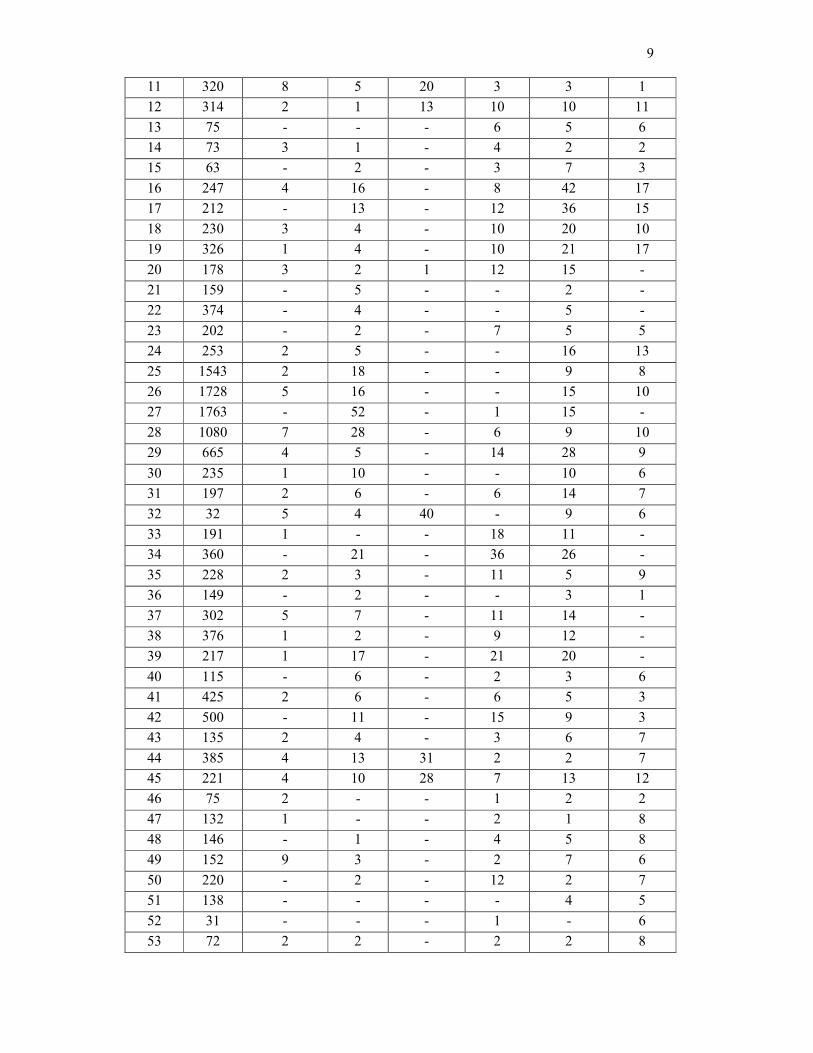
3.2.1 Ward wise data on different waste generating establishments
The ward wise data on different commercial establishments and the other waste
generating establishments is given in table 4.
Table 4: Ward wise waste generating establishments
Ward
No. Shops Choultries Hotels Industries
Meat
Shops
Hospitals
and
Clinics
Temples
1 360 9 15 - - 6 5
2 446 - 4 1 1 8 7
3 167 - 3 - 6 1 8
4 172 2 5 - - 3 6
5 109 3 6 - 1 5 5
6 159 - 5 - 6 4 5
7 270 1 4 - - 12 6
8 160 1 1 - 2 1 5
9 331 1 3 - 3 16 1
10 255 1 2 - 2 18 4
9
11 320 8 5 20 3 3 1
12 314 2 1 13 10 10 11
13 75 - - - 6 5 6
14 73 3 1 - 4 2 2
15 63 - 2 - 3 7 3
16 247 4 16 - 8 42 17
17 212 - 13 - 12 36 15
18 230 3 4 - 10 20 10
19 326 1 4 - 10 21 17
20 178 3 2 1 12 15 -
21 159 - 5 - - 2 -
22 374 - 4 - - 5 -
23 202 - 2 - 7 5 5
24 253 2 5 - - 16 13
25 1543 2 18 - - 9 8
26 1728 5 16 - - 15 10
27 1763 - 52 - 1 15 -
28 1080 7 28 - 6 9 10
29 665 4 5 - 14 28 9
30 235 1 10 - - 10 6
31 197 2 6 - 6 14 7
32 32 5 4 40 - 9 6
33 191 1 - - 18 11 -
34 360 - 21 - 36 26 -
35 228 2 3 - 11 5 9
36 149 - 2 - - 3 1
37 302 5 7 - 11 14 -
38 376 1 2 - 9 12 -
39 217 1 17 - 21 20 -
40 115 - 6 - 2 3 6
41 425 2 6 - 6 5 3
42 500 - 11 - 15 9 3
43 135 2 4 - 3 6 7
44 385 4 13 31 2 2 7
45 221 4 10 28 7 13 12
46 75 2 - - 1 2 2
47 132 1 - - 2 1 8
48 146 - 1 - 4 5 8
49 152 9 3 - 2 7 6
50 220 - 2 - 12 2 7
51 138 - - - - 4 5
52 31 - - - 1 - 6
53 72 2 2 - 2 2 8
10
54 95 2 1 - 5 3 5
55 210 - 1 - 6 2 9
56 166 - - - 4 14 19
57 125 - 2 - 5 3 8
58 105 - 3 - 2 8 10
59 203 - - - 7 4 7
60 239 1 - - 6 7 12
61 452 7 20 - 9 10 12
62 385 3 8 - 2 4 10
63 257 2 6 - 4 6 5
64 289 3 4 - 15 9 14
65 273 2 10 - 14 5 13
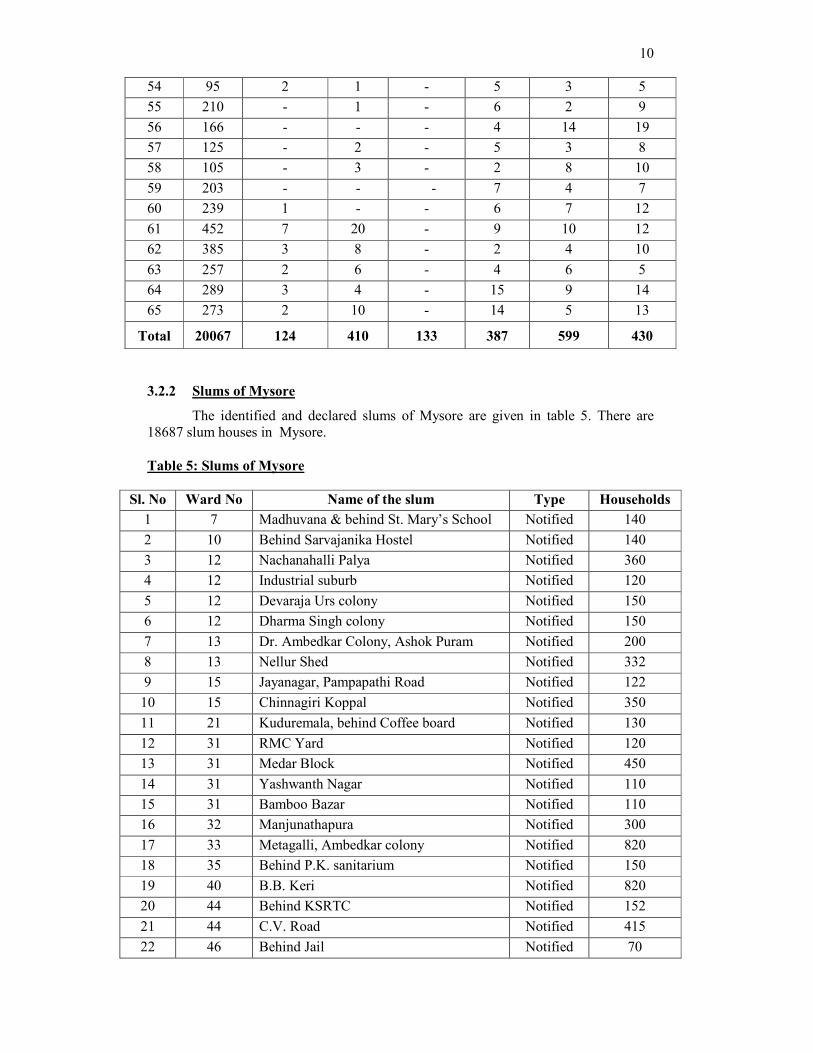
Total 20067 124 410 133 387 599 430
3.2.2 Slums of Mysore
The identified and declared slums of Mysore are given in table 5. There are
18687 slum houses in Mysore.
Table 5: Slums of Mysore
Sl. No Ward No Name of the slum Type Households
1 7 Madhuvana & behind St. Mary’s School Notified 140
2 10 Behind Sarvajanika Hostel Notified 140
3 12 Nachanahalli Palya Notified 360
4 12 Industrial suburb Notified 120
5 12 Devaraja Urs colony Notified 150
6 12 Dharma Singh colony Notified 150
7 13 Dr. Ambedkar Colony, Ashok Puram Notified 200
8 13 Nellur Shed Notified 332
9 15 Jayanagar, Pampapathi Road Notified 122
10 15 Chinnagiri Koppal Notified 350
11 21 Kuduremala, behind Coffee board Notified 130
12 31 RMC Yard Notified 120
13 31 Medar Block Notified 450
14 31 Yashwanth Nagar Notified 110
15 31 Bamboo Bazar Notified 110
16 32 Manjunathapura Notified 300
17 33 Metagalli, Ambedkar colony Notified 820
18 35 Behind P.K. sanitarium Notified 150
19 40 B.B. Keri Notified 820
20 44 Behind KSRTC Notified 152
21 44 C.V. Road Notified 415
22 46 Behind Jail Notified 70

11
23 47 Kesare Slaughter House Notified 291
24 47 Kesare, Belavatha Colony Notified 130
25 47 Belavatha Janatha colony Notified 150
26 52 Chamundeshwari Nagar Notified 220
27 57 Ghousia Nagar Notified 4400
28 57 Kyathamaranahalli, A.K. Colony Notified 180
29 58 Kyathamaranahalli Notified 965
30 60 Jyothi Nagar, P.K. Colony Notified 200
31 63 Kurubarahalli Notified 330
32 65 Ghousia Nagar, Beedi workers colony Notified 150
33 45 Janata Sawmill Notified 94
34 11 Vishweshwara Nagar Notified 83
35 52 Gandhi Nagar, Chamundeshwari Road Notified 113
36 19 Vasanthnagar Notified 170
37 64 Girijabovi Palya Notified 218
38 40 Kailasapuram Notified 506
39 52 Siddappaji Block Identified 76
40 52 Durgamba Temple, Gandhi Nagar Identified 86
41 31 Yadavagiri Identified 62
42 36 Gokulam Identified 80
43 7 Madhuvana Identified 129
44 21 Bogadi Road Identified 130
45 59 Ghousia Nagar, 2nd Stage, ‘B’ Block Identified 250
46 8 Elethotha Identified 80
47 22 Kukkarahalli Identified 150
48 46 Bade Makhan Identified 450
49 56 Shanthinagar Identified 3000
50 20 T.K. Layout Identified 158
51 45 Vande Mataram Identified 125
Total 18687
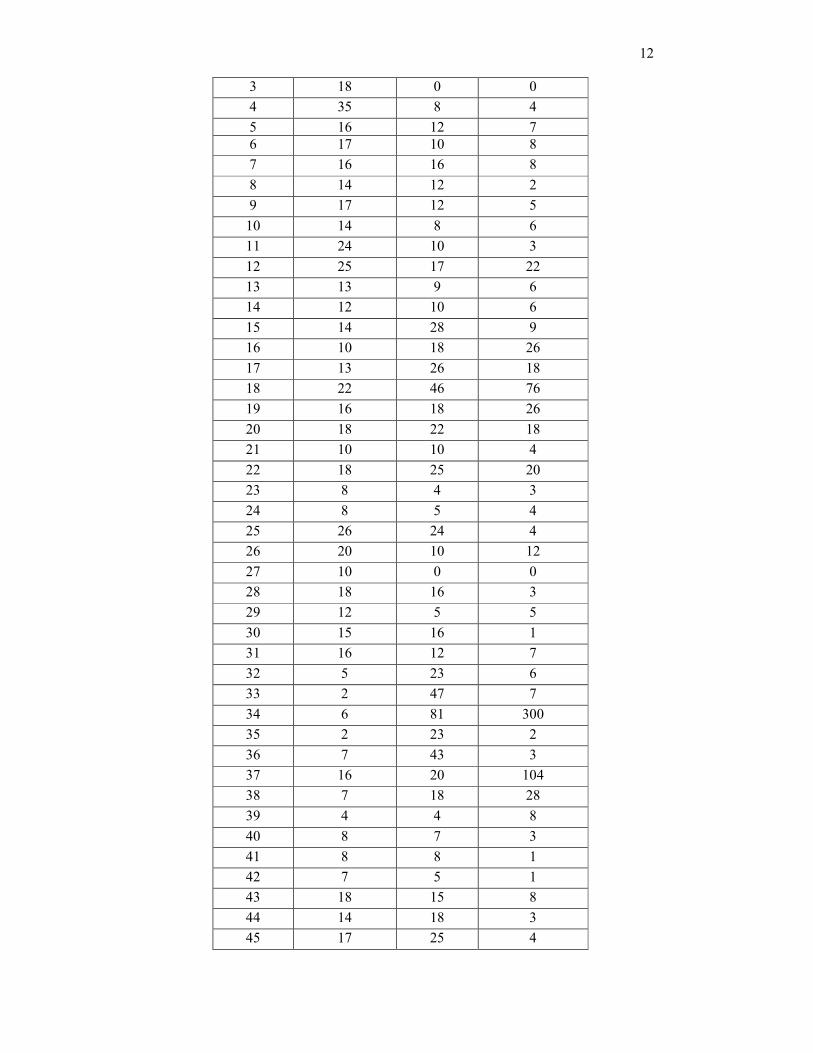
3.2.3 Ward wise details on dustbin infrastructure
The details of the dustbins and waste collection points in different wards are
given in the table 6. The present locations of the dustbins and the waste collection
points have been classified into daily collection (A type), Weekly twice collection (B
type) and weekly once collection (C type) as part of the Nirmal Nagara program. The
same is presented in the table. In addition there are 20 dumper placer containers used
as primary collection containers in commercial areas and bulk generators.
Table 6: Ward wise details of dustbin infrastructure
Dustbins
Ward No. A B C
1 16 11 11
2 11 8 5
12
3 18 0 0
4 35 8 4
5 16 12 7
6 17 10 8
7 16 16 8
8 14 12 2
9 17 12 5
10 14 8 6
11 24 10 3
12 25 17 22
13 13 9 6
14 12 10 6
15 14 28 9
16 10 18 26
17 13 26 18
18 22 46 76
19 16 18 26
20 18 22 18
21 10 10 4
22 18 25 20
23 8 4 3
24 8 5 4
25 26 24 4
26 20 10 12
27 10 0 0
28 18 16 3
29 12 5 5
30 15 16 1
31 16 12 7
32 5 23 6
33 2 47 7
34 6 81 300
35 2 23 2
36 7 43 3
37 16 20 104
38 7 18 28
39 4 4 8
40 8 7 3
41 8 8 1
42 7 5 1
43 18 15 8
44 14 18 3
45 17 25 4
13
46 26 7 2
47 20 10 4
48 18 10 4
49 18 13 2
50 19 12 8
51 28 18 12
52 10 9 3
53 10 8 3
54 22 10 2
55 34 20 13
56 10 12 10
57 15 7 3
58 10 6 3
59 8 10 12
60 7 10 10
61 15 20 4
62 15 20 4
63 10 12 13
64 10 11 9
65 10 10 13
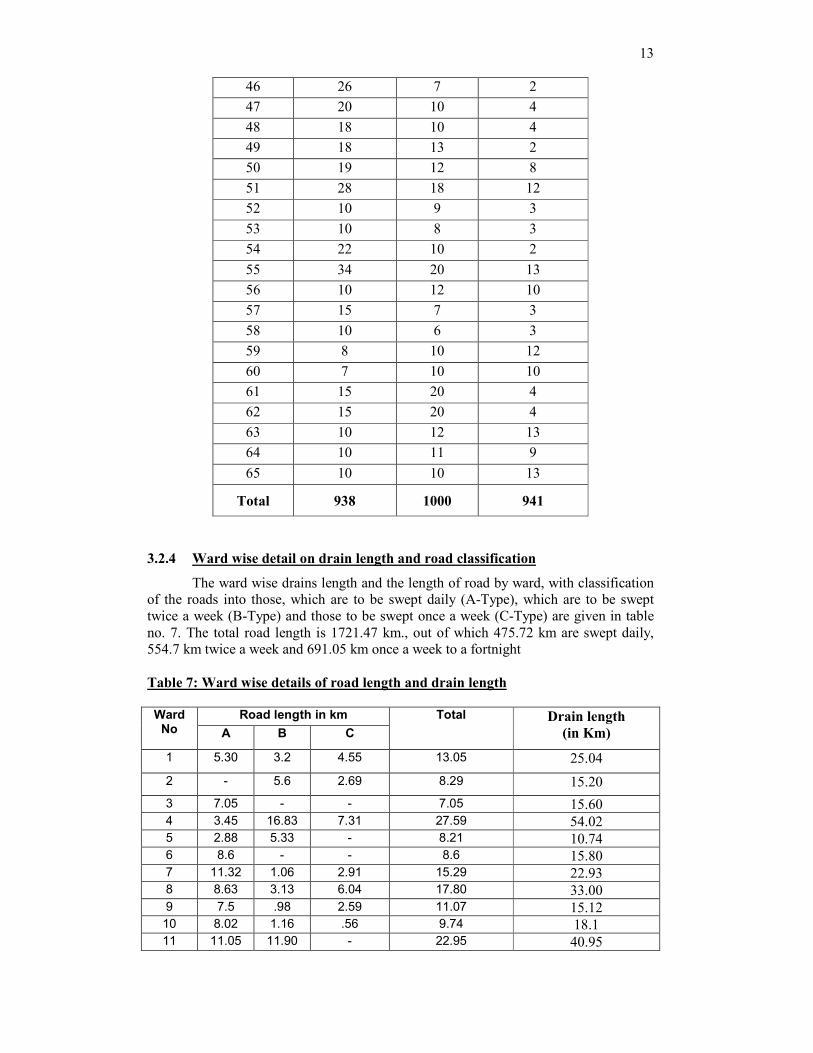
Total 938 1000 941
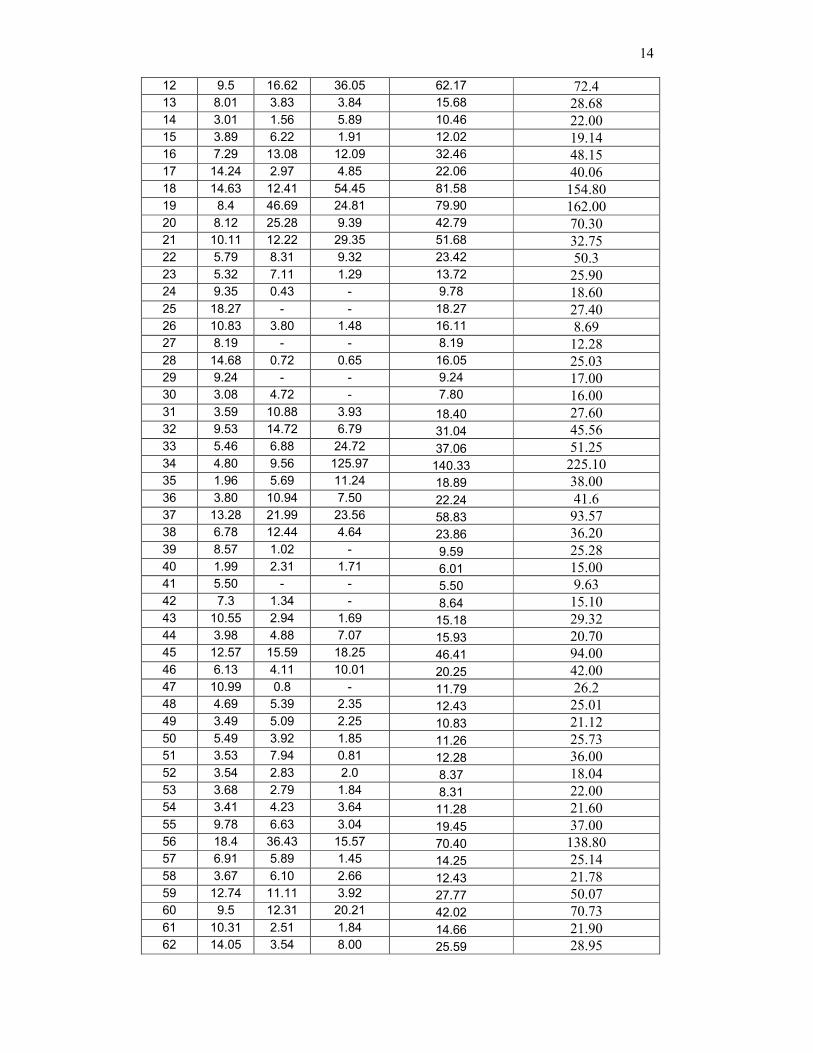
3.2.4 Ward wise detail on drain length and road classification
The ward wise drains length and the length of road by ward, with classification
of the roads into those, which are to be swept daily (A-Type), which are to be swept
twice a week (B-Type) and those to be swept once a week (C-Type) are given in table
no. 7. The total road length is 1721.47 km., out of which 475.72 km are swept daily,
554.7 km twice a week and 691.05 km once a week to a fortnight
Table 7: Ward wise details of road length and drain length
Road length in km Ward
No A B C
Total Drain length
(in Km)
1 5.30 3.2 4.55 13.05 25.04
2 - 5.6 2.69 8.29 15.20
3 7.05 - - 7.05 15.60 4 3.45 16.83 7.31 27.59 54.02 5 2.88 5.33 - 8.21 10.74 6 8.6 - - 8.6 15.80 7 11.32 1.06 2.91 15.29 22.93 8 8.63 3.13 6.04 17.80 33.00 9 7.5 .98 2.59 11.07 15.12 10 8.02 1.16 .56 9.74 18.1 11 11.05 11.90 - 22.95 40.95
14
12 9.5 16.62 36.05 62.17 72.4 13 8.01 3.83 3.84 15.68 28.68 14 3.01 1.56 5.89 10.46 22.00 15 3.89 6.22 1.91 12.02 19.14 16 7.29 13.08 12.09 32.46 48.15 17 14.24 2.97 4.85 22.06 40.06 18 14.63 12.41 54.45 81.58 154.80 19 8.4 46.69 24.81 79.90 162.00 20 8.12 25.28 9.39 42.79 70.30 21 10.11 12.22 29.35 51.68 32.75 22 5.79 8.31 9.32 23.42 50.3 23 5.32 7.11 1.29 13.72 25.90 24 9.35 0.43 - 9.78 18.60 25 18.27 - - 18.27 27.40 26 10.83 3.80 1.48 16.11 8.69 27 8.19 - - 8.19 12.28 28 14.68 0.72 0.65 16.05 25.03 29 9.24 - - 9.24 17.00 30 3.08 4.72 - 7.80 16.00 31 3.59 10.88 3.93 18.40 27.60 32 9.53 14.72 6.79 31.04 45.56 33 5.46 6.88 24.72 37.06 51.25 34 4.80 9.56 125.97 140.33 225.10 35 1.96 5.69 11.24 18.89 38.00 36 3.80 10.94 7.50 22.24 41.6 37 13.28 21.99 23.56 58.83 93.57 38 6.78 12.44 4.64 23.86 36.20 39 8.57 1.02 - 9.59 25.28 40 1.99 2.31 1.71 6.01 15.00 41 5.50 - - 5.50 9.63 42 7.3 1.34 - 8.64 15.10 43 10.55 2.94 1.69 15.18 29.32 44 3.98 4.88 7.07 15.93 20.70 45 12.57 15.59 18.25 46.41 94.00 46 6.13 4.11 10.01 20.25 42.00 47 10.99 0.8 - 11.79 26.2 48 4.69 5.39 2.35 12.43 25.01 49 3.49 5.09 2.25 10.83 21.12 50 5.49 3.92 1.85 11.26 25.73 51 3.53 7.94 0.81 12.28 36.00 52 3.54 2.83 2.0 8.37 18.04 53 3.68 2.79 1.84 8.31 22.00 54 3.41 4.23 3.64 11.28 21.60 55 9.78 6.63 3.04 19.45 37.00 56 18.4 36.43 15.57 70.40 138.80 57 6.91 5.89 1.45 14.25 25.14 58 3.67 6.10 2.66 12.43 21.78 59 12.74 11.11 3.92 27.77 50.07 60 9.5 12.31 20.21 42.02 70.73 61 10.31 2.51 1.84 14.66 21.90 62 14.05 3.54 8.00 25.59 28.95

15
63 - 40.94 60.17 101.11 180 64 - 26.75 26.93 53.68 88.8 65 - 40.95 51.55 92.5 202.6 Total 475.72 554.7 691.05 1721.47 2989.36
3.2.5 Source wise waste generation
The source wise waste generation estimate is given in table 8. The estimate
waste generation is 300 tons of which 70.625% are from residential sources. The
hotels, Choultry and markets account for 18.44 % and the balance is from other
sources.
Table 8: Source wise waste generation table
No Waste source Number Basis of estimation Est. waste in
tpd %
1
Residential (Slum &
non slum)
850.000 250 gram/ capita
212.5 70.62
2 Shops &
establishments, schools,
temples etc.
20,503 1000 gram / unit 20.5 6.80
3 Hotels, Choultries etc. 534 50 kg / unit 26.7 8.87
4 Markets, vegetable
shops, meat shops etc.
387 28.8 9.57
5 Hospitals, clinics etc 599 5.9 1.96
6 Industries 133 1.4 0.46
7 Others 5.1 1.69
Total 300.9 100
4 Current SWM practise
4.1 Overview
The solid waste management activity in Mysore consists of some percentage of
door to door collection and some percentage waste generator throwing the wastes into
the round RCC bins and masonry bins. The pourakarmika sweep the road and the
drains and transfer the waste into small heaps on the road or into the bins. In addition to
the bins there are other open waste collection points. Mysore being a tourist city there
are many locations within the city and occasions especially during the Dasara where
special efforts for cleanliness are required. Special contingents of staff are dedicated for
these operations.
The wastes are lifted from the bins, containers and the other waste collection
points using a combination of trucks, tractors and Dumper placers. The wastes are
transported to the composting plant where parts of the waste are converted into

16
compost and the balance are dumped in a vacant land nearby. There are efforts at
decentralised waste management with a successfully running operation in ward number
35. Many other door-to-door collection operations are also ongoing.
4.2 SWM staffing
The number of staff working on solid waste management in the City Corporation is
shown in table no 9.
Table 9: Staff available for SWM
Sl. No Staff Number
1 Health Officer 1
2 Dy. Health Officer 1
3 Environmental Engineers 2
4 Senior Health Inspector 2
5 Junior Health Inspector 18
6 Health Inspectors on contract 6
7 Conservancy dafedars 36
8 PK’s 786
9 PK’s on time scale 7
10 PK’s on contract basis 40
11 PK’s deployed by Contractors 586
12 Drivers 26
Health Officer is the incharge of the SWM activities. The Deputy Health
Officer, 2 Environmental Engineers and Health Inspectors assist him. There are Two
senior health inspectors and 18 junior health inspectors. Each of the health inspectors
manage a set of wards are given in table 10. The health inspectors are assisted by the
36-conservancy dafedars who in turn manage the Pourakarmika of the city corporation
and the contractor staff.
Table 10: Wards managed by different Sanitary Inspectors
Serial Name of the Health
Inspector PK Ward
Contractors
Ward
Wards
Managed
1 Nanjappa Gowda 1 - 1
2 Putta Swamy T 25 - 1
3 Shiva Kumar Swamy 27,31,43 - 3
4 Revanna 28 - 1
5 K.S.Bhaskar - 13,14 2
6 Basavaraju 32,35 - 2
7 L.G.Javaraiaha 50,51 58,59,60 5
8 Krishnappa 49,54 - 2
9 Putta Swamy KS 7,8,11 - 3
17
10 Ravi Shankar 2,24- - 2
11 Balachandra AK 29,41,42 - 3
12 Sidde Gowda GS 5,6 - 2
13 Sanjeevaiah 26 - 1
14 Rajendrappa - 55,56,57 3
15 H.R.Paramesh 30,40 - 2
16 Shankar Narayan 3,4,9,10 12 5
17 SV Kamble 44,45 - 2
18 Raghunath - Main Roads -
19 Rama Narasimhaiah 52,53 46,47,48 5
20
Kumari Geetha Nirmal Nagar
Assistant - -
21 Rama Swamy (rtd. emp) - 21,22,23 3
22 Chaluvaiah(rtd.emp) 61,62 63,64,65 5
23
Nagaraj Rao (rtd.emp)
-
15,16,17
18,19,20 6
24 Ramachandraiah (rtd.emp) - 33,34,36 3
25 Kantaraj (rtd.emp) - 37,38,39 3
26
Jetendra Kumar (rtd.emp) Vehicle Section,
SWM Plant - -
Total number of wards 35 30 65
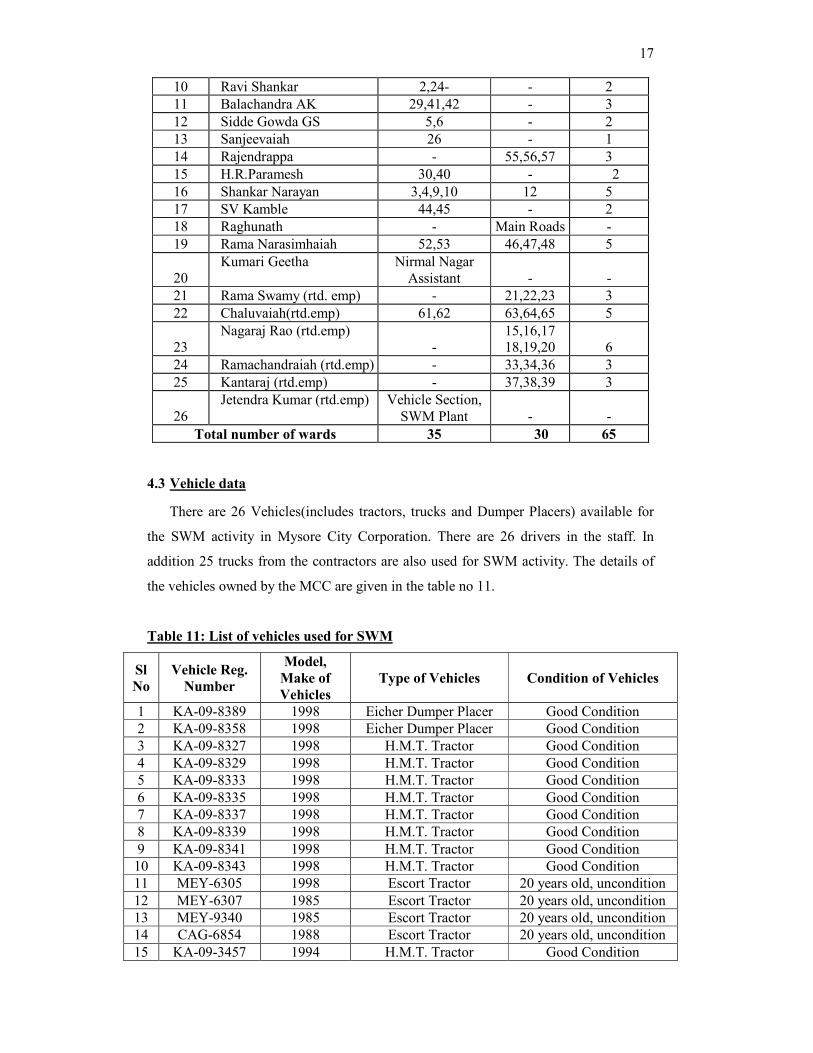
4.3 Vehicle data
There are 26 Vehicles(includes tractors, trucks and Dumper Placers) available for
the SWM activity in Mysore City Corporation. There are 26 drivers in the staff. In
addition 25 trucks from the contractors are also used for SWM activity. The details of
the vehicles owned by the MCC are given in the table no 11.
Table 11: List of vehicles used for SWM
Sl
No
Vehicle Reg.
Number
Model,
Make of
Vehicles
Type of Vehicles Condition of Vehicles
1 KA-09-8389 1998 Eicher Dumper Placer Good Condition
2 KA-09-8358 1998 Eicher Dumper Placer Good Condition
3 KA-09-8327 1998 H.M.T. Tractor Good Condition
4 KA-09-8329 1998 H.M.T. Tractor Good Condition
5 KA-09-8333 1998 H.M.T. Tractor Good Condition
6 KA-09-8335 1998 H.M.T. Tractor Good Condition
7 KA-09-8337 1998 H.M.T. Tractor Good Condition
8 KA-09-8339 1998 H.M.T. Tractor Good Condition
9 KA-09-8341 1998 H.M.T. Tractor Good Condition
10 KA-09-8343 1998 H.M.T. Tractor Good Condition
11 MEY-6305 1998 Escort Tractor 20 years old, uncondition
12 MEY-6307 1985 Escort Tractor 20 years old, uncondition
13 MEY-9340 1985 Escort Tractor 20 years old, uncondition
14 CAG-6854 1988 Escort Tractor 20 years old, uncondition
15 KA-09-3457 1994 H.M.T. Tractor Good Condition
18
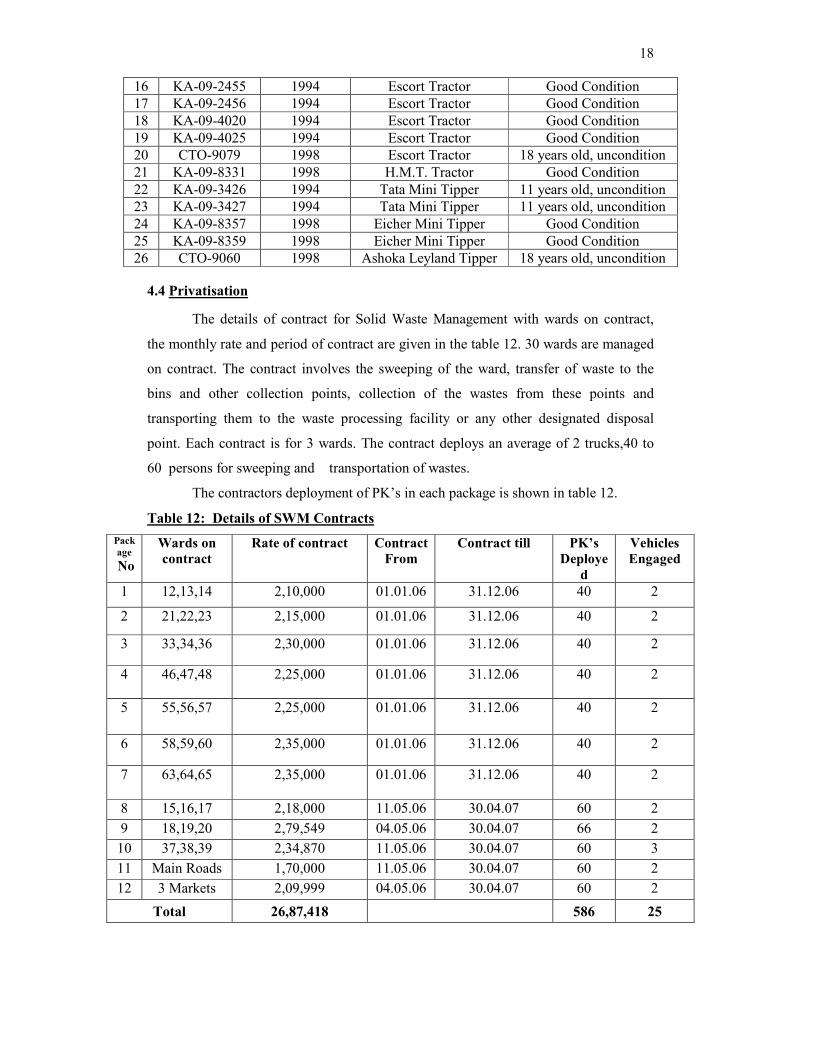
16 KA-09-2455 1994 Escort Tractor Good Condition
17 KA-09-2456 1994 Escort Tractor Good Condition
18 KA-09-4020 1994 Escort Tractor Good Condition
19 KA-09-4025 1994 Escort Tractor Good Condition
20 CTO-9079 1998 Escort Tractor 18 years old, uncondition
21 KA-09-8331 1998 H.M.T. Tractor Good Condition
22 KA-09-3426 1994 Tata Mini Tipper 11 years old, uncondition
23 KA-09-3427 1994 Tata Mini Tipper 11 years old, uncondition
24 KA-09-8357 1998 Eicher Mini Tipper Good Condition
25 KA-09-8359 1998 Eicher Mini Tipper Good Condition
26 CTO-9060 1998 Ashoka Leyland Tipper 18 years old, uncondition
4.4 Privatisation
The details of contract for Solid Waste Management with wards on contract,
the monthly rate and period of contract are given in the table 12. 30 wards are managed
on contract. The contract involves the sweeping of the ward, transfer of waste to the
bins and other collection points, collection of the wastes from these points and
transporting them to the waste processing facility or any other designated disposal
point. Each contract is for 3 wards. The contract deploys an average of 2 trucks,40 to
60 persons for sweeping and transportation of wastes.
The contractors deployment of PK’s in each package is shown in table 12.
Table 12: Details of SWM Contracts
Pack
age
No
Wards on
contract
Rate of contract Contract
From
Contract till PK’s
Deploye
d
Vehicles
Engaged
1 12,13,14 2,10,000 01.01.06 31.12.06 40 2
2 21,22,23 2,15,000 01.01.06 31.12.06 40 2
3 33,34,36 2,30,000 01.01.06 31.12.06 40 2
4 46,47,48 2,25,000 01.01.06 31.12.06 40 2
5 55,56,57 2,25,000 01.01.06 31.12.06 40 2
6 58,59,60 2,35,000 01.01.06 31.12.06 40 2
7 63,64,65 2,35,000 01.01.06 31.12.06 40 2
8 15,16,17 2,18,000 11.05.06 30.04.07 60 2
9 18,19,20 2,79,549 04.05.06 30.04.07 66 2
10 37,38,39 2,34,870 11.05.06 30.04.07 60 3
11 Main Roads 1,70,000 11.05.06 30.04.07 60 2
12 3 Markets 2,09,999 04.05.06 30.04.07 60 2
Total 26,87,418 586 25
19
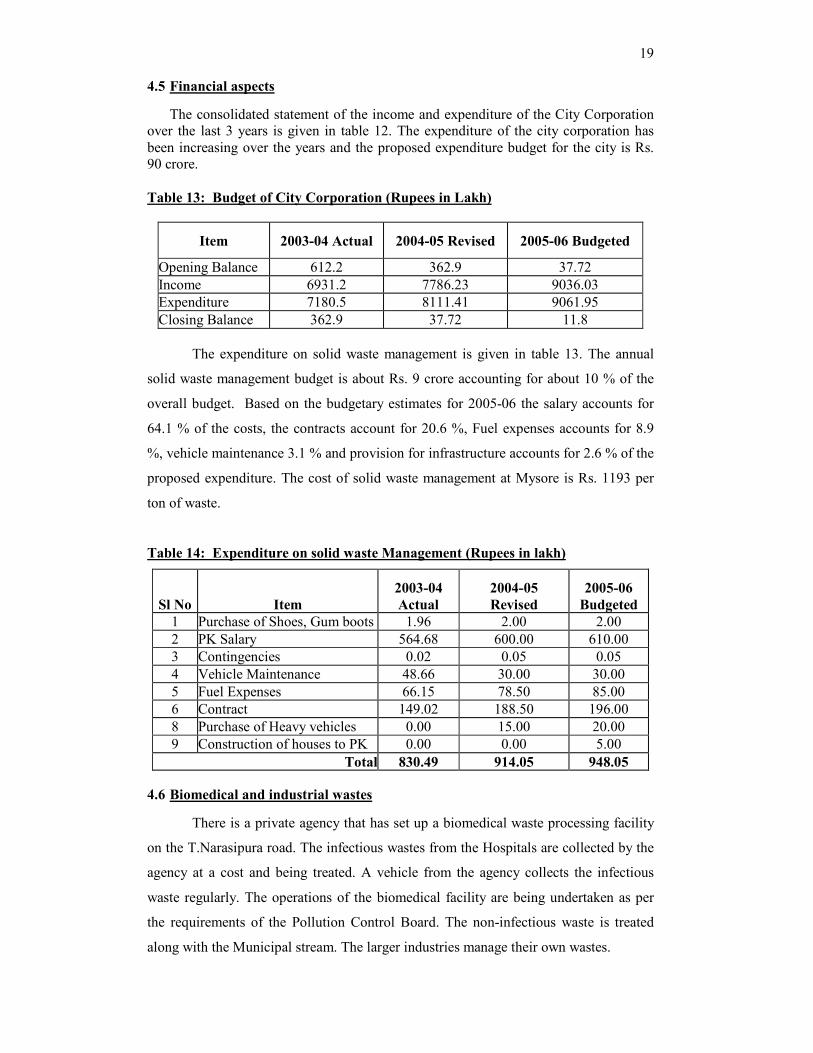
4.5 Financial aspects
The consolidated statement of the income and expenditure of the City Corporation
over the last 3 years is given in table 12. The expenditure of the city corporation has
been increasing over the years and the proposed expenditure budget for the city is Rs.
90 crore.
Table 13: Budget of City Corporation (Rupees in Lakh)
Item 2003-04 Actual 2004-05 Revised 2005-06 Budgeted
Opening Balance 612.2 362.9 37.72
Income 6931.2 7786.23 9036.03
Expenditure 7180.5 8111.41 9061.95
Closing Balance 362.9 37.72 11.8
The expenditure on solid waste management is given in table 13. The annual
solid waste management budget is about Rs. 9 crore accounting for about 10 % of the
overall budget. Based on the budgetary estimates for 2005-06 the salary accounts for
64.1 % of the costs, the contracts account for 20.6 %, Fuel expenses accounts for 8.9
%, vehicle maintenance 3.1 % and provision for infrastructure accounts for 2.6 % of the
proposed expenditure. The cost of solid waste management at Mysore is Rs. 1193 per
ton of waste.
Table 14: Expenditure on solid waste Management (Rupees in lakh)
Sl No Item
2003-04
Actual
2004-05
Revised
2005-06
Budgeted
1 Purchase of Shoes, Gum boots 1.96 2.00 2.00
2 PK Salary 564.68 600.00 610.00
3 Contingencies 0.02 0.05 0.05
4 Vehicle Maintenance 48.66 30.00 30.00
5 Fuel Expenses 66.15 78.50 85.00
6 Contract 149.02 188.50 196.00
8 Purchase of Heavy vehicles 0.00 15.00 20.00
9 Construction of houses to PK 0.00 0.00 5.00
Total 830.49 914.05 948.05
4.6 Biomedical and industrial wastes
There is a private agency that has set up a biomedical waste processing facility
on the T.Narasipura road. The infectious wastes from the Hospitals are collected by the
agency at a cost and being treated. A vehicle from the agency collects the infectious
waste regularly. The operations of the biomedical facility are being undertaken as per
the requirements of the Pollution Control Board. The non-infectious waste is treated
along with the Municipal stream. The larger industries manage their own wastes.
20
4.7 Processing and disposal
A composting plant is set up under the ADB assisted Karnataka Urban
infrastructure Development project at VidyaranyaPuram. The plant was set up by the
Excel industries and was being operated by M/s Vennar Organics till June 2005. The
plant has capacity to handle 200 tons of wastes per day. The plant has been operational
at sub optimal levels and as of now the agency has stopped operations. The City
Corporation is managing the plant.
Landfill Site Details:
The City does not have waste disposal site. 110 acres of land has been
identified at Bettadabeedu, Hampapura Hoblie, H.D.Kote taluk. District
commissioner, Mysore has been requested to allot this land. After the allotment, the
possession of the land will be taken .
4.8 Special efforts and innovations
In ward 1,34,35,36 and part of all other wards , door-to-door collections is
taking place initiated by the local resident welfare association of that area. Collection
procedure covers almost 30 percent of the concerned wards.
There is a special effort being taken up by a social worker and Gandhian Mr.
Made Gowda in Ward no 35. A ward level association has been formed and solid
waste in the ward is managed locally. It has 4 RWA formed based on DMA
specification of RWA. The association employs 8 primary collection workers called
“Nagarabandhus” who under take door-to-door collection. The wastes collected are
carried to a local composting unit located at Kumbarakoppal. The composting unit is
based on aerobic system. The compost produced is then sold to the Corporation and
also to the private. The income generated from the user fee collection and the compost
sale is used for the payment of the workers associated. A supervisor is employed to
manage the whole system. This effort has given encouragement to few more wards,
which are on their way to make their own arrangements.
4.9 Waste management support facilities
Mysore City Corporation is having 24 hours help line facility in which
computerized complaint register is maintained. It is operated in 3 shifts. Maximum time
taken for attending each complaint is 24 hours. Wireless set is distributed to all the
health staff.
21
4.10 Activities undertaken under Nirmal Nagara programme
As part of the Nirmal Nagara program, efforts at improving the existing system
has been taken up. Classification of collection points and roads to manage the routine
operations has been undertaken. Data on various aspects of solid waste management
has been collected to organise the system. For this, selection of NGO to promote IEC
activities regarding SWM is under progress.
5 Waste Estimates
5.1 Normative assessment of waste generation
Waste generation varies from 200 gms. to 500 gms. per capita per day
depending upon the population of the town / city. The average per capita waste
generation for a population range of 5-10 lakhs is 250 gms. / capita / day. Mysore is
characterised by a large areas having lower population density and a more traditional
population. A normative standard of 300 gram per capita for waste generation is
preferred and used as the basis for estimating the waste generation for the city. Based
on this number we arrive at waste and the present population estimate of 850000 for the
city the waste generation is estimated at 255 tons per day.
5.2 Waste transported per day
The wastes collected by both the City Corporation and the contractor vehicles
are transported to the compost plant. The vehicles are weighed at the Compost plant.
The weights taken for the arrivals of vehicles carrying solid waste for 15 days starting
from 1st July to 15th July is shown in table 15. This shows the average waste transported
is 272.6 tons per day and minimum is 226 tons / day and the maximum is 321 tons per
day.

22
Table 15 :
Sl No Date Day No. of trips Tons / day Average ton
/ trip
1. 1-7-06 Saturday 90 284 3.15
2. 2-7-06 Sunday 66 226 3.42
3. 3-7-06 Monday 81 261 3.22
4. 4-7-06 Tuesday 88 295 3.35
5. 5-7-06 Wednesday 71 244 3.43
6. 6-7-06 Thursday 86 252 2.93
7. 7-7-06 Friday 84 273 3.25
8. 8-7-06 Saturday 72 269 3.73
9. 9-7-06 Sunday 58 246 4.24
10. 10-7-06 Monday 83 292 3.51
11. 11-7-06 Tuesday 84 321 3.82
12. 12-7-06 Wednesday 65 255 3.92
13. 13-7-06 Thursday 84 291 3.46
14. 14-7-06 Friday 87 321 3.68
15. 15-7-06 Saturday 70 260 3.71
Average – 15 days. 77.93 272.6 3.52
5.3 Quantity of waste generated in Mysore
The quantity of waste assessed based on normative standards is 255 tons per
day. The estimate of the source wise waste generation is 300.9 tons per day. The
average waste transported per day to the compost plant is 272.6 tons / day. The
effective collection efficiency based on these numbers is 80-90 %. For the purposes of
design of facilities it is felt that the basis of design of the various facilities should be
more in line with the waste collected and transported, this especially because of large
areas in the outskirts having low population not contributing wastes. Based on this the
design capacity of solid waste management is taken at 300 tons per day.
23
Part II: Detailed Action Plan
6. Strategy for SWM for Mysore
The management of solid waste management for Mysore would be in line with
the state policy and the MSW rules (M &H) 2000. Within this framework it is proposed
to have a combination of centralised and decentralised waste processing facilities.
The collection of waste from households and small establishments in both
residential and commercial areas would be from their doorstep. This would be
undertaken through ward level institutions like the resident welfare association, the
ward level committees or through Non government organisations. These agencies
would employ the self-help groups for undertaking the collection of waste. The
collection from bulk waste generators institutions would be through a separate private
contract. Segregated collection would be introduced as part of the door-to-door
collection system with wet waste being collected daily in the morning and dry wastes
being collected twice a week in the afternoon.
All roads in the city would be swept with the frequency of daily, twice a week
and once in a week.
The waste from door to door collection systems would be transferred to
containers. The containers would then be transported using twin bin dumper placers to
the processing sites. A combination of decentralised and centralised processing would
be undertaken. The wastes, which cannot be composted or recycled, would be sent for
landfill.
The detailed plan given the equipment required, institutions involved,
contracting and redeployment plan for the municipal staff is given in the subsequent
sections.
7. Detailed plan for Street Sweeping
The sweeping activity is separated out from the primary collection activity. The
sweeper would sweep the roads, clean the adjoining drains of size 450 mm and less and
transfer the waste to a handcart. Two sweepers would work together and share one

24
handcart. The swept wastes would be transferred to the tractor trailer and waste would
be taken to designated low lying areas and dumped. As the waste is expected to have
very little organics and it would not be taken to the compost plant. Sweeping would be
undertaken daily in all the roads identified as ‘A’ type, two times in a week on roads
identified as ‘B’ and once in 7 days on roads identified as ‘C’. The table 16 gives the
details of the staff required for sweeping.
Table 16: Requirement of Street Sweeping staff
Road length in km Ward No A B C
Total PK A
PK B
PK C
Total PK
1 5.30 3.2 4.55 13.05 5 1 1 7
2 - 5.6 2.69 8.29 - 2 1 3
3 7.05 - - 7.05 7 - - 7
4 3.45 16.83 7.31 27.59 3 6 1 10
5 2.88 5.33 - 8.21 3 2 - 5
6 8.6 - - 8.6 9 - - 9
7 11.32 1.06 2.91 15.29 11 - 1 12
8 8.63 3.13 6.04 17.80 9 1 1 11
9 7.5 .98 2.59 11.07 8 - 1 9
10 8.02 1.16 .56 9.74 8 - - 8
11 11.05 11.90 - 22.95 11 4 - 15
12 9.5 16.62 36.05 62.17 10 6 6 22
13 8.01 3.83 3.84 15.68 8 1 1 10
14 3.01 1.56 5.89 10.46 3 1 1 5
15 3.89 6.22 1.91 12.02 4 2 - 6
16 7.29 13.08 12.09 32.46 7 4 2 13
17 14.24 2.97 4.85 22.06 14 1 1 16
18 14.63 12.41 54.45 81.58 15 4 9 28
19 8.4 46.69 24.81 79.90 8 16 4 28
20 8.12 25.28 9.39 42.79 8 8 2 18
21 10.11 12.22 29.35 51.68 10 4 5 19
22 5.79 8.31 9.32 23.42 6 3 2 11
23 5.32 7.11 1.29 13.72 5 2 - 7
24 9.35 0.43 - 9.78 9 - - 9
25 18.27 - - 18.27 18 - - 18
26 10.83 3.80 1.48 16.11 11 1 - 12
27 8.19 - - 8.19 8 - - 8
28 14.68 0.72 0.65 16.05 15 - - 15
29 9.24 - - 9.24 9 - - 9
30 3.08 4.72 - 7.80 3 1 - 4
31 3.59 10.88 3.93 18.40 4 4 1 9
32 9.53 14.72 6.79 31.04 10 5 1 16
33 5.46 6.88 24.72 37.06 5 2 4 11
34 4.80 9.56 125.97 140.33 5 3 20 28
35 1.96 5.69 11.24 18.89 2 2 2 6
36 3.80 10.94 7.50 22.24 4 4 1 9
37 13.28 21.99 23.56 58.83 13 7 4 24
38 6.78 12.44 4.64 23.86 7 4 1 12
25
39 8.57 1.02 - 9.59 9 - - 9
40 1.99 2.31 1.71 6.01 2 1 - 3
41 5.50 - - 5.50 6 - - 6
42 7.3 1.34 - 8.64 7 - - 7
43 10.55 2.94 1.69 15.18 11 1 - 12
44 3.98 4.88 7.07 15.93 4 2 1 7
45 12.57 15.59 18.25 46.41 13 5 3 21
46 6.13 4.11 10.01 20.25 6 1 2 9
47 10.99 0.8 - 11.79 11 - - 11
48 4.69 5.39 2.35 12.43 5 2 - 7
49 3.49 5.09 2.25 10.83 4 2 - 6
50 5.49 3.92 1.85 11.26 5 1 - 6
51 3.53 7.94 0.81 12.28 4 3 - 7
52 3.54 2.83 2.0 8.37 4 1 - 5
53 3.68 2.79 1.84 8.31 4 1 - 5
54 3.41 4.23 3.64 11.28 3 1 - 4
55 9.78 6.63 3.04 19.45 10 2 - 12
56 18.4 36.43 15.57 70.40 18 12 3 33
57 6.91 5.89 1.45 14.25 7 2 - 9
58 3.67 6.10 2.66 12.43 4 2 - 6
59 12.74 11.11 3.92 27.77 13 4 1 18
60 9.5 12.31 20.21 42.02 10 4 3 17
61 10.31 2.51 1.84 14.66 10 1 1 12
62 14.05 3.54 8.00 25.59 14 1 1 16
63 - 40.94 60.17 101.11 - 14 10 24
64 - 26.75 26.93 53.68 - 9 5 14
65 - 40.95 51.55 92.5 - 14 9 23
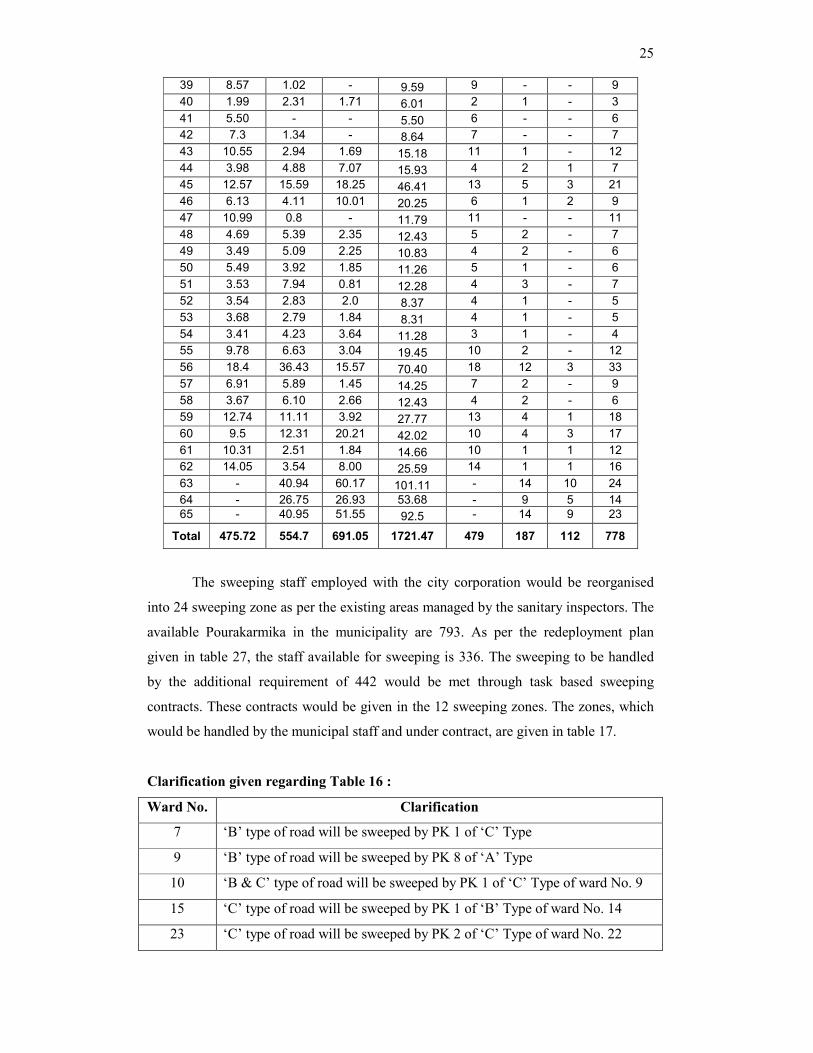
Total 475.72 554.7 691.05 1721.47 479 187 112 778
The sweeping staff employed with the city corporation would be reorganised
into 24 sweeping zone as per the existing areas managed by the sanitary inspectors. The
available Pourakarmika in the municipality are 793. As per the redeployment plan
given in table 27, the staff available for sweeping is 336. The sweeping to be handled
by the additional requirement of 442 would be met through task based sweeping
contracts. These contracts would be given in the 12 sweeping zones. The zones, which
would be handled by the municipal staff and under contract, are given in table 17.
Clarification given regarding Table 16 :
Ward No. Clarification
7 ‘B’ type of road will be sweeped by PK 1 of ‘C’ Type
9 ‘B’ type of road will be sweeped by PK 8 of ‘A’ Type
10 ‘B & C’ type of road will be sweeped by PK 1 of ‘C’ Type of ward No. 9
15 ‘C’ type of road will be sweeped by PK 1 of ‘B’ Type of ward No. 14
23 ‘C’ type of road will be sweeped by PK 2 of ‘C’ Type of ward No. 22
26
24 ‘B’ type of road will be sweeped by PK 1 of ‘C’ Type of ward No. 2
26 ‘C’ type of road will be sweeped by PK 11 of ‘A’ Type
28 ‘B & C’ type of road will be sweeped by PK 15 of ‘A’ Type
39 ‘B’ type of road will be sweeped by PK 9 of ‘A’ Type
40 ‘C’ type of road will be sweeped by PK 1 of ‘B’ Type
42 ‘B’ type of road will be sweeped by PK 6 of ‘A’ Type of ward No. 41
43 ‘C’ type of road will be sweeped by PK 1 of ‘C’ Type of ward No. 31
47 ‘B’ type of road will be sweeped by PK 2 of ‘C’ Type of ward No. 46
48 ‘B’ type of road will be sweeped by PK 5 of ‘A’ Type
49 ‘C’ type of road will be sweeped by PK 2 of ‘B’ Type
50 ‘C’ type of road will be sweeped by PK 1 of ‘C’ Type of ward No. 61
51 ‘C’ type of road will be sweeped by PK 3 of ‘B’ Type
52 ‘C’ type of road will be sweeped by PK 4 of ‘A’ Type
53 ‘C’ type of road will be sweeped by PK 4 of ‘A’ Type
54 ‘C’ type of road will be sweeped by PK 1 of ‘B’ Type of ward No. 53
55 ‘C’ type of road will be sweeped by PK 3 of ‘C’ Type of ward No. 56
57 ‘C’ type of road will be sweeped by PK 2 of ‘B’ Type
58 ‘C’ type of road will be sweeped by PK 4 of ‘A’ Type
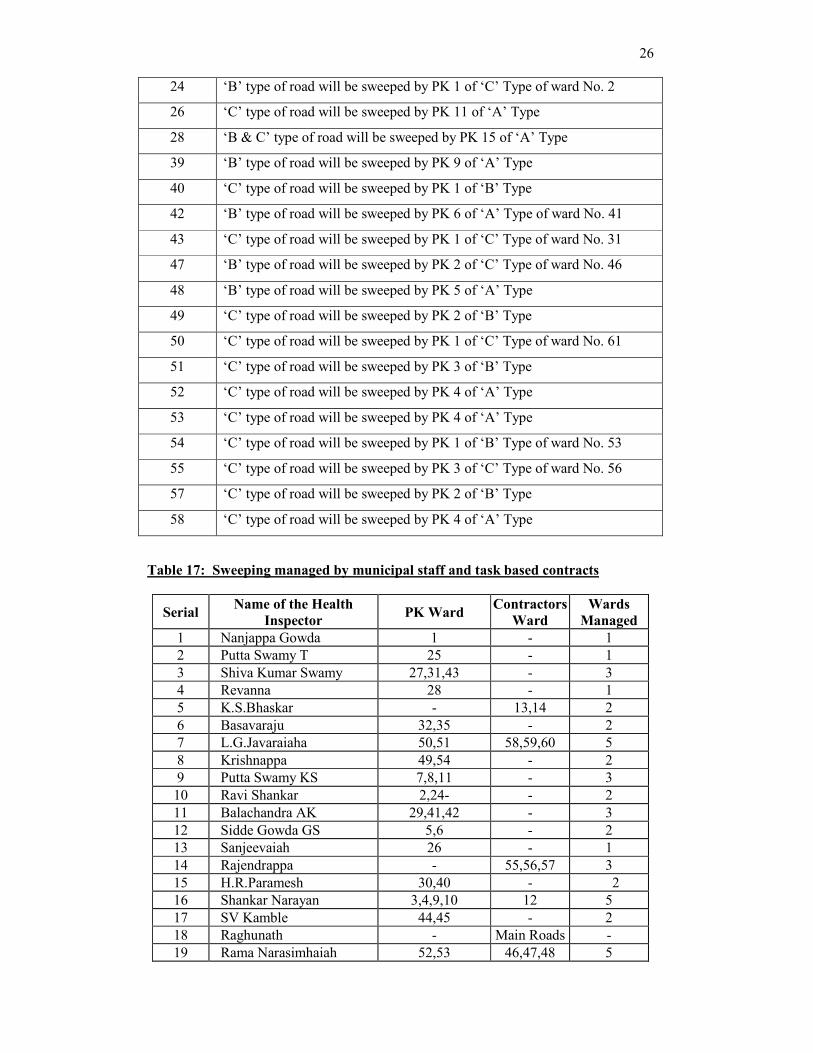
Table 17: Sweeping managed by municipal staff and task based contracts
Serial Name of the Health
Inspector PK Ward
Contractors
Ward
Wards
Managed
1 Nanjappa Gowda 1 - 1
2 Putta Swamy T 25 - 1
3 Shiva Kumar Swamy 27,31,43 - 3
4 Revanna 28 - 1
5 K.S.Bhaskar - 13,14 2
6 Basavaraju 32,35 - 2
7 L.G.Javaraiaha 50,51 58,59,60 5
8 Krishnappa 49,54 - 2
9 Putta Swamy KS 7,8,11 - 3
10 Ravi Shankar 2,24- - 2
11 Balachandra AK 29,41,42 - 3
12 Sidde Gowda GS 5,6 - 2
13 Sanjeevaiah 26 - 1
14 Rajendrappa - 55,56,57 3
15 H.R.Paramesh 30,40 - 2
16 Shankar Narayan 3,4,9,10 12 5
17 SV Kamble 44,45 - 2
18 Raghunath - Main Roads -
19 Rama Narasimhaiah 52,53 46,47,48 5
27
20
Kumari Geetha Nirmal Nagar
Assistant - -
21 Rama Swamy (rtd. emp) - 21,22,23 3
22 Chaluvaiah(rtd.emp) 61,62 63,64,65 5
23
Nagaraj Rao (rtd.emp)
-
15,16,17
18,19,20 6
24 Ramachandraiah (rtd.emp) - 33,34,36 3
25 Kantaraj (rtd.emp) - 37,38,39 3
26
Jetendra Kumar (rtd.emp) Vehicle Section,
SWM Plant - -
Total number of wards 35 30 65
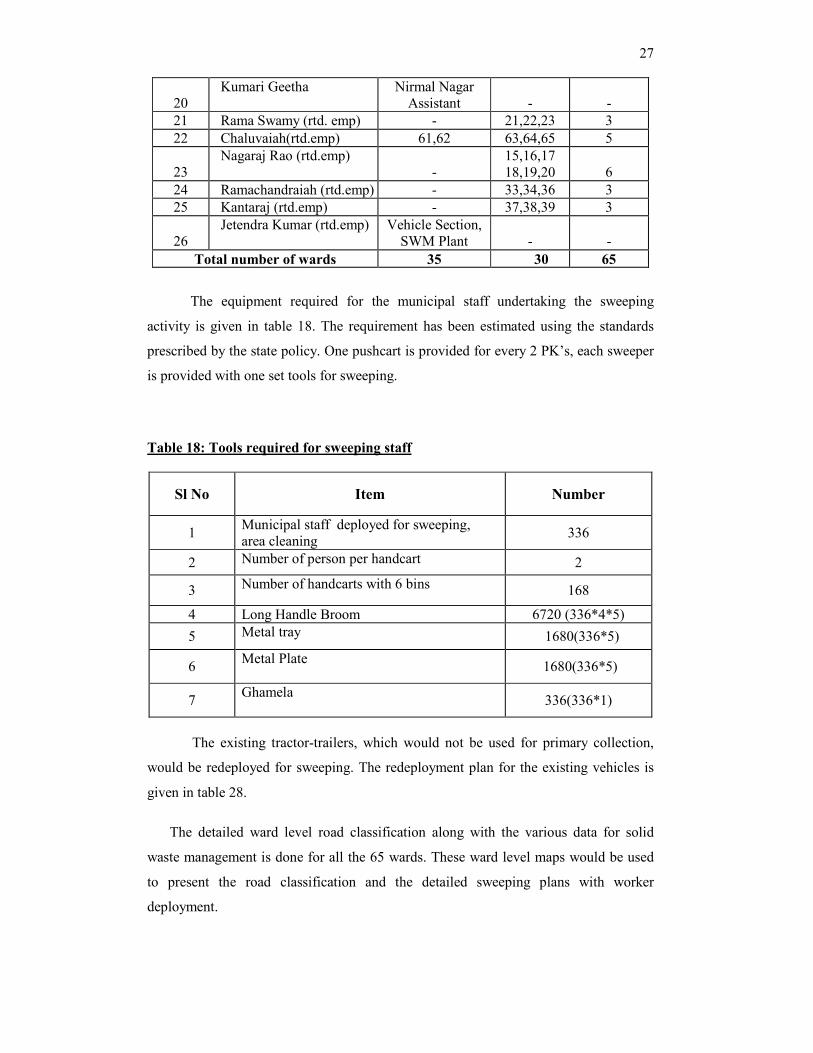
The equipment required for the municipal staff undertaking the sweeping
activity is given in table 18. The requirement has been estimated using the standards
prescribed by the state policy. One pushcart is provided for every 2 PK’s, each sweeper
is provided with one set tools for sweeping.
Table 18: Tools required for sweeping staff
Sl No Item Number
1 Municipal staff deployed for sweeping,
area cleaning 336
2 Number of person per handcart 2
3 Number of handcarts with 6 bins 168
4 Long Handle Broom 6720 (336*4*5)
5 Metal tray 1680(336*5)
6 Metal Plate
1680(336*5)
7 Ghamela
336(336*1)
The existing tractor-trailers, which would not be used for primary collection,
would be redeployed for sweeping. The redeployment plan for the existing vehicles is
given in table 28.
The detailed ward level road classification along with the various data for solid
waste management is done for all the 65 wards. These ward level maps would be used
to present the road classification and the detailed sweeping plans with worker
deployment.

28
7.1 Primary collection of waste
The door-to door collection is proposed to be organised ward wise. It is proposed
that for each of the ward a coordinating agency for the door-to-door collection would
be identified. This agency would be constituted from all the RWA in the area, a ward
committee or a Non government organisation who would take the overall responsibility
of the primary collection operation. These agencies would in turn employ self-help
groups for door-to-door collection. This approach is proposed, as we would get the
advantage of stable coordinating group and we would involve the local self-groups in
income earning activity. Further this approach would reduce the number of agencies
with which the city corporation has to interact.
At present based on the interest evinced from the various wards and the
discussion held, the type of coordinating agency, which would operate in each of the
ward, has been identified. In some of the wards the specific agency that would
coordinate has also been identified. In each ward it is proposed that 3 self-help groups
would operate for door-to-door collection. A collection zone is identified for each of
the agencies. Efforts have been undertaken to identify the RWA’s and SHG’s.
The table 19 shows the registered Resident Welfare Association’s and self help
group involved in door to door collection of waste. The process of identifying the
SHG’s is in process.
Table 19: Ward wise Resident Welfare Association And Self Help Group.
Sl.No Ward No Households RWA SHG
1. 1 1924 3
2. 2 2073 1 -
3. 3 975 3 -
4. 4 2273 1 -
5. 5 1824 1 --
6. 6 2067 2 -
7. 7 1973 1 -
8. 8 2805 1 3
9. 9 2268 1 -
10. 10 2210 - -
11. 11 2144 1 -
12. 12 4504 - -
13. 13 2822 1 -
14. 14 1361 - -
15. 15 3176 - -
16. 16 3013 1 -
29
17. 17 3924 1 -
18. 18 7040 1 -
19. 19 6043 4 -
20. 20 3829 - -
21. 21 2707 1 -
22. 22 2297 1 -
23. 23 2215 - -
24. 24 1414 1 2
25. 25 1132 - 3
26. 26 1186 3 -
27. 27 877 - -
28. 28 2058 1 -
29. 29 1769 2 -
30. 30 1419 3 -
31. 31 1714 - -
32. 32 2802 1 -
33. 33 3588 - -
34. 34 9641 7 5
35. 35 3680 4 -
36. 36 2842 3 1
37. 37 3336 1 -
38. 38 2496 1 -
39. 39 2790 - -
40. 40 2045 2 -
41. 41 1234 1 -
42. 42 1780 - -
43. 43 1867 2 -
44. 44 1684 4 -
45. 45 3602 2 -
46. 46 2217 3 -
47. 47 3404 4 -
48. 48 2185 3 -
49. 49 1106 2 -
50. 50 1718 - -
51. 51 2517 2 -
52. 52 1561 - -
53. 53 1994 4 4
54. 54 2121 1 1
55. 55 2718 - -
56. 56 4623 2 -
57. 57 4509 - -
58. 58 2196 - -
59. 59 2168 2 -
60. 60 3740 - -
61. 61 1982 - -
62. 62 1675 - -
63. 63 3197 1 -
64. 64 3501 - -
65. 65 5401 - -
174956 87 19

30
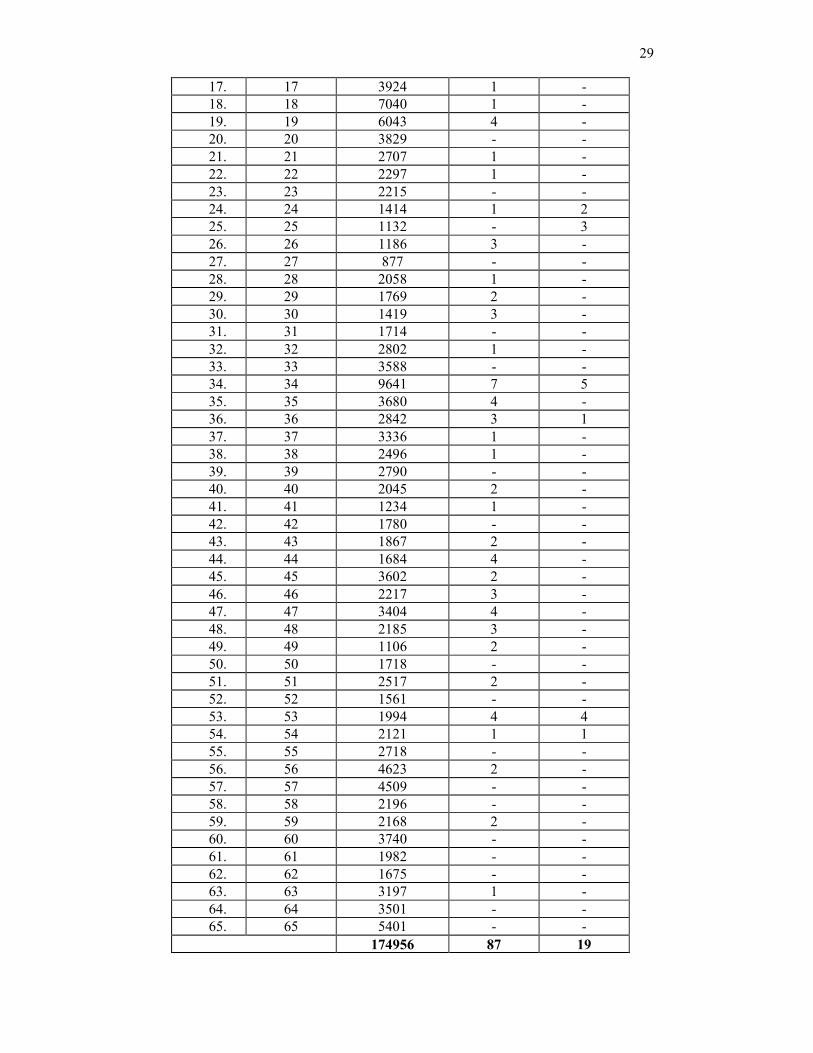
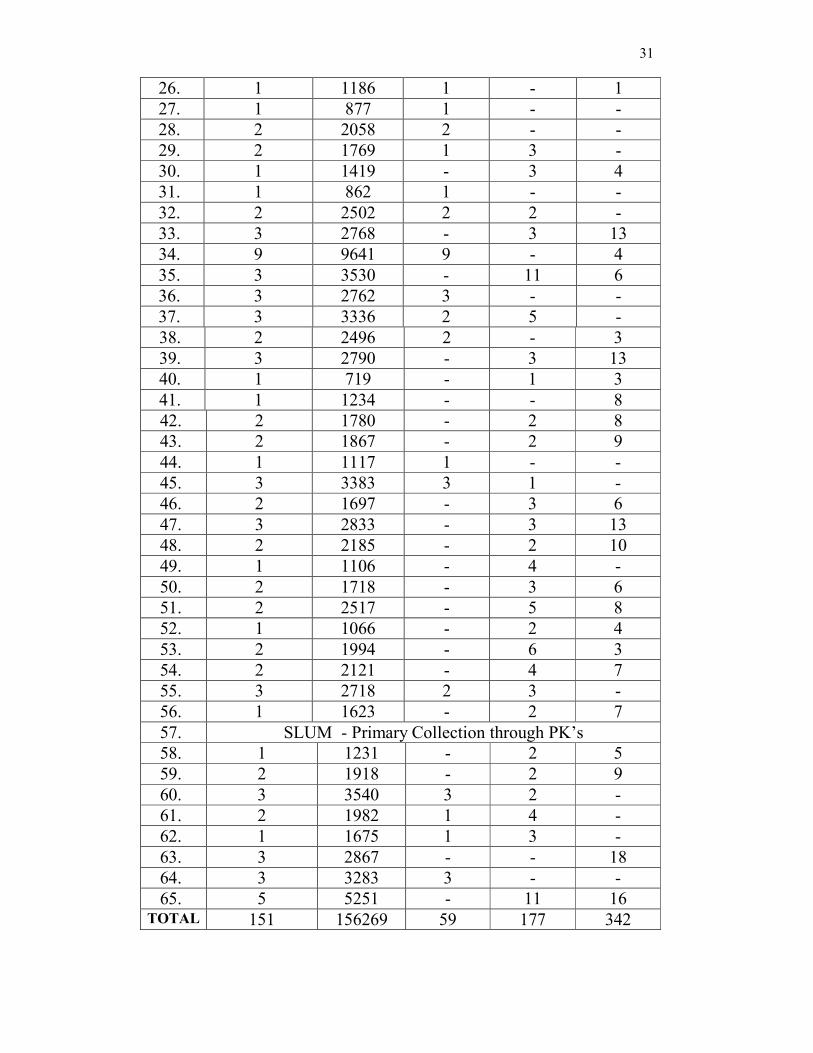
The choice of the equipment for primary collection would be left to the
decision of the SHG’s. But for the purposes of budgeting the requirements of the
vehicles discussions have been held with the existing door to door collection systems,
Non government organisation and the RWA groups. This discussion shows a
preference such that the coverage would be 38 % using auto tippers, 35 % using
handcart and 27 % using tricycle. The table 20 list out the type of vehicle to be
procured at ward level for primary collection of waste. This has been used to estimate
the requirement of equipment for primary collection as detailed in table 21.
Table 20: PRIMARY WASTE COLLECTION
(NON SLUM HOUSE HOLDS)
(OPERATED THROUGH SHG’S)
Ward
No.
No. of
command
areas
No of
House
holds
Auto
Tipper Tricycle Push cart
1. 2 1924 2 - -
2. 2 2073 2 - -
3. 1 975 - - 6
4. 2 2273 - - 14
5. 2 1824 - - 11
6. 2 2067 - - 13
7. 2 1704 - 7 -
8. 3 2725 - 6 8
9. 2 2268 - 4 8
10. 2 2070 - 4 7
11. 2 2061 - 9 7
12. 4 3724 2 7 -
13. 2 2290 - - 14
14. 1 1361 - - 9
15. 3 2704 1 4 5
16. 3 3013 3 - -
17. 4 3924 4 - -
18. 7 7040 - 15 22
19. 6 5873 1 16 6
20. 4 3671 - 4 17
21. 2 2447 2 - -
22. 2 2147 2 - -
23. 2 2215 - 2 11
24. 1 1414 1 2 -
25. 1 1132 1 - -
31
26. 1 1186 1 - 1
27. 1 877 1 - -
28. 2 2058 2 - -
29. 2 1769 1 3 -
30. 1 1419 - 3 4
31. 1 862 1 - -
32. 2 2502 2 2 -
33. 3 2768 - 3 13
34. 9 9641 9 - 4
35. 3 3530 - 11 6
36. 3 2762 3 - -
37. 3 3336 2 5 -
38. 2 2496 2 - 3
39. 3 2790 - 3 13
40. 1 719 - 1 3
41. 1 1234 - - 8
42. 2 1780 - 2 8
43. 2 1867 - 2 9
44. 1 1117 1 - -
45. 3 3383 3 1 -
46. 2 1697 - 3 6
47. 3 2833 - 3 13
48. 2 2185 - 2 10
49. 1 1106 - 4 -
50. 2 1718 - 3 6
51. 2 2517 - 5 8
52. 1 1066 - 2 4
53. 2 1994 - 6 3
54. 2 2121 - 4 7
55. 3 2718 2 3 -
56. 1 1623 - 2 7
57. SLUM - Primary Collection through PK’s
58. 1 1231 - 2 5
59. 2 1918 - 2 9
60. 3 3540 3 2 -
61. 2 1982 1 4 -
62. 1 1675 1 3 -
63. 3 2867 - - 18
64. 3 3283 3 - -
65. 5 5251 - 11 16 TOTAL 151 156269 59 177 342

32
Table 21: Requirement of primary collection equipment (through SHG’s)
Number Detail
1 Population of the city 850000
2 Number of households 174956
3 Less slum households 18687
4 Non slum households 156269
5 Average size of collection zone (households) 1000
6 Number of collection zones 151
7 Number of auto tipper per collection zone 1
8 Number of tricycle per collection zone 4
9 Number of handcarts per collection zone 6
13 Number of Auto tipper zones 59
14 Number of handcart zones 50
15 Number of tricycle zones 42
16 Number of auto tippers proposed 59
17 Number of handcarts proposed 342
18 Number of tricycles proposed 177
The primary collection of wastes from the slum would be handled by the
municipal pourakarmika. The staff requirement and the equipment requirements have
been calculated in the table 22
Table 22: Staff and equipment deployment for slums
Number Details
1 Total Slum house holds 18687
2 Number of household per 40 litre container 20
3 Number of 40 litre HDPE containers required 937
4 Number of Pourakarmika required 53
5 Number of handcarts required 30
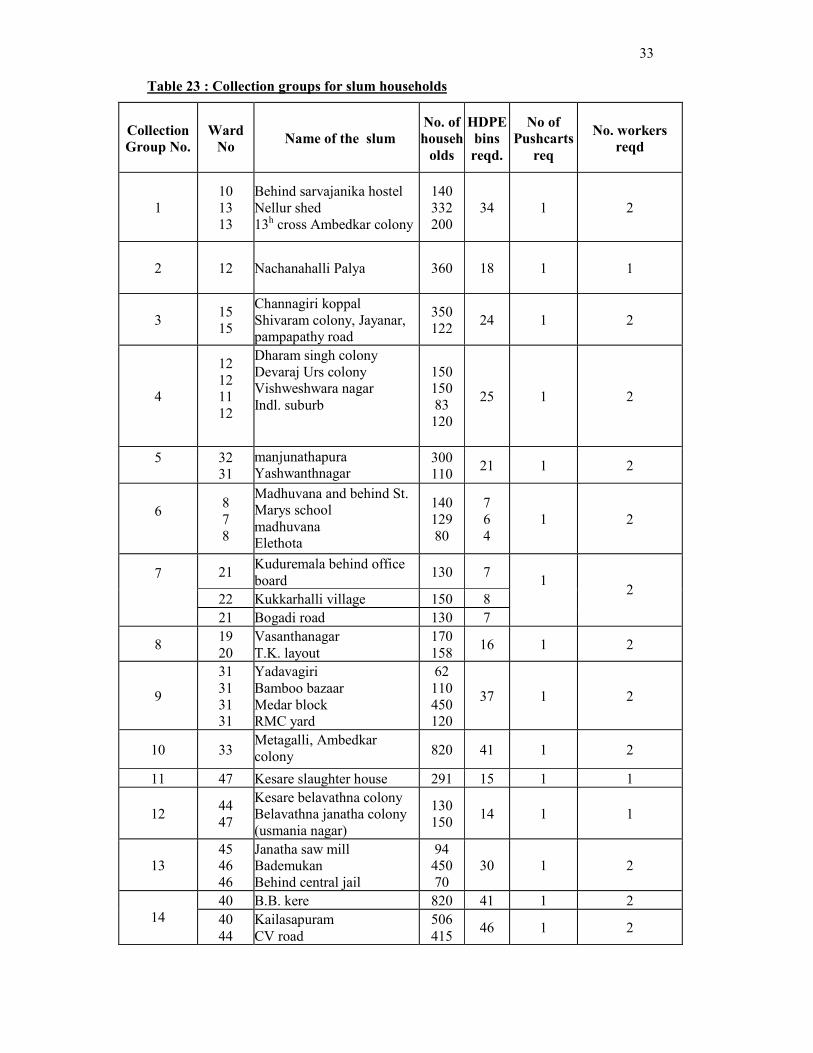
The slums are grouped such that those which are nearby are managed by a
single pourakarmika. The details are given in table 23.
Litter Bins : 400 Nos. of 100 liter litter bins are to be kept in tourist places, near
temples, Main Roads, Bus stops, Railway Stations, markets, Big Commercial Shops.
33
Table 23 : Collection groups for slum households
Collection
Group No.
Ward
No Name of the slum
No. of
househ
olds
HDPE
bins
reqd.
No of
Pushcarts
req
No. workers
reqd
1
10
13
13
Behind sarvajanika hostel
Nellur shed
13h cross Ambedkar colony
140
332
200
34 1 2
2 12 Nachanahalli Palya 360 18 1
1
3 15
15
Channagiri koppal
Shivaram colony, Jayanar,
pampapathy road
350
122 24 1 2
4
12
12
11
12
Dharam singh colony
Devaraj Urs colony
Vishweshwara nagar
Indl. suburb
150
150
83
120
25 1 2
5
32
31
manjunathapura
Yashwanthnagar 300
110 21 1 2
6
8
7
8
Madhuvana and behind St.
Marys school
madhuvana
Elethota
140
129
80
7
6
4
1 2
21 Kuduremala behind office
board 130 7
22 Kukkarhalli village 150 8
1 7
21 Bogadi road 130 7
2
8 19
20
Vasanthanagar
T.K. layout
170
158 16 1 2
9
31
31
31
31
Yadavagiri
Bamboo bazaar
Medar block
RMC yard
62
110
450
120
37 1 2
10 33 Metagalli, Ambedkar
colony 820 41 1 2
11 47 Kesare slaughter house 291 15 1 1
12 44
47
Kesare belavathna colony
Belavathna janatha colony
(usmania nagar)
130
150 14 1 1
13
45
46
46
Janatha saw mill
Bademukan
Behind central jail
94
450
70
30 1 2
40 B.B. kere 820 41 1 2
14 40
44
Kailasapuram
CV road
506
415 46 1 2

34
15 45
44
Vandemataram
Behind KSRTC
125
152 14 1 1
16
52
52
52
52
Durgama temple
Siddappji B block
Chamundeshwari Rd,
Gandhinagar
Chamundeshwari nagar
86
76
113
220
25 1 2
17
57
58
Kyathmaranahalli A.K
colony
Kyathmaranahalli
180
965
57 1 2
18 57 Ghousia nagar 4400 220 4 8
19
58
59
Gandhinagar beedi workers
colony
Ghousianagar, 2nd stage B
Block
150
250
20 1 2
20 56 shanthinagar 3000 150 3 6
35 Behind P.K.sanitorium 150 8 1 21
36 Gokulum 80 4 1 1
22 64 Giriyabovi Palya 218 11
23 60 Jyothinagar, PK colony 200 10 1 2
24 63 Kurubarahalli 330 17 1 2
Total 18687 937 30 53
Bulk Generators :
Market :
All the 3 major markets (Devaraja Market, Vanivilas Market & Mandi
Market) have been out sourced. Quantity of waste generated is shown in Table 8
Hotels And Choultries :
Contract between City Corporation and Service Provider to collect on daily
basis from identified choultries and hotels and on occasional basis, based on demand or
per use basis. Corporation in turn will charge the bulk generator. Quantity of waste
generated is shown in Table 8
7.2 Secondary storage sites
The secondary storage has been designed for a capacity of 250 tons per day. As
per the typical practice in the state planning process the secondary storage would
consist of 4.5 m3 and 3 m3 containers with capacity in ratio of 60: 40. The calculation
of the requirement of the containers is given in table 24. 83 containers each of 4.5 m3
and 3 m3 are proposed. To carry these containers 17 dumper placers are required. So 17
35
numbers of each of these containers are required as replacement containers. The
number of containers to be procured is 100 each of 3m3 and 4.5 m3.
Table 24: Requirement of storage containers.
Detail Unit Quantity
Quantity of wet waste ton 200
Providing excess capacity at 25 % ton 50
Design capacity for storage facility ton 250
Waste capacity of 3m3 container ton 1.2
Waste capacity of 4.5 m3 container ton 1.8
% waste handled by 3 m3 container % 40
% waste handled by 4.5 m3 container % 60
Number of 3 m3 containers required number 83
Number of 4.5 m3 containers required number 83
No. of replacement containers required Number 34
Total No. of containers required Number 200
No. of Dumper Placer required Number 17
No.of Dumper Placer already available Number 2
No.of Dumper Placer to be Procured Number 15
The location where these 3 m3 and 4.5 m3 containers would be placed has been
identified and shown in Annexure 1 and are displayed on the map.
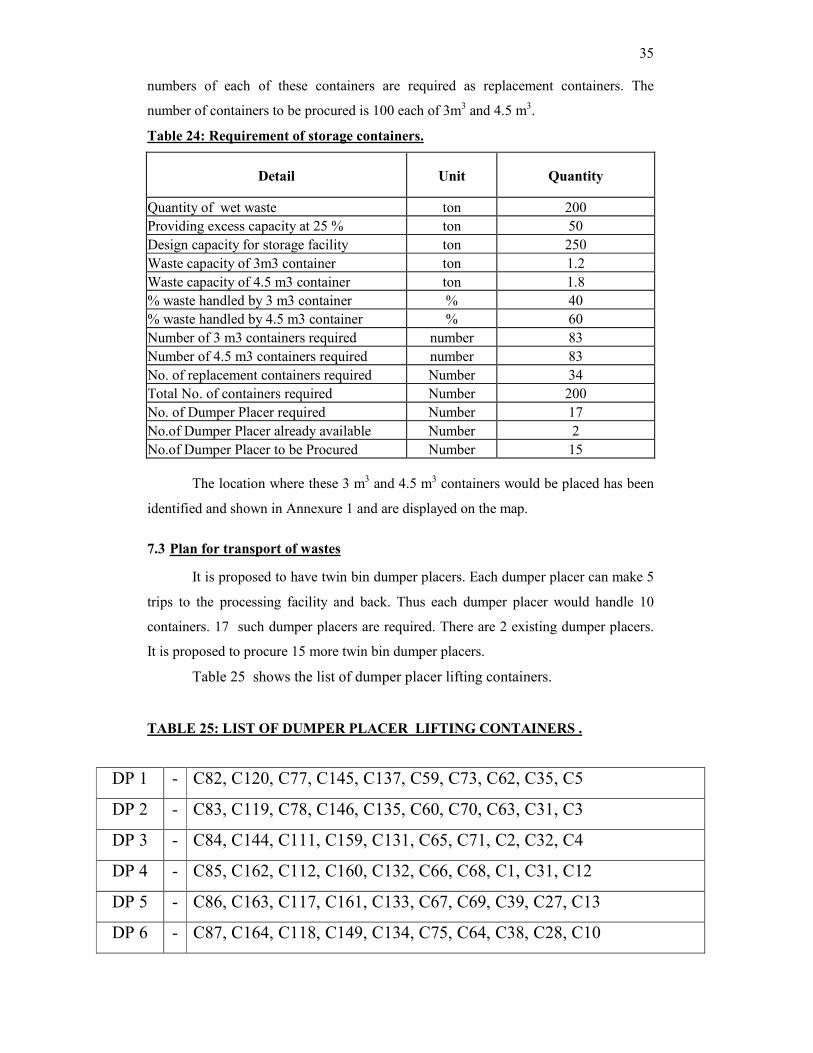
7.3 Plan for transport of wastes
It is proposed to have twin bin dumper placers. Each dumper placer can make 5
trips to the processing facility and back. Thus each dumper placer would handle 10
containers. 17 such dumper placers are required. There are 2 existing dumper placers.
It is proposed to procure 15 more twin bin dumper placers.
Table 25 shows the list of dumper placer lifting containers.
TABLE 25: LIST OF DUMPER PLACER LIFTING CONTAINERS .
DP 1 - C82, C120, C77, C145, C137, C59, C73, C62, C35, C5
DP 2 - C83, C119, C78, C146, C135, C60, C70, C63, C31, C3
DP 3 - C84, C144, C111, C159, C131, C65, C71, C2, C32, C4
DP 4 - C85, C162, C112, C160, C132, C66, C68, C1, C31, C12
DP 5 - C86, C163, C117, C161, C133, C67, C69, C39, C27, C13
DP 6 - C87, C164, C118, C149, C134, C75, C64, C38, C28, C10
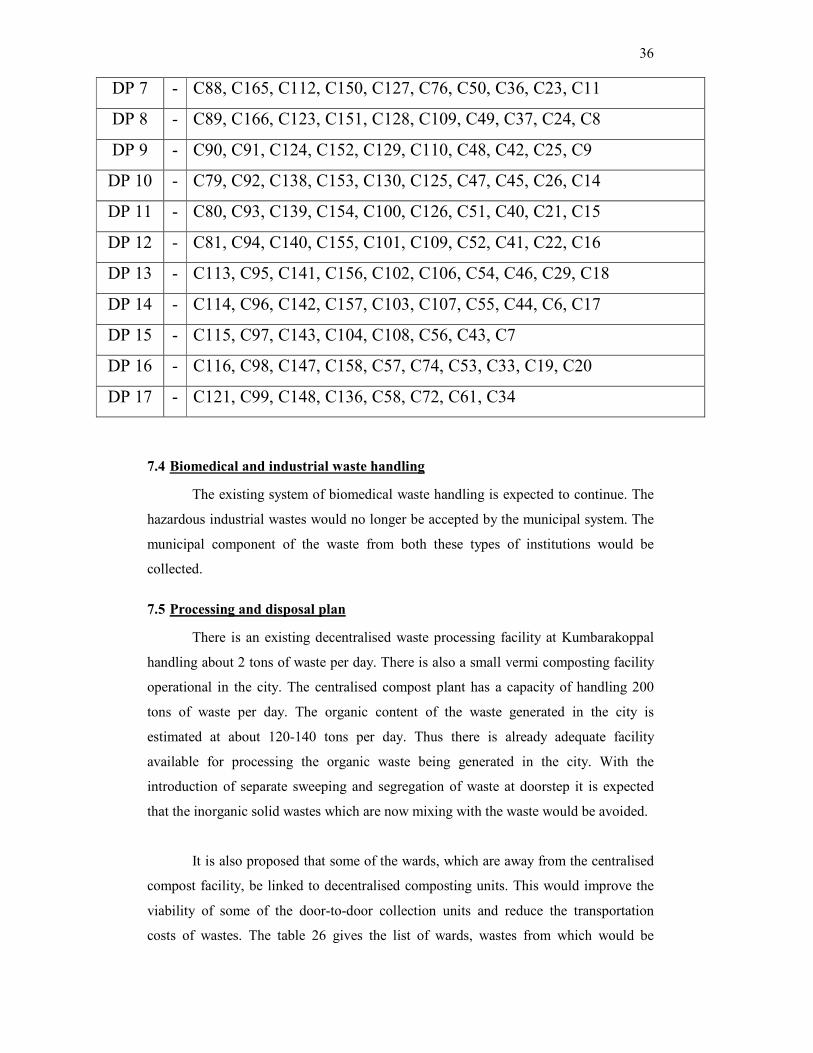
36
DP 7 - C88, C165, C112, C150, C127, C76, C50, C36, C23, C11
DP 8 - C89, C166, C123, C151, C128, C109, C49, C37, C24, C8
DP 9 - C90, C91, C124, C152, C129, C110, C48, C42, C25, C9
DP 10 - C79, C92, C138, C153, C130, C125, C47, C45, C26, C14
DP 11 - C80, C93, C139, C154, C100, C126, C51, C40, C21, C15
DP 12 - C81, C94, C140, C155, C101, C109, C52, C41, C22, C16
DP 13 - C113, C95, C141, C156, C102, C106, C54, C46, C29, C18
DP 14 - C114, C96, C142, C157, C103, C107, C55, C44, C6, C17
DP 15 - C115, C97, C143, C104, C108, C56, C43, C7
DP 16 - C116, C98, C147, C158, C57, C74, C53, C33, C19, C20
DP 17 - C121, C99, C148, C136, C58, C72, C61, C34
7.4 Biomedical and industrial waste handling
The existing system of biomedical waste handling is expected to continue. The
hazardous industrial wastes would no longer be accepted by the municipal system. The
municipal component of the waste from both these types of institutions would be
collected.
7.5 Processing and disposal plan
There is an existing decentralised waste processing facility at Kumbarakoppal
handling about 2 tons of waste per day. There is also a small vermi composting facility
operational in the city. The centralised compost plant has a capacity of handling 200
tons of waste per day. The organic content of the waste generated in the city is
estimated at about 120-140 tons per day. Thus there is already adequate facility
available for processing the organic waste being generated in the city. With the
introduction of separate sweeping and segregation of waste at doorstep it is expected
that the inorganic solid wastes which are now mixing with the waste would be avoided.
It is also proposed that some of the wards, which are away from the centralised
compost facility, be linked to decentralised composting units. This would improve the
viability of some of the door-to-door collection units and reduce the transportation
costs of wastes. The table 26 gives the list of wards, wastes from which would be

37
combined to set up decentralised waste processing facility. The lands for these
decentralised facilities are being identified. These wards till the facilities are set up and
the balance of wards would be linked to the centralised plant. The centralised plant
would be made functioning to accept the wastes.
Table 26 : List of wards covered by decentralised & centralised processing facility
Number Proposed waste processing Wards accessing facility
1 Decentralised facility 1: at Kumbarakoppal 35, (Already existing
facility)
2 Decentralised facility 2: at Hebbal 34, (work started)
3 Decentralised facility 3: at Gokulam 36,33,32, ( work started)
4 Decentralised facility 4: at D Agrahara 62,7,1
5 Decentralised facility 5: at Metagalli 33
6 Decentralised facility 6: at Kurimandi 47,48, 54(P)
7 Decentralised facility 7: at OD Block 45, 46, 49
8 Decentralised facility 8: at Paduvarahally Smashana 37,38
9 Decentralised facility 9: near Kukkarahally bund 22,23,39
10 Decentralised facility 10: at ward no. 19 19.21,20
12 Decentralised facility 12: at Satyanagar 53, 54(P), 55,56
13 Existing centralised facility at Vidyaranyapuram Remaining wards
The rejects from both the centralised facility and the decentralised facility
would be transported using tipper truck to the landfill site and disposed. Landfill site
identification is in progress.
7.6 IEC Activities in Mysore
Last year, IEC activities in Mysore was entrusted to People Science Forum
(PSF), a part of Karnataka Rajya Vigyana Parishat (KRVP). This year for selection of
NGO pertaining to IEC activities, fresh tender have been invited. Before,
implementation of Nirmala Nagara programme, jatha’s, workshops; campaigns on
Solid Waste Management were being held under various initiatives.
Involvement of SHG’s & RWA :
After the implementation of Nirmal Nagara programme, House to house
campaign on SWM is being held. School children Eco club has been formed, training
for MCC staffs and two workshops have been organized for RWA formation. At
Dasara exhibitions 2005, Public dialogues, street plays were held. As of now about 87
RWAs have been formed in the city. Awareness programme in all the 3 constituency
to promote door to door collection of waste involving SHG’s & RWA’s was held last
38
months. Already 19 SHG’s have come forward for door to door collection of waste at
their respective wards.
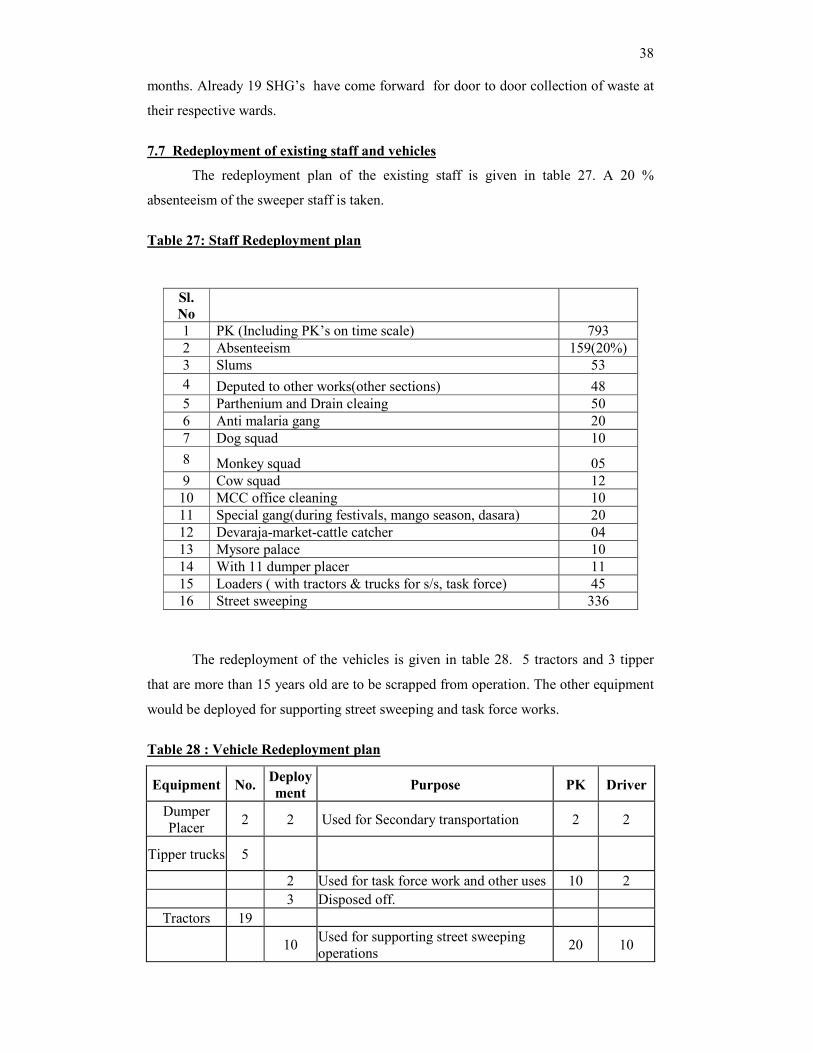
7.7 Redeployment of existing staff and vehicles
The redeployment plan of the existing staff is given in table 27. A 20 %
absenteeism of the sweeper staff is taken.
Table 27: Staff Redeployment plan
Sl.
No
1 PK (Including PK’s on time scale) 793
2 Absenteeism 159(20%)
3 Slums 53
4 Deputed to other works(other sections) 48
5 Parthenium and Drain cleaing 50
6 Anti malaria gang 20
7 Dog squad 10
8 Monkey squad 05
9 Cow squad 12
10 MCC office cleaning 10
11 Special gang(during festivals, mango season, dasara) 20
12 Devaraja-market-cattle catcher 04
13 Mysore palace 10
14 With 11 dumper placer 11
15 Loaders ( with tractors & trucks for s/s, task force) 45
16 Street sweeping 336
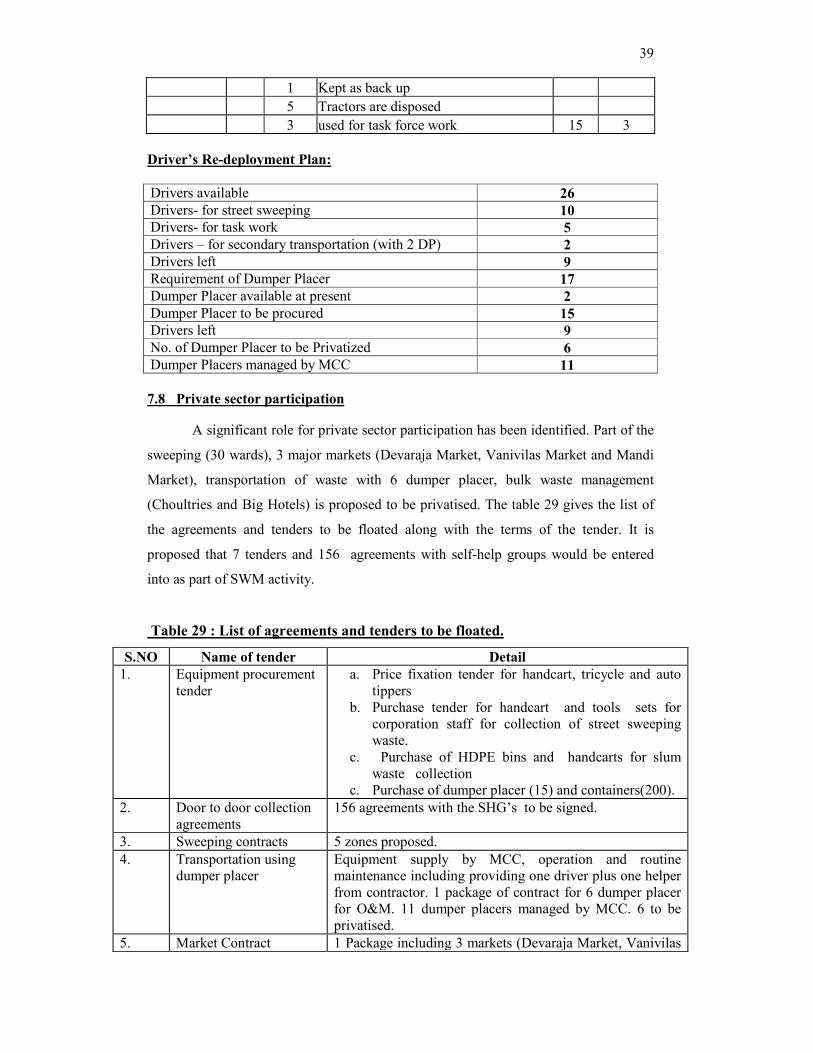
The redeployment of the vehicles is given in table 28. 5 tractors and 3 tipper
that are more than 15 years old are to be scrapped from operation. The other equipment
would be deployed for supporting street sweeping and task force works.
Table 28 : Vehicle Redeployment plan
Equipment No. Deploy
ment Purpose PK Driver
Dumper
Placer 2 2 Used for Secondary transportation 2 2
Tipper trucks 5
2 Used for task force work and other uses 10 2
3 Disposed off.
Tractors 19
10 Used for supporting street sweeping
operations 20 10
39
1 Kept as back up
5 Tractors are disposed
3 used for task force work 15 3
Driver’s Re-deployment Plan:
Drivers available 26
Drivers- for street sweeping 10
Drivers- for task work 5
Drivers – for secondary transportation (with 2 DP) 2
Drivers left 9
Requirement of Dumper Placer 17
Dumper Placer available at present 2
Dumper Placer to be procured 15
Drivers left 9
No. of Dumper Placer to be Privatized 6
Dumper Placers managed by MCC 11
7.8 Private sector participation
A significant role for private sector participation has been identified. Part of the
sweeping (30 wards), 3 major markets (Devaraja Market, Vanivilas Market and Mandi
Market), transportation of waste with 6 dumper placer, bulk waste management
(Choultries and Big Hotels) is proposed to be privatised. The table 29 gives the list of
the agreements and tenders to be floated along with the terms of the tender. It is
proposed that 7 tenders and 156 agreements with self-help groups would be entered
into as part of SWM activity.
Table 29 : List of agreements and tenders to be floated.
S.NO Name of tender Detail
1. Equipment procurement
tender
a. Price fixation tender for handcart, tricycle and auto
tippers
b. Purchase tender for handcart and tools sets for
corporation staff for collection of street sweeping
waste.
c. Purchase of HDPE bins and handcarts for slum
waste collection
c. Purchase of dumper placer (15) and containers(200).
2. Door to door collection
agreements
156 agreements with the SHG’s to be signed.
3. Sweeping contracts 5 zones proposed.
4. Transportation using
dumper placer
Equipment supply by MCC, operation and routine
maintenance including providing one driver plus one helper
from contractor. 1 package of contract for 6 dumper placer
for O&M. 11 dumper placers managed by MCC. 6 to be
privatised.
5. Market Contract 1 Package including 3 markets (Devaraja Market, Vanivilas
40
Market and Mandi Market)
6. Bulk generators :
(Hotels and Choultries)
both regular and
occasional contract
Contract between City Corporation and service provider to
collect on daily basis from identified generators and on
occasional basis, based on demand or per use basis.
Corporation in turn will charge the bulk generator.
7. Main Roads contract 1 zone for main roads
8. Processing Operation and maintenance contract for the centralised
facility is proposed.
9. Disposal Build operator and transfer (BOT) contract would be signed
with the private agency.
8 Financial aspects
8.1 Total investments required
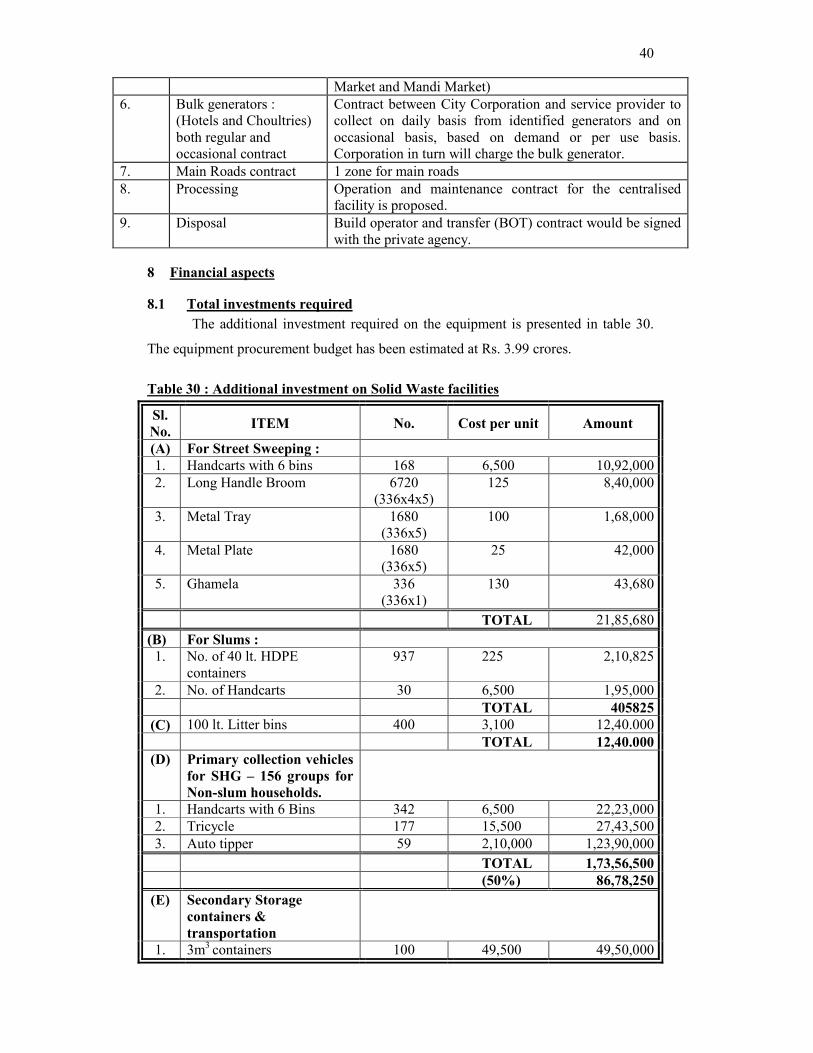
The additional investment required on the equipment is presented in table 30.
The equipment procurement budget has been estimated at Rs. 3.99 crores.
Table 30 : Additional investment on Solid Waste facilities
Sl.
No. ITEM No. Cost per unit Amount
(A) For Street Sweeping :
1. Handcarts with 6 bins 168 6,500 10,92,000
2. Long Handle Broom 6720
(336x4x5)
125 8,40,000
3. Metal Tray 1680
(336x5)
100 1,68,000
4. Metal Plate 1680
(336x5)
25 42,000
5. Ghamela 336
(336x1)
130 43,680
TOTAL 21,85,680
(B) For Slums :
1. No. of 40 lt. HDPE
containers
937 225 2,10,825
2. No. of Handcarts 30 6,500 1,95,000
TOTAL 405825
(C) 100 lt. Litter bins 400 3,100 12,40.000
TOTAL 12,40.000
(D) Primary collection vehicles
for SHG – 156 groups for
Non-slum households.
1. Handcarts with 6 Bins 342 6,500 22,23,000
2. Tricycle 177 15,500 27,43,500
3. Auto tipper 59 2,10,000 1,23,90,000
TOTAL 1,73,56,500
(50%) 86,78,250
(E) Secondary Storage
containers &
transportation
1. 3m3 containers 100 49,500 49,50,000
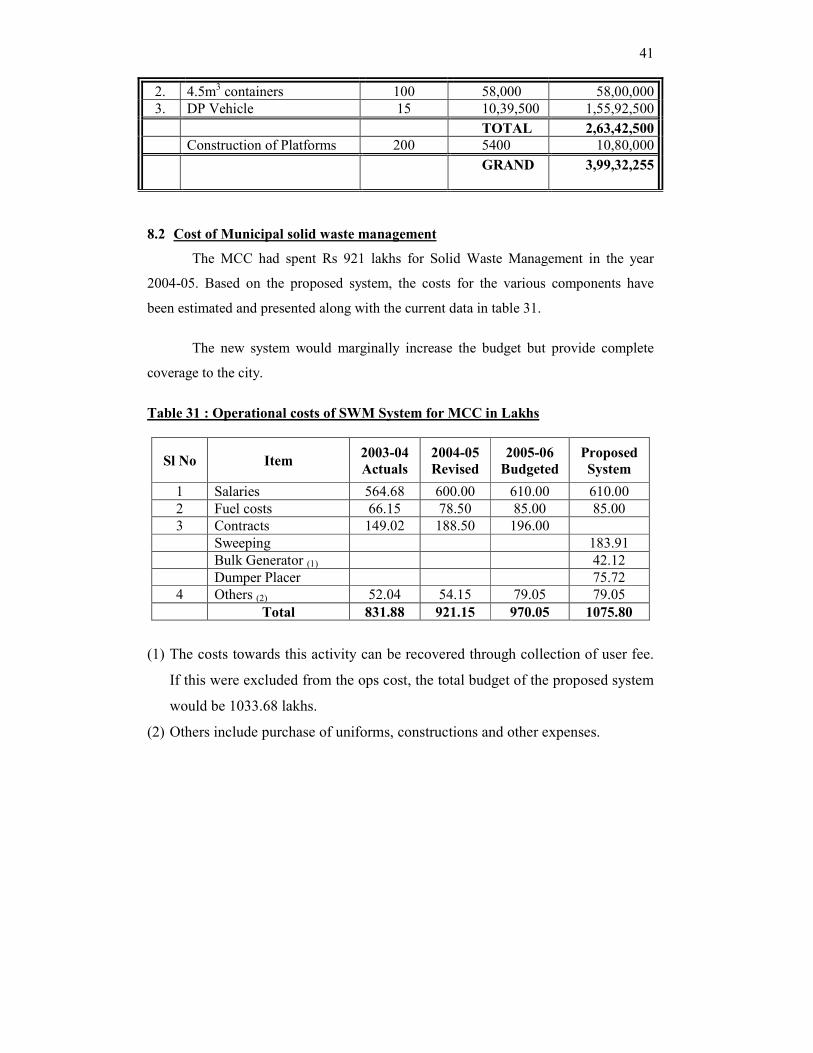
41
2. 4.5m3 containers 100 58,000 58,00,000
3. DP Vehicle 15 10,39,500 1,55,92,500
TOTAL 2,63,42,500
Construction of Platforms 200 5400 10,80,000
GRAND
3,99,32,255
8.2 Cost of Municipal solid waste management
The MCC had spent Rs 921 lakhs for Solid Waste Management in the year
2004-05. Based on the proposed system, the costs for the various components have
been estimated and presented along with the current data in table 31.
The new system would marginally increase the budget but provide complete
coverage to the city.
Table 31 : Operational costs of SWM System for MCC in Lakhs
Sl No Item 2003-04
Actuals
2004-05
Revised
2005-06
Budgeted
Proposed
System
1 Salaries 564.68 600.00 610.00 610.00
2 Fuel costs 66.15 78.50 85.00 85.00
3 Contracts 149.02 188.50 196.00
Sweeping 183.91
Bulk Generator (1) 42.12
Dumper Placer 75.72
4 Others (2) 52.04 54.15 79.05 79.05
Total 831.88 921.15 970.05 1075.80
(1) The costs towards this activity can be recovered through collection of user fee.
If this were excluded from the ops cost, the total budget of the proposed system
would be 1033.68 lakhs.
(2) Others include purchase of uniforms, constructions and other expenses.
42
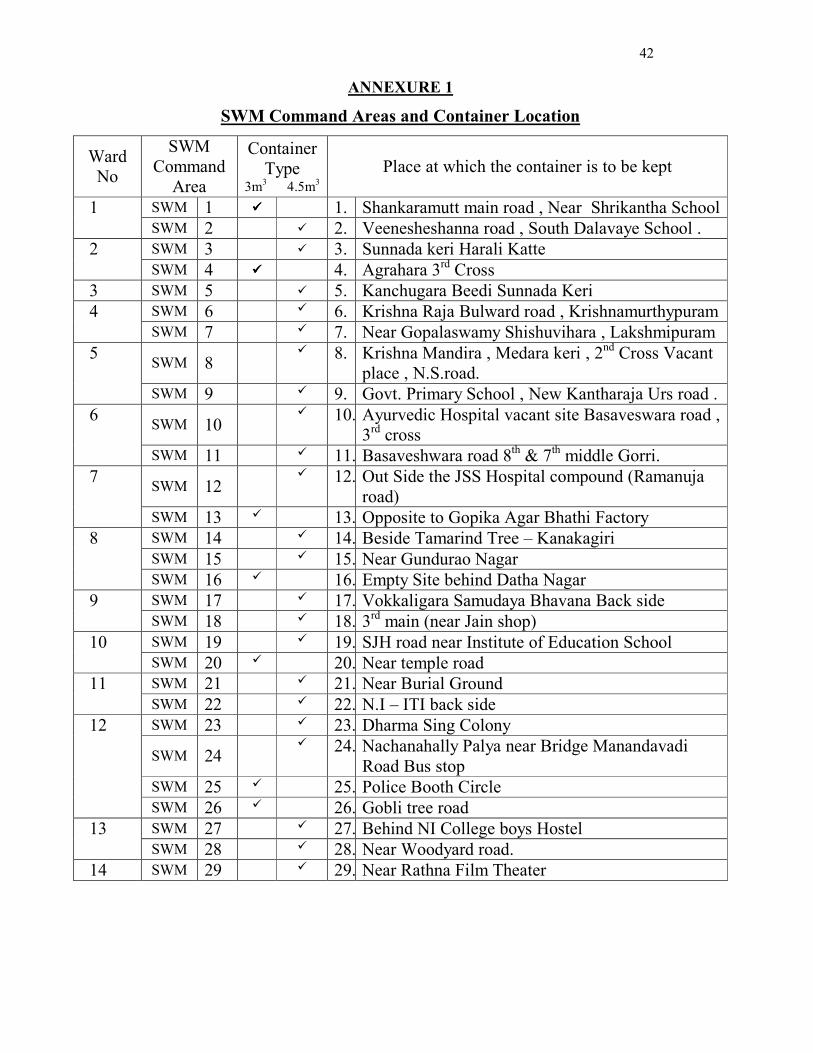
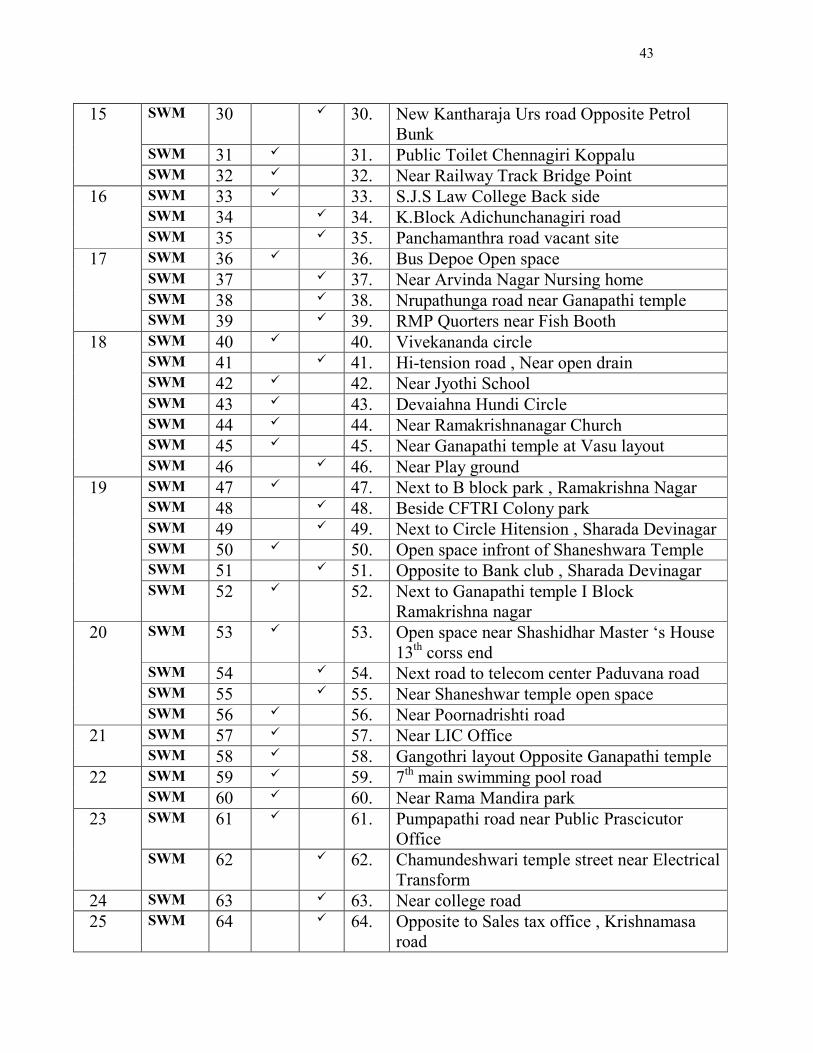
ANNEXURE 1
SWM Command Areas and Container Location
Ward
No
SWM
Command
Area
Container
Type 3m
3 4.5m
3 Place at which the container is to be kept
SWM 1 ���� 1. Shankaramutt main road , Near Shrikantha School 1 SWM 2 � 2. Veenesheshanna road , South Dalavaye School . SWM 3 � 3. Sunnada keri Harali Katte 2 SWM 4 ���� 4. Agrahara 3
rd Cross
3 SWM 5 � 5. Kanchugara Beedi Sunnada Keri SWM 6 � 6. Krishna Raja Bulward road , Krishnamurthypuram 4 SWM 7 � 7. Near Gopalaswamy Shishuvihara , Lakshmipuram
SWM 8 � 8. Krishna Mandira , Medara keri , 2
nd Cross Vacant
place , N.S.road.
5
SWM 9 � 9. Govt. Primary School , New Kantharaja Urs road .
SWM 10 � 10. Ayurvedic Hospital vacant site Basaveswara road ,
3rd cross
6
SWM 11 � 11. Basaveshwara road 8th & 7
th middle Gorri.
SWM 12 � 12. Out Side the JSS Hospital compound (Ramanuja
road)
7
SWM 13 � 13. Opposite to Gopika Agar Bhathi Factory SWM 14 � 14. Beside Tamarind Tree – Kanakagiri SWM 15 � 15. Near Gundurao Nagar
8
SWM 16 � 16. Empty Site behind Datha Nagar SWM 17 � 17. Vokkaligara Samudaya Bhavana Back side 9 SWM 18 � 18. 3
rd main (near Jain shop)
SWM 19 � 19. SJH road near Institute of Education School 10 SWM 20 � 20. Near temple road SWM 21 � 21. Near Burial Ground 11 SWM 22 � 22. N.I – ITI back side SWM 23 � 23. Dharma Sing Colony
SWM 24 � 24. Nachanahally Palya near Bridge Manandavadi
Road Bus stop SWM 25 � 25. Police Booth Circle
12
SWM 26 � 26. Gobli tree road SWM 27 � 27. Behind NI College boys Hostel 13 SWM 28 � 28. Near Woodyard road.
14 SWM 29 � 29. Near Rathna Film Theater
43
SWM 30 � 30. New Kantharaja Urs road Opposite Petrol
Bunk SWM 31 � 31. Public Toilet Chennagiri Koppalu
15
SWM 32 � 32. Near Railway Track Bridge Point SWM 33 � 33. S.J.S Law College Back side SWM 34 � 34. K.Block Adichunchanagiri road
16
SWM 35 � 35. Panchamanthra road vacant site SWM 36 � 36. Bus Depoe Open space SWM 37 � 37. Near Arvinda Nagar Nursing home SWM 38 � 38. Nrupathunga road near Ganapathi temple
17
SWM 39 � 39. RMP Quorters near Fish Booth SWM 40 � 40. Vivekananda circle SWM 41 � 41. Hi-tension road , Near open drain SWM 42 � 42. Near Jyothi School SWM 43 � 43. Devaiahna Hundi Circle SWM 44 � 44. Near Ramakrishnanagar Church SWM 45 � 45. Near Ganapathi temple at Vasu layout
18
SWM 46 � 46. Near Play ground SWM 47 � 47. Next to B block park , Ramakrishna Nagar SWM 48 � 48. Beside CFTRI Colony park SWM 49 � 49. Next to Circle Hitension , Sharada Devinagar SWM 50 � 50. Open space infront of Shaneshwara Temple SWM 51 � 51. Opposite to Bank club , Sharada Devinagar
19
SWM 52 �
52. Next to Ganapathi temple I Block
Ramakrishna nagar SWM 53 �
53. Open space near Shashidhar Master ‘s House
13th corss end
SWM 54 � 54. Next road to telecom center Paduvana road SWM 55 � 55. Near Shaneshwar temple open space
20
SWM 56 � 56. Near Poornadrishti road SWM 57 � 57. Near LIC Office 21 SWM 58 � 58. Gangothri layout Opposite Ganapathi temple SWM 59 � 59. 7
th main swimming pool road 22
SWM 60 � 60. Near Rama Mandira park SWM 61 �
61. Pumpapathi road near Public Prascicutor
Office
23
SWM 62 � 62. Chamundeshwari temple street near Electrical
Transform
24 SWM 63 � 63. Near college road
25 SWM 64 � 64. Opposite to Sales tax office , Krishnamasa
road

44
� 65. Near Hong-kong Bazar � 66. Dhanwanthri Road, in front of Indra Bhavan
26 SWM 65
� 67. N.S. Road near Krishna Mandir � 68. Near KRH road 27 SWM 66
� 69. Near Madhu Nivas SWM 67 � 70. Bharath Lodge Opposite Akbar road 28 SWM 68 � 71. Beside prasad Nrusing Home – Erven 7
th
Cross SWM 69 � 72. Near TB Hospital BN road 29 SWM 70 � 73. K.T. Road near Sri.Chowdeswari temple
30 SWM 71 � 74. Near Mandi Market , Akbar road � 75. 3
rd Main Railway track (near) Pullekeshi road 31 SWM 72
� 76. Yadavagiri Near Railway Quarters SWM 73 �
77. Park corner near paradise hotel Vevekananda
road
32
SWM 74 �
78. Next cross Sri.Venkataramana swamy temple
KRS road SWM 75 �
79. Bhrundavana Park near snake shame house
(Jayadeva nagar near samudhaya Bhavana) SWM 76 � 80. Old Police Station road near Harijan colony
33
SWM 77 � 81. Dr. Ambedkar Jnana Loka Nagar near Govt
Urdu School SWM 78 � 82. Govt Pre University College M.G. Koppal . SWM 79 � 83. Near park Vijayanagar Railway layout SWM 80 � 84. Hebbal 3
rd main road
SWM 81 � 85. Lakshmikanth nagar park SWM 82 � 86. Hebbal 2
nd stage 6
th main park
SWM 83 � 87. 4th main near Ganesh temple double road.
SWM 84 � 88. Near Muda Hebbal layout SWM 85 � 89. Byraveshwara Nagar Hudco park
34
SWM 86 � 90. Near ED Hospital SWM 87 � 91. Near open drainage Chamundeshwari temple
bus stand at Mahadeshwara extension SWM 88 � 92. Near west road of Kempegowada stadium ,
Kumbara Koppalu
35
SWM 89 �
93. Near space near x corporator , Kumbara
Koppalu SWM 90 � 94. Near Apartment Contoor road SWM 91 � 95. South of Kumbar Koppal near park
36
SWM 92 � 96. Behind T.B. Hospital 2nd
stage Gokulam SWM 93 � 97. Opposite to 6
th main Chiken center 37
SWM 94 � 98. Vijayanagar 2nd
snake Shyam road
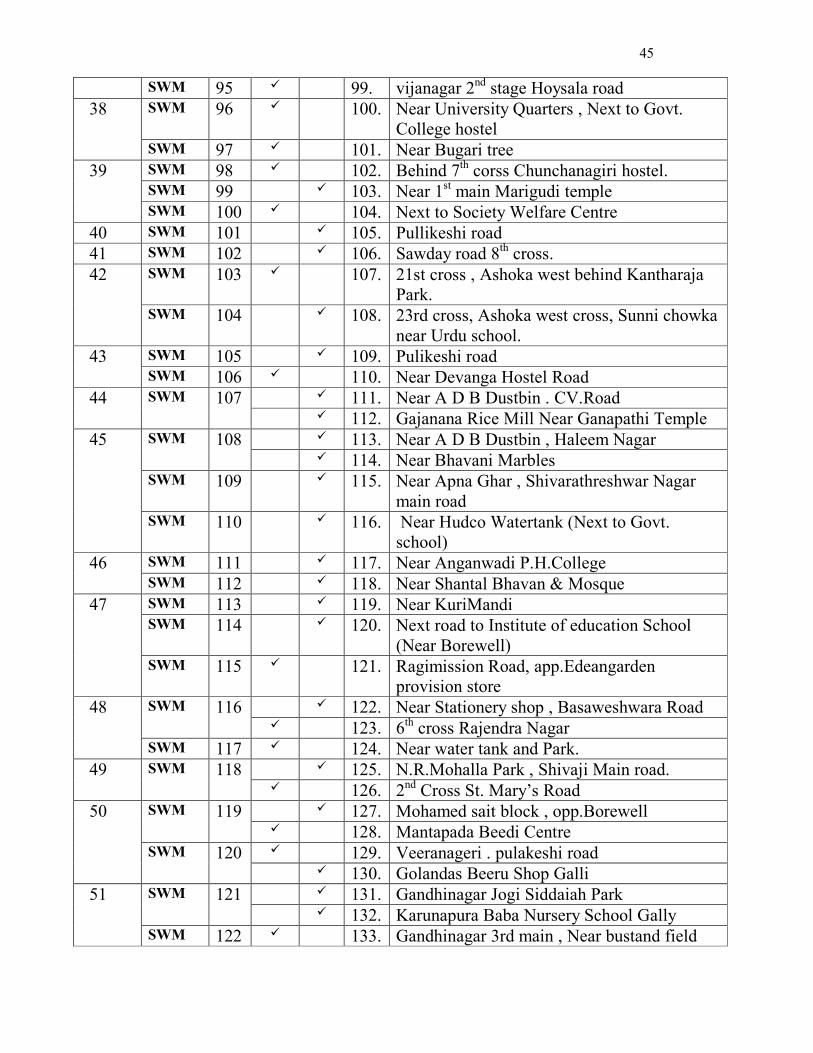
45
SWM 95 � 99. vijanagar 2nd
stage Hoysala road SWM 96 �
100. Near University Quarters , Next to Govt.
College hostel
38
SWM 97 � 101. Near Bugari tree SWM 98 � 102. Behind 7
th corss Chunchanagiri hostel.
SWM 99 � 103. Near 1st main Marigudi temple
39
SWM 100 � 104. Next to Society Welfare Centre
40 SWM 101 � 105. Pullikeshi road
41 SWM 102 � 106. Sawday road 8th cross.
SWM 103 � 107. 21st cross , Ashoka west behind Kantharaja
Park.
42
SWM 104 � 108. 23rd cross, Ashoka west cross, Sunni chowka
near Urdu school. SWM 105 � 109. Pulikeshi road 43 SWM 106 � 110. Near Devanga Hostel Road
� 111. Near A D B Dustbin . CV.Road 44 SWM 107 � 112. Gajanana Rice Mill Near Ganapathi Temple � 113. Near A D B Dustbin , Haleem Nagar SWM 108 � 114. Near Bhavani Marbles
SWM 109 � 115. Near Apna Ghar , Shivarathreshwar Nagar
main road
45
SWM 110 � 116. Near Hudco Watertank (Next to Govt.
school) SWM 111 � 117. Near Anganwadi P.H.College 46 SWM 112 � 118. Near Shantal Bhavan & Mosque SWM 113 � 119. Near KuriMandi SWM 114 � 120. Next road to Institute of education School
(Near Borewell)
47
SWM 115 �
121. Ragimission Road, app.Edeangarden
provision store � 122. Near Stationery shop , Basaweshwara Road SWM 116 � 123. 6
th cross Rajendra Nagar
48
SWM 117 � 124. Near water tank and Park. � 125. N.R.Mohalla Park , Shivaji Main road. 49 SWM 118 � 126. 2
nd Cross St. Mary’s Road
� 127. Mohamed sait block , opp.Borewell SWM 119 � 128. Mantapada Beedi Centre � 129. Veeranageri . pulakeshi road
50
SWM 120 � 130. Golandas Beeru Shop Galli � 131. Gandhinagar Jogi Siddaiah Park SWM 121 � 132. Karunapura Baba Nursery School Gally
51
SWM 122 � 133. Gandhinagar 3rd main , Near bustand field
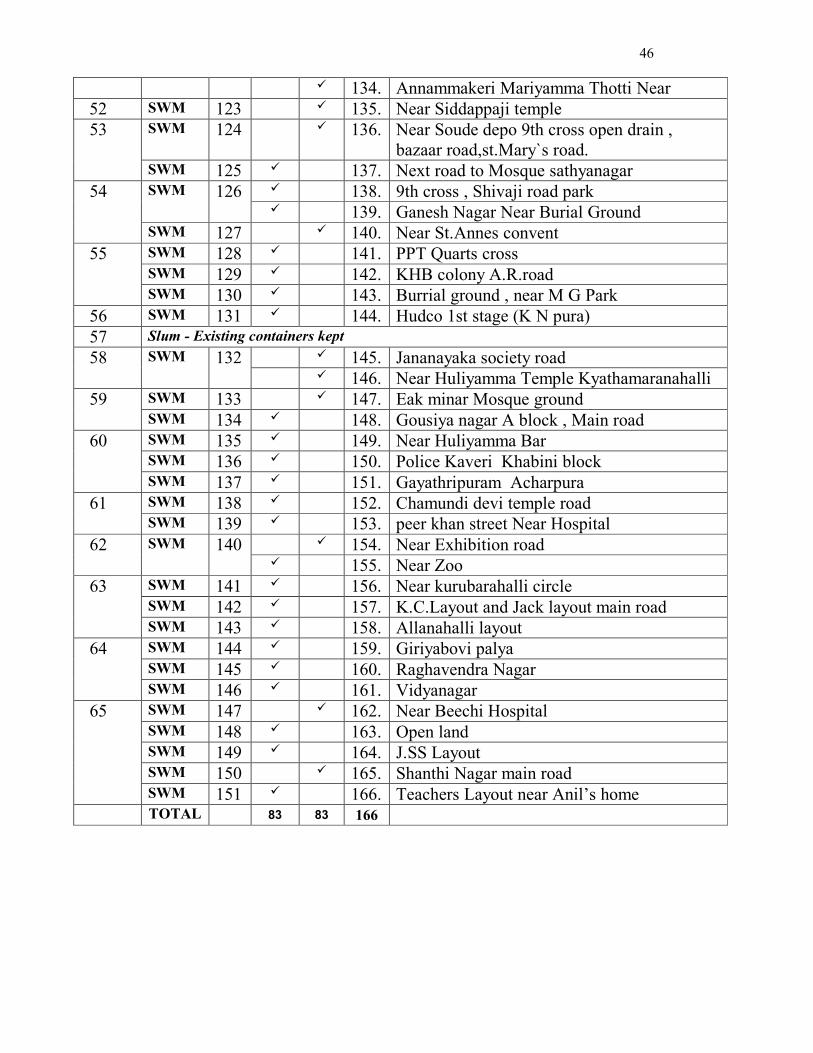
46
� 134. Annammakeri Mariyamma Thotti Near
52 SWM 123 � 135. Near Siddappaji temple SWM 124 � 136. Near Soude depo 9th cross open drain ,
bazaar road,st.Mary`s road.
53
SWM 125 � 137. Next road to Mosque sathyanagar � 138. 9th cross , Shivaji road park SWM 126 � 139. Ganesh Nagar Near Burial Ground
54
SWM 127 � 140. Near St.Annes convent SWM 128 � 141. PPT Quarts cross SWM 129 � 142. KHB colony A.R.road
55
SWM 130 � 143. Burrial ground , near M G Park
56 SWM 131 � 144. Hudco 1st stage (K N pura)
57 Slum - Existing containers kept
� 145. Jananayaka society road 58 SWM 132 � 146. Near Huliyamma Temple Kyathamaranahalli
SWM 133 � 147. Eak minar Mosque ground 59 SWM 134 � 148. Gousiya nagar A block , Main road SWM 135 � 149. Near Huliyamma Bar SWM 136 � 150. Police Kaveri Khabini block
60
SWM 137 � 151. Gayathripuram Acharpura SWM 138 � 152. Chamundi devi temple road 61 SWM 139 � 153. peer khan street Near Hospital
� 154. Near Exhibition road 62 SWM 140 � 155. Near Zoo
SWM 141 � 156. Near kurubarahalli circle SWM 142 � 157. K.C.Layout and Jack layout main road
63
SWM 143 � 158. Allanahalli layout SWM 144 � 159. Giriyabovi palya SWM 145 � 160. Raghavendra Nagar
64
SWM 146 � 161. Vidyanagar SWM 147 � 162. Near Beechi Hospital SWM 148 � 163. Open land SWM 149 � 164. J.SS Layout SWM 150 � 165. Shanthi Nagar main road
65
SWM 151 � 166. Teachers Layout near Anil’s home TOTAL 83 83 166
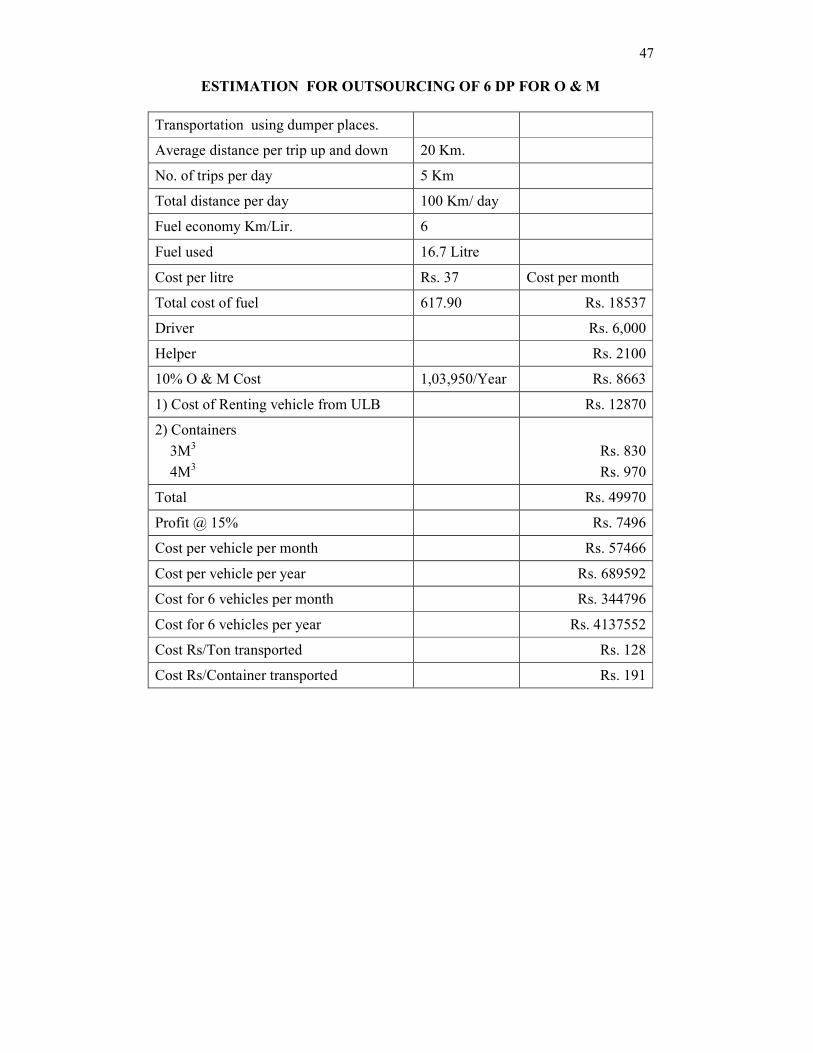
47
ESTIMATION FOR OUTSOURCING OF 6 DP FOR O & M
Transportation using dumper places.
Average distance per trip up and down 20 Km.
No. of trips per day 5 Km
Total distance per day 100 Km/ day
Fuel economy Km/Lir. 6
Fuel used 16.7 Litre
Cost per litre Rs. 37 Cost per month
Total cost of fuel 617.90 Rs. 18537
Driver Rs. 6,000
Helper Rs. 2100
10% O & M Cost 1,03,950/Year Rs. 8663
1) Cost of Renting vehicle from ULB Rs. 12870
2) Containers
3M3
4M3
Rs. 830
Rs. 970
Total Rs. 49970
Profit @ 15% Rs. 7496
Cost per vehicle per month Rs. 57466
Cost per vehicle per year Rs. 689592
Cost for 6 vehicles per month Rs. 344796
Cost for 6 vehicles per year Rs. 4137552
Cost Rs/Ton transported Rs. 128
Cost Rs/Container transported Rs. 191
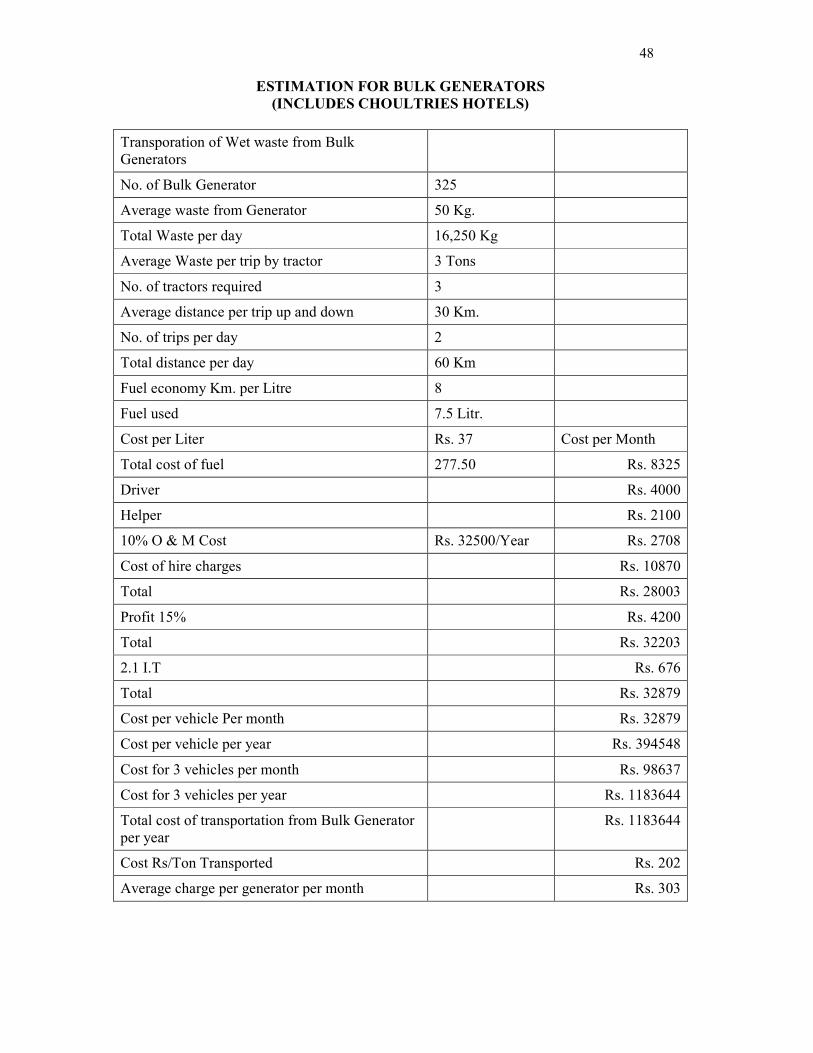
48
ESTIMATION FOR BULK GENERATORS
(INCLUDES CHOULTRIES HOTELS)
Transporation of Wet waste from Bulk
Generators
No. of Bulk Generator 325
Average waste from Generator 50 Kg.
Total Waste per day 16,250 Kg
Average Waste per trip by tractor 3 Tons
No. of tractors required 3
Average distance per trip up and down 30 Km.
No. of trips per day 2
Total distance per day 60 Km
Fuel economy Km. per Litre 8
Fuel used 7.5 Litr.
Cost per Liter Rs. 37 Cost per Month
Total cost of fuel 277.50 Rs. 8325
Driver Rs. 4000
Helper Rs. 2100
10% O & M Cost Rs. 32500/Year Rs. 2708
Cost of hire charges Rs. 10870
Total Rs. 28003
Profit 15% Rs. 4200
Total Rs. 32203
2.1 I.T Rs. 676
Total Rs. 32879
Cost per vehicle Per month Rs. 32879
Cost per vehicle per year Rs. 394548
Cost for 3 vehicles per month Rs. 98637
Cost for 3 vehicles per year Rs. 1183644
Total cost of transportation from Bulk Generator
per year
Rs. 1183644
Cost Rs/Ton Transported Rs. 202
Average charge per generator per month Rs. 303
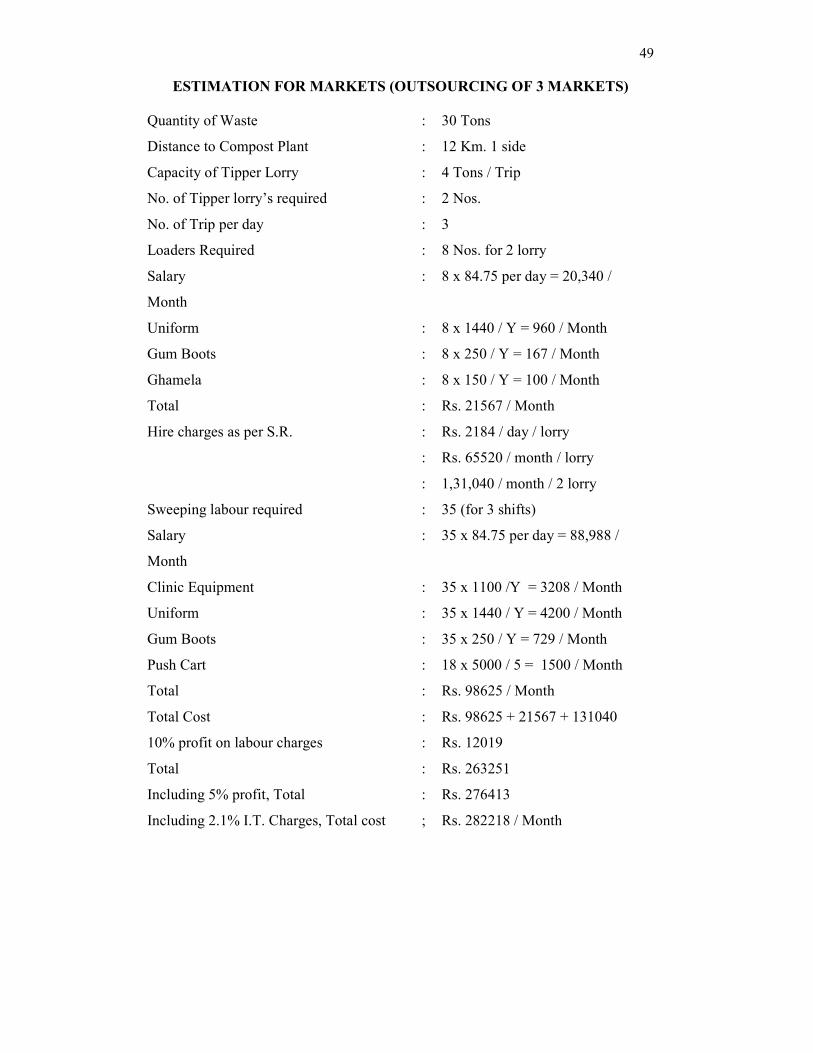
49
ESTIMATION FOR MARKETS (OUTSOURCING OF 3 MARKETS)
Quantity of Waste : 30 Tons
Distance to Compost Plant : 12 Km. 1 side
Capacity of Tipper Lorry : 4 Tons / Trip
No. of Tipper lorry’s required : 2 Nos.
No. of Trip per day : 3
Loaders Required : 8 Nos. for 2 lorry
Salary : 8 x 84.75 per day = 20,340 /
Month
Uniform : 8 x 1440 / Y = 960 / Month
Gum Boots : 8 x 250 / Y = 167 / Month
Ghamela : 8 x 150 / Y = 100 / Month
Total : Rs. 21567 / Month
Hire charges as per S.R. : Rs. 2184 / day / lorry
: Rs. 65520 / month / lorry
: 1,31,040 / month / 2 lorry
Sweeping labour required : 35 (for 3 shifts)
Salary : 35 x 84.75 per day = 88,988 /
Month
Clinic Equipment : 35 x 1100 /Y = 3208 / Month
Uniform : 35 x 1440 / Y = 4200 / Month
Gum Boots : 35 x 250 / Y = 729 / Month
Push Cart : 18 x 5000 / 5 = 1500 / Month
Total : Rs. 98625 / Month
Total Cost : Rs. 98625 + 21567 + 131040
10% profit on labour charges : Rs. 12019
Total : Rs. 263251
Including 5% profit, Total : Rs. 276413
Including 2.1% I.T. Charges, Total cost ; Rs. 282218 / Month
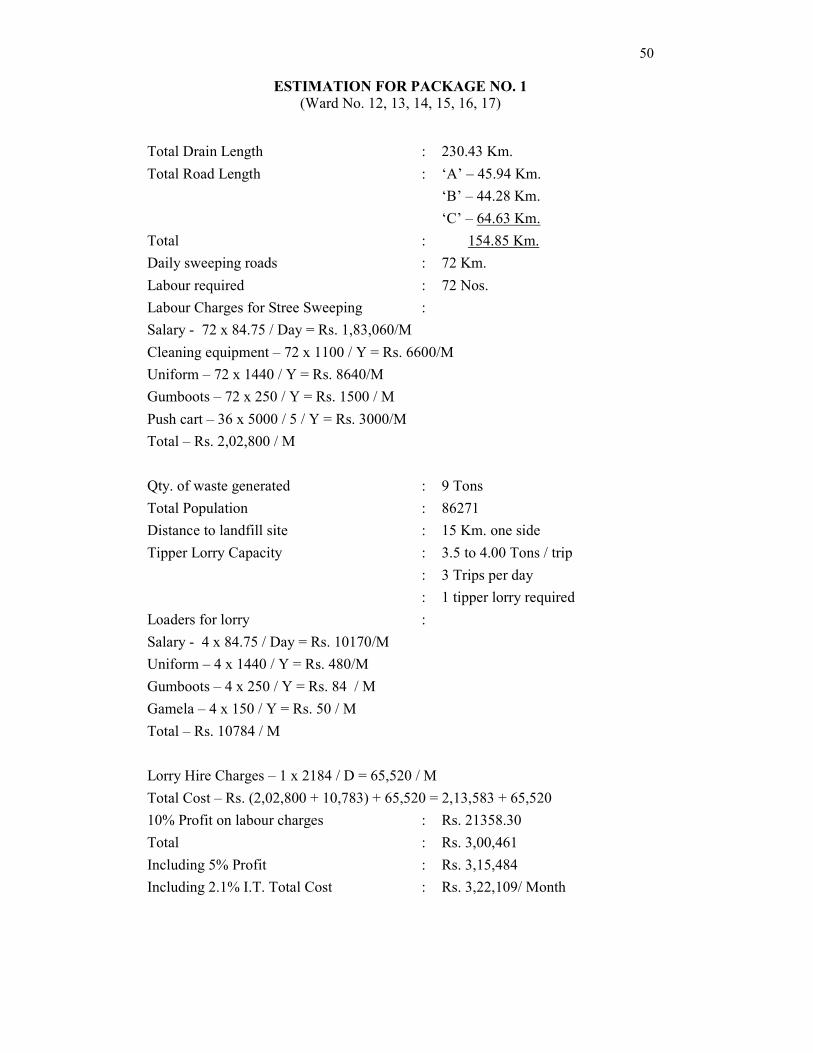
50
ESTIMATION FOR PACKAGE NO. 1
(Ward No. 12, 13, 14, 15, 16, 17)
Total Drain Length : 230.43 Km.
Total Road Length : ‘A’ – 45.94 Km.
‘B’ – 44.28 Km.
‘C’ – 64.63 Km.
Total : 154.85 Km.
Daily sweeping roads : 72 Km.
Labour required : 72 Nos.
Labour Charges for Stree Sweeping :
Salary - 72 x 84.75 / Day = Rs. 1,83,060/M
Cleaning equipment – 72 x 1100 / Y = Rs. 6600/M
Uniform – 72 x 1440 / Y = Rs. 8640/M
Gumboots – 72 x 250 / Y = Rs. 1500 / M
Push cart – 36 x 5000 / 5 / Y = Rs. 3000/M
Total – Rs. 2,02,800 / M
Qty. of waste generated : 9 Tons
Total Population : 86271
Distance to landfill site : 15 Km. one side
Tipper Lorry Capacity : 3.5 to 4.00 Tons / trip
: 3 Trips per day
: 1 tipper lorry required
Loaders for lorry :
Salary - 4 x 84.75 / Day = Rs. 10170/M
Uniform – 4 x 1440 / Y = Rs. 480/M
Gumboots – 4 x 250 / Y = Rs. 84 / M
Gamela – 4 x 150 / Y = Rs. 50 / M
Total – Rs. 10784 / M
Lorry Hire Charges – 1 x 2184 / D = 65,520 / M
Total Cost – Rs. (2,02,800 + 10,783) + 65,520 = 2,13,583 + 65,520
10% Profit on labour charges : Rs. 21358.30
Total : Rs. 3,00,461
Including 5% Profit : Rs. 3,15,484
Including 2.1% I.T. Total Cost : Rs. 3,22,109/ Month
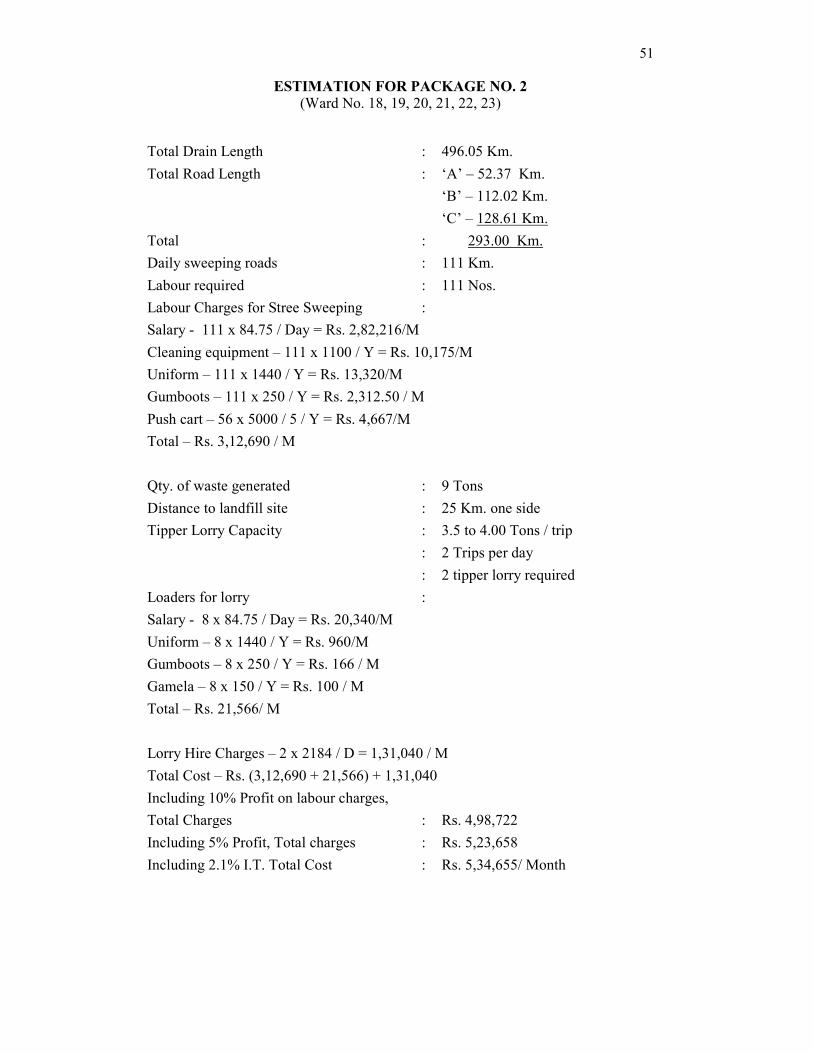
51
ESTIMATION FOR PACKAGE NO. 2
(Ward No. 18, 19, 20, 21, 22, 23)
Total Drain Length : 496.05 Km.
Total Road Length : ‘A’ – 52.37 Km.
‘B’ – 112.02 Km.
‘C’ – 128.61 Km.
Total : 293.00 Km.
Daily sweeping roads : 111 Km.
Labour required : 111 Nos.
Labour Charges for Stree Sweeping :
Salary - 111 x 84.75 / Day = Rs. 2,82,216/M
Cleaning equipment – 111 x 1100 / Y = Rs. 10,175/M
Uniform – 111 x 1440 / Y = Rs. 13,320/M
Gumboots – 111 x 250 / Y = Rs. 2,312.50 / M
Push cart – 56 x 5000 / 5 / Y = Rs. 4,667/M
Total – Rs. 3,12,690 / M
Qty. of waste generated : 9 Tons
Distance to landfill site : 25 Km. one side
Tipper Lorry Capacity : 3.5 to 4.00 Tons / trip
: 2 Trips per day
: 2 tipper lorry required
Loaders for lorry :
Salary - 8 x 84.75 / Day = Rs. 20,340/M
Uniform – 8 x 1440 / Y = Rs. 960/M
Gumboots – 8 x 250 / Y = Rs. 166 / M
Gamela – 8 x 150 / Y = Rs. 100 / M
Total – Rs. 21,566/ M
Lorry Hire Charges – 2 x 2184 / D = 1,31,040 / M
Total Cost – Rs. (3,12,690 + 21,566) + 1,31,040
Including 10% Profit on labour charges,
Total Charges : Rs. 4,98,722
Including 5% Profit, Total charges : Rs. 5,23,658
Including 2.1% I.T. Total Cost : Rs. 5,34,655/ Month
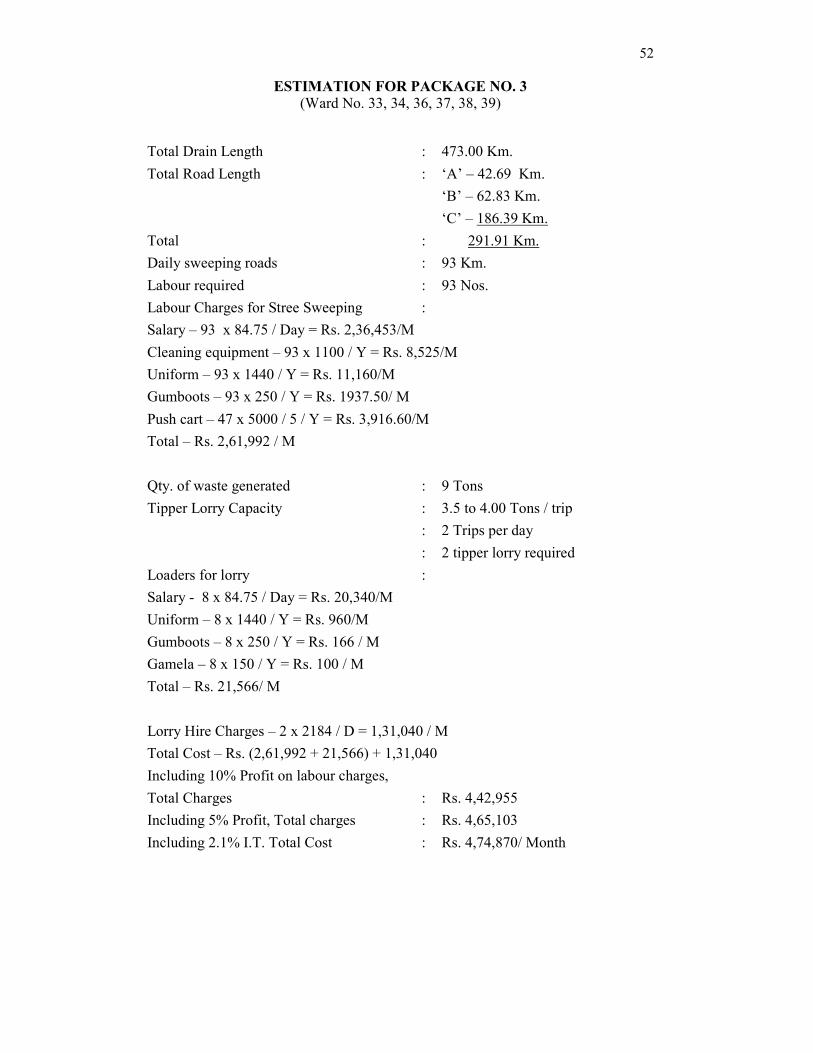
52
ESTIMATION FOR PACKAGE NO. 3
(Ward No. 33, 34, 36, 37, 38, 39)
Total Drain Length : 473.00 Km.
Total Road Length : ‘A’ – 42.69 Km.
‘B’ – 62.83 Km.
‘C’ – 186.39 Km.
Total : 291.91 Km.
Daily sweeping roads : 93 Km.
Labour required : 93 Nos.
Labour Charges for Stree Sweeping :
Salary – 93 x 84.75 / Day = Rs. 2,36,453/M
Cleaning equipment – 93 x 1100 / Y = Rs. 8,525/M
Uniform – 93 x 1440 / Y = Rs. 11,160/M
Gumboots – 93 x 250 / Y = Rs. 1937.50/ M
Push cart – 47 x 5000 / 5 / Y = Rs. 3,916.60/M
Total – Rs. 2,61,992 / M
Qty. of waste generated : 9 Tons
Tipper Lorry Capacity : 3.5 to 4.00 Tons / trip
: 2 Trips per day
: 2 tipper lorry required
Loaders for lorry :
Salary - 8 x 84.75 / Day = Rs. 20,340/M
Uniform – 8 x 1440 / Y = Rs. 960/M
Gumboots – 8 x 250 / Y = Rs. 166 / M
Gamela – 8 x 150 / Y = Rs. 100 / M
Total – Rs. 21,566/ M
Lorry Hire Charges – 2 x 2184 / D = 1,31,040 / M
Total Cost – Rs. (2,61,992 + 21,566) + 1,31,040
Including 10% Profit on labour charges,
Total Charges : Rs. 4,42,955
Including 5% Profit, Total charges : Rs. 4,65,103
Including 2.1% I.T. Total Cost : Rs. 4,74,870/ Month

53
ESTIMATION FOR PACKAGE NO. 4
(Ward No. 46, 47, 48, 55, 56, 57)
Total Drain Length : 294.15 Km.
Total Road Length : ‘A’ – 56,90 Km.
‘B’ – 59,20 Km.
‘C’ – 32,42 Km.
Total : 148.52 Km.
Daily sweeping roads : 81 Km.
Labour required : 81 Nos.
Population : 1,03,541
Labour Charges for Stree Sweeping :
Salary – 81 x 84.75 / Day = Rs. 2,05,943/M
Cleaning equipment – 81 x 1100 / Y = Rs. 7,425/M
Uniform – 81 x 1440 / Y = Rs. 9,720/M
Gumboots – 81 x 250 / Y = Rs. 1,688/ M
Push cart – 41 x 5000 / 5 / Y = Rs. 3,417/M
Total – Rs. 2,28,193/ M
Qty. of waste generated : 9 Tons
Tipper Lorry Capacity : 3.5 to 4.00 Tons / trip
: 2 Trips per day
: 2 tipper lorry required
Loaders for lorry :
Salary - 8 x 84.75 / Day = Rs. 20,340/M
Uniform – 8 x 1440 / Y = Rs. 960/M
Gumboots – 8 x 250 / Y = Rs. 166 / M
Gamela – 8 x 150 / Y = Rs. 100 / M
Total – Rs. 21,566/ M
Lorry Hire Charges – 2 x 2184 / D = 1,31,040 / M
Total Cost – Rs. (2,28,193 + 21,566) + 1,31,040
Including 10% Profit on labour charges,
Total Charges : Rs. 4,05,776
Including 5% Profit, Total charges : Rs. 4,26,065
Including 2.1% I.T. Total Cost : Rs. 4,35,012/ Month

54
ESTIMATION FOR PACKAGE NO. 5
(Ward No. 58, 59, 60, 63, 64, 65)
Total Drain Length : 613.98 Km.
Total Road Length : ‘A’ – 25.91 Km.
‘B’ – 138.16 Km.
‘C’ – 165.44 Km.
Total : 329.51 Km.
Daily sweeping roads : 102 Km.
Labour required : 102 Nos.
Population : 97,414
Labour Charges for Stree Sweeping :
Salary – 102 x 84.75 / Day = Rs. 2,59,335/M
Cleaning equipment – 102 x 1100 / Y = Rs. 9,350/M
Uniform – 102 x 1440 / Y = Rs. 12,240/M
Gumboots – 102 x 250 / Y = Rs. 2,125/ M
Push cart – 51 x 5000 / 5 / Y = Rs. 51,000/M
Total – Rs. 3,34,050/ M
Qty. of waste generated : 9 Tons
Tipper Lorry Capacity : 3.5 to 4.00 Tons / trip
: 2 Trips per day
: 2 tipper lorry required
Loaders for lorry :
Salary - 8 x 84.75 / Day = Rs. 20,340/M
Uniform – 8 x 1440 / Y = Rs. 960/M
Gumboots – 8 x 250 / Y = Rs. 166 / M
Gamela – 8 x 150 / Y = Rs. 100 / M
Total – Rs. 21,566/ M
Lorry Hire Charges – 2 x 2184 / D = 1,31,040 / M
Total Cost – Rs. (3,34,050 + 21,566) + 1,31,040
Including 10% Profit on labour charges,
Total Charges : Rs. 5,22,219
Including 5% Profit, Total charges : Rs. 5,48,330
Including 2.1% I.T. Total Cost : Rs. 5,59,845/ Month
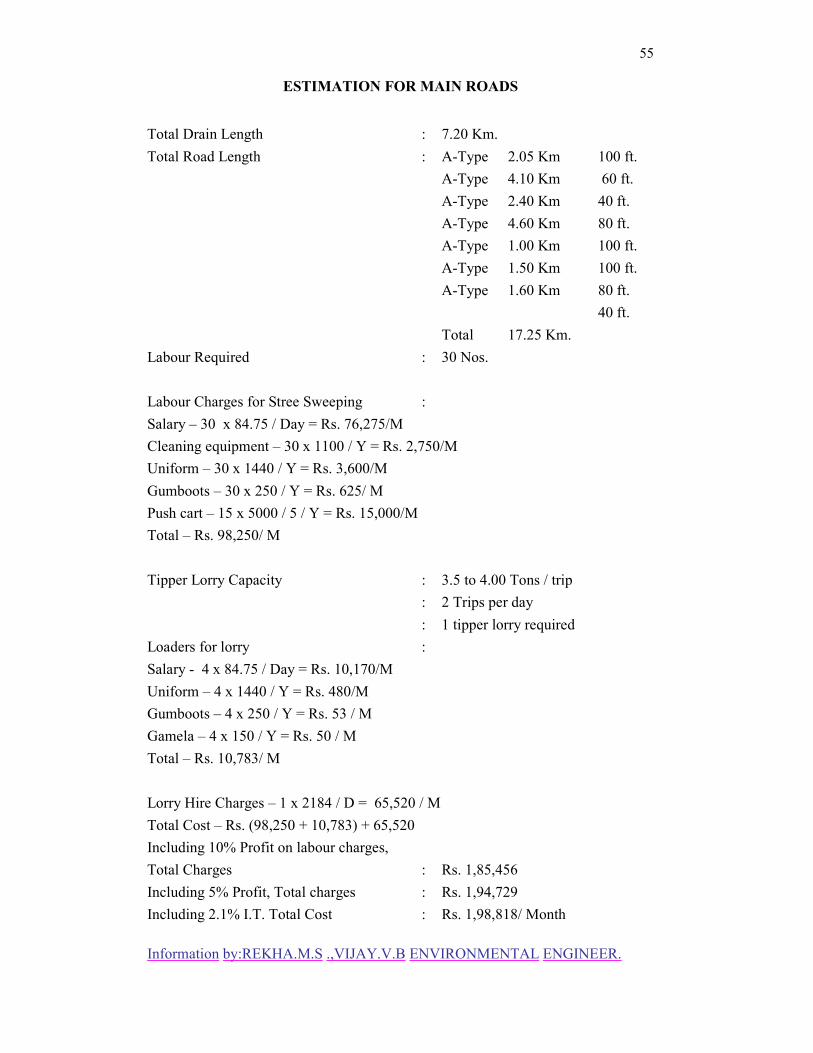
55
ESTIMATION FOR MAIN ROADS
Total Drain Length : 7.20 Km.
Total Road Length : A-Type 2.05 Km 100 ft.
A-Type 4.10 Km 60 ft.
A-Type 2.40 Km 40 ft.
A-Type 4.60 Km 80 ft.
A-Type 1.00 Km 100 ft.
A-Type 1.50 Km 100 ft.
A-Type 1.60 Km 80 ft.
40 ft.
Total 17.25 Km.
Labour Required : 30 Nos.
Labour Charges for Stree Sweeping :
Salary – 30 x 84.75 / Day = Rs. 76,275/M
Cleaning equipment – 30 x 1100 / Y = Rs. 2,750/M
Uniform – 30 x 1440 / Y = Rs. 3,600/M
Gumboots – 30 x 250 / Y = Rs. 625/ M
Push cart – 15 x 5000 / 5 / Y = Rs. 15,000/M
Total – Rs. 98,250/ M
Tipper Lorry Capacity : 3.5 to 4.00 Tons / trip
: 2 Trips per day
: 1 tipper lorry required
Loaders for lorry :
Salary - 4 x 84.75 / Day = Rs. 10,170/M
Uniform – 4 x 1440 / Y = Rs. 480/M
Gumboots – 4 x 250 / Y = Rs. 53 / M
Gamela – 4 x 150 / Y = Rs. 50 / M
Total – Rs. 10,783/ M
Lorry Hire Charges – 1 x 2184 / D = 65,520 / M
Total Cost – Rs. (98,250 + 10,783) + 65,520
Including 10% Profit on labour charges,
Total Charges : Rs. 1,85,456
Including 5% Profit, Total charges : Rs. 1,94,729
Including 2.1% I.T. Total Cost : Rs. 1,98,818/ Month
Information by:REKHA.M.S .,VIJAY.V.B ENVIRONMENTAL ENGINEER.