Acta Crystallographica Section D In crystallo optical...
12
research papers Acta Cryst. (2015). D71, 15–26 doi:10.1107/S139900471401517X 15 Acta Crystallographica Section D Biological Crystallography ISSN 1399-0047 In crystallo optical spectroscopy (icOS) as a complementary tool on the macromolecular crystallography beamlines of the ESRF David von Stetten, a Thierry Giraud, a Philippe Carpentier, a Franc Sever, a Maxime Terrien, b,c,d Fabien Dobias, a Douglas H. Juers, e David Flot, a Christoph Mueller-Dieckmann, a Gordon A. Leonard, a Daniele de Sanctis a and Antoine Royant a,b,c,d * a European Synchrotron Radiation Facility, F-38043 Grenoble, France, b Universite ´ Grenoble Alpes, IBS, F-38044 Grenoble, France, c CNRS, IBS, F-38044 Grenoble, France, d CEA, IBS, F-38044 Grenoble, France, and e Department of Physics, Whitman College, Walla Walla, WA 99362, USA Correspondence e-mail: [email protected] The analysis of structural data obtained by X-ray crystallo- graphy benefits from information obtained from complemen- tary techniques, especially as applied to the crystals themselves. As a consequence, optical spectroscopies in structural biology have become instrumental in assessing the relevance and context of many crystallographic results. Since the year 2000, it has been possible to record such data adjacent to, or directly on, the Structural Biology Group beamlines of the ESRF. A core laboratory featuring various spectrometers, named the Cryobench, is now in its third version and houses portable devices that can be directly mounted on beamlines. This paper reports the current status of the Cryobench, which is now located on the MAD beamline ID29 and is thus called the ID29S-Cryobench (where S stands for ‘spectroscopy’). It also reviews the diverse experiments that can be performed at the Cryobench, highlighting the various scientific questions that can be addressed. Received 17 February 2014 Accepted 27 June 2014 1. Introduction Performing optical spectroscopy on crystals, or in crystallo optical spectroscopy (icOS), has progressively matured as a technique complementary to protein crystallography. Origin- ally developed for Laue diffraction experiments on coloured proteins such as myoglobin or photoactive yellow protein, instruments and facilities have been progressively developed over the last 20 years. The first microspectrophotometers (microspecs) capable of recording UV–visible light absorption (UV–vis absorption) spectra on protein crystals that can be orientated in three dimensions were designed in the early 1990s (Chen et al., 1994; Hadfield & Hajdu, 1993), eventually leading to a commercial version (4DX-ray Systems AB, Uppsala, Sweden). The Cryobench laboratory of the ESRF (http:// www.esrf.eu/UsersAndScience/Experiments/MX/Cryobench/) was initially opened in 1999 as a facility based around a microspec inspired by the 4DX microspec, but with a third objective added to allow, when required, the recording of fluorescence spectroscopy data (Bourgeois et al. , 2002). The facility was later enhanced with a mechanically more stable setup capable of recording fluorescence lifetimes (Royant et al., 2007) and Raman spectra (Carpentier et al., 2007). An online microspec for UV–vis absorption was developed in parallel on the structural biology beamlines of the ESRF (McGeehan et al., 2009; Nanao & Ravelli, 2006). Since the inception of the Cryobench, similar apparatus has been built and installed elsewhere, notably at the Swiss Light Source in Villigen (SLSpectroLAB; http://www.psi.ch/sls/pxii/spectrolab; Owen et al., 2009; Pompidor et al., 2013) and at beamline X26-C at NSLS (Orville et al. , 2011; Stoner-Ma et al., 2011). Microspecs have also been installed at the SRS in Daresbury
Transcript of Acta Crystallographica Section D In crystallo optical...

research papers
Acta Cryst. (2015). D71, 15–26 doi:10.1107/S139900471401517X 15
Acta Crystallographica Section D
BiologicalCrystallography
ISSN 1399-0047
In crystallo optical spectroscopy (icOS) as acomplementary tool on the macromolecularcrystallography beamlines of the ESRF
David von Stetten,a Thierry
Giraud,a Philippe Carpentier,a
Franc Sever,a Maxime
Terrien,b,c,d Fabien Dobias,a
Douglas H. Juers,e David Flot,a
Christoph Mueller-Dieckmann,a
Gordon A. Leonard,a
Daniele de Sanctisa and
Antoine Royanta,b,c,d*
aEuropean Synchrotron Radiation Facility,
F-38043 Grenoble, France, bUniversite
Grenoble Alpes, IBS, F-38044 Grenoble,
France, cCNRS, IBS, F-38044 Grenoble, France,dCEA, IBS, F-38044 Grenoble, France, andeDepartment of Physics, Whitman College,
Walla Walla, WA 99362, USA
Correspondence e-mail: [email protected]
The analysis of structural data obtained by X-ray crystallo-
graphy benefits from information obtained from complemen-
tary techniques, especially as applied to the crystals
themselves. As a consequence, optical spectroscopies in
structural biology have become instrumental in assessing the
relevance and context of many crystallographic results. Since
the year 2000, it has been possible to record such data adjacent
to, or directly on, the Structural Biology Group beamlines of
the ESRF. A core laboratory featuring various spectrometers,
named the Cryobench, is now in its third version and houses
portable devices that can be directly mounted on beamlines.
This paper reports the current status of the Cryobench, which
is now located on the MAD beamline ID29 and is thus called
the ID29S-Cryobench (where S stands for ‘spectroscopy’). It
also reviews the diverse experiments that can be performed at
the Cryobench, highlighting the various scientific questions
that can be addressed.
Received 17 February 2014
Accepted 27 June 2014
1. Introduction
Performing optical spectroscopy on crystals, or in crystallo
optical spectroscopy (icOS), has progressively matured as a
technique complementary to protein crystallography. Origin-
ally developed for Laue diffraction experiments on coloured
proteins such as myoglobin or photoactive yellow protein,
instruments and facilities have been progressively developed
over the last 20 years. The first microspectrophotometers
(microspecs) capable of recording UV–visible light absorption
(UV–vis absorption) spectra on protein crystals that can be
orientated in three dimensions were designed in the early
1990s (Chen et al., 1994; Hadfield & Hajdu, 1993), eventually
leading to a commercial version (4DX-ray Systems AB, Uppsala,
Sweden). The Cryobench laboratory of the ESRF (http://
www.esrf.eu/UsersAndScience/Experiments/MX/Cryobench/)
was initially opened in 1999 as a facility based around a
microspec inspired by the 4DX microspec, but with a third
objective added to allow, when required, the recording of
fluorescence spectroscopy data (Bourgeois et al., 2002). The
facility was later enhanced with a mechanically more stable
setup capable of recording fluorescence lifetimes (Royant
et al., 2007) and Raman spectra (Carpentier et al., 2007). An
online microspec for UV–vis absorption was developed in
parallel on the structural biology beamlines of the ESRF
(McGeehan et al., 2009; Nanao & Ravelli, 2006). Since the
inception of the Cryobench, similar apparatus has been built
and installed elsewhere, notably at the Swiss Light Source in
Villigen (SLSpectroLAB; http://www.psi.ch/sls/pxii/spectrolab;
Owen et al., 2009; Pompidor et al., 2013) and at beamline
X26-C at NSLS (Orville et al., 2011; Stoner-Ma et al., 2011).
Microspecs have also been installed at the SRS in Daresbury

(Ellis et al., 2008), the BioCARS facility of the APS in
Argonne (http://biocars.uchicago.edu/), Spring-8 (Sakai et al.,
2002; Shimizu et al., 2013), the SSRL and Diamond Light
Source (http://diamond.ac.uk/mx-home/Equipment-on-Demand/
Spectroscopy.html). Additionally, a fluorescence microspec
has been designed to be easily transported between home
laboratories and various synchrotrons (Klink et al., 2006).
Microspecs can be used either during a diffraction experiment,
directly mounted on the experimental setup of a synchrotron
beamline (online mode), or before and/or after a diffraction
experiment in a different location at the synchrotron (offline
mode). The online mode is necessary when the effect of X-rays
on samples is investigated. The offline mode is preferred for
the time-consuming steps of characterization, experimental
protocol optimization and sample preparation.
While the most common application of icOS is the assess-
ment of whether a crystallized protein is in a similar functional
state as in solution (Bourgeois & Royant, 2005; Pearson et al.,
2004), the technique has also become of great help in moni-
toring the level of X-ray-induced damage (or ‘radiation
damage’) occurring during crystallographic experiments on
bright synchrotron beamlines (Garman, 2010). Moreover,
because proteins are often active in the crystalline state, icOS
can be used in experiments aimed at elucidating the structures
of unstable reaction-intermediate
species, particularly when such
species have a distinct spectro-
scopic signature. Crystallographic
methods to determine the struc-
ture of unstable protein species,
either as a function of time
(reaction-intermediate state) or
of X-ray dose (X-ray-sensitive
state), have been named kinetic
crystallography (KX; Bourgeois
& Royant, 2005).
Here, we describe the third
version of the ESRF Cryobench
installation, summarize improve-
ments compared with the
previous version, review the
various types of proteins studied
and the types of experiments
carried out using icOS at the
ESRF and comment on experi-
mental difficulties.
2. Instrumental setups
2.1. Offline facility (Cryobench)
The Cryobench is currently
located next to the MAD beam-
line ID29 (de Sanctis et al., 2012;
Fig. 1a). The microspectrophoto-
meter setup comprises a motor-
ized single-axis goniometer (one
rotation, one translation along
the same horizontal axis) holding
a Huber goniometer head
(Rimsting, Germany) which
allows two additional degrees of
translation, on which a sample,
either a crystal or nanolitres of
solution on a SPINE standard
sample holder (Cipriani et al.,
2006), is mounted. Three objec-
tives, mounted in a 90� geometry
relative to each other (and a
research papers
16 von Stetten et al. � In crystallo optical spectroscopy Acta Cryst. (2015). D71, 15–26
Figure 1Cryobench location and setup. (a) The Cryobench laboratory is composed of a control room (CC4) and anexperimental hutch (CC5) on beamline ID29, to the experimental hutch (EH1) of which a Raman opticalfibre is connected (in red). Control rooms CC2 and CC3 have been omitted for clarity. (b) Photograph and(c) virtual representation of the experimental setup in CC5 featuring the three objectives for UV-absorption and fluorescence spectroscopy and the Raman objective (all in blue). (d) Objectives used forUV–vis absorption (transmission mode, 0� geometry). (e) Objectives used for fluorescence spectroscopy(reflection mode, 90� geometry). ( f ) Objective used for Raman spectroscopy (backscattering mode, 180�
geometry).
vertical camera) are 5 cm (8 cm) away from the position of the
sample (Figs. 1b and 1c). The temperature and humidity of the
sample position can be controlled with a liquid-nitrogen open-
flow cooler (Cryostream Series 700, Oxford Cryosystems,
Oxford, England) for temperatures
ranging from 100 to 270 K or with
the EMBL/ESRF dehumidifier HC1
(Sanchez-Weatherby et al., 2009) for
room-temperature measurements.
Several technical choices have been
made in order to maximize the
compatibility between the environ-
ments of the Cryobench and the ESRF
macromolecular crystallography beam-
lines. In particular, the analogue camera
previously used for sample visualization
has been replaced by the same digital
Prosilica camera as used on the beam-
lines. New control modules for video
acquisition, goniometer operation, laser
triggering and cryosystem temperature
control have been written with the
BLISS FrameWork, an ESRF software-
development platform, and run on
Linux OS. In this way, experiment-
control modules can be taken from, or
ported to, the beamline-control soft-
ware MxCuBE (Gabadinho et al., 2010).
All Cryobench experiment-control
modules have been grouped together in
a main control software called
SpeCuBE (Fig. 2).
The UV–vis absorption mode of
operation consists of using the two
objectives at 180� from each other
(Fig. 1d). White light from a balanced
deuterium–halogen lamp (Mikropack
DH2000-BAL, Ocean Optics) is
connected to one objective via an
optical fibre, while a fixed-grating spec-
trophotometer with a CCD detector
(model HR2000+ or QE65Pro, Ocean
Optics) is connected to the other
objective. Alignment of the spectro-
photometer consists of a series of
micrometric translations parallel or
perpendicular to the light path that
align the focal volumes of the objectives
and maximize light transmission
through a 30–100 mm wide pinhole
(Melles-Griot) placed at the sample
position. The diameter of the focal
volume is one quarter of the diameter of
the optical fibre (available from 50 to
1000 mm) connected to the objective.
Absorption and fluorescence emis-
sion spectra are measured with the
commercial SpectraSuite software
(Ocean Optics) running on Linux. In
research papers
Acta Cryst. (2015). D71, 15–26 von Stetten et al. � In crystallo optical spectroscopy 17
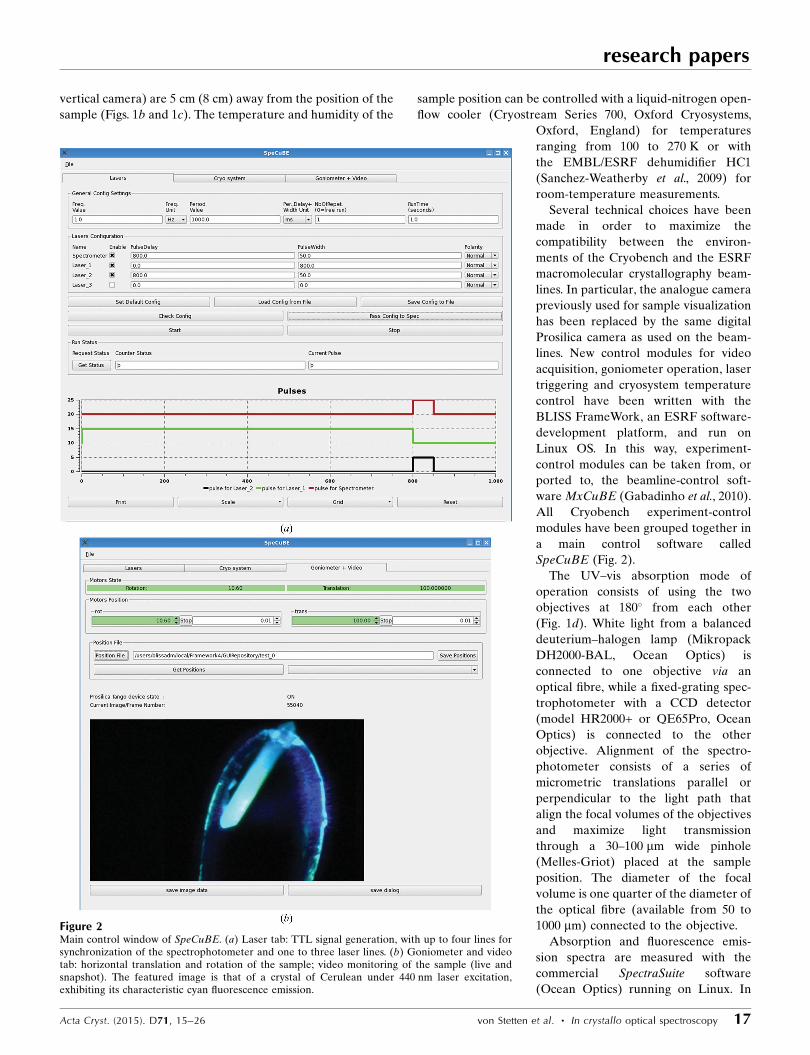
Figure 2Main control window of SpeCuBE. (a) Laser tab: TTL signal generation, with up to four lines forsynchronization of the spectrophotometer and one to three laser lines. (b) Goniometer and videotab: horizontal translation and rotation of the sample; video monitoring of the sample (live andsnapshot). The featured image is that of a crystal of Cerulean under 440 nm laser excitation,exhibiting its characteristic cyan fluorescence emission.
order to measure an absorption spectrum A(�), three different
spectra need to be recorded: the dark reference Idark(�) (the
spectrum in the absence of light), the light reference Iref(�)
(the lamp spectrum in the absence of a sample) and the sample
spectrum Isample(�) (the light transmitted through the sample):
Að�Þ ¼ � logIsampleð�Þ � Idarkð�Þ
Irefð�Þ � Idarkð�Þ: ð1Þ
Fluorescence emission spectra (Bourgeois et al., 2002) and
fluorescence lifetime histograms (Royant et al., 2007) are
measured using laser lines as excitation light with two objec-
tives at 90� from each other in order to minimize excitation
laser scattering to the CCD detector (Fig. 1e). Because fluoro-
phores are usually photoactivatable or photobleachable, laser
irradiation needs to be kept to a minimum by synchronizing
laser triggering pulses (typically of milliseconds to hundreds of
milliseconds in duration) with the recording of spectra via
TTL pulses generated by an ESRF-developed board (OPIOM
type). Laser lines can be chosen from more than ten typical
wavelengths ranging from 266 nm (deep UV) to 671 nm (far
red), with a maximum power of 10–100 mW at the sample
position.
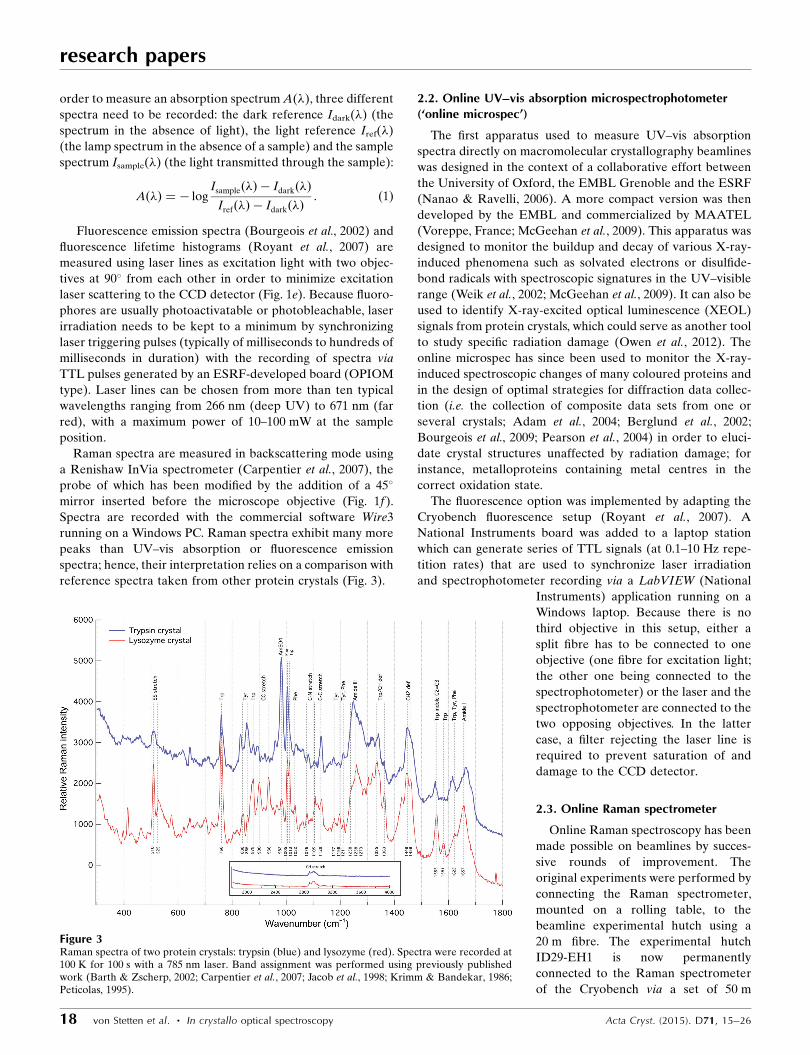
Raman spectra are measured in backscattering mode using
a Renishaw InVia spectrometer (Carpentier et al., 2007), the
probe of which has been modified by the addition of a 45�
mirror inserted before the microscope objective (Fig. 1f).
Spectra are recorded with the commercial software Wire3
running on a Windows PC. Raman spectra exhibit many more
peaks than UV–vis absorption or fluorescence emission
spectra; hence, their interpretation relies on a comparison with
reference spectra taken from other protein crystals (Fig. 3).
2.2. Online UV–vis absorption microspectrophotometer(‘online microspec’)
The first apparatus used to measure UV–vis absorption
spectra directly on macromolecular crystallography beamlines
was designed in the context of a collaborative effort between
the University of Oxford, the EMBL Grenoble and the ESRF
(Nanao & Ravelli, 2006). A more compact version was then
developed by the EMBL and commercialized by MAATEL
(Voreppe, France; McGeehan et al., 2009). This apparatus was
designed to monitor the buildup and decay of various X-ray-
induced phenomena such as solvated electrons or disulfide-
bond radicals with spectroscopic signatures in the UV–visible
range (Weik et al., 2002; McGeehan et al., 2009). It can also be
used to identify X-ray-excited optical luminescence (XEOL)
signals from protein crystals, which could serve as another tool
to study specific radiation damage (Owen et al., 2012). The
online microspec has since been used to monitor the X-ray-
induced spectroscopic changes of many coloured proteins and
in the design of optimal strategies for diffraction data collec-
tion (i.e. the collection of composite data sets from one or
several crystals; Adam et al., 2004; Berglund et al., 2002;
Bourgeois et al., 2009; Pearson et al., 2004) in order to eluci-
date crystal structures unaffected by radiation damage; for
instance, metalloproteins containing metal centres in the
correct oxidation state.
The fluorescence option was implemented by adapting the
Cryobench fluorescence setup (Royant et al., 2007). A
National Instruments board was added to a laptop station
which can generate series of TTL signals (at 0.1–10 Hz repe-
tition rates) that are used to synchronize laser irradiation
and spectrophotometer recording via a LabVIEW (National
Instruments) application running on a
Windows laptop. Because there is no
third objective in this setup, either a
split fibre has to be connected to one
objective (one fibre for excitation light;
the other one being connected to the
spectrophotometer) or the laser and the
spectrophotometer are connected to the
two opposing objectives. In the latter
case, a filter rejecting the laser line is
required to prevent saturation of and
damage to the CCD detector.
2.3. Online Raman spectrometer
Online Raman spectroscopy has been
made possible on beamlines by succes-
sive rounds of improvement. The
original experiments were performed by
connecting the Raman spectrometer,
mounted on a rolling table, to the
beamline experimental hutch using a
20 m fibre. The experimental hutch
ID29-EH1 is now permanently
connected to the Raman spectrometer
of the Cryobench via a set of 50 m
research papers
18 von Stetten et al. � In crystallo optical spectroscopy Acta Cryst. (2015). D71, 15–26
Figure 3Raman spectra of two protein crystals: trypsin (blue) and lysozyme (red). Spectra were recorded at100 K for 100 s with a 785 nm laser. Band assignment was performed using previously publishedwork (Barth & Zscherp, 2002; Carpentier et al., 2007; Jacob et al., 1998; Krimm & Bandekar, 1986;Peticolas, 1995).

optical fibres (red trace in Fig. 1a), and a Raman head support
has been designed to fit the MD2 diffractometer (Maatel,
Voreppe, France). The support itself will be described else-
where. In the near future, the Cryobench will be similarly
connected to an experimental hutch of the new MASSIF suite
of endstations situated on the straight section ID30 next to
ID29 (Theveneau et al., 2013). The use of Raman spectroscopy
in conjunction with X-ray crystallography has been named
‘Raman-assisted X-ray crystallography’ (RaX) and its use has
already been extensively reviewed (Bourgeois et al., 2009;
McGeehan et al., 2011).
3. Experimental considerations
Solution spectroscopy usually imposes limits on the concen-
tration of the sample: for UV–vis absorption, one aims at
limiting the optical density (OD) to approximately 1.0 (above
this limit particle–particle interactions affect light absorption
and the OD is no longer a linear function of concentration).
For fluorescence spectroscopy, it is desirable to limit the
concentration of the sample to a maximum OD of 0.05 to
minimize absorption of the fluorescence signal by surrounding
molecules. icOS differs from solution spectroscopy in the
sense that the concentration cannot be precisely adjusted,
apart from choosing crystals of various thicknesses or focusing
light at the crystal edges (where they are thinner). Moreover,
protein crystals are highly concentrated in chromophores and
other chemical groups with a spectroscopic signature. As a
consequence, the guidelines for carrying
out spectroscopy on crystals are mark-
edly different from those for similar
experiments on solutions. Several
considerations must therefore be taken
into account and are described below.
3.1. Alignment issues
The most important issue to consider
when aligning a sample is the fact that
the optical path has to cross various
materials with distinct refraction
indices: air (n = 1.00), mother liquor
[1.33 (pure water) � n � 1.5 for salts
and PEGs] and crystal (n ’ 1.34 at high
protein concentrations; Cole et al.,
1995). The alignment of a two-objective
microspec consists of matching, in three
dimensions, the two focal volumes in the
absence of a sample (i.e. when the whole
optical path is in air). If the sample is
large or if the mother liquor has not
been removed and forms a bulk around
the sample, the focal volumes will be
significantly displaced. Fig. 4 shows a
simple situation in which the beam path
is perpendicular to the surface of a
plate-shaped crystal. The two objectives
have been aligned in air with their focal volumes matched at
the position of the black dot. Insertion of the protein crystal
with a higher refractive index at the sample position shifts
both focal volumes in opposite directions. As a consequence of
the mismatch between the focal volumes, the transmitted light
is not optimally focused onto the entrance of the optical fibre
leading to the spectrophotometer, thus decreasing the signal-
research papers
Acta Cryst. (2015). D71, 15–26 von Stetten et al. � In crystallo optical spectroscopy 19
Figure 4Principle of light defocusing by a crystal. The focal volume of bothobjectives in air (n = 1.00) is represented by the black dot. When a crystalis present, each focal volume is translated to either the purple dot (whitelight objective) or the cyan dot (spectrophotometer objective) owing torefraction of light within the crystal (n > 1.00).
Figure 5Optical artefacts in a coloured crystal. (a) Fluorescence excitation at the surface of a crystal. (b)Fluorescence excitation at the opposing face, with the emission light path traversing the wholethickness of the crystal. (c) Absorption (black) and emission spectra [red, geometry described in (a);blue, geometry described in (b); orange and green, intermediate situations] of a crystal of the cyanfluorescent protein Cerulean (Lelimousin et al., 2009). (d) Absorption spectrum (black) of a crystalof Cerulean exhibiting a negative optical density around the maximum fluorescence emission (red).

to-noise ratio of the measurement. In other words, the refer-
ence light signal Iref (equation 1) recorded in the absence of a
sample differs from the hypothetical Iref that would be
recorded in the presence of a noncoloured sample of the same
shape. However, the resulting absorption spectrum only
differs from the hypothetical spectrum by an offset of the
baseline, which can be easily corrected for. This situation is
aggravated by increases in the size of the sample and the tilt of
its position versus the light axis. The effect is even more severe
for nonplanar crystalline samples, for example a crystal in a
frozen drop of liquid, which results in a lens effect. In this case
not only are the focal volumes displaced, but the direction of
the transmitted light is also altered. A partial remedy for this
issue consists of translating the
second objective with the sample
in place while monitoring the
increase in the collected light
until a maximum is achieved.
3.2. Self-absorption effect
The effect of strongly
absorbing crystals on the shape of
fluorescence emission spectra has
been reported for light-
harvesting complex II (LHCII;
Barros et al., 2009). LHCII is
a photosynthetic protein that
contains many different coloured
cofactors (carotenoids and chlor-
ophylls) and is one of the proteins
with the most coloured cofactors
per amino-acid residue. Conse-
quently, even very thin LHCII
crystals (10 mm) have an OD
above 2.5 and act as bandpass
filters in the blue and red regions
of the spectra.
This so-called ‘self-absorption’
(or ‘inner filtering’) is modulated
by the geometry of sample illu-
mination. If the excitation and
emission objectives are focused
on the top surface of a crystal of
the fluorescent protein Cerulean
(Lelimousin et al., 2009; Fig. 5a),
one is able to measure the
genuine emission spectrum of the
protein (the red trace in Fig. 5c).
However, if one focuses on the
bottom surface, such that both
the excitation and the emission
light travels through the crystal
(Fig. 5b), the significant OD of
the crystal (see the absorption
spectrum depicted in black in
Fig. 5c) will absorb most of the
low-wavelength emitted photons, resulting in an apparent red
shift of the left emission peak (orange, green and blue traces in
Fig. 5c).
3.3. Negative absorption owing to fluorescence
During the recording of UV–vis absorption spectra from
fluorescent samples, the incident white light also produces
some detectable fluorescence. Depending on the geometry of
the two focal volumes (see above), a significant amount of this
unwanted fluorescence will be recorded by the collecting
objective, which leads to a dip in the resulting absorption
spectrum (black trace in Fig. 5d) in the region of maximum
research papers
20 von Stetten et al. � In crystallo optical spectroscopy Acta Cryst. (2015). D71, 15–26
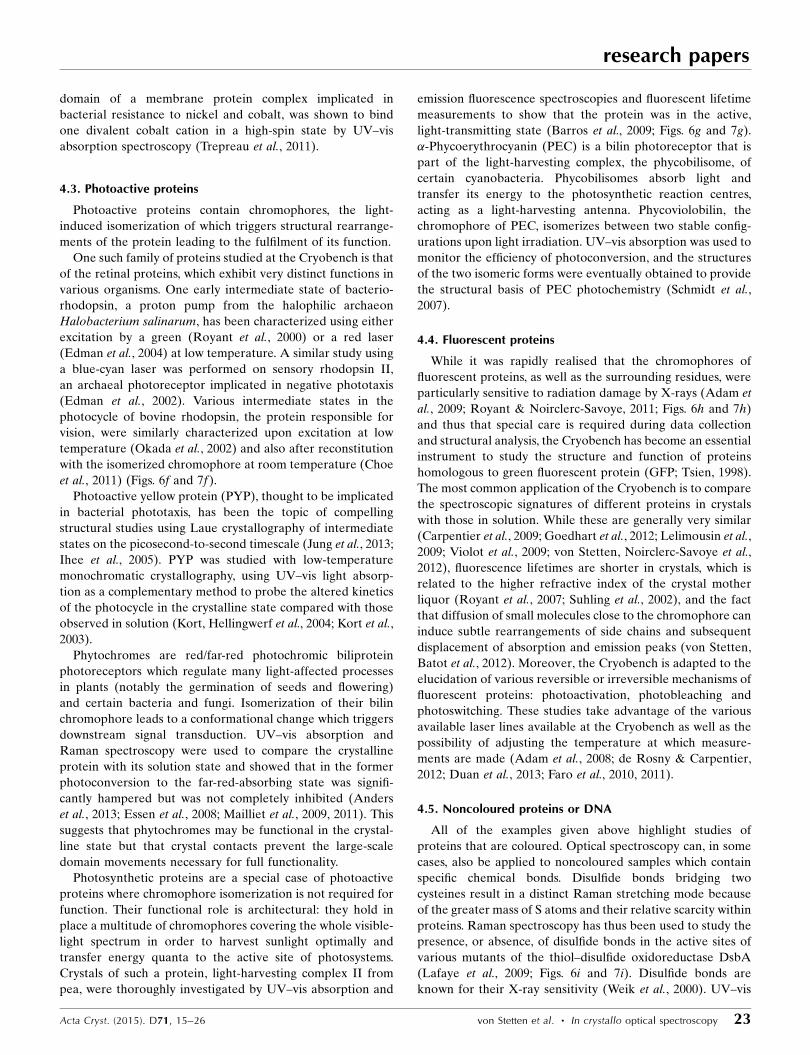
Figure 6Structures of representative proteins studied at the Cryobench shown with their spectroscopically activegroups coloured. (a) Monooxygenase: NADPH and FAD (PDB entry 2ylr; Orru et al., 2011). (b)Oxymyoglobin: haem (PDB entry 2vlx; Hersleth et al., 2008). (c) Superoxide reductase: nonhaem iron(PDB entry 1vzi; Adam et al., 2004). (d) Iron-only hydrogenase: Fe–S clusters (PDB entry 1hfe; Nicolet etal., 2001). (e) Laccase: copper (PDB entry 2x88; Bento et al., 2010). ( f ) Metarhodopsin II: retinal (PDBentry 3pxo; Choe et al., 2011). (g) Light-harvesting complex II: chlorophylls and carotenoids (PDB entry2bhw; Barros et al., 2009; Standfuss et al., 2005). (h) Enhanced green fluorescent protein:p-hydroxybenzylidene-imidazolinone (PDB entry 2y0g; Royant & Noirclerc-Savoye, 2011). (i) Thiol–disulfide oxidoreductase: disulfide bond (PDB entry 3hz8; Lafaye et al., 2009).

fluorescence in the emission spectrum (the red trace in Fig.
5d), formally constituting a negative absorption signal.
4. Biological systems studied at the Cryobench
Systems studied using Cryobench setups include proteins
with coloured cofactors (FAD and NADPH), metalloproteins
of various kinds (containing copper, nonhaem iron, haem iron
or iron–sulfur clusters), photoactive proteins with isomeriz-
able chromophores (retinal and bilins), fluorescent proteins
homologous to GFP and proteins containing disulfide bridges
(Figs. 6 and 7). A selection of representative publications is
listed in Table 1, allowing rapid identification of the type of
application, the operation mode (offline/online), the spectro-
scopic technique used, the nature of the sample (crystal/
solution) and the temperature range.
4.1. Enzymes with coloured cofactors
Many enzymes rely on cofactors that absorb in the near-
UV/blue part of the light spectrum. Usually, the light-
absorption properties of the cofactor are not instrumental to
the catalytic mechanism. Measurement of the fluorescence
emission spectrum from crystals of NADH-containing malate
dehydrogenase was one of the first experiments carried out at
the Cryobench, identifying the redox state of NADH in the
crystal (Bourgeois et al., 2002). Crystals of a Baeyer–Villiger
monooxygenase, containing NADPH and FAD as the electron
donor and oxygen acceptor, respectively, were studied both at
the Cryobench and with the online microspec in order to
monitor the reversible oxidation of the flavin by air (at room
temperature) (Figs. 6a and 7a) or reduction by either dithio-
nite or X-rays (Orru et al., 2011). Finally, a vitamin B6-
dependent phosphoserine aminotransferase has been shown
using online UV–vis absorption spectroscopy to be sensitive to
research papers
Acta Cryst. (2015). D71, 15–26 von Stetten et al. � In crystallo optical spectroscopy 21
Figure 7Spectroscopic data corresponding to the proteins represented in Fig. 6. (a, d) Comparison of reduced and oxidized proteins. (b, e) Photoreductionmonitored by UV-vis absorption. (c) Buildup of a peroxo intermediate demonstrated by Raman spectroscopy using isotopically labelled hydrogenperoxide. The isotopic effect is indicated by purple arrows. (f) Comparison of the dark and meta-II intermediate states of bovine rhodopsin. (g)Comparison of absorption spectra in solution and crystalline states. (h) Photobleaching of a fluorescent protein monitored by fluorescence spectroscopy.(i) The presence of a disulfide bond probed by Raman spectroscopy. The position of the disulfide-bridge stretching mode is indicated by an arrow.

X-rays at the location of its lysine–pyridoxal-50-phosphate
(lysine–PLP) Schiff-base linkage (Dubnovitsky et al., 2005).
The only two known enzymes for which light-induced
activation of cofactors is necessary for the catalysed reaction
have both been studied at the Cryobench. DNA photolyase
uses two cofactors, the flavin FAD and a light-harvesting
chromophore which is either 8-hydroxy-5-deazaflavin or 5,10-
methenyltetrahydrofolate, to repair DNA lesions caused by
UV radiation in bacteria. Online UV–vis absorption spectro-
scopy was used to monitor light-induced or X-ray-induced
reduction of the cofactors (Kiontke et al., 2011; Kort, Komori
et al., 2004; Moldt et al., 2009). Light-dependent protochloro-
phyllide oxidoreductase (POR) catalyses the penultimate step
of chlorophyll biosynthesis. Temperature-dependent fluores-
cence spectroscopy was used on solution samples to study the
influence of solvent dynamics on the formation of the first two
reaction-intermediate states (Durin et al., 2009).
4.2. Metalloproteins
Haem proteins, with an Fe atom bound to a porphyrin ring,
are gas or electron transporters or enzymes. Early offline
studies attempted to establish redox states before and after
X-ray data collection (Dias et al., 2004; Hersleth et al., 2008;
Marcaida et al., 2006; Williams et al., 2006) and showed their
high X-ray susceptibility, the explanation for which must
reside in their redox activity (Figs. 6b and 7b). Later studies
used the online microspec to monitor the rate of haem
photoreduction, a phenomenon which was eventually used to
mimic the physiological redox reaction (Gumiero et al., 2011;
Hersleth & Andersson, 2011; Macedo et al., 2009). Besides
these more complex experiments, offline studies were used to
characterize the functional state of haems in protein crystals
(Rajagopal et al., 2011; Wahlgren et al., 2012).
Some nonhaem iron enzymes have their catalytic iron
coordinated by at least four amino-acid residues of the
protein. The superoxide reductase (SOR) from the micro-
aerophilic bacterium Desulfoarculus baarsii falls into this
category. SOR acts as a defence against oxidative stress and
presents the advantage over superoxide dismutase of not
releasing dioxygen upon superoxide reduction. A composite
data-collection strategy (Berglund et al., 2002; Pearson et al.,
2004) taking advantage of online UV–vis microspectrophoto-
metry allowed comparison of its reduced and oxidized states
(Adam et al., 2004). Subsequently, in order to prove the
presence in the crystals of a peroxo adduct on the iron with an
end-on geometry, Raman spectroscopy was used directly on
crystals soaked with either H216O2 or H2
18O2 to show the
presence of an Fe—O covalent bond (Katona et al., 2007;
Figs. 6c and 7c). Other nonhaem iron proteins contain
geometric arrangements of Fe and S atoms: iron–sulfur cluster
proteins. UV–vis absorption spectroscopy has been used to
investigate the redox state of Fe–S clusters (Aragao et al.,
2003; Sainz et al., 2006) or of catalytic Fe atoms (Nicolet et al.,
2001; Figs. 6d and 7d).
The X-ray-induced photoreduction of the mononuclear
copper electron-transfer protein azurin and of multi-copper
oxidases (MCOs) has been investigated using online micro-
spectrophotometry, either directly in crystals (Ferraroni et al.,
2012; Macedo et al., 2009; Figs. 6e and 7e) or indirectly by
monitoring the buildup of solvated electrons in protein solu-
tions (De la Mora et al., 2012). Another MCO had its spec-
troscopic signature in crystals compared with that in solution
(Bento et al., 2010). Finally, crystals of CnrX, the metal-sensing
research papers
22 von Stetten et al. � In crystallo optical spectroscopy Acta Cryst. (2015). D71, 15–26
Table 1Highlighted papers featuring experimental results obtained using icOS at the Cryobench and/or on macromolecular crystallography beamlines.
Abbreviations: FC, functional characterization; RD, radiation damage; KX, kinetic crystallography; Off, offline operation; On, online operation; Abs, UV–visabsorption; Fluo, fluorescence; Lifet, fluorescence lifetime measurement; Act, actinic light; Sol, solution; Cryst, crystal; Cryo, cryogenic temperature; RT, roomtemperature.
Application Mode Technique Sample Temperature
Reference FC RD KX Off On Abs Fluo Lifet Raman Act Sol Cryst Cryo RT
Royant et al. (2000) * * * * * * *
Nicolet et al. (2001) * * * * * *
Okada et al. (2002) * * * * * * *
Adam et al. (2004) * * * * * * * *
Kort, Hellingwerf et al. (2004) * * * * * * *
Colletier et al. (2007) * * * * * * *
Katona et al. (2007) * * * * * * *
Essen et al. (2008) * * * * * * *
Adam et al. (2009) * * * * * * * * *
Barros et al. (2009) * * * * * * * * *
Carpentier et al. (2010) * * * * * *
Cavazza et al. (2010) * * * * * * *
Choe et al. (2011) * * * * * *
Faro et al. (2011) * * * * * * * * * *
Gumiero et al. (2011) * * * * * * *
Kiontke et al. (2011) * * * * * * * *
Orru et al. (2011) * * * * * * * *
Goedhart et al. (2012) * * * * * * * * *
de Rosny & Carpentier (2012) * * * * * * * * *
von Stetten, Batot et al. (2012) * * * * * * * *
Anders et al. (2013) * * * * * *
domain of a membrane protein complex implicated in
bacterial resistance to nickel and cobalt, was shown to bind
one divalent cobalt cation in a high-spin state by UV–vis
absorption spectroscopy (Trepreau et al., 2011).
4.3. Photoactive proteins
Photoactive proteins contain chromophores, the light-
induced isomerization of which triggers structural rearrange-
ments of the protein leading to the fulfilment of its function.
One such family of proteins studied at the Cryobench is that
of the retinal proteins, which exhibit very distinct functions in
various organisms. One early intermediate state of bacterio-
rhodopsin, a proton pump from the halophilic archaeon
Halobacterium salinarum, has been characterized using either
excitation by a green (Royant et al., 2000) or a red laser
(Edman et al., 2004) at low temperature. A similar study using
a blue-cyan laser was performed on sensory rhodopsin II,
an archaeal photoreceptor implicated in negative phototaxis
(Edman et al., 2002). Various intermediate states in the
photocycle of bovine rhodopsin, the protein responsible for
vision, were similarly characterized upon excitation at low
temperature (Okada et al., 2002) and also after reconstitution
with the isomerized chromophore at room temperature (Choe
et al., 2011) (Figs. 6f and 7f).
Photoactive yellow protein (PYP), thought to be implicated
in bacterial phototaxis, has been the topic of compelling
structural studies using Laue crystallography of intermediate
states on the picosecond-to-second timescale (Jung et al., 2013;
Ihee et al., 2005). PYP was studied with low-temperature
monochromatic crystallography, using UV–vis light absorp-
tion as a complementary method to probe the altered kinetics
of the photocycle in the crystalline state compared with those
observed in solution (Kort, Hellingwerf et al., 2004; Kort et al.,
2003).
Phytochromes are red/far-red photochromic biliprotein
photoreceptors which regulate many light-affected processes
in plants (notably the germination of seeds and flowering)
and certain bacteria and fungi. Isomerization of their bilin
chromophore leads to a conformational change which triggers
downstream signal transduction. UV–vis absorption and
Raman spectroscopy were used to compare the crystalline
protein with its solution state and showed that in the former
photoconversion to the far-red-absorbing state was signifi-
cantly hampered but was not completely inhibited (Anders
et al., 2013; Essen et al., 2008; Mailliet et al., 2009, 2011). This
suggests that phytochromes may be functional in the crystal-
line state but that crystal contacts prevent the large-scale
domain movements necessary for full functionality.
Photosynthetic proteins are a special case of photoactive
proteins where chromophore isomerization is not required for
function. Their functional role is architectural: they hold in
place a multitude of chromophores covering the whole visible-
light spectrum in order to harvest sunlight optimally and
transfer energy quanta to the active site of photosystems.
Crystals of such a protein, light-harvesting complex II from
pea, were thoroughly investigated by UV–vis absorption and
emission fluorescence spectroscopies and fluorescent lifetime
measurements to show that the protein was in the active,
light-transmitting state (Barros et al., 2009; Figs. 6g and 7g).
�-Phycoerythrocyanin (PEC) is a bilin photoreceptor that is
part of the light-harvesting complex, the phycobilisome, of
certain cyanobacteria. Phycobilisomes absorb light and
transfer its energy to the photosynthetic reaction centres,
acting as a light-harvesting antenna. Phycoviolobilin, the
chromophore of PEC, isomerizes between two stable config-
urations upon light irradiation. UV–vis absorption was used to
monitor the efficiency of photoconversion, and the structures
of the two isomeric forms were eventually obtained to provide
the structural basis of PEC photochemistry (Schmidt et al.,
2007).
4.4. Fluorescent proteins
While it was rapidly realised that the chromophores of
fluorescent proteins, as well as the surrounding residues, were
particularly sensitive to radiation damage by X-rays (Adam et
al., 2009; Royant & Noirclerc-Savoye, 2011; Figs. 6h and 7h)
and thus that special care is required during data collection
and structural analysis, the Cryobench has become an essential
instrument to study the structure and function of proteins
homologous to green fluorescent protein (GFP; Tsien, 1998).
The most common application of the Cryobench is to compare
the spectroscopic signatures of different proteins in crystals
with those in solution. While these are generally very similar
(Carpentier et al., 2009; Goedhart et al., 2012; Lelimousin et al.,
2009; Violot et al., 2009; von Stetten, Noirclerc-Savoye et al.,
2012), fluorescence lifetimes are shorter in crystals, which is
related to the higher refractive index of the crystal mother
liquor (Royant et al., 2007; Suhling et al., 2002), and the fact
that diffusion of small molecules close to the chromophore can
induce subtle rearrangements of side chains and subsequent
displacement of absorption and emission peaks (von Stetten,
Batot et al., 2012). Moreover, the Cryobench is adapted to the
elucidation of various reversible or irreversible mechanisms of
fluorescent proteins: photoactivation, photobleaching and
photoswitching. These studies take advantage of the various
available laser lines available at the Cryobench as well as the
possibility of adjusting the temperature at which measure-
ments are made (Adam et al., 2008; de Rosny & Carpentier,
2012; Duan et al., 2013; Faro et al., 2010, 2011).
4.5. Noncoloured proteins or DNA
All of the examples given above highlight studies of
proteins that are coloured. Optical spectroscopy can, in some
cases, also be applied to noncoloured samples which contain
specific chemical bonds. Disulfide bonds bridging two
cysteines result in a distinct Raman stretching mode because
of the greater mass of S atoms and their relative scarcity within
proteins. Raman spectroscopy has thus been used to study the
presence, or absence, of disulfide bonds in the active sites of
various mutants of the thiol–disulfide oxidoreductase DsbA
(Lafaye et al., 2009; Figs. 6i and 7i). Disulfide bonds are
known for their X-ray sensitivity (Weik et al., 2000). UV–vis
research papers
Acta Cryst. (2015). D71, 15–26 von Stetten et al. � In crystallo optical spectroscopy 23

absorption can be used to identify the presence of radiation
damage by monitoring the formation of a disulfide radical,
an intermediate state in bond reduction, in various protein
crystals (McGeehan et al., 2009; Murray & Garman, 2002;
Weik et al., 2002) and online Raman spectroscopy can be used
to monitor the kinetics of X-ray-induced disulfide-bond
photoreduction (Carpentier et al., 2010; McGeehan et al.,
2011). Similarly, X-ray-induced debromination of brominated
DNA crystals can also be monitored using Raman spectro-
scopy (McGeehan et al., 2007).
5. Methodological applications
As well as being crucial in providing complementary infor-
mation in the study of the crystal structures of certain
biological macromolecules, the Cryobench can be used in
applications of more general use. Heavy-atom soaking can be
monitored if it produces a species with a specific spectroscopic
signature (e.g. a mercury–sulfur covalent bond), thus allowing
a precise determination of optimal (at least in terms of heavy-
atom binding) soaking times (Carpentier et al., 2007); the
exposure of crystals to UV light can be used to locate crystals
in loops by their intrinsic fluorescence (Jacquamet et al., 2004;
Vernede et al., 2006) or to deliberately induce radiation
damage to crystals, which can then be exploited to provide
phase information for crystal structure solution via UV-RIP
(Nanao & Ravelli, 2006); the pH in a crystal can be directly
determined by soaking samples in an exogenous pH-sensitive
fluorophore (Bourgeois et al., 2002; Fioravanti et al., 2003).
Under favourable circumstances, optical spectroscopy can also
be used to identify unknown ligands that are found in elec-
tron-density maps to be bound to a protein. Examples here
include the use of Raman spectroscopy to unambiguously
prove the binding of a nitrate ion to xylose isomerase
(Carpentier et al., 2007) and the identification of chlorophyll a
and carotenoids, in substoichiometric amounts, in crystals of
the c-ring of a proton-coupled F1Fo ATP synthase (Pogoryelov
et al., 2009).
The Cryobench is also an indispensible tool for kinetic
crystallography (KX) experiments based on the use of caged
compounds. Synchronization of de-caging can be achieved
with an actinic light. In this regard, noncoloured proteins can
be made coloured in the near-UV range by chemically grafting
a photolabile group onto either a substrate (e.g. deoxy-
thymidine monophosphate), cofactor (e.g. adenosine triphos-
phate or dioxygen) or product [e.g. (arseno)choline] of the
protein (Colletier et al., 2007; Howard-Jones et al., 2009;
Specht et al., 2001; Ursby et al., 2002). Less expectedly, the
Cryobench can also be used in experiments that use KX to
study the catalysis of inorganic complexes. Because crystals of
small molecules allow very little movement of the molecules
that they contain, KX experiments on such systems are diffi-
cult to perform. However, in an elegant approach, reaction-
intermediate states of an inorganic iron complex, as monitored
using UV–vis absorption and Raman spectroscopies, were
trapped using crystals of a protein with a large cavity and their
three-dimensional structures were solved (Cavazza et al.,
2010).
A final advantage of the Cryobench is that the temperature
at which measurements are carried out can be varied. In order
to prepare KX experiments, temperature-derivative fluores-
cence, or absorbance, microspectrophotometry (TDFM/
TDAM) has been developed to allow the monitoring of
solvent phase transitions in protein crystals (Weik et al., 2004)
and, in protein solutions, to determine whether the correlation
between solvent and protein motions is necessary for the
formation of reaction-intermediate states (Durin et al., 2009).
6. Perspectives
The development of the ESRF Cryobench facility is a
continuous effort that endeavours to keep pace with progress
on the macromolecular crystallography beamlines situated
nearby. Two main aspects can be outlined: automation and
online spectroscopy. More and more samples are now brought
or sent to synchrotrons for diffraction experiments. Comple-
menting these experiments with optical spectroscopic analysis
thus requires automation of sample mounting and both posi-
tional and angular centring in both the offline and online
setups. The current upgrade of beamlines requires adaptation
of optical setups to newly designed experimental hutches. To
begin with, an improved Raman setup has been installed on
ID29 and will eventually be duplicated on one of the new
MASSIF structural biology beamlines (Theveneau et al.,
2013).
The Cryobench is a platform of the Grenoble Instruct
centre (ISBG; UMS 3518 CNRS–CEA–UJF–EMBL) with
support from ESRF, FRISBI (ANR-10-INSB-05-02) and
GRAL (ANR-10-LABX-49-01) within the Grenoble Part-
nership for Structural Biology (PSB). AR acknowledges
financial support from the French National Research Agency
(ANR-11-JSV5-0009-01). We would like to thank Dominique
Bourgeois, Philippe Charrault, Philippe Duru, Guillaume
Gotthard, John McGeehan, Sean McSweeney, Jeremy Ohana,
Thomas Ursby, Xavier Vernede and Martin Weik for past or
present contributions and discussions about this work. We are
grateful to all users of the Cryobench, especially Tiago Barros,
Isabel Bento, Hans-Petter Hersleth, Yvain Nicolet, Roberto
Orru and Patrick Scheerer for providing spectroscopic data
presented in this work.
References
Adam, V., Carpentier, P., Violot, S., Lelimousin, M., Darnault, C.,Nienhaus, G. U. & Bourgeois, D. (2009). J. Am. Chem. Soc. 131,18063–18065.
Adam, V., Lelimousin, M., Boehme, S., Desfonds, G., Nienhaus, K.,Field, M. J., Wiedenmann, J., McSweeney, S., Nienhaus, G. U. &Bourgeois, D. (2008). Proc. Natl Acad. Sci. USA, 105, 18343–18348.
Adam, V., Royant, A., Niviere, V., Molina-Heredia, F. P. & Bourgeois,D. (2004). Structure, 12, 1729–1740.
Anders, K., Daminelli-Widany, G., Mroginski, M. A., von Stetten, D.& Essen, L.-O. (2013). J. Biol. Chem. 288, 35714–35725.
Aragao, D., Macedo, S., Mitchell, E. P., Romao, C. V., Liu, M. Y.,Frazao, C., Saraiva, L. M., Xavier, A. V., LeGall, J., van Dongen,
research papers
24 von Stetten et al. � In crystallo optical spectroscopy Acta Cryst. (2015). D71, 15–26

W. M., Hagen, W. R., Teixeira, M., Carrondo, M. A. & Lindley, P.(2003). J. Biol. Inorg. Chem. 8, 540–548.
Barros, T., Royant, A., Standfuss, J., Dreuw, A. & Kuhlbrandt, W.(2009). EMBO J. 28, 298–306.
Barth, A. & Zscherp, C. (2002). Q. Rev. Biophys. 35, 369–430.Bento, I., Silva, C. S., Chen, Z., Martins, L. O., Lindley, P. F. & Soares,
C. M. (2010). BMC Struct. Biol. 10, 28.Berglund, G. I., Carlsson, G. H., Smith, A. T., Szoke, H., Henriksen,
A. & Hajdu, J. (2002). Nature (London), 417, 463–468.Bourgeois, D., Katona, G., de Rosny, E. & Carpentier, P. (2009).
Methods Mol. Biol. 544, 253–267.Bourgeois, D. & Royant, A. (2005). Curr. Opin. Struct. Biol. 15,
538–547.Bourgeois, D., Vernede, X., Adam, V., Fioravanti, E. & Ursby, T.
(2002). J. Appl. Cryst. 35, 319–326.Carpentier, P., Royant, A., Ohana, J. & Bourgeois, D. (2007). J. Appl.
Cryst. 40, 1113–1122.Carpentier, P., Royant, A., Weik, M. & Bourgeois, D. (2010).
Structure, 18, 1410–1419.Carpentier, P., Violot, S., Blanchoin, L. & Bourgeois, D. (2009). FEBS
Lett. 583, 2839–2842.Cavazza, C., Bochot, C., Rousselot-Pailley, P., Carpentier, P., Cherrier,
M. V., Martin, L., Marchi-Delapierre, C., Fontecilla-Camps, J. C. &Menage, S. (2010). Nature Chem. 2, 1069–1076.
Chen, Y., Srajer, V., Ng, K., LeGrand, A. & Moffat, K. (1994). Rev.Sci. Instrum. 65, 1506.
Choe, H.-W., Kim, Y. J., Park, J. H., Morizumi, T., Pai, E. F., Krauss,N., Hofmann, K. P., Scheerer, P. & Ernst, O. P. (2011). Nature(London), 471, 651–655.
Cipriani, F. et al. (2006). Acta Cryst. D62, 1251–1259.Cole, T., Kathman, A., Koszelak, S. & McPherson, A. (1995). Anal.
Biochem. 231, 92–98.Colletier, J.-P., Royant, A., Specht, A., Sanson, B., Nachon, F.,
Masson, P., Zaccai, G., Sussman, J. L., Goeldner, M., Silman, I.,Bourgeois, D. & Weik, M. (2007). Acta Cryst. D63, 1115–1128.
De la Mora, E., Lovett, J. E., Blanford, C. F., Garman, E. F.,Valderrama, B. & Rudino-Pinera, E. (2012). Acta Cryst. D68,564–577.
Dias, J. M., Alves, T., Bonifacio, C., Pereira, A. S., Trincao, J.,Bourgeois, D., Moura, I. & Romao, M. J. (2004). Structure, 12,961–973.
Duan, C., Adam, V., Byrdin, M., Ridard, J., Kieffer-Jaquinod, S.,Morlot, C., Arcizet, D., Demachy, I. & Bourgeois, D. (2013). J. Am.Chem. Soc. 135, 15841–15850.
Dubnovitsky, A. P., Ravelli, R. B., Popov, A. N. & Papageorgiou, A. C.(2005). Protein Sci. 14, 1498–1507.
Durin, G., Delaunay, A., Darnault, C., Heyes, D. J., Royant, A.,Vernede, X., Hunter, C. N., Weik, M. & Bourgeois, D. (2009).Biophys. J. 96, 1902–1910.
Edman, K., Royant, A., Larsson, G., Jacobson, F., Taylor, T., van derSpoel, D., Landau, E. M., Pebay-Peyroula, E. & Neutze, R. (2004).J. Biol. Chem. 279, 2147–2158.
Edman, K., Royant, A., Nollert, P., Maxwell, C. A., Pebay-Peyroula,E., Navarro, J., Neutze, R. & Landau, E. M. (2002). Structure, 10,473–482.
Ellis, M. J., Buffey, S. G., Hough, M. A. & Hasnain, S. S. (2008). J.Synchrotron Rad. 15, 433–439.
Essen, L.-O., Mailliet, J. & Hughes, J. (2008). Proc. Natl Acad. Sci.USA, 105, 14709–14714.
Faro, A. R., Adam, V., Carpentier, P., Darnault, C., Bourgeois, D. &de Rosny, E. (2010). Photochem. Photobiol. Sci. 9, 254–262.
Faro, A. R., Carpentier, P., Jonasson, G., Pompidor, G., Arcizet, D.,Demachy, I. & Bourgeois, D. (2011). J. Am. Chem. Soc. 133, 16362–16365.
Ferraroni, M., Matera, I., Chernykh, A., Kolomytseva, M., Golovleva,L. A., Scozzafava, A. & Briganti, F. (2012). J. Inorg. Biochem. 111,203–209.
Fioravanti, E., Haouz, A., Ursby, T., Munier-Lehmann, H., Delarue,M. & Bourgeois, D. (2003). J. Mol. Biol. 327, 1077–1092.
Gabadinho, J. et al. (2010). J. Synchrotron Rad. 17, 700–707.Garman, E. F. (2010). Acta Cryst. D66, 339–351.Goedhart, J., von Stetten, D., Noirclerc-Savoye, M., Lelimousin, M.,
Joosen, L., Hink, M. A., van Weeren, L., Gadella, T. W. Jr &Royant, A. (2012). Nature Commun. 3, 751.
Gumiero, A., Metcalfe, C. L., Pearson, A. R., Raven, E. L. & Moody,P. C. E. (2011). J. Biol. Chem. 286, 1260–1268.
Hadfield, A. & Hajdu, J. (1993). J. Appl. Cryst. 26, 839–842.Hersleth, H.-P. & Andersson, K. K. (2011). Biochim. Biophys. Acta,
1814, 785–796.Hersleth, H.-P., Hsiao, Y.-W., Ryde, U., Gorbitz, C. H. & Andersson,
K. K. (2008). Biochem. J. 412, 257–264.Howard-Jones, A. R., Adam, V., Cowley, A., Baldwin, J. E. &
Bourgeois, D. (2009). Photochem. Photobiol. Sci. 8, 1150–1156.
Ihee, H., Rajagopal, S., Srajer, V., Pahl, R., Anderson, S., Schmidt, M.,Schotte, F., Anfinrud, P. A., Wulff, M. & Moffat, K. (2005). Proc.Natl Acad. Sci. USA, 102, 7145–7150.
Jacob, J., Krafft, C., Welfle, K., Welfle, H. & Saenger, W. (1998). ActaCryst. D54, 74–80.
Jacquamet, L., Ohana, J., Joly, J., Legrand, P., Kahn, R., Borel, F.,Pirocchi, M., Charrault, P., Carpentier, P. & Ferrer, J.-L. (2004).Acta Cryst. D60, 888–894.
Jung, Y. O., Lee, J. H., Kim, J., Schmidt, M., Moffat, K., Srajer, V. &Ihee, H. (2013). Nature Chem. 5, 212–220.
Katona, G., Carpentier, P., Niviere, V., Amara, P., Adam, V., Ohana, J.,Tsanov, N. & Bourgeois, D. (2007). Science, 316, 449–453.
Kiontke, S., Geisselbrecht, Y., Pokorny, R., Carell, T., Batschauer, A.& Essen, L.-O. (2011). EMBO J. 30, 4437–4449.
Klink, B. U., Goody, R. S. & Scheidig, A. J. (2006). Biophys. J. 91,981–992.
Kort, R., Hellingwerf, K. J. & Ravelli, R. B. G. (2004). J. Biol. Chem.279, 26417–26424.
Kort, R., Komori, H., Adachi, S., Miki, K. & Eker, A. (2004). ActaCryst. D60, 1205–1213.
Kort, R., Ravelli, R. B. G., Schotte, F., Bourgeois, D., Crielaard, W.,Hellingwerf, K. J. & Wulff, M. (2003). Photochem. Photobiol. 78,131–137.
Krimm, S. & Bandekar, J. (1986). Adv. Protein Chem. 38, 181–364.Lafaye, C., Iwema, T., Carpentier, P., Jullian-Binard, C., Kroll, J. S.,
Collet, J.-F. & Serre, L. (2009). J. Mol. Biol. 392, 952–966.Lelimousin, M., Noirclerc-Savoye, M., Lazareno-Saez, C., Paetzold,
B., Le Vot, S., Chazal, R., Macheboeuf, P., Field, M. J., Bourgeois, D.& Royant, A. (2009). Biochemistry, 48, 10038–10046.
Macedo, S., Pechlaner, M., Schmid, W., Weik, M., Sato, K., Dennison,C. & Djinovic-Carugo, K. (2009). J. Synchrotron Rad. 16, 191–204.
Mailliet, J., Psakis, G., Feilke, K., Sineshchekov, V., Essen, L.-O. &Hughes, J. (2011). J. Mol. Biol. 413, 115–127.
Mailliet, J., Psakis, G., Schroeder, C., Kaltofen, S., Durrwang, U.,Hughes, J. & Essen, L.-O. (2009). Acta Cryst. D65, 1232–1235.
Marcaida, M. J., Schlarb-Ridley, B. G., Worrall, J. A., Wastl, J., Evans,T. J., Bendall, D. S., Luisi, B. F. & Howe, C. J. (2006). J. Mol. Biol.360, 968–977.
McGeehan, J. E., Bourgeois, D., Royant, A. & Carpentier, P. (2011).Biochim. Biophys. Acta, 1814, 750–759.
McGeehan, J. E., Carpentier, P., Royant, A., Bourgeois, D. & Ravelli,R. B. G. (2007). J. Synchrotron Rad. 14, 99–108.
McGeehan, J., Ravelli, R. B. G., Murray, J. W., Owen, R. L., Cipriani,F., McSweeney, S., Weik, M. & Garman, E. F. (2009). J. SynchrotronRad. 16, 163–172.
Moldt, J., Pokorny, R., Orth, C., Linne, U., Geisselbrecht, Y.,Marahiel, M. A., Essen, L.-O. & Batschauer, A. (2009). J. Biol.Chem. 284, 21670–21683.
Murray, J. & Garman, E. (2002). J. Synchrotron Rad. 9, 347–354.Nanao, M. H. & Ravelli, R. B. G. (2006). Structure, 14, 791–800.
research papers
Acta Cryst. (2015). D71, 15–26 von Stetten et al. � In crystallo optical spectroscopy 25

Nicolet, Y., de Lacey, A. L., Vernede, X., Fernandez, V. M.,Hatchikian, E. C. & Fontecilla-Camps, J. C. (2001). J. Am. Chem.Soc. 123, 1596–1601.
Okada, T., Fujiyoshi, Y., Silow, M., Navarro, J., Landau, E. M. &Shichida, Y. (2002). Proc. Natl Acad. Sci. USA, 99, 5982–5987.
Orru, R., Dudek, H. M., Martinoli, C., Torres Pazmino, D. E., Royant,A., Weik, M., Fraaije, M. W. & Mattevi, A. (2011). J. Biol. Chem.286, 29284–29291.
Orville, A. M., Buono, R., Cowan, M., Heroux, A., Shea-McCarthy,G., Schneider, D. K., Skinner, J. M., Skinner, M. J., Stoner-Ma, D. &Sweet, R. M. (2011). J. Synchrotron Rad. 18, 358–366.
Owen, R. L., Pearson, A. R., Meents, A., Boehler, P., Thominet, V. &Schulze-Briese, C. (2009). J. Synchrotron Rad. 16, 173–182.
Owen, R. L., Yorke, B. A. & Pearson, A. R. (2012). Acta Cryst. D68,505–510.
Pearson, A. R., Mozzarelli, A. & Rossi, G. L. (2004). Curr. Opin.Struct. Biol. 14, 656–662.
Peticolas, W. L. (1995). Methods Enzymol. 246, 389–416.Pogoryelov, D., Yildiz, O., Faraldo-Gomez, J. D. & Meier, T. (2009).
Nature Struct. Mol. Biol. 16, 1068–1073.Pompidor, G., Dworkowski, F. S. N., Thominet, V., Schulze-Briese, C.
& Fuchs, M. R. (2013). J. Synchrotron Rad. 20, 765–776.Rajagopal, B. S., Wilson, M. T., Bendall, D. S., Howe, C. J. & Worrall,
J. A. (2011). J. Biol. Inorg. Chem. 16, 577–588.Rosny, E. de & Carpentier, P. (2012). J. Am. Chem. Soc. 134, 18015–
18021.Royant, A., Carpentier, P., Ohana, J., McGeehan, J., Paetzold, B.,
Noirclerc-Savoye, M., Vernede, X., Adam, V. & Bourgeois, D.(2007). J. Appl. Cryst. 40, 1105–1112.
Royant, A., Edman, K., Ursby, T., Pebay-Peyroula, E., Landau, E. M.& Neutze, R. (2000). Nature (London), 406, 645–648.
Royant, A. & Noirclerc-Savoye, M. (2011). J. Struct. Biol. 174,385–390.
Sainz, G., Jakoncic, J., Sieker, L. C., Stojanoff, V., Sanishvili, N., Asso,M., Bertrand, P., Armengaud, J. & Jouanneau, Y. (2006). J. Biol.Inorg. Chem. 11, 235–246.
Sakai, K., Matsui, Y., Kouyama, T., Shiro, Y. & Adachi, S. (2002). J.Appl. Cryst. 35, 270–273.
Sanchez-Weatherby, J., Bowler, M. W., Huet, J., Gobbo, A., Felisaz, F.,Lavault, B., Moya, R., Kadlec, J., Ravelli, R. B. G. & Cipriani, F.(2009). Acta Cryst. D65, 1237–1246.
de Sanctis, D. et al. (2012). J. Synchrotron Rad. 19, 455–461.Schmidt, M., Patel, A., Zhao, Y. & Reuter, W. (2007). Biochemistry,
46, 416–423.Shimizu, N., Shimizu, T., Baba, S., Hasegawa, K., Yamamoto, M. &
Kumasaka, T. (2013). J. Synchrotron Rad. 20, 948–952.Specht, A., Ursby, T., Weik, M., Peng, L., Kroon, J., Bourgeois, D. &
Goeldner, M. (2001). Chembiochem 2, 845–848.Standfuss, J., Terwisscha van Scheltinga, A. C., Lamborghini, M. &
Kuhlbrandt, W. (2005). EMBO J. 24, 919–928.von Stetten, D., Batot, G. O., Noirclerc-Savoye, M. & Royant, A.
(2012). Acta Cryst. D68, 1578–1583.Stetten, D. von, Noirclerc-Savoye, M., Goedhart, J., Gadella, T. W. J.
& Royant, A. (2012). Acta Cryst. F68, 878–882.Stoner-Ma, D., Skinner, J. M., Schneider, D. K., Cowan, M., Sweet,
R. M. & Orville, A. M. (2011). J. Synchrotron Rad. 18, 37–40.Suhling, K., Siegel, J., Phillips, D., French, P. M., Leveque-Fort, S.,
Webb, S. E. & Davis, D. M. (2002). Biophys. J. 83, 3589–3595.Theveneau, P. et al. (2013). J. Phys. Conf. Ser. 425, 012001.Trepreau, J., Girard, E., Maillard, A. P., de Rosny, E., Petit-Haertlein,
I., Kahn, R. & Coves, J. (2011). J. Mol. Biol. 408, 766–779.Tsien, R. Y. (1998). Annu. Rev. Biochem. 67, 509–544.Ursby, T., Weik, M., Fioravanti, E., Delarue, M., Goeldner, M. &
Bourgeois, D. (2002). Acta Cryst. D58, 607–614.Vernede, X., Lavault, B., Ohana, J., Nurizzo, D., Joly, J., Jacquamet, L.,
Felisaz, F., Cipriani, F. & Bourgeois, D. (2006). Acta Cryst. D62,253–261.
Violot, S., Carpentier, P., Blanchoin, L. & Bourgeois, D. (2009). J. Am.Chem. Soc. 131, 10356–10357.
Wahlgren, W. Y., Omran, H., von Stetten, D., Royant, A., van derPost, S. & Katona, G. (2012). PLoS One, 7, e46992.
Weik, M., Berges, J., Raves, M. L., Gros, P., McSweeney, S., Silman, I.,Sussman, J. L., Houee-Levin, C. & Ravelli, R. B. G. (2002). J.Synchrotron Rad. 9, 342–346.
Weik, M., Ravelli, R. B. G., Kryger, G., McSweeney, S., Raves, M. L.,Harel, M., Gros, P., Silman, I., Kroon, J. & Sussman, J. L. (2000).Proc. Natl Acad. Sci. USA, 97, 623–628.
Weik, M., Vernede, X., Royant, A. & Bourgeois, D. (2004). Biophys.J. 86, 3176–3185.
Williams, P., Coates, L., Mohammed, F., Gill, R., Erskine, P.,Bourgeois, D., Wood, S. P., Anthony, C. & Cooper, J. B. (2006). J.Mol. Biol. 357, 151–162.
research papers
26 von Stetten et al. � In crystallo optical spectroscopy Acta Cryst. (2015). D71, 15–26