ACT Box - Gum Woodland Offset Monitoring - Environment · Appendix G Kenny Vegetation Survey...
107
www.smec.com ACT Box - Gum Woodland Offset Monitoring 2016 Prepared for: Parks and Conservation / Urban Reserves Reference No: 3002505 2/06/2017
Transcript of ACT Box - Gum Woodland Offset Monitoring - Environment · Appendix G Kenny Vegetation Survey...
www.smec.com
ACT Box - Gum Woodland Offset Monitoring
2016 Prepared for: Parks and Conservation / Urban Reserves
Reference No: 3002505 2/06/2017

Document/Report Control Form
Report for
ACT Box - Gum Woodland Offset Monitoring | Parks and Conservation / Urban Reserves | 3002505
SMEC Australia | Page ii
Document / Report Control Form
File Location Name: X:\PROJECT\3002505 ACT Box Gum Woodland Mointoring\Report\Compiled\Box Gum Woodland Monitoring Report 2016.docx
Project Name: ACT Box - Gum Woodland Monitoring 2016
Project Number: 3002505
Revision Number: 1
Revision History Revision # Date Prepared by Reviewed by Approved for Issue by
0 (Draft for Review)
13/04/17 Natasha Crook David Moore
Dr Robert Jessop Dr Robert Jessop
1 – Final 02/06/17 Natasha Crook David Moore
Dr Robert Jessop David Moore
Issue Register Distribution List Date Issued Number of Copies
Parks and Conservation/Urban Reserves 02/06/2017 Electronic
Office Library [Canberra Office] Electronic
SMEC Project File
SMEC Company Details Daniel Spackman
Suite 2, Level 1, 243 Northbourne Avenue, Lyneham, ACT 2602
Tel: +61 (02) 6234 1977 Fax: +61 2 6234 1966
Email: [email protected] Website: www.smec.com
The information within this document is and shall remain the property of SMEC Australia.

Report for
ACT Box - Gum Woodland Offset Monitoring | Parks and Conservation / Urban Reserves | 3002505
SMEC Australia | Page iii
This report is confidential and is provided solely for the purposes of monitoring of ACT Box - Gum Woodland in offsets sites in the ACT. This report is provided pursuant to a Consultancy Agreement between SMEC Australia Pty Limited (“SMEC”) and Parks and Conservation / Urban Reserves under which SMEC undertook to perform a specific and limited task for Parks and Conservation / Urban Reserves. This report is strictly limited to the matters stated in it and subject to the various assumptions, qualifications and limitations in it and does not apply by implication to other matters. SMEC makes no representation that the scope, assumptions, qualifications and exclusions set out in this report will be suitable or sufficient for other purposes nor that the content of the report covers all matters, which you may regard as material for your purposes.
This report must be read as a whole. The executive summary is not a substitute for this. Any subsequent report must be read in conjunction with this report.
The report supersedes all previous draft or interim reports, whether written or presented orally, before the date of this report. This report has not and will not be updated for events or transactions occurring after the date of the report or any other matters which might have a material effect on its contents or which come to light after the date of the report. SMEC is not obliged to inform you of any such event, transaction or matter nor to update the report for anything that occurs, or of which SMEC becomes aware, after the date of this report.
Unless expressly agreed otherwise in writing, SMEC does not accept a duty of care or any other legal responsibility whatsoever in relation to this report, or any related enquiries, advice or other work, nor does SMEC make any representation in connection with this report, to any person other than Parks and Conservation / Urban Reserves. Any other person who receives a draft or a copy of this report (or any part of it) or discusses it (or any part of it) or any related matter with SMEC, does so on the basis that he or she acknowledges and accepts that he or she may not rely on this report nor on any related information or advice given by SMEC for any purpose whatsoever.

Report for
ACT Box - Gum Woodland Offset Monitoring | Parks and Conservation / Urban Reserves | 3002505
SMEC Australia | Page i
Table of Contents
Executive Summary .......................................................................................................................... i
1. Introduction ............................................................................................................................. 1
2. Methods ................................................................................................................................... 2
2.1. Overview ........................................................................................................................... 2 2.2. Specific Method Requirements ........................................................................................ 2
2.2.1. North Gungahlin Offset ............................................................................................ 2 2.2.2. Isaacs Ridge Offset .................................................................................................... 3 2.2.3. Justice Robert Hope Park Offset ............................................................................... 3 2.2.4. The Pinnacle Offset ................................................................................................... 3
2.3. Limitations ........................................................................................................................ 3
3. Results ..................................................................................................................................... 4
3.1. Throsby Offset .................................................................................................................. 4
3.1.1. Overview 4 3.1.2. Throsby North Summary .......................................................................................... 4 3.1.3. Throsby East Summary ............................................................................................. 9 3.1.4. Kenny Broadacre Summary .................................................................................... 13 3.1.5. Recommendations .................................................................................................. 17
3.2. Kinlyside Offset ............................................................................................................... 17
3.2.1. Overview 17 3.2.2. Kinlyside Offset Summary....................................................................................... 18 3.2.3. Recommendations .................................................................................................. 23
3.3. Kenny Offset ................................................................................................................... 23
3.3.1. Overview 23 3.3.2. Kenny Offset Summary ........................................................................................... 23 3.3.3. Recommendations .................................................................................................. 24
3.4. North Gungahlin Offset .................................................................................................. 28
3.4.1. Overview 28 3.4.2. Taylor Summary ...................................................................................................... 28 3.4.3. Horse Park North Summary .................................................................................... 32 3.4.4. Recommendations .................................................................................................. 32
3.5. Isaacs Ridge Offset .......................................................................................................... 34
3.5.1. Overview 34 3.5.2. Isaacs Ridge Offset Summary ................................................................................. 34 3.5.3. Recommendations .................................................................................................. 35
3.6. Justice Robert Hope Park Offset ..................................................................................... 41
3.6.1. Overview 41 3.6.2. Justice Robert Hope Park Offset Summary ............................................................ 41 3.6.3. 2014 Comparison .................................................................................................... 45 3.6.4. Recommendations .................................................................................................. 46

Report for
ACT Box - Gum Woodland Offset Monitoring | Parks and Conservation / Urban Reserves | 3002505
SMEC Australia
3.7. The Pinnacle Offset ......................................................................................................... 47
3.7.1. Overview 47 3.7.2. The Pinnacle Offset Summary ................................................................................ 47 3.7.3. 2015 Comparison .................................................................................................... 53 3.7.4. Recommendations .................................................................................................. 54
4. Conclusion .............................................................................................................................. 55
5. References ............................................................................................................................. 57
Appendices ................................................................................................................................... 59
Table of Figures
Figure 1. Offset site locations. ......................................................................................................... 1 Figure 2. Throsby offset areas and plot locations. ............................................................................ 6 Figure 3. Kinlyside offset area and plot locations. .......................................................................... 20 Figure 4. Kenny offset area and plot locations. .............................................................................. 25 Figure 5. North Gungahlin offset areas and plot locations. ............................................................ 30 Figure 6. Isaacs Ridge offset area and plot locations. ..................................................................... 36 Figure 7. Justice Robert Hope Park offset area and plot locations. ................................................. 42 Figure 8. Pinnacle Nature Reserve offset area and plot locations. .................................................. 50
List of Tables
Table 1. Offset area assessment summary (executive summary). .................................................... ii Table 2. Summary of monitoring history. ......................................................................................... 1 Table 3. Quadrat results summary for Throsby North Offset Area.................................................... 7 Table 4. Transect results summary for Throsby North Offset Area. .................................................. 8 Table 5. Quadrat results summary for Throsby East Offset Area. ................................................... 11 Table 6. Transect results summary for Throsby East Offset Area. ................................................... 12 Table 7. Quadrat results summary for Kenny Broadacre Offset Area. ............................................ 15 Table 8. Transect results summary for Kenny Broadacre Offset Area. ............................................ 16 Table 9. Quadrat results summary for Kinlyside Nature Reserve. ................................................... 21 Table 10. Transect results summary for Kinlyside Nature Reserve. ................................................ 22 Table 11. Quadrat results summary for Kenny Offset Area. ........................................................... 26 Table 12. Transect results summary for Kenny Offset Area. ........................................................... 27 Table 13. Quadrat results summary for Taylor Offset. ................................................................... 31 Table 14. Transect results summary for Taylor Offset. ................................................................... 31 Table 15. Quadrat results summary for Horse Park North Offset. .................................................. 33 Table 16. Transect results summary for Horse Park North Offset. .................................................. 33 Table 17. 20x20 m quadrat results summary for Isaacs Ridge. ....................................................... 37 Table 18. Transect results summary for Isaacs Ridge. .................................................................... 38 Table 19. 1 m x1 m quadrat results summary for Isaacs Ridge. ...................................................... 38 Table 20. Biometric assessment of disturbance for Isaacs Ridge. ................................................... 39 Table 21. Rapid assessment for Isaacs Ridge. ................................................................................. 40 Table 22. Quadrat results summary for Justice Robert Hope Park. ................................................. 43 Table 23. Transect results summary for Justice Robert Hope Park. ................................................ 44 Table 24. Comparison of quadrat averages and ranges for Justice Robert Hope Park: 2014 and 2016. ............................................................................................................................................. 45
Report for
ACT Box - Gum Woodland Offset Monitoring | Parks and Conservation / Urban Reserves | 3002505
SMEC Australia
Table 25.Comparison of transect averages and ranges for Justice Robert Hope Park: 2014 and 2016. ............................................................................................................................................. 46 Table 26. Quadrat results summary for Pinnacle Offset. ................................................................ 51 Table 27. Transect results summary for Pinnacle Offset. ................................................................ 52 Table 28. Comparison of quadrat averages and ranges for Pinnacle Offset: 2015 and 2016. ........... 53 Table 29. Comparison of transect averages and ranges for Pinnacle Offset: 2015 and 2016. .......... 54 Table 30. Offset area assessment summary. .................................................................................. 56
Appendices
Appendix A Vegetation Benchmarks
Appendix B Throsby Plot Locations
Appendix C Throsby Vegetation Survey Results 2016
Appendix D Kinlyside Plot Locations
Appendix E Kinlyside Vegetation Survey Results 2016
Appendix F Kenny Plot Locations
Appendix G Kenny Vegetation Survey Results 2016
Appendix H North Gungahlin Plot Locations
Appendix I North Gungahlin Vegetation Survey Results 2016
Appendix J Isaacs Ridge Plot Locations
Appendix K Isaacs Ridge Vegetation Survey Results 2016
Appendix L Justice Robert Hope Park Plot Locations
Appendix M Justice Robert Hope Park Vegetation Survey Results 2016
Appendix N Justice Robert Hope Park Updated 2014 Floristic Score Values
Appendix O Pinnacle Nature Reserve Offset Plot Locations
Appendix P Pinnacle Nature Reserve Offset Vegetation Survey Results 2016
Appendix Q Pinnacle Nature Reserve Offset Updated 2015 Floristic Score Values

Report for
ACT Box - Gum Woodland Offset Monitoring | Parks and Conservation / Urban Reserves | 3002505
SMEC Australia | Page i
Executive Summary
Parks and Conservation Service / Urban Reserves engaged SMEC Australia to monitor the condition of yellow box – Blakely’s red gum woodland across the following offset areas containing box – gum woodland during spring 2016:
Throsby Offset, including Throsby North, Throsby East and Kenny Broadacre
Kinlyside Offset
Kenny Offset
North Gungahlin Offset
Isaacs Ridge Offset
Justice Robert Hope Park Offset
The Pinnacle Offset.
The purpose of the monitoring is to record box – gum woodland floristic diversity and vegetation structure using a modified biometric method (ACT Government 2015a) at each of the offset reserves using consistent procedures and protocols, as required under the Commonwealth approval conditions, and, where applicable, relevant management plans for the offset areas.
The information collected will inform land management decisions by providing information about the condition of box - gum woodland within the offset site. Mapping of woodland extent was excluded from the scope of works for 2016.
Field survey technique and data requirements for all sites were conducted in accordance with the biometric method as outlined in Monitoring Guidelines for Box – Gum Woodland (Conservation Research 2015) and the ACT Environmental Offsets Calculator (ACT Government 2015a). Parks and Conservation Service/Urban Reserves provided plot locations.
Vegetation monitoring was completed between September and November 2016. Surveys were undertaken during the optimal period for the detection of a high diversity of native forb species. Wet early spring conditions resulted in a higher proportion of exotic annual grasses and weeds than would have been recorded in drier conditions.
The floristic value scores and conservation value for each offset area is presented in Table 1. Three offset sites, i.e. Throsby, Kenny and Justice Robert Hope Park had average floristic score values less than 10 indicating that these sites have low conservation value based on groundcover floristic diversity. All other sites, i.e. Kinlyside, North Gungahlin, Isaacs Ridge and the Pinnacle had average floristic value scores between 15 and 30, indicating that these sites have moderate to very high conservation values based on groundcover floristic diversity. There was a high degree of variation in floristic condition between plots at all sites. Detailed monitoring data is summarised in the relevant sections to enable comparison with future years of monitoring.
The key management recommendations are:
Manage weeds at all sites, taking into account the following:
All contractors or community group members undertaking weed control activities should be trained in recognition of weeds and desirable native species
Consider removal of additional invasive perennial grass species such as Chilean needlegrass (Nassella neesiana), phalaris (Phalaris aquatica), paspalum (Paspalum dilatatum) and tall fescue (Festuca arundinacea) where present in high value areas
Plant trees or assist natural regeneration in landscapes where regeneration is absent from large areas or there is no source population. This is particularly relevant to the Throsby Offset.
Trial thinning of dense Blakely’s red gum (Eucalyptus blakelyi) regeneration where it appears to be having a detrimental impact on tree health

Report for
ACT Box - Gum Woodland Offset Monitoring | Parks and Conservation / Urban Reserves | 3002505
SMEC Australia
Manage vertebrate pests where woody debris has been placed
Where stock grazing leases or biomass management arrangements are in place for the offset, manage the grazing so that the intensity is sufficiently low during spring and summer to enable recruitment of native forbs and grasses. A review of grazing intensity is particularly relevant for Kinlyside Nature Reserve.
Table 1. Offset area assessment summary (executive summary).
Offset Area Offset Site Floristic Score
Value Average
Floristic Score Value
Range Conservation Value
Comparison to previous monitoring
Throsby Offset
Throsby North
7.4 (N=6) 0.6-29.3 little to very high -
Throsby Offset
Throsby East 2.9 (N=6) 0.4-9.9 little to low -
Throsby Offset
Kenny Broadacre
5.8 (N=3) 0.4-15.2 little to moderate-high.
-
Kinlyside Offset
- 19.8 (N=15) 2.1-43.0 little to exceptional. -
Kenny Offset - 5.3 (N=8) 0.6-15.5 little to moderate-to-high.
-
North Gungahlin Offset
Taylor 39.68 (N=1) exceptional -
North Gungahlin Offset
Horse Park North
23.32 (N=3) 18.7-26.3 moderate-to-high to very high
-
Isaacs Ridge - 15.4 (N=8) 6.3-36.8 low to exceptional -
Justice Robert Hope Park
- 5.6 (N=7) 1.0-24.2 little to high Negligible change from the 2014 floristic monitoring.
The Pinnacle - 26.8 (N=6) 6.4-56.4 low exceptional Substantially higher value at high value sites than recorded during the 2015 monitoring.

Report for
ACT Box - Gum Woodland Offset Monitoring | Parks and Conservation / Urban Reserves | 3002505
SMEC Australia | Page 1
1. Introduction
‘White-box yellow box-Blakely’s red gum grassy woodland and derived native grassland’ (i.e. box - gum woodland) is listed as a critically endangered ecological community under the Environment Protection and Biodiversity Conservation Act 1999 (EPBC Act) and listed as endangered under the ACT Nature Conservation Act 2014 (NC Act) and endangered under the NSW Threatened Species Conservation Act 1995. Parks and Conservation Service / Urban Reserves is responsible for the monitoring and management of box – gum woodland sites which have been established as offsets for development impacts on box – gum woodland under the EPBC Act.
Parks and Conservation Service / Urban Reserves engaged SMEC Australia to monitor the condition of yellow box – Blakely’s red gum woodland across the offset areas containing box – gum woodland during spring 2016. Offset areas in the ACT that contain box – gum woodland are:
Throsby Offset, including Throsby North, Throsby East and Kenny Broadacre
Kinlyside Offset
Kenny Offset
North Gungahlin Offset, including Taylor, Horse Park Drive North and Jacka
Isaacs Ridge Offset
Justice Robert Hope Park Offset
The Pinnacle Offset.
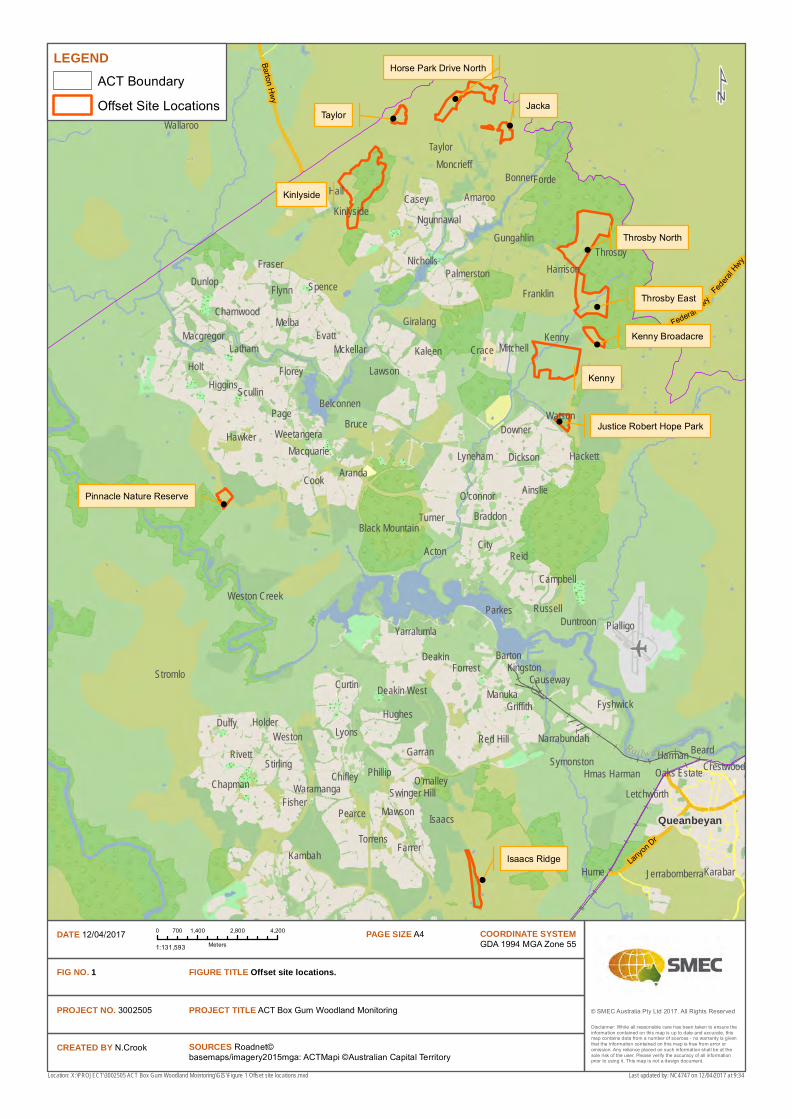
Locations of the woodland offset areas in the ACT are shown in Figure 1.
The establishment of the Throsby Offset, Kinlyside Offset, Kenny Offset and the North Gungahlin Offset was a condition of the Commonwealth Department of Environment and Energy (DEE) approval for the Gungahlin Strategic Assessment under Part 10 of the EPBC Act to compensate for development impacts on box – gum woodland in the Strategic Assessment Area. Isaacs Ridge Offset was established to offset the expansion of the Mugga Lane Resource Management Centre, Hume (EPBC 2011/5808). Justice Robert Hope Park Offset was established to compensate for impacts on box – gum woodland and the regent honeyeater from residential development and road extension at Negus Crescent, North Watson (EPBC 2012/6418). The Pinnacle Offset was established to compensate for the impact on box - gum woodland from the University of Canberra Public Hospital development (EPBC 2013/6987). Commonwealth approval conditions under the EPBC Act include a requirement for monitoring of woodland condition within each of the offset areas.
The condition and extent of box – gum woodland in Throsby, Kinlyside, Watson Woodlands, Isaacs Ridge and Pinnacle Offset Reserves have been previously mapped (Table 2) using the BioMetric method and/or the method reported in Umwelt (2011). Future monitoring of box – gum woodland is required to follow the BioMetric method, as specified in ACT Government (2015a), to quantify changes in the extent and quality of box – gum woodland through time.
Table 2. Summary of monitoring history.
Offset Area Previous assessments
The Pinnacle Offset Area (6 plots) SMEC Australia Pty Ltd (2016)
Gungahlin Strategic Assessment – Throsby, Kinlyside, Kenny (27 plots)
ACT Government (unpublished data) – assessment in 2014
Gungahlin Strategic Assessment – Hills, Ridges and Buffers: Jacka, Taylor, Horse Park North (4 plots)
Eco Logical Australia Pty Ltd (2011)
Isaacs Offset Area (8 plots) Umwelt (2011)

Report for
ACT Box - Gum Woodland Offset Monitoring | Parks and Conservation / Urban Reserves | 3002505
SMEC Australia | Page 2
Offset Area Previous assessments
Watson Woodlands (Justice Robert Hope Park) (7 plots) Robert Jessop Environmental Consultants (2014)
The purpose of the monitoring is to record box – gum woodland floristic diversity and vegetation structure using a modified BioMetric method (ACT Government 2015a) at each of the offset reserves using consistent procedures and protocols, as required under the Commonwealth approval conditions, and, where applicable, relevant management plans for the offset areas. The information collected will inform land management decisions by providing information about the condition of box - gum woodland within the offset sites. Mapping of woodland extent was excluded from the scope of works for 2016.
© SMEC Australia Pty Ltd 2017. All Rights Reserved
FIGURE TITLE Offset site locations. FIG NO. 1
CREATED BY N.Crook SOURCES Roadnet©basemaps/imagery2015mga: ACTMapi ©Australian Capital Territory
Location: X:\PROJECT\3002505 ACT Box Gum Woodland Mointoring\GIS\Figure 1 Offset site locations.mxd
DATE 12/04/2017 COORDINATE SYSTEMGDA 1994 MGA Zone 55
PAGE SIZE A4
PROJECT TITLE ACT Box Gum Woodland MonitoringPROJECT NO. 3002505
Queanbeyan
Reid
Page
Hume
Holt
Hall
Cook
City
Melba
Lyons
Kenny
Forde
Flynn
Evatt
Duffy
Crace
Casey
Bruce
Beard
Acton
Weston
Watson
Turner
Taylor
Spence
Rivett
Pearce
Parkes
Mawson
Manuka
LawsonLatham
Kambah
Kaleen
Isaacs
HughesHolder
Hawker
HarmanGarran
Fraser
Florey
Fisher
Farrer
Dunlop
Downer
Deakin
Curtin
Bonner
Barton
Aranda
Amaroo
Torrens
Throsby
Stromlo
Scullin
Russell
Phillip
Lyneham
Karabar
Higgins
Hackett
Forrest
Dickson
ChifleyChapman
Braddon
Ainslie
Wallaroo
StirlingRed Hill
Pialligo
O'malley
O'connor
Nicholls
MitchellMckellar
Kingston
Harrison
Griffith
Giralang
Fyshwick
Franklin
Duntroon
Causeway
Campbell
Waramanga
Symonston
Ngunnawal
Moncrieff
Macquarie
Macgregor
Kinlyside
Gungahlin
Crestwood
Charnwood
Belconnen
Yarralumla
Weetangera
Palmerston
LetchworthOaks Estate
Narrabundah
Hmas Harman
Deakin West
Weston Creek
Swinger Hill
Jerrabomberra
Black MountainBarton H
wy
Lanyo
n Dr
Federa
l Hwy
Federal Hwy
Railway
0 1,400 2,800 4,200700
Meters1:131,593
Disclaimer: While all reasonable care has been taken to ensure the information contained on this map is up to date and accurate, thismap contains data from a number of sources - no warranty is giventhat the information contained on this map is free from error or omission. Any reliance placed on such information shall be at the sole risk of the user. Please verify the accuracy of all information prior to using it. This map is not a design document.
LEGENDACT Boundary
Offset Site Locations ¹
Last updated by: NC4747 on 12/04/2017 at 9:34
!Pinnacle Nature Reserve
!
Justice Robert Hope Park
Kenny
! Kenny Broadacre
! Throsby East
!
Throsby North
Kinlyside
!Taylor
!
Horse Park Drive North
!
Jacka
!
Isaacs Ridge
Report for
ACT Box - Gum Woodland Offset Monitoring | Parks and Conservation / Urban Reserves | 3002505
SMEC Australia | Page 2
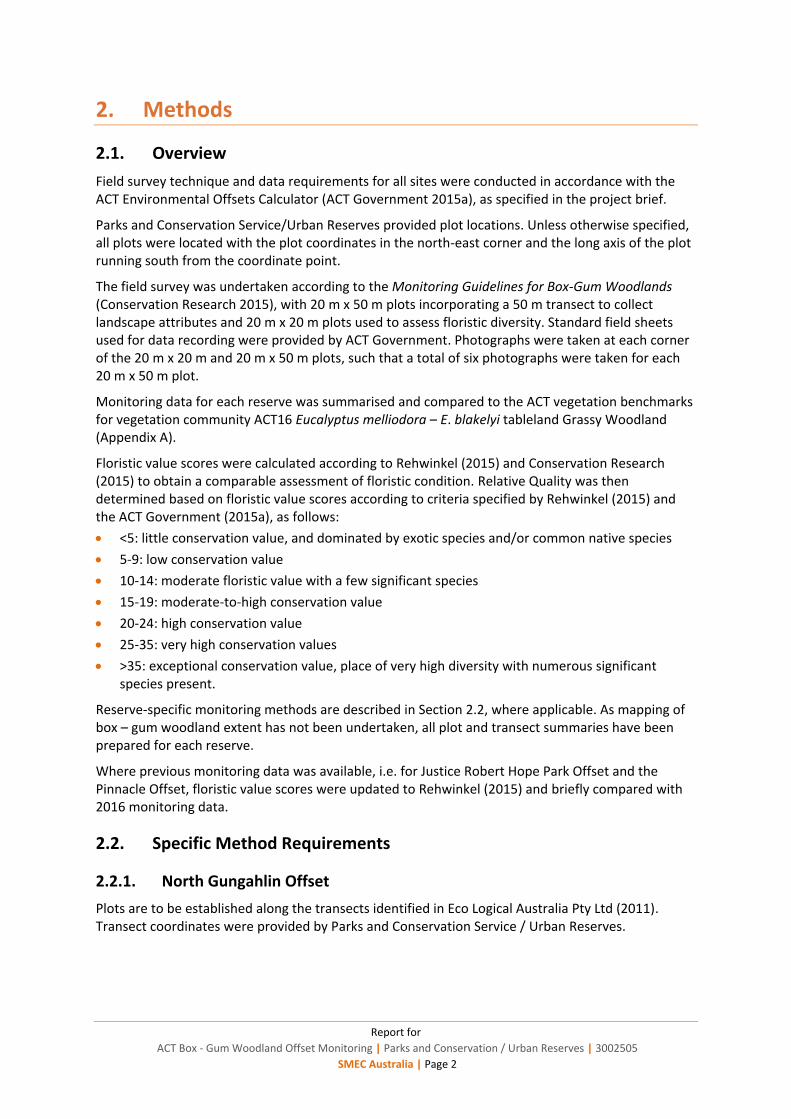
2. Methods
2.1. Overview
Field survey technique and data requirements for all sites were conducted in accordance with the ACT Environmental Offsets Calculator (ACT Government 2015a), as specified in the project brief.
Parks and Conservation Service/Urban Reserves provided plot locations. Unless otherwise specified, all plots were located with the plot coordinates in the north-east corner and the long axis of the plot running south from the coordinate point.
The field survey was undertaken according to the Monitoring Guidelines for Box-Gum Woodlands (Conservation Research 2015), with 20 m x 50 m plots incorporating a 50 m transect to collect landscape attributes and 20 m x 20 m plots used to assess floristic diversity. Standard field sheets used for data recording were provided by ACT Government. Photographs were taken at each corner of the 20 m x 20 m and 20 m x 50 m plots, such that a total of six photographs were taken for each 20 m x 50 m plot.
Monitoring data for each reserve was summarised and compared to the ACT vegetation benchmarks for vegetation community ACT16 Eucalyptus melliodora – E. blakelyi tableland Grassy Woodland (Appendix A).
Floristic value scores were calculated according to Rehwinkel (2015) and Conservation Research (2015) to obtain a comparable assessment of floristic condition. Relative Quality was then determined based on floristic value scores according to criteria specified by Rehwinkel (2015) and the ACT Government (2015a), as follows:
<5: little conservation value, and dominated by exotic species and/or common native species
5-9: low conservation value
10-14: moderate floristic value with a few significant species
15-19: moderate-to-high conservation value
20-24: high conservation value
25-35: very high conservation values
>35: exceptional conservation value, place of very high diversity with numerous significant species present.
Reserve-specific monitoring methods are described in Section 2.2, where applicable. As mapping of box – gum woodland extent has not been undertaken, all plot and transect summaries have been prepared for each reserve.
Where previous monitoring data was available, i.e. for Justice Robert Hope Park Offset and the Pinnacle Offset, floristic value scores were updated to Rehwinkel (2015) and briefly compared with 2016 monitoring data.
2.2. Specific Method Requirements
2.2.1. North Gungahlin Offset
Plots are to be established along the transects identified in Eco Logical Australia Pty Ltd (2011). Transect coordinates were provided by Parks and Conservation Service / Urban Reserves.
Report for
ACT Box - Gum Woodland Offset Monitoring | Parks and Conservation / Urban Reserves | 3002505
SMEC Australia | Page 3
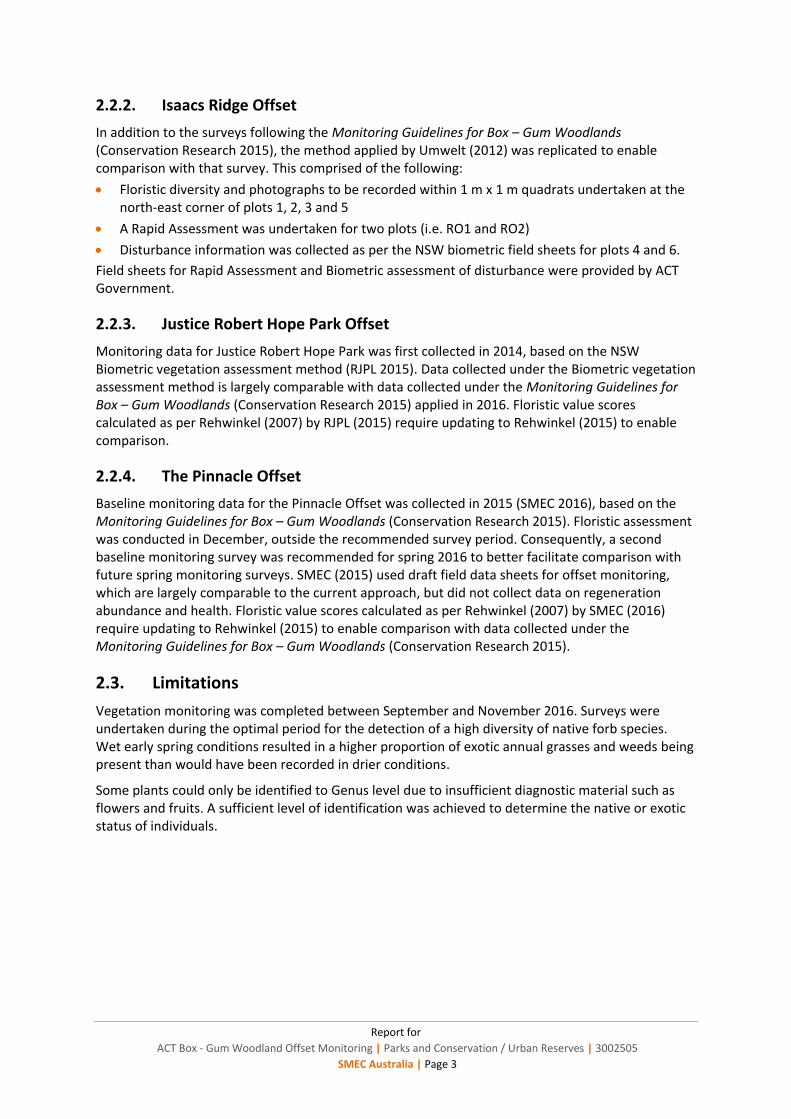
2.2.2. Isaacs Ridge Offset
In addition to the surveys following the Monitoring Guidelines for Box – Gum Woodlands (Conservation Research 2015), the method applied by Umwelt (2012) was replicated to enable comparison with that survey. This comprised of the following:
Floristic diversity and photographs to be recorded within 1 m x 1 m quadrats undertaken at the north-east corner of plots 1, 2, 3 and 5
A Rapid Assessment was undertaken for two plots (i.e. RO1 and RO2)
Disturbance information was collected as per the NSW biometric field sheets for plots 4 and 6.
Field sheets for Rapid Assessment and Biometric assessment of disturbance were provided by ACT Government.
2.2.3. Justice Robert Hope Park Offset
Monitoring data for Justice Robert Hope Park was first collected in 2014, based on the NSW Biometric vegetation assessment method (RJPL 2015). Data collected under the Biometric vegetation assessment method is largely comparable with data collected under the Monitoring Guidelines for Box – Gum Woodlands (Conservation Research 2015) applied in 2016. Floristic value scores calculated as per Rehwinkel (2007) by RJPL (2015) require updating to Rehwinkel (2015) to enable comparison.
2.2.4. The Pinnacle Offset
Baseline monitoring data for the Pinnacle Offset was collected in 2015 (SMEC 2016), based on the Monitoring Guidelines for Box – Gum Woodlands (Conservation Research 2015). Floristic assessment was conducted in December, outside the recommended survey period. Consequently, a second baseline monitoring survey was recommended for spring 2016 to better facilitate comparison with future spring monitoring surveys. SMEC (2015) used draft field data sheets for offset monitoring, which are largely comparable to the current approach, but did not collect data on regeneration abundance and health. Floristic value scores calculated as per Rehwinkel (2007) by SMEC (2016) require updating to Rehwinkel (2015) to enable comparison with data collected under the Monitoring Guidelines for Box – Gum Woodlands (Conservation Research 2015).
2.3. Limitations
Vegetation monitoring was completed between September and November 2016. Surveys were undertaken during the optimal period for the detection of a high diversity of native forb species. Wet early spring conditions resulted in a higher proportion of exotic annual grasses and weeds being present than would have been recorded in drier conditions.
Some plants could only be identified to Genus level due to insufficient diagnostic material such as flowers and fruits. A sufficient level of identification was achieved to determine the native or exotic status of individuals.
Report for
ACT Box - Gum Woodland Offset Monitoring | Parks and Conservation / Urban Reserves | 3002505
SMEC Australia | Page 4
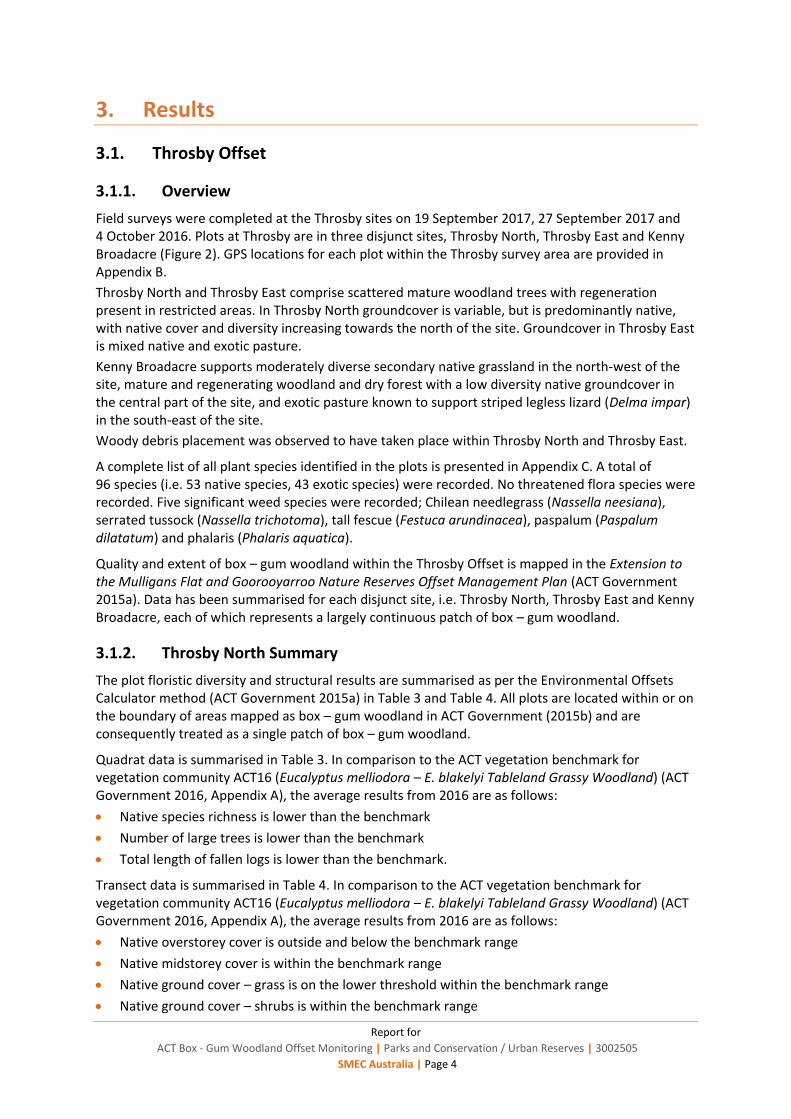
3. Results
3.1. Throsby Offset
3.1.1. Overview
Field surveys were completed at the Throsby sites on 19 September 2017, 27 September 2017 and 4 October 2016. Plots at Throsby are in three disjunct sites, Throsby North, Throsby East and Kenny Broadacre (Figure 2). GPS locations for each plot within the Throsby survey area are provided in Appendix B.
Throsby North and Throsby East comprise scattered mature woodland trees with regeneration present in restricted areas. In Throsby North groundcover is variable, but is predominantly native, with native cover and diversity increasing towards the north of the site. Groundcover in Throsby East is mixed native and exotic pasture.
Kenny Broadacre supports moderately diverse secondary native grassland in the north-west of the site, mature and regenerating woodland and dry forest with a low diversity native groundcover in the central part of the site, and exotic pasture known to support striped legless lizard (Delma impar) in the south-east of the site.
Woody debris placement was observed to have taken place within Throsby North and Throsby East.
A complete list of all plant species identified in the plots is presented in Appendix C. A total of 96 species (i.e. 53 native species, 43 exotic species) were recorded. No threatened flora species were recorded. Five significant weed species were recorded; Chilean needlegrass (Nassella neesiana), serrated tussock (Nassella trichotoma), tall fescue (Festuca arundinacea), paspalum (Paspalum dilatatum) and phalaris (Phalaris aquatica).
Quality and extent of box – gum woodland within the Throsby Offset is mapped in the Extension to the Mulligans Flat and Goorooyarroo Nature Reserves Offset Management Plan (ACT Government 2015a). Data has been summarised for each disjunct site, i.e. Throsby North, Throsby East and Kenny Broadacre, each of which represents a largely continuous patch of box – gum woodland.
3.1.2. Throsby North Summary
The plot floristic diversity and structural results are summarised as per the Environmental Offsets Calculator method (ACT Government 2015a) in Table 3 and Table 4. All plots are located within or on the boundary of areas mapped as box – gum woodland in ACT Government (2015b) and are consequently treated as a single patch of box – gum woodland.
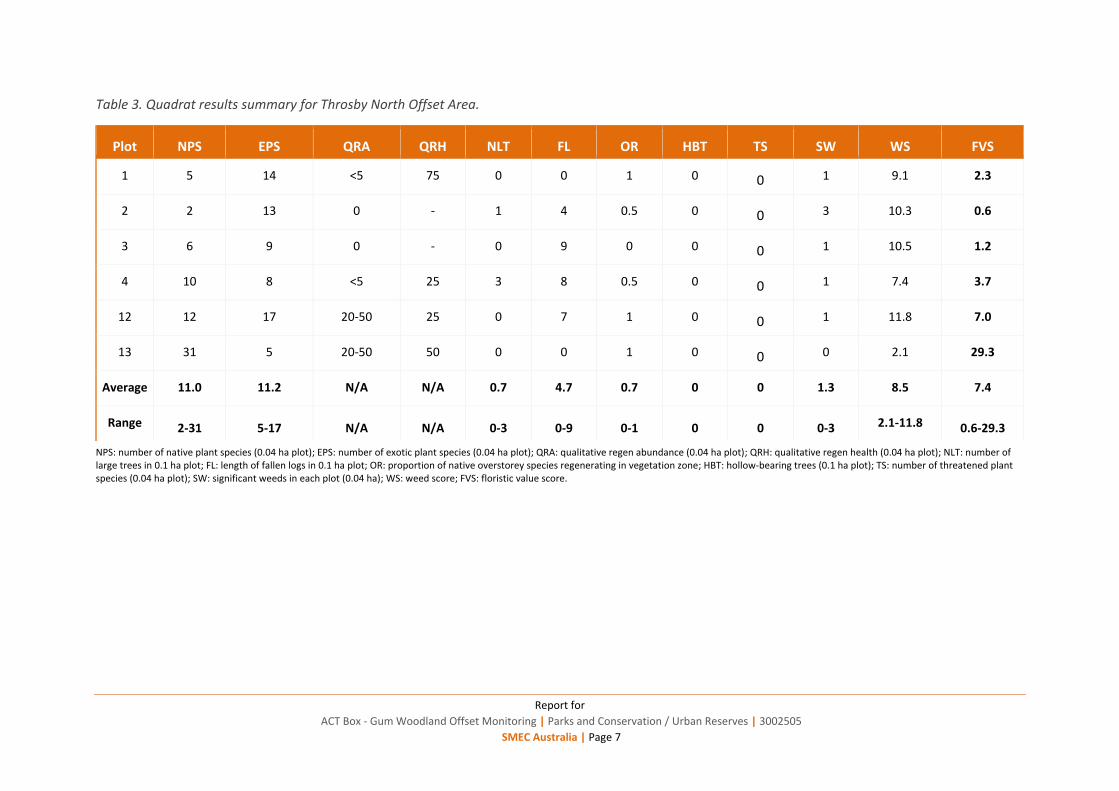
Quadrat data is summarised in Table 3. In comparison to the ACT vegetation benchmark for vegetation community ACT16 (Eucalyptus melliodora – E. blakelyi Tableland Grassy Woodland) (ACT Government 2016, Appendix A), the average results from 2016 are as follows:
Native species richness is lower than the benchmark
Number of large trees is lower than the benchmark
Total length of fallen logs is lower than the benchmark.
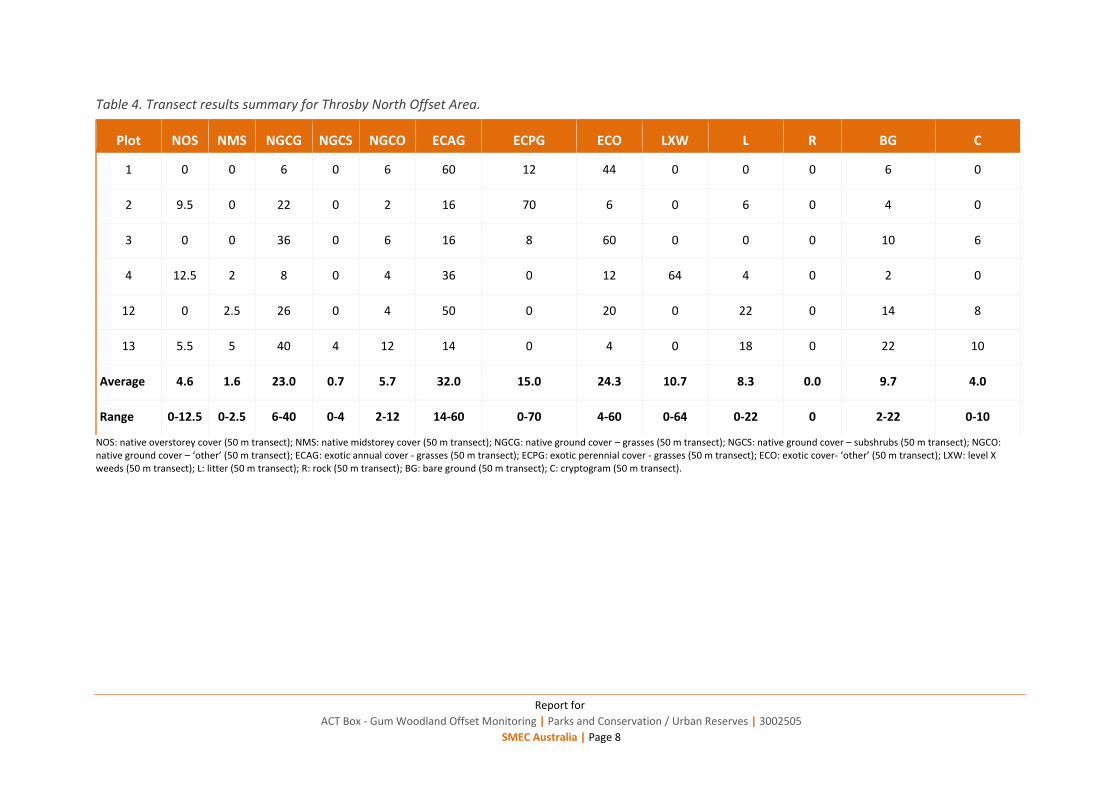
Transect data is summarised in Table 4. In comparison to the ACT vegetation benchmark for vegetation community ACT16 (Eucalyptus melliodora – E. blakelyi Tableland Grassy Woodland) (ACT Government 2016, Appendix A), the average results from 2016 are as follows:
Native overstorey cover is outside and below the benchmark range
Native midstorey cover is within the benchmark range
Native ground cover – grass is on the lower threshold within the benchmark range
Native ground cover – shrubs is within the benchmark range

Report for
ACT Box - Gum Woodland Offset Monitoring | Parks and Conservation / Urban Reserves | 3002505
SMEC Australia | Page 5
Native ground cover – other is outside and below the benchmark range.
Floristic value scores are summarised in Table 3. Throsby North Offset Area has an average floristic value score of 7.4 (N=6), which is considered to represent low conservation value. The plots at Throsby North had a floristic value score range of 0.6-29.3 (i.e. of little conservation value to very high conservation value), indicating that plots were highly variable in floristic condition.

© SMEC Australia Pty Ltd 2017. All Rights Reserved
FIGURE TITLE Throsby offset areas and plot locations. FIG NO. 2
CREATED BY N.Crook SOURCES Roadnet©actmapi/environmental_offsets: ACT GOVbasemaps/imagery2015mga: ACTMapi ©Australian Capital Territory
Location: X:\PROJECT\3002505 ACT Box Gum Woodland Mointoring\GIS\Throsby\Throsby_Overall.mxd
DATE 29/05/2017 COORDINATE SYSTEMGDA 1994 MGA Zone 55
PAGE SIZE A4
PROJECT TITLE ACT Box Gum Woodland MonitoringPROJECT NO. 3002505
_̂
_̂
_̂
_̂
_̂_̂
_̂
_̂_̂
_̂
_̂
_̂
_̂
_̂
_̂
Throsby9Throsby8
Throsby7Throsby6
Throsby5
Throsby4
Throsby3
Throsby2
Throsby1
Throsby15
Throsby14
Throsby13
Throsby12
Throsby11
Throsby101.9
7.0
0.4
0.4
3.40.7
9.92.1
0.7
3.7
1.2
0.6
2.3
15.1
29.3
Federal
Hwy
Federal H
wy
Nudurr Dr
Nullarbor Ave
Tanami St
Katoo
mba S
t
A dder S t
Mapleton Ave
Cultiva
tion St
Haven St
Osprey St
Helby St
Sapling St
Felix Ln
Majura Rd
Cedar St
Well Station Dr
Albatross Cres
Wimme
ra St
Pixie Ln
Anset
t St
Jenolan St
Kalianna St
Hecto
r McIn
tosh G
r
Putt Ln
Nimber
a St
De Bortoli
St
Koona
lda St
Adventure St
Phanto
m St
Lavender Ln
Redbank St Pildappa StCareel St
Megal
ong Cres
Dru mmer St
Sarso
n St
Ormis to
n Cct
BrumbySt
Coomera
St
Saltbush St
Farmer Pl
Butte r
f ishSt
Thunder Cct
Casilda St
Desoto StFairydale St
Wallam
an St
Cape Yo
rk St
Burbie St
Granites St
Flemin
gton R
d
Trephina St
Oberon Cl
Ida Ln
Horse Park Dr
Horse Park Dr
0 240 480 720120
Meters1:22,788
Disclaimer: While all reasonable care has been taken to ensure the information contained on this map is up to date and accurate, thismap contains data from a number of sources - no warranty is giventhat the information contained on this map is free from error or omission. Any reliance placed on such information shall be at the sole risk of the user. Please verify the accuracy of all information prior to using it. This map is not a design document.
LEGEND_̂ Plot Locations including FVS (refer to the white text)
Offset Boundary ¹
Last updated by: NC4747 on 29/05/2017 at 15:34
Throsby North
Throsby East
Kenny Broadacre
Report for
ACT Box - Gum Woodland Offset Monitoring | Parks and Conservation / Urban Reserves | 3002505
SMEC Australia | Page 7
Table 3. Quadrat results summary for Throsby North Offset Area.
NPS: number of native plant species (0.04 ha plot); EPS: number of exotic plant species (0.04 ha plot); QRA: qualitative regen abundance (0.04 ha plot); QRH: qualitative regen health (0.04 ha plot); NLT: number of large trees in 0.1 ha plot; FL: length of fallen logs in 0.1 ha plot; OR: proportion of native overstorey species regenerating in vegetation zone; HBT: hollow-bearing trees (0.1 ha plot); TS: number of threatened plant species (0.04 ha plot); SW: significant weeds in each plot (0.04 ha); WS: weed score; FVS: floristic value score.
Plot NPS EPS QRA QRH NLT FL OR HBT TS SW WS FVS
1 5 14 <5 75 0 0 1 0 0 1 9.1 2.3
2 2 13 0 - 1 4 0.5 0 0 3 10.3 0.6
3 6 9 0 - 0 9 0 0 0 1 10.5 1.2
4 10 8 <5 25 3 8 0.5 0 0 1 7.4 3.7
12 12 17 20-50 25 0 7 1 0 0 1 11.8 7.0
13 31 5 20-50 50 0 0 1 0 0 0 2.1 29.3
Average 11.0 11.2 N/A N/A 0.7 4.7 0.7 0 0 1.3 8.5 7.4
Range 2-31 5-17 N/A N/A 0-3 0-9 0-1 0 0 0-3 2.1-11.8 0.6-29.3
Report for
ACT Box - Gum Woodland Offset Monitoring | Parks and Conservation / Urban Reserves | 3002505
SMEC Australia | Page 8
Table 4. Transect results summary for Throsby North Offset Area.
NOS: native overstorey cover (50 m transect); NMS: native midstorey cover (50 m transect); NGCG: native ground cover – grasses (50 m transect); NGCS: native ground cover – subshrubs (50 m transect); NGCO: native ground cover – ‘other’ (50 m transect); ECAG: exotic annual cover - grasses (50 m transect); ECPG: exotic perennial cover - grasses (50 m transect); ECO: exotic cover- ‘other’ (50 m transect); LXW: level X weeds (50 m transect); L: litter (50 m transect); R: rock (50 m transect); BG: bare ground (50 m transect); C: cryptogram (50 m transect).
Plot NOS NMS NGCG NGCS NGCO ECAG ECPG ECO LXW L R BG C
1 0 0 6 0 6 60 12 44 0 0 0 6 0
2 9.5 0 22 0 2 16 70 6 0 6 0 4 0
3 0 0 36 0 6 16 8 60 0 0 0 10 6
4 12.5 2 8 0 4 36 0 12 64 4 0 2 0
12 0 2.5 26 0 4 50 0 20 0 22 0 14 8
13 5.5 5 40 4 12 14 0 4 0 18 0 22 10
Average 4.6 1.6 23.0 0.7 5.7 32.0 15.0 24.3 10.7 8.3 0.0 9.7 4.0
Range 0-12.5 0-2.5 6-40 0-4 2-12 14-60 0-70 4-60 0-64 0-22 0 2-22 0-10

Report for
ACT Box - Gum Woodland Offset Monitoring | Parks and Conservation / Urban Reserves | 3002505
SMEC Australia | Page 9
3.1.3. Throsby East Summary
The plot floristic diversity and structural results are summarised as per the Environmental Offsets Calculator method (ACT Government 2015a) in Table 5 and Table 6. All plots except plot 11 are located in a single continuous patch of box – gum woodland based on the management plan mapping (ACT Government 2015b). Plots are consequently compared against the vegetation benchmarks for the reserve (i.e. all plots) and the continuous woodland patch (i.e. excluding Plot 11). Plot 11 is not compared individually to vegetation benchmarks, as no benchmarks are available for exotic pasture.
Reserve summary
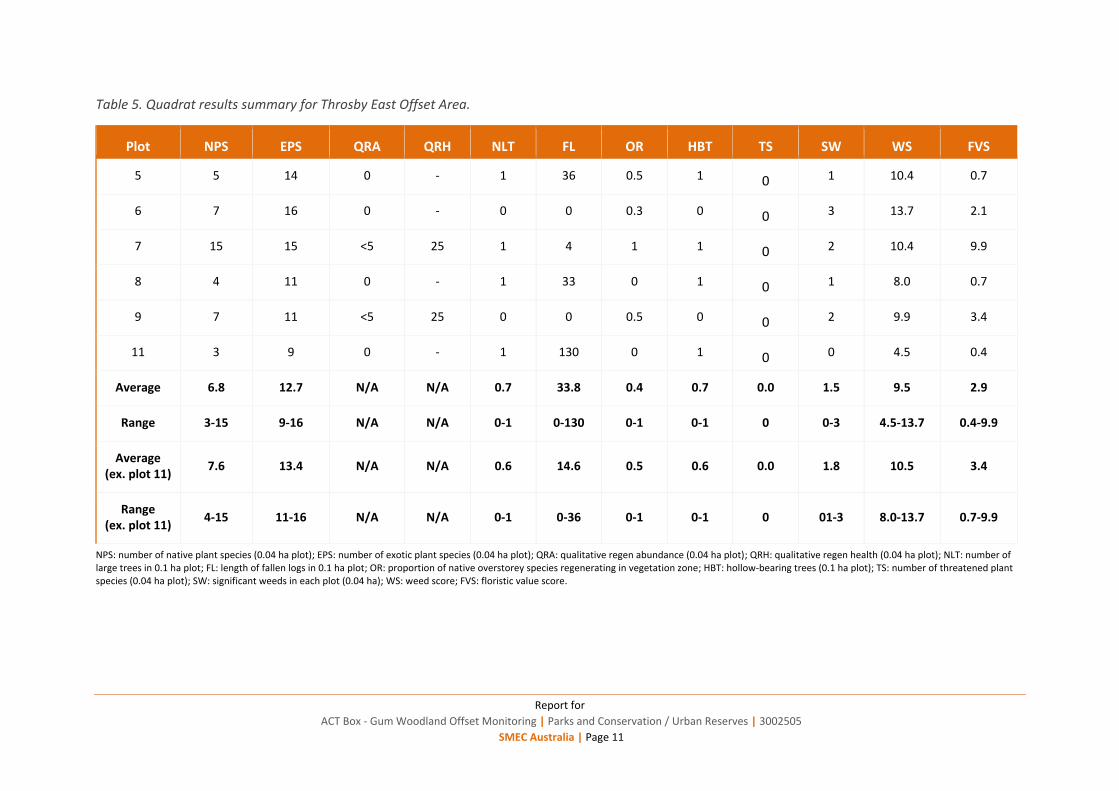
Quadrat data is summarised in Table 5 for all plots. In comparison to the ACT vegetation benchmark for vegetation community ACT16 (Eucalyptus melliodora – E. blakelyi Tableland Grassy Woodland) (ACT Government 2016, Appendix A), the average results from 2016 are as follows:
Native species richness is lower than the benchmark
Number of large trees is lower than the benchmark
Total length of fallen logs is marginally lower than the benchmark.
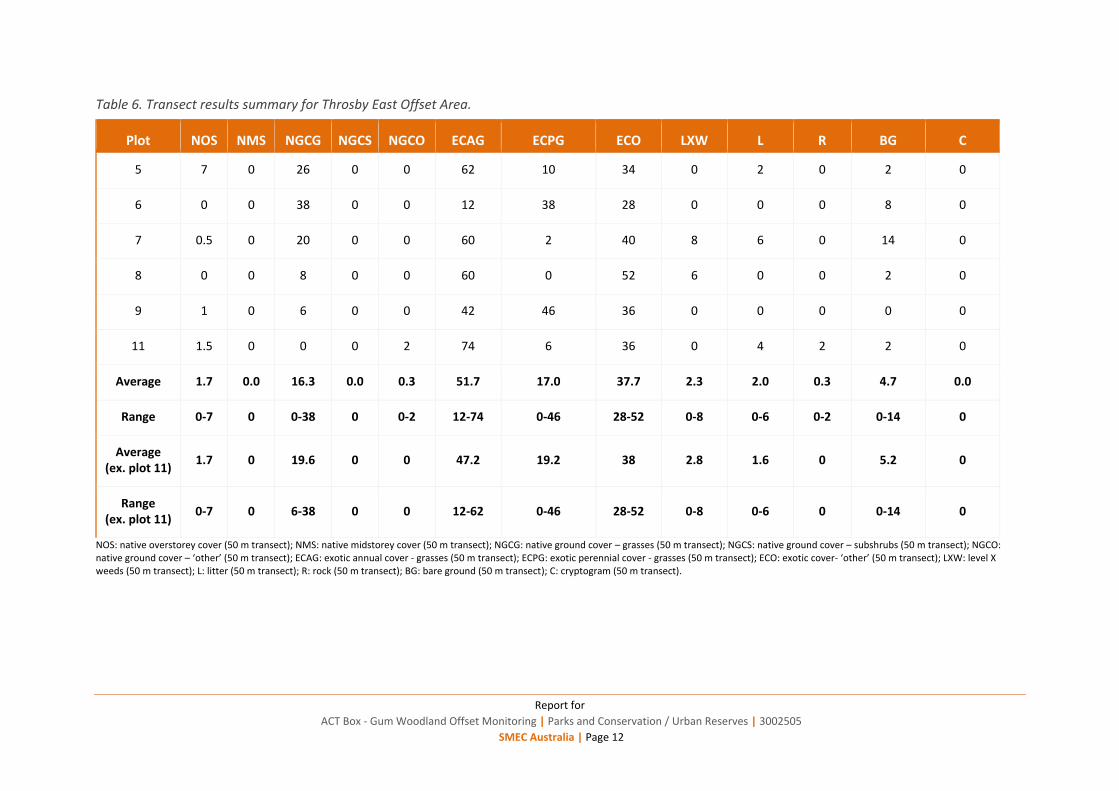
Transect data is summarised in Table 6. In comparison to the ACT vegetation benchmark for vegetation community ACT16 (Eucalyptus melliodora – E. blakelyi Tableland Grassy Woodland) (ACT Government 2016, Appendix A), the average results from 2016 are as follows:
Native overstorey cover is outside and below the benchmark range
Native midstorey cover is within the benchmark range
Native ground cover – grass is outside and below the benchmark range
Native ground cover – shrubs is within the benchmark range
Native ground cover – other is outside and below the benchmark range.
Floristic value scores for Throsby East are summarised in Table 5. Throsby East has an average floristic value score of 2.9 (N=6), indicating that most plots have little conservation value and are dominated by exotic species and/ or common native species. The range of floristic values at Throsby East was 0.4-9.9 (i.e. of little conservation value to low conservation value), indicative of a site with generally exotic or low quality native vegetation.
ACT16 – Eucalyptus melliodora – E. blakelyi Tableland Grassy Woodlands summary
Quadrat data for the woodland plots, i.e. excluding Plot 11, is summarised in Table 5. In comparison to the ACT vegetation benchmark for vegetation community ACT16 (Eucalyptus melliodora – E. blakelyi Tableland Grassy Woodland) (ACT Government 2016, , Appendix A), the average results for woodland plots from 2016 are as follows:
Native species richness is lower than the benchmark
Number of large trees is lower than the benchmark
Total length of fallen logs is lower than the benchmark.
Transect data for the woodland plots is summarised in Table 6. In comparison to the ACT vegetation benchmark for vegetation community ACT16 (Eucalyptus melliodora – E. blakelyi Tableland Grassy Woodland) (ACT Government 2016, Appendix A), the average results for the woodland plots from 2016 are as follows:
Native overstorey cover is outside and below the benchmark range
Native midstorey cover is within the benchmark range
Native ground cover – grass is outside and below the benchmark range
Native ground cover – shrubs is within the benchmark range

Report for
ACT Box - Gum Woodland Offset Monitoring | Parks and Conservation / Urban Reserves | 3002505
SMEC Australia | Page 10
Native ground cover – other is outside and below the benchmark range.
Floristic value scores for the woodland plots within Throsby East are summarised in Table 5. Woodland plots have an average floristic value score of 3.4 (N=5), indicating that most plots have little conservation value and are dominated by exotic species and/ or common native species. The range of floristic values in the woodland plots was 0.7-9.9 (i.e. of little conservation value to low conservation value), indicative of a site with generally exotic or low quality native vegetation.
Report for
ACT Box - Gum Woodland Offset Monitoring | Parks and Conservation / Urban Reserves | 3002505
SMEC Australia | Page 11
Table 5. Quadrat results summary for Throsby East Offset Area.
NPS: number of native plant species (0.04 ha plot); EPS: number of exotic plant species (0.04 ha plot); QRA: qualitative regen abundance (0.04 ha plot); QRH: qualitative regen health (0.04 ha plot); NLT: number of large trees in 0.1 ha plot; FL: length of fallen logs in 0.1 ha plot; OR: proportion of native overstorey species regenerating in vegetation zone; HBT: hollow-bearing trees (0.1 ha plot); TS: number of threatened plant species (0.04 ha plot); SW: significant weeds in each plot (0.04 ha); WS: weed score; FVS: floristic value score.
Plot NPS EPS QRA QRH NLT FL OR HBT TS SW WS FVS
5 5 14 0 - 1 36 0.5 1 0 1 10.4 0.7
6 7 16 0 - 0 0 0.3 0 0 3 13.7 2.1
7 15 15 <5 25 1 4 1 1 0 2 10.4 9.9
8 4 11 0 - 1 33 0 1 0 1 8.0 0.7
9 7 11 <5 25 0 0 0.5 0 0 2 9.9 3.4
11 3 9 0 - 1 130 0 1 0 0 4.5 0.4
Average 6.8 12.7 N/A N/A 0.7 33.8 0.4 0.7 0.0 1.5 9.5 2.9
Range 3-15 9-16 N/A N/A 0-1 0-130 0-1 0-1 0 0-3 4.5-13.7 0.4-9.9
Average (ex. plot 11)
7.6 13.4 N/A N/A 0.6 14.6 0.5 0.6 0.0 1.8 10.5 3.4
Range (ex. plot 11)
4-15 11-16 N/A N/A 0-1 0-36 0-1 0-1 0 01-3 8.0-13.7 0.7-9.9
Report for
ACT Box - Gum Woodland Offset Monitoring | Parks and Conservation / Urban Reserves | 3002505
SMEC Australia | Page 12
Table 6. Transect results summary for Throsby East Offset Area.
NOS: native overstorey cover (50 m transect); NMS: native midstorey cover (50 m transect); NGCG: native ground cover – grasses (50 m transect); NGCS: native ground cover – subshrubs (50 m transect); NGCO: native ground cover – ‘other’ (50 m transect); ECAG: exotic annual cover - grasses (50 m transect); ECPG: exotic perennial cover - grasses (50 m transect); ECO: exotic cover- ‘other’ (50 m transect); LXW: level X weeds (50 m transect); L: litter (50 m transect); R: rock (50 m transect); BG: bare ground (50 m transect); C: cryptogram (50 m transect).
Plot NOS NMS NGCG NGCS NGCO ECAG ECPG ECO LXW L R BG C
5 7 0 26 0 0 62 10 34 0 2 0 2 0
6 0 0 38 0 0 12 38 28 0 0 0 8 0
7 0.5 0 20 0 0 60 2 40 8 6 0 14 0
8 0 0 8 0 0 60 0 52 6 0 0 2 0
9 1 0 6 0 0 42 46 36 0 0 0 0 0
11 1.5 0 0 0 2 74 6 36 0 4 2 2 0
Average 1.7 0.0 16.3 0.0 0.3 51.7 17.0 37.7 2.3 2.0 0.3 4.7 0.0
Range 0-7 0 0-38 0 0-2 12-74 0-46 28-52 0-8 0-6 0-2 0-14 0
Average (ex. plot 11)
1.7 0 19.6 0 0 47.2 19.2 38 2.8 1.6 0 5.2 0
Range (ex. plot 11)
0-7 0 6-38 0 0 12-62 0-46 28-52 0-8 0-6 0 0-14 0
Report for
ACT Box - Gum Woodland Offset Monitoring | Parks and Conservation / Urban Reserves | 3002505
SMEC Australia | Page 13
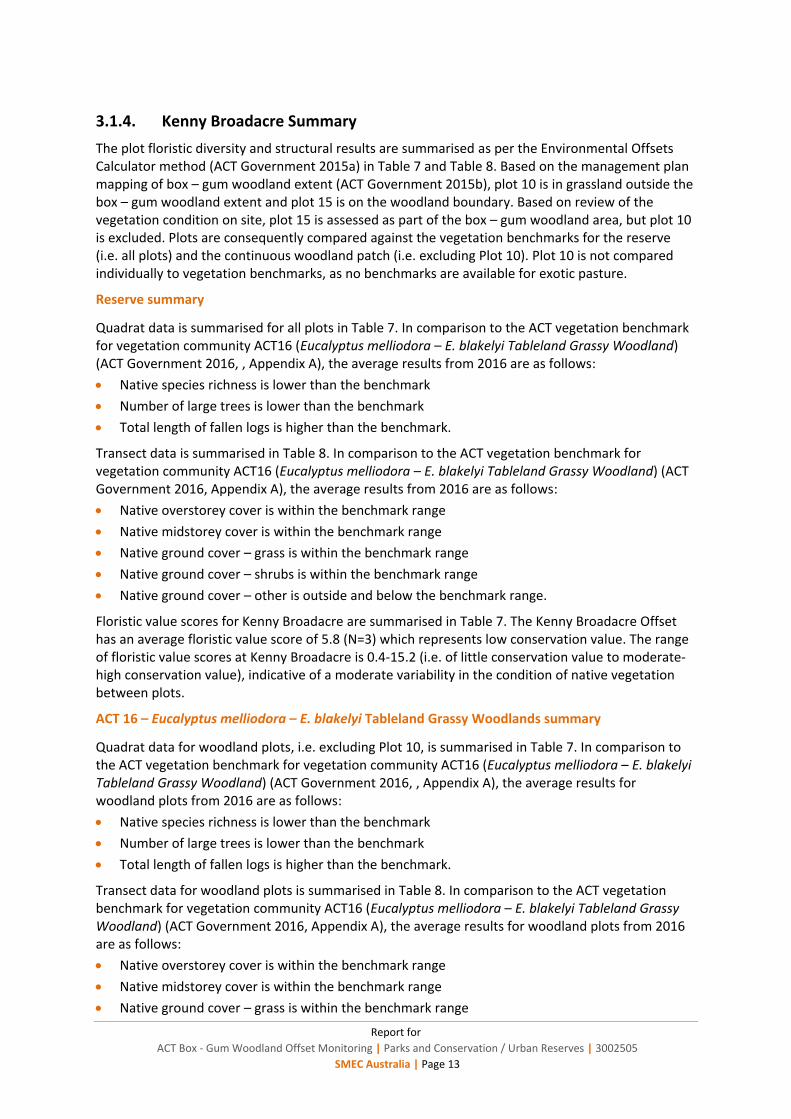
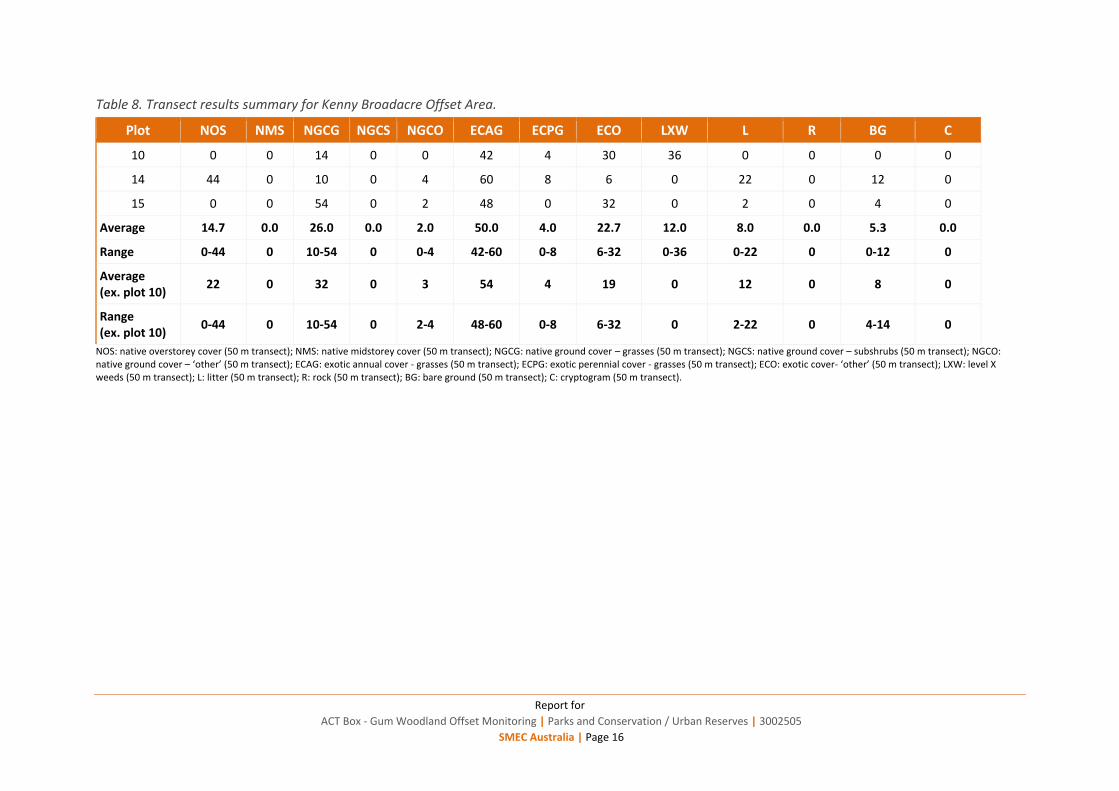
3.1.4. Kenny Broadacre Summary
The plot floristic diversity and structural results are summarised as per the Environmental Offsets Calculator method (ACT Government 2015a) in Table 7 and Table 8. Based on the management plan mapping of box – gum woodland extent (ACT Government 2015b), plot 10 is in grassland outside the box – gum woodland extent and plot 15 is on the woodland boundary. Based on review of the vegetation condition on site, plot 15 is assessed as part of the box – gum woodland area, but plot 10 is excluded. Plots are consequently compared against the vegetation benchmarks for the reserve (i.e. all plots) and the continuous woodland patch (i.e. excluding Plot 10). Plot 10 is not compared individually to vegetation benchmarks, as no benchmarks are available for exotic pasture.
Reserve summary
Quadrat data is summarised for all plots in Table 7. In comparison to the ACT vegetation benchmark for vegetation community ACT16 (Eucalyptus melliodora – E. blakelyi Tableland Grassy Woodland) (ACT Government 2016, , Appendix A), the average results from 2016 are as follows:
Native species richness is lower than the benchmark
Number of large trees is lower than the benchmark
Total length of fallen logs is higher than the benchmark.
Transect data is summarised in Table 8. In comparison to the ACT vegetation benchmark for vegetation community ACT16 (Eucalyptus melliodora – E. blakelyi Tableland Grassy Woodland) (ACT Government 2016, Appendix A), the average results from 2016 are as follows:
Native overstorey cover is within the benchmark range
Native midstorey cover is within the benchmark range
Native ground cover – grass is within the benchmark range
Native ground cover – shrubs is within the benchmark range
Native ground cover – other is outside and below the benchmark range.
Floristic value scores for Kenny Broadacre are summarised in Table 7. The Kenny Broadacre Offset has an average floristic value score of 5.8 (N=3) which represents low conservation value. The range of floristic value scores at Kenny Broadacre is 0.4-15.2 (i.e. of little conservation value to moderate-high conservation value), indicative of a moderate variability in the condition of native vegetation between plots.
ACT 16 – Eucalyptus melliodora – E. blakelyi Tableland Grassy Woodlands summary
Quadrat data for woodland plots, i.e. excluding Plot 10, is summarised in Table 7. In comparison to the ACT vegetation benchmark for vegetation community ACT16 (Eucalyptus melliodora – E. blakelyi Tableland Grassy Woodland) (ACT Government 2016, , Appendix A), the average results for woodland plots from 2016 are as follows:
Native species richness is lower than the benchmark
Number of large trees is lower than the benchmark
Total length of fallen logs is higher than the benchmark.
Transect data for woodland plots is summarised in Table 8. In comparison to the ACT vegetation benchmark for vegetation community ACT16 (Eucalyptus melliodora – E. blakelyi Tableland Grassy Woodland) (ACT Government 2016, Appendix A), the average results for woodland plots from 2016 are as follows:
Native overstorey cover is within the benchmark range
Native midstorey cover is within the benchmark range
Native ground cover – grass is within the benchmark range

Report for
ACT Box - Gum Woodland Offset Monitoring | Parks and Conservation / Urban Reserves | 3002505
SMEC Australia | Page 14
Native ground cover – shrubs is within the benchmark range
Native ground cover – other is outside and below the benchmark range.
Floristic value scores for woodland plots at Kenny Broadacre are summarised in Table 7. The woodland plots have an average floristic value score of 8.5 (N=2) which represents low conservation value. The range of floristic value scores in the woodland plots is 1.9-15.1 (i.e. of little conservation value to moderate-high conservation value), indicative of a moderate variability in the condition of native vegetation between plots.

Report for
ACT Box - Gum Woodland Offset Monitoring | Parks and Conservation / Urban Reserves | 3002505
SMEC Australia | Page 15
Table 7. Quadrat results summary for Kenny Broadacre Offset Area.
NPS: number of native plant species (0.04 ha plot); EPS: number of exotic plant species (0.04 ha plot); QRA: qualitative regen abundance (0.04 ha plot); QRH: qualitative regen health (0.04 ha plot); NLT: number of large trees in 0.1 ha plot; FL: length of fallen logs in 0.1 ha plot; OR: proportion of native overstorey species regenerating in vegetation zone; HBT: hollow-bearing trees (0.1 ha plot); TS: number of threatened plant species (0.04 ha plot); SW: significant weeds in each plot (0.04 ha); WS: weed score; FVS: floristic value score.
Plot NPS EPS QRA QRH NLT FL OR HBT TS SW SW FVS
10 2 14 0 - 0 0 0 0 0 3 13.0 0.4
14 6 11 0 - 3 198 1 2 0 2 10.2 1.9
15 16 8 20-50 25 0 0 1 0 0 0 4.5 15.1
Average 8.0 11.0 N/A N/A 1.0 66.0 0.7 0.7 0.0 1.7 9.3 5.8
Range 2-16 8-14 N/A N/A 0-3 0-198 0-1 0-2 0 0-3 4.5-13.0 0.4-15.2
Average (ex. plot 10)
11.0 9.5 N/A N/A 1.5 99.0 1.0 1.0 0.0 1.0 7.4 8.5
Range (ex. plot 10)
6-16 8-88 N/A N/A 0-3 0-198 1-1 0-2 0 0-2 4.5-10.2 1.9-15.1
Report for
ACT Box - Gum Woodland Offset Monitoring | Parks and Conservation / Urban Reserves | 3002505
SMEC Australia | Page 16
Table 8. Transect results summary for Kenny Broadacre Offset Area.
Plot NOS NMS NGCG NGCS NGCO ECAG ECPG ECO LXW L R BG C
10 0 0 14 0 0 42 4 30 36 0 0 0 0
14 44 0 10 0 4 60 8 6 0 22 0 12 0
15 0 0 54 0 2 48 0 32 0 2 0 4 0
Average 14.7 0.0 26.0 0.0 2.0 50.0 4.0 22.7 12.0 8.0 0.0 5.3 0.0
Range 0-44 0 10-54 0 0-4 42-60 0-8 6-32 0-36 0-22 0 0-12 0
Average (ex. plot 10)
22 0 32 0 3 54 4 19 0 12 0 8 0
Range (ex. plot 10)
0-44 0 10-54 0 2-4 48-60 0-8 6-32 0 2-22 0 4-14 0
NOS: native overstorey cover (50 m transect); NMS: native midstorey cover (50 m transect); NGCG: native ground cover – grasses (50 m transect); NGCS: native ground cover – subshrubs (50 m transect); NGCO: native ground cover – ‘other’ (50 m transect); ECAG: exotic annual cover - grasses (50 m transect); ECPG: exotic perennial cover - grasses (50 m transect); ECO: exotic cover- ‘other’ (50 m transect); LXW: level X weeds (50 m transect); L: litter (50 m transect); R: rock (50 m transect); BG: bare ground (50 m transect); C: cryptogram (50 m transect).
Report for
ACT Box - Gum Woodland Offset Monitoring | Parks and Conservation / Urban Reserves | 3002505
SMEC Australia | Page 17
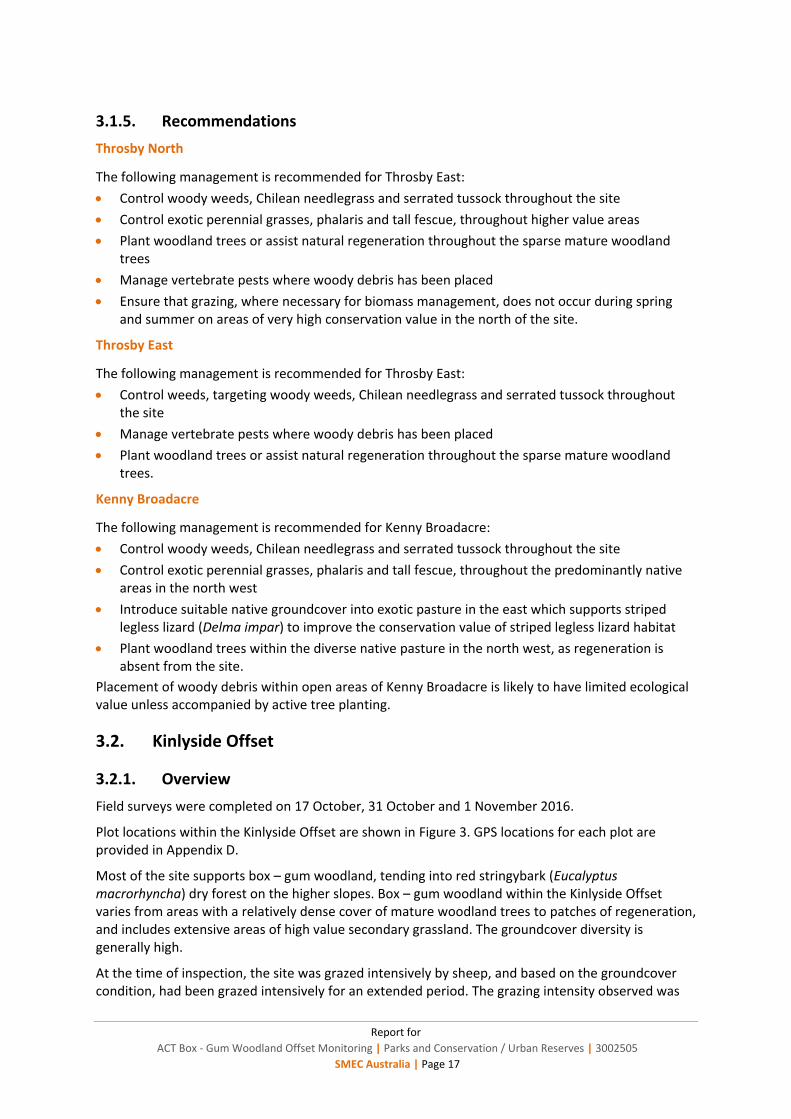
3.1.5. Recommendations
Throsby North
The following management is recommended for Throsby East:
Control woody weeds, Chilean needlegrass and serrated tussock throughout the site
Control exotic perennial grasses, phalaris and tall fescue, throughout higher value areas
Plant woodland trees or assist natural regeneration throughout the sparse mature woodland trees
Manage vertebrate pests where woody debris has been placed
Ensure that grazing, where necessary for biomass management, does not occur during spring and summer on areas of very high conservation value in the north of the site.
Throsby East
The following management is recommended for Throsby East:
Control weeds, targeting woody weeds, Chilean needlegrass and serrated tussock throughout the site
Manage vertebrate pests where woody debris has been placed
Plant woodland trees or assist natural regeneration throughout the sparse mature woodland trees.
Kenny Broadacre
The following management is recommended for Kenny Broadacre:
Control woody weeds, Chilean needlegrass and serrated tussock throughout the site
Control exotic perennial grasses, phalaris and tall fescue, throughout the predominantly native areas in the north west
Introduce suitable native groundcover into exotic pasture in the east which supports striped legless lizard (Delma impar) to improve the conservation value of striped legless lizard habitat
Plant woodland trees within the diverse native pasture in the north west, as regeneration is absent from the site.
Placement of woody debris within open areas of Kenny Broadacre is likely to have limited ecological value unless accompanied by active tree planting.
3.2. Kinlyside Offset
3.2.1. Overview
Field surveys were completed on 17 October, 31 October and 1 November 2016.
Plot locations within the Kinlyside Offset are shown in Figure 3. GPS locations for each plot are provided in Appendix D.
Most of the site supports box – gum woodland, tending into red stringybark (Eucalyptus macrorhyncha) dry forest on the higher slopes. Box – gum woodland within the Kinlyside Offset varies from areas with a relatively dense cover of mature woodland trees to patches of regeneration, and includes extensive areas of high value secondary grassland. The groundcover diversity is generally high.
At the time of inspection, the site was grazed intensively by sheep, and based on the groundcover condition, had been grazed intensively for an extended period. The grazing intensity observed was

Report for
ACT Box - Gum Woodland Offset Monitoring | Parks and Conservation / Urban Reserves | 3002505
SMEC Australia | Page 18
considered by assessors to be incompatible with maintaining the existing high groundcover diversity, and under the current management practices, groundcover condition is likely to decline.
A complete list of all plant species identified in the plots and abundance scores is presented in Appendix E. A total of 33 native species and 40 exotic species were recorded.
No threatened flora species were recorded. Two significant weed species; serrated tussock and phalaris, were recorded in the plots.
The site was heavily grazed by sheep at the time of inspection. The grazing intensity observed is unlikely to favour maintaining a high diversity understorey if sustained over long periods.
The Kinlyside Nature Reserve and Offset Area Offset Management Plan (ACT Government 2015c) includes mapping of the extent and quality of box – gum woodland within the offset site. All plots except plot 11 are within the box – gum woodland climax community based on Figure 6 of the Kinlyside Nature Reserve and Offset Area Offset Management Plan (ACT Government 2015c). Plots 1, 4 and 10, are considered to be part of the continuous woodland patch, being located in areas mapped as non-EPBC box – gum woodland but having moderate to very high conservation value. Plots are consequently compared against the vegetation benchmarks for ACT16 (Eucalyptus melliodora – E. blakelyi Tableland Grassy Woodland) (ACT Government 2016, Appendix A) for the rntire reserve and the woodland patch (i.e. excluding Plot 11). Plot 11 is assessed against vegetation benchmarks for ACT25 - Eucalyptus macrorhyncha Tableland Grass / Shrub Forest.
The offset boundary on ACTMAPi is inconsistent with the offset boundary identified in the management plan (ACT Government 2015).
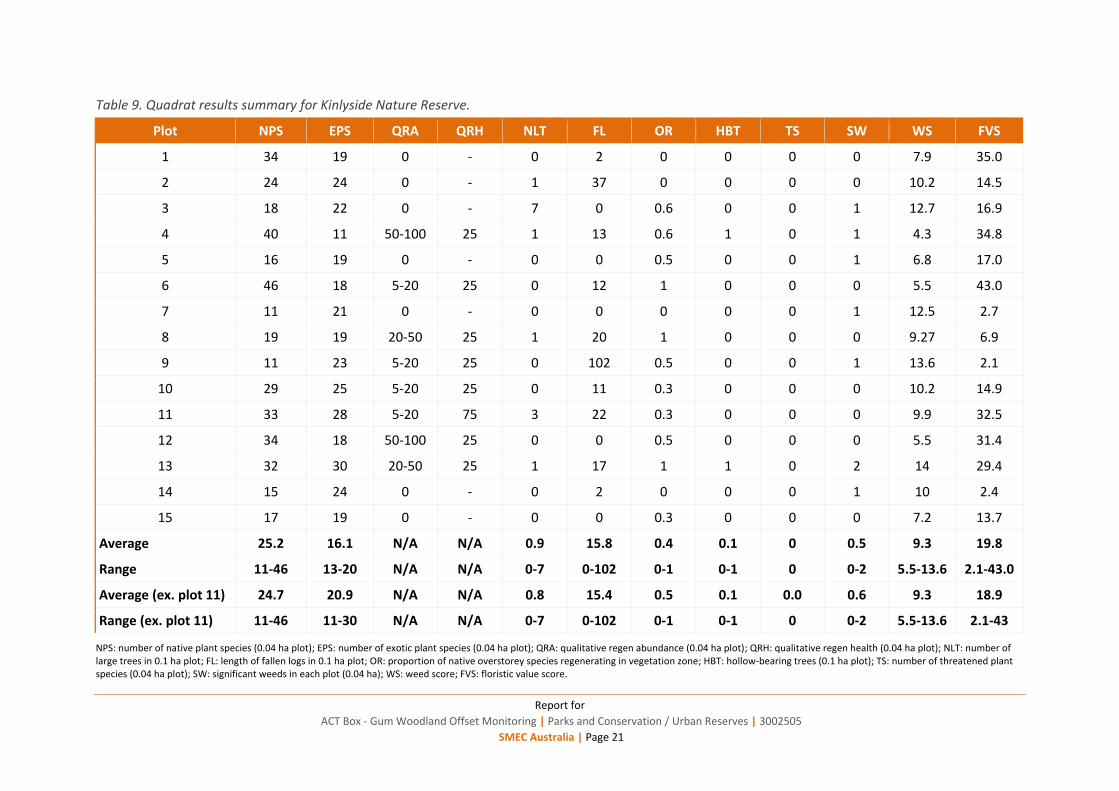
3.2.2. Kinlyside Offset Summary
The plot floristic diversity and structural results are summarised, as per the Environmental Offsets Calculator method (ACT Government 2015a), in Table 9 and Table 10.
Reserve summary
Quadrat data is summarised for all plots in Table 9. In comparison to the ACT vegetation benchmark for vegetation community ACT16 (Eucalyptus melliodora – E. blakelyi Tableland Grassy Woodland) (ACT Government 2016, Appendix A), the average results from 2016 are as follows:
Native species richness is lower than the benchmark
Number of large trees is lower than the benchmark
Total length of fallen logs is lower than the benchmark.
Transect data is summarised for all plots in Table 10. In comparison to the ACT vegetation benchmark for vegetation community ACT16 (Eucalyptus melliodora – E. blakelyi Tableland Grassy Woodland) (ACT Government 2016), the average results from 2016 are as follows:
Native overstorey cover is outside and lower than the benchmark range
Native midstorey cover is within the benchmark range
Native ground cover – grass is within the benchmark range
Native ground cover – shrubs is within the benchmark range
Native ground cover – other is outside and greater than the benchmark range.
Floristic value scores are summarised in Table 9. Kinlyside Offset has an average floristic value score of 19.8 (N=15) indicating that the average floristic condition of the site is moderate to high. The floristic value scores of the plots range between 2.1-43.0 (i.e. of little conservation value to exceptional conservation value), indicating that, while there is substantial variation in floristic condition at the site, the majority of plots are in good condition.

Report for
ACT Box - Gum Woodland Offset Monitoring | Parks and Conservation / Urban Reserves | 3002505
SMEC Australia | Page 19
ACT 16 – Eucalyptus melliodora – E. blakelyi Tableland Grassy Woodlands summary
Quadrat data for woodland plots, i.e. excluding Plot 11, is summarised in Table 9. In comparison to the ACT vegetation benchmark for vegetation community ACT16 (Eucalyptus melliodora – E. blakelyi Tableland Grassy Woodland) (ACT Government 2016, Appendix A), the average results from 2016 are as follows:
Native species richness is lower than the benchmark
Number of large trees is lower than the benchmark
Total length of fallen logs is lower than the benchmark.
Transect data for woodland plots is summarised in Table 10. In comparison to the ACT vegetation benchmark for vegetation community ACT16 (Eucalyptus melliodora – E. blakelyi Tableland Grassy Woodland) (ACT Government 2016), the average results from 2016 are as follows:
Native overstorey cover is outside and below the benchmark range
Native midstorey cover is within the benchmark range
Native ground cover – grass is within the benchmark range
Native ground cover – shrubs is within the benchmark range
Native ground cover – other is outside and greater than the benchmark range.
Floristic value scores are summarised for woodland plots at the Kinlyside Offset in Table 9. The woodland plots an average floristic value score of 18.9 (N=14) indicating that the average floristic condition of the site is moderate to high. The floristic value scores of the plots range between 2.1-43.0 (i.e. of little conservation value to exceptional conservation value), indicating that, while there is substantial variation in floristic condition at the site, the majority of plots are in good condition.
ACT25 - Eucalyptus macrorhyncha Tableland Grass / Shrub Forest Summary
Quadrat data for plot 11 is summarised in Table 26. In comparison to the ACT vegetation benchmark for vegetation community ACT25 - Eucalyptus macrorhyncha Tableland Grass / Shrub Forest (ACT Government 2016, Appendix A), the average results from 2016 are as follows:
Native species richness is higher than the benchmark
Number of large trees is lower than the benchmark
Total length of fallen logs is lower than the benchmark.
Transect data for plot 11 is summarised in Table 27. In comparison to the ACT vegetation benchmark for vegetation community ACT25 - Eucalyptus macrorhyncha Tableland Grass / Shrub Forest (ACT Government 2016), the average results from 2016 are as follows:
Native overstorey cover is outside and below the benchmark range
Native midstorey cover is outside and below the benchmark range
Native ground cover – grass is within the benchmark range
Native ground cover – shrubs is outside and below the benchmark range
Native ground cover – other is outside and above the benchmark range.
Floristic value scores for plot 11 in the Pinnacle Offset is 32.5, which indicates very high conservation value. The groundcover characteristics in this area are a combination of dry forest characteristics (i.e. shrubby) and grassy woodland characteristics (i.e. high cover and diversity of native grasses and forbs). This variability is most likely to be due to historical clearing of the dry forest, which has created conditions closer to a grassy woodland and therefore favouring a diverse grassy understorey.
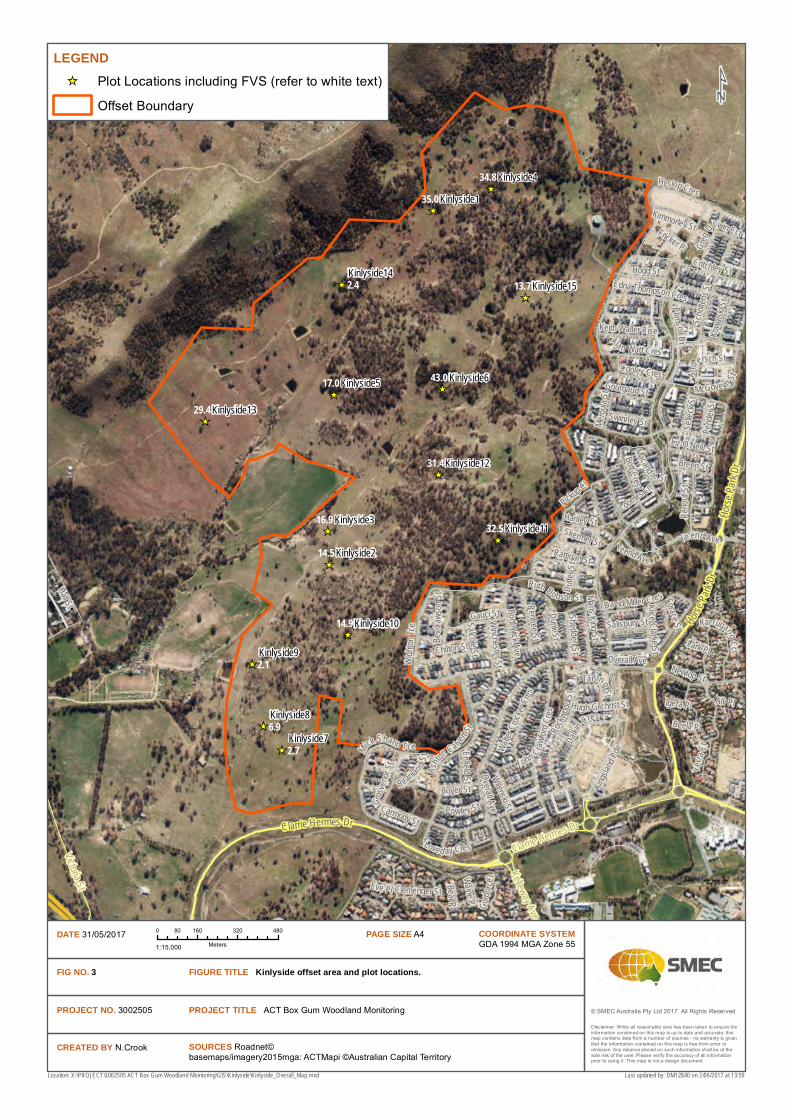
© SMEC Australia Pty Ltd 2017. All Rights Reserved
FIGURE TITLE Kinlyside offset area and plot locations. FIG NO. 3
CREATED BY N.Crook SOURCES Roadnet©basemaps/imagery2015mga: ACTMapi ©Australian Capital Territory
Location: X:\PROJECT\3002505 ACT Box Gum Woodland Mointoring\GIS\Kinlyside\Kinlyside_Overall_Map.mxd
DATE 31/05/2017 COORDINATE SYSTEMGDA 1994 MGA Zone 55
PAGE SIZE A4
PROJECT TITLE ACT Box Gum Woodland MonitoringPROJECT NO. 3002505
_̂
_̂
_̂
_̂
_̂ _̂
_̂
_̂
_̂
_̂
_̂
_̂
_̂
_̂_̂
Kinlyside9
Kinlyside8Kinlyside7
Kinlyside6Kinlyside5
Kinlyside4
Kinlyside3
Kinlyside2
Kinlyside1
Kinlyside15Kinlyside14
Kinlyside13
Kinlyside12
Kinlyside11
Kinlyside10
2.4
2.1
6.92.7
13.7
29.4
31.4
32.5
14.9
43.017.0
34.8
16.9
14.5
35.0
Plimsoll D r
Hall St
Rockw
oodSt
Overall Ave
Ashton Ca lver
t St
Carmody St
Scholte
ns St
Chilton St
Wighto
n Tce
Bott Cres
Dalkin
Cres
Gauci St Borthwick Ave
Hanley St
Critchley St
Renou
f St
Winchester St
McGover n St
Ruth Do bson St
John Crawford
Cres
Bev L
awson
St
Hogg St
Rattigan St
Hyslop Cres
Renfree St
Kingsla
nd Pde
Cooley CresGro
svenor
St
David Miller Cres
Breen St
Boyer St
Liz O'Neill St
Powley St
Yerra
Ct
Dunk St
Mick Shann Tce
Ala n Watt Cres
Sellec
k St
Skermer St
Gourgaud St
Shedden St
Keith Waller Rise
Clemenger St
Wilenski St
KarrugangCct
Kowals
ki St
Newlop St
Swinney St
Kimmorley St
Andersch St
Walter
Crock
er Cres
Pende
r St
Loomes Ln
Enfield St
Pickup Cl
Merou
la St
B eanlan d St
Eve Pl
Salisbury St
TarlingSt
Forace St
Macand i e St
Alli Pl
Al ice Cl ar keS t
SalcoleSt
Fricker Pl
Loved ay Cres
Yeend AveDu
lferSt
Hugh Gilchrist St
Edna Thompson Cres
Greg U
rwin Cct
Lark Pl
Gordo
n Cl
Maris King St
Beela Pl
Beal Pl
Igera Pl
Waine Pl
Yeend Ave
Overall Ave
Victoria St
Kelleway Ave
Clarrie Hermes DrClarrie Hermes Dr
Horse
Park D
rHo
rse Pa
rk Dr
0 160 320 48080
Meters1:15,000
Disclaimer: While all reasonable care has been taken to ensure the information contained on this map is up to date and accurate, thismap contains data from a number of sources - no warranty is giventhat the information contained on this map is free from error or omission. Any reliance placed on such information shall be at the sole risk of the user. Please verify the accuracy of all information prior to using it. This map is not a design document.
LEGEND_̂ Plot Locations including FVS (refer to white text)
Offset Boundary ¹
Last updated by: DM12840 on 2/06/2017 at 13:59
Report for
ACT Box - Gum Woodland Offset Monitoring | Parks and Conservation / Urban Reserves | 3002505
SMEC Australia | Page 21
Table 9. Quadrat results summary for Kinlyside Nature Reserve.
Plot NPS EPS QRA QRH NLT FL OR HBT TS SW WS FVS
1 34 19 0 - 0 2 0 0 0 0 7.9 35.0
2 24 24 0 - 1 37 0 0 0 0 10.2 14.5
3 18 22 0 - 7 0 0.6 0 0 1 12.7 16.9
4 40 11 50-100 25 1 13 0.6 1 0 1 4.3 34.8
5 16 19 0 - 0 0 0.5 0 0 1 6.8 17.0
6 46 18 5-20 25 0 12 1 0 0 0 5.5 43.0
7 11 21 0 - 0 0 0 0 0 1 12.5 2.7
8 19 19 20-50 25 1 20 1 0 0 0 9.27 6.9
9 11 23 5-20 25 0 102 0.5 0 0 1 13.6 2.1
10 29 25 5-20 25 0 11 0.3 0 0 0 10.2 14.9
11 33 28 5-20 75 3 22 0.3 0 0 0 9.9 32.5
12 34 18 50-100 25 0 0 0.5 0 0 0 5.5 31.4
13 32 30 20-50 25 1 17 1 1 0 2 14 29.4
14 15 24 0 - 0 2 0 0 0 1 10 2.4
15 17 19 0 - 0 0 0.3 0 0 0 7.2 13.7
Average 25.2 16.1 N/A N/A 0.9 15.8 0.4 0.1 0 0.5 9.3 19.8
Range 11-46 13-20 N/A N/A 0-7 0-102 0-1 0-1 0 0-2 5.5-13.6 2.1-43.0
Average (ex. plot 11) 24.7 20.9 N/A N/A 0.8 15.4 0.5 0.1 0.0 0.6 9.3 18.9
Range (ex. plot 11) 11-46 11-30 N/A N/A 0-7 0-102 0-1 0-1 0 0-2 5.5-13.6 2.1-43
NPS: number of native plant species (0.04 ha plot); EPS: number of exotic plant species (0.04 ha plot); QRA: qualitative regen abundance (0.04 ha plot); QRH: qualitative regen health (0.04 ha plot); NLT: number of large trees in 0.1 ha plot; FL: length of fallen logs in 0.1 ha plot; OR: proportion of native overstorey species regenerating in vegetation zone; HBT: hollow-bearing trees (0.1 ha plot); TS: number of threatened plant species (0.04 ha plot); SW: significant weeds in each plot (0.04 ha); WS: weed score; FVS: floristic value score.

Report for
ACT Box - Gum Woodland Offset Monitoring | Parks and Conservation / Urban Reserves | 3002505
SMEC Australia | Page 22
Table 10. Transect results summary for Kinlyside Nature Reserve.
Plot NOS NMS NGCG NGCS NGCO ECAG ECPG ECO LXW L R BG C
1 0 0 54 0 64 10 4 34 0 6 0 2 2
2 0 0 24 0 40 50 12 48 0 8 2 6 2
3 6 0 58 0 28 12 6 42 8 20 0 2 0
4 10 1.5 66 0 30 6 24 12 2 40 0 2 0
5 0 0 74 0 36 56 0 32 0 0 0 4 0
6 8 0 44 0 34 38 0 16 0 38 10 6 6
7 0 0 20 0 24 50 4 76 0 0 0 0 0
8 0.2 0 12 0 12 60 12 50 0 18 0 0 0
9 0 0 12 0 40 28 12 88 16 2 0 10 0
10 5.5 0 36 0 18 70 8 18 0 22 6 2 6
11 8.5 0.5 28 0 16 60 10 30 0 30 2 10 2
12 0 7.5 36 0 32 64 0 22 0 46 0 2 0
13 0.5 0.5 82 0 12 42 0 18 0 6 0 2 0
14 0.5 0 32 0 12 40 20 68 0 4 0 0 0
15 0 0 26 0 24 10 12 64 0 0 0 16 0
Average 2.6 0.6 40.2 0 28.1 39.7 8.2 41.2 1.7 16 1.3 4.2 1.2
Range 0-10 0-7.5 12-82 0 12-40 6-70 0-24 12-88 0-16 0-46 0-10 0-10 0-6
Average (ex. plot 11) 2.2 0.7 41.1 0.0 29.0 38.3 8.1 42.0 1.9 15.0 1.3 3.9 1.1
Range (ex. plot 11) 0-10 0-7.5 12-82 0 12-40 6-70 0-24 12-88 0-16 0-46 0-10 0-10 0-6 NOS: native overstorey cover (50 m transect); NMS: native midstorey cover (50 m transect); NGCG: native ground cover – grasses (50 m transect); NGCS: native ground cover – subshrubs (50 m transect); NGCO: native ground cover – ‘other’ (50 m transect); ECAG: exotic annual cover - grasses (50 m transect); ECPG: exotic perennial cover - grasses (50 m transect); ECO: exotic cover- ‘other’ (50 m transect); LXW: level X weeds (50 m transect); L: litter (50 m transect); R: rock (50 m transect); BG: bare ground (50 m transect); C: cryptogram (50 m transect).
Report for
ACT Box - Gum Woodland Offset Monitoring | Parks and Conservation / Urban Reserves | 3002505
SMEC Australia | Page 23
3.2.3. Recommendations
The following management is recommended for Kinlyside:
Review current grazing practices, and remove intensive grazing during the spring and summer period
Control woody weeds and serrated tussock throughout the site
Control exotic perennial grasses, phalaris and tall fescue, throughout the woodland management area, as identified in the management plan (ACT Government 2015c).
3.3. Kenny Offset
3.3.1. Overview
Field surveys were completed at Kenny on 5 October 2016.
Plot locations within the Kenny Offset are shown in Figure 4. GPS locations and name conversions for each plot are provided in Appendix F. Field sheets and photographs are labelled using the Conservation Research ID for each plot. All summarised data is identified using the Environmental Offsets plot ID.
The Kenny Offset supports scattered, very large, mature woodland trees, with patches of dense regeneration, and supports a low diversity native groundcover.
A complete list of all plant species identified in the plots and abundance score is presented in Appendix I. A total of 72 species (i.e. 32 native species, 40 exotic species) were recorded.
No threatened flora species were recorded. Two significant weed species; serrated tussock and phalaris, were recorded in the plots.
While the scope of works excluded mapping the extent of box – gum woodland, and patch boundaries were not provided, all plots were assessed as occurring within a single continuous woodland patch. Data is consequently summarised for the entire reserve.
3.3.2. Kenny Offset Summary
The plot floristic diversity and structural results are summarised as per the Environmental Offsets Calculator method (ACT Government 2015a) in Table 11 and Table 12. All plots within Kenny are located within a single patch of box – gum woodland.
Quadrat data is summarised for all plots in Table 11. In comparison to the ACT vegetation benchmark for vegetation community ACT16 (Eucalyptus melliodora – E. blakelyi Tableland Grassy Woodland) (ACT Government 2016, Appendix A) , the average results from 2016 are as follows:
Native species richness is lower than the benchmark
Number of large trees is lower than the benchmark
Total length of fallen logs is lower than the benchmark.
Transect data is summarised for all plots in Table 12. In comparison to the ACT vegetation benchmark for vegetation community ACT16 (Eucalyptus melliodora – E. blakelyi Tableland Grassy Woodland) (ACT Government 2016), the average results from 2016 are as follows:
Native overstorey cover is outside and below the benchmark range
Native midstorey cover is within the benchmark range
Native ground cover – grass is within the benchmark range
Native ground cover – shrubs is within the benchmark range
Native ground cover – other is outside and below the benchmark range.

Report for
ACT Box - Gum Woodland Offset Monitoring | Parks and Conservation / Urban Reserves | 3002505
SMEC Australia | Page 24
Floristic value scores for the Kenny Offset are summarised in Table 11. The Kenny Offset has an average floristic value score of 5.3 (N=8), which indicates low floristic value. The floristic value score range is 0.6-15.5 (i.e. of little conservation value to moderate-to-high conservation value) indicating a moderate variation in floristic condition at the site.
3.3.3. Recommendations
The following management is recommended for the Kenny Offset:
Trial thinning of dense Blakely’s red gum (Eucalyptus blakelyi) regeneration where it appears to be having a detrimental impact on tree health
Plant native forbs and shrubs to improve the floristic diversity of the site
Place woody debris within the woodland area to improve foraging habitat for woodland birds
Control woody weeds, serrated tussock and phalaris throughout the woodland area.

_̂
_̂
_̂
_̂
_̂
_̂
_̂
_̂Kenny 8
Kenny 7
Kenny 6
Kenny 5
Kenny 4
Kenny 3
Kenny 2
Kenny 1
Federal Hwy
Federal Hwy
Morisset Rd
Well Station Dr Well Station Dr
Flemin
gton R
d
Horse Park Dr
© SMEC Australia Pty Ltd 2017. All Rights Reserved
PROJECT TITLE ACT Box Gum Woodland Monitoring
¹LEGEND_̂ Plot Locations
Offset Boundary
PROJECT NO. 3002505 CREATED BY N.CrookSOURCES Roadnet©basemaps/imagery2015mga: ACTMapi ©Australian Capital Territory
FIG NO. 4 DATE 02/06/2017
COORDINATE SYSTEMGDA 1994 MGA Zone 55
PAGE SIZE A4
0 140 28070
Meters1:10,000
Location: X:\PROJECT\3002505 ACT Box Gum Woodland Mointoring\GIS\Gungahlin\Kenny_Plots_Locations.mxd
Disclaimer: While all reasonable care has been taken toensure the information contained on this map is up to dateand accurate, this map contains data from a number ofsources - no warranty is given that the informationcontained on this map is free from error or omission. Anyreliance placed on such information shall be at the sole riskof the user. Please verify the accuracy of all information priorto using it. This map is not a design document.
FIGURE TITLE Kenny offset area and plot locations.
Last updated by: DM12840 on 2/06/2017 at 16:42
1.9
1.7
1.7
6.9
10.8
15.5
3.3
0.6

Report for
ACT Box - Gum Woodland Offset Monitoring | Parks and Conservation / Urban Reserves | 3002505
SMEC Australia | Page 26
Table 11. Quadrat results summary for Kenny Offset Area.
NPS: number of native plant species (0.04 ha plot); EPS: number of exotic plant species (0.04 ha plot); QRA: qualitative regen abundance (0.04 ha plot); QRH: qualitative regen health (0.04 ha plot); NLT: number of large trees in 0.1 ha plot; FL: length of fallen logs in 0.1 ha plot; OR: proportion of native overstorey species regenerating in vegetation zone; HBT: hollow-bearing trees (0.1 ha plot); TS: number of threatened plant species (0.04 ha plot); SW: significant weeds in each plot (0.04 ha); WS: weed score; FVS: floristic value score.
Plot NPS EPS QRA QRH NLT FL OR HBT TS SW WS FVS
1 5 13 0 - 0 2 0.5 0 0 2 10.1 1.7
2 6 17 0 - 0 0 0.6 0 0 1 9.9 1.9
3 6 17 <5 25 1 3 1 1 0 2 12 1.7
4 13 20 5-20 25 1 39 1 1 0 1 11.8 6.9
5 11 15 <5 25 0 9 0.3 0 0 2 10 15.5
6 8 16 5-20 25 1 32 1 0 0 2 11.5 3.3
7 12 16 5-20 25 2 80 1 2 0 2 14.3 10.8
8 4 15 0 - 2 87 1 0 0 0 7 0.6
Average 8.1 16.1 N/A N/A 0.8 31.5 0.8 0.5 0 1.5 10.8 5.3
Range 5-13 13-20 N/A N/A 0-2 0-80 0-1 0-2 0 0-2 7-14.3 0.6-15.5

Report for
ACT Box - Gum Woodland Offset Monitoring | Parks and Conservation / Urban Reserves | 3002505
SMEC Australia | Page 27
Table 12. Transect results summary for Kenny Offset Area.
NOS: native overstorey cover (50 m transect); NMS: native midstorey cover (50 m transect); NGCG: native ground cover – grasses (50 m transect); NGCS: native ground cover – subshrubs (50 m transect); NGCO: native ground cover – ‘other’ (50 m transect); ECAG: exotic annual cover - grasses (50 m transect); ECPG: exotic perennial cover - grasses (50 m transect); ECO: exotic cover- ‘other’ (50 m transect); LXW: level X weeds (50 m transect); L: litter (50 m transect); R: rock (50 m transect); BG: bare ground (50 m transect); C: cryptogram (50 m transect).
Plot NOS NMS NGCG NGCS NGCO ECAG ECPG ECO LXW L R BG C
1 5 0 42 0 0 44 0 26 42 0 0 6 0
2 0 0.5 58 0 0 24 24 12 0 0 0 6 0
3 5.5 0 44 0 0 34 10 16 0 8 0 16 0
4 5 0.5 22 0 0 64 4 6 32 6 0 8 0
5 0 0 60 0 0 20 0 30 0 0 0 10 0
6 10 0 32 0 0 68 2 16 2 2 0 16 0
7 2 0.5 44 0 0 46 0 24 2 4 0 12 0
8 8.5 0 32 0 0 54 0 22 0 4 0 26 0
Average 4.5 0.1 41.7 0 0 44.2 5 19 9.7 3 0 12.5 0
Range 0-10 0-0.5 22-60 0 0 20-64 0-24 6-30 0-42 0-8 0 0-26 0

Report for
ACT Box - Gum Woodland Offset Monitoring | Parks and Conservation / Urban Reserves | 3002505
SMEC Australia | Page 28
3.4. North Gungahlin Offset
3.4.1. Overview
Field surveys were completed on 6 October 2016.
Plot locations within the North Gungahlin Offset areas are shown in Figure 5. Plot naming relates to the transect numbers provided by Parks and Conservation Service. GPS locations for each plot are provided in Appendix H. Plots within the North Gungahlin Offset are treated as part of two adjacent sites; Horse Park North (Plots 21, 53 and 55) and Taylor (Plot 69). No plots were in the Jacka section of the North Gungahlin Offset, which comprises red stringybark tableland forest.
The Taylor Offset site supports sparse woodland trees with some regeneration of trees and shrubs, tending into red stringybark (Eucalyptus macrorhyncha) dry forest on the slopes. The site supports diverse native groundcover. Woody weeds are present and moderate to severe erosion occurs along the main drainage line. Evidence of woody weed control was observed.
Horse Park North supports box - gum woodland throughout low-lying areas grading into red stringybark dry forest on the slopes. Red stringybark intergrades with yellow box on the lower slopes, and was present within or adjacent to both plots.
A complete list of all plant species identified in the plots and abundance scores is presented in Appendix I. A total of 52 species (i.e. 31 native species, 21 exotic species) were recorded at Horse Park North Offset area and a total of 77 species (i.e. 46 native species, 31 exotic species) were recorded at the Taylor Offset area.
No threatened flora species were recorded at Horse Park North or Taylor. One significant weed species, phalaris, was recorded in Horse Park North. Two significant weed species, phalaris and serrated tussock, were recorded in Taylor.
Data is summarised separately for plots within Horse Park North and Taylor. No mapping of woodland patches was provided for the North Gungahlin Offsets. When summarising data, each offset area was assumed to comprise a distinct woodland patch.
3.4.2. Taylor Summary
The plot floristic diversity and structural results are summarised as per the Environmental Offsets Calculator method (ACT Government 2015a) in Table 13 and Table 14.
Quadrat data is summarised for Plot 69 in Table 13. In comparison to the ACT vegetation benchmark for vegetation community ACT16 (Eucalyptus melliodora – E. blakelyi Tableland Grassy Woodland) (ACT Government 2016, Appendix A), 2016 results identify:
Native species richness is lower than the benchmark
Number of large trees is lower than the benchmark
Total length of fallen logs is lower than the benchmark.
Transect data is summarised for Plot 69 in Table 14. In comparison to the ACT vegetation benchmark for vegetation community ACT16 (Eucalyptus melliodora – E. blakelyi Tableland Grassy Woodland) (ACT Government 2016), 2016 results identify:
Native overstorey cover is lower than the benchmark
Native midstorey cover is within the lower range for the benchmark
Native ground cover – grass is within the range for the benchmark
Native ground cover – shrubs is within the range for the benchmark
Native ground cover – other is higher than the benchmark.

Report for
ACT Box - Gum Woodland Offset Monitoring | Parks and Conservation / Urban Reserves | 3002505
SMEC Australia | Page 29
Floristic value scores are summarised in Table 13. The single plot at Taylor has a floristic value score of 39.68, (i.e. is of exceptional conservation value).

_̂
_̂
_̂_̂
Taylor 69
Horse Park Drive North 53Horse Park Drive North 55
Horse Park Drive North 2126.3
25.0
18.7
39.6
Djerrkura St
Spring Range Rd
Ida W e st St
Pepper StLucy Beeton Cres
Rangi
ari St
Yarri St© SMEC Australia Pty Ltd 2017. All Rights Reserved
PROJECT TITLE ACT Box Gum Woodland Monitoring
¹LEGEND_̂ Plot Locations including FVS (refer to the white text)
Offset Boundary
PROJECT NO. 3002505 CREATED BY N.CrookSOURCES Roadnet©basemaps/imagery2015mga: ACTMapi ©Australian Capital Territory
FIG NO. 5 DATE 29/05/2017
COORDINATE SYSTEMGDA 1994 MGA Zone 55
PAGE SIZE A4
0 290 580145
Meters1:20,000
Location: X:\PROJECT\3002505 ACT Box Gum Woodland Mointoring\GIS\Gungahlin\HBR_Overall.mxd
Disclaimer: While all reasonable care has been taken toensure the information contained on this map is up to dateand accurate, this map contains data from a number ofsources - no warranty is given that the informationcontained on this map is free from error or omission. Anyreliance placed on such information shall be at the sole riskof the user. Please verify the accuracy of all information priorto using it. This map is not a design document.
FIGURE TITLE North Gungahlin offset areas and plot locations.
Last updated by: NC4747 on 29/05/2017 at 16:16
Horse Park Drive North
Taylor
Jacka

Report for
ACT Box - Gum Woodland Offset Monitoring | Parks and Conservation / Urban Reserves | 3002505
SMEC Australia | Page 31
Table 13. Quadrat results summary for Taylor Offset.
Plot NPS EPS QRA QRH NLT FL OR HBT TS SW WS FVS
69 30 17 0 - 0 2 0 0 0 1 9.9 39.68
NPS: number of native plant species (0.04 ha plot); EPS: number of exotic plant species (0.04 ha plot); QRA: qualitative regen abundance (0.04 ha plot); QRH: qualitative regen health (0.04 ha plot); NLT: number of large trees in 0.1 ha plot; FL: length of fallen logs in 0.1 ha plot; OR: proportion of native overstorey species regenerating in vegetation zone; HBT: hollow-bearing trees (0.1 ha plot); TS: number of threatened plant species (0.04 ha plot); SW: significant weeds in each plot (0.04 ha); WS: weed score; FVS: floristic value score.
Table 14. Transect results summary for Taylor Offset.
Plot NOS NMS NGCG NGCS NGCO ECAG ECPG ECO LXW L R BG C
69 0 0 52 0 40 16 4 10 10 0 0 18 0
NOS: native overstorey cover (50 m transect); NMS: native midstorey cover (50 m transect); NGCG: native ground cover – grasses (50 m transect); NGCS: native ground cover – subshrubs (50 m transect); NGCO: native ground cover – ‘other’ (50 m transect); ECAG: exotic annual cover - grasses (50 m transect); ECPG: exotic perennial cover - grasses (50 m transect); ECO: exotic cover- ‘other’ (50 m transect); LXW: level X weeds (50 m transect); L: litter (50 m transect); R: rock (50 m transect); BG: bare ground (50 m transect); C: cryptogram (50 m transect).

Report for
ACT Box - Gum Woodland Offset Monitoring | Parks and Conservation / Urban Reserves | 3002505
SMEC Australia | Page 32
3.4.3. Horse Park North Summary
The plot floristic diversity and structural results are summarised as per the Environmental Offsets Calculator method (ACT Government 2015a) in Table 15 and Table 16.
All plots within Horse Park North, i.e. Plots 21, 53 and 55, support red stringybark in association with yellow box (Eucalyptus melliodora). Plots were in low-lying parts of the landscape, supported grassy woodland or derived grassland with a diverse understorey consistent with box – gum woodland and were consequently considered as ACT16 (Eucalyptus melliodora – E. blakelyi Tableland Grassy Woodland) (ACT Government 2016, Appendix A) for benchmark comparison. Mapping of box – gum extent within these areas would provide clarification of whether the plots are located within box – gum woodland, ecotonal areas or adjacent areas of red stringybark tableland forest.
Quadrat data is summarised in Table 15. In comparison to the ACT vegetation benchmark for vegetation community ACT16 (Eucalyptus melliodora – E. blakelyi Tableland Grassy Woodland) (ACT Government 2016, Appendix A) , the average results from 2016 are as follows:
Native species richness is lower than the benchmark
Number of large trees is lower than the benchmark
Total length of fallen logs is higher than the benchmark.
Transect data is summarised in Table 16. In comparison to the ACT vegetation benchmark for vegetation community ACT16 (Eucalyptus melliodora – E. blakelyi Tableland Grassy Woodland) (ACT Government 2016) , the average results from 2016 are as follows:
Native overstorey cover is outside and below the benchmark range
Native midstorey cover is within the benchmark range
Native ground cover – grass is within the benchmark range
Native ground cover – shrubs is within the benchmark range
Native ground cover – other is outside and higher than the benchmark range.
Floristic values for Horse Park North are summarised in Table 15. Horse Park North has an average floristic value score of 23.32 (N=3), indicating that the site has high conservation value. The range of floristic scores of 18.7-26.3 (i.e. of moderate-to-high conservation value to very high conservation value) indicates that most woodland is in good condition.
3.4.4. Recommendations
Taylor
The following management is recommended for the Taylor Offset area:
Control woody weeds, serrated tussock and phalaris throughout the woodland area
Assess potential erosion control requirements along the drainage line
Minimise grazing for biomass control purposes during spring and summer.
Horse Park North
The following management is recommended for Horse Park North:
Clarify the box – gum woodland extent through additional mapping
Control weeds, targeting woody weeds, serrated tussock and phalaris
Minimise grazing for biomass control purposes during spring and summer.

Report for
ACT Box - Gum Woodland Offset Monitoring | Parks and Conservation / Urban Reserves | 3002505
SMEC Australia | Page 33
Table 15. Quadrat results summary for Horse Park North Offset.
Plot NPS EPS QRA QRH NLT FL OR HBT TS SW SW FVS
55 19 16 20-50 50 1 80 0.5 1 0 1 7.9 25.0
21 22 21 0 - 0 76 0.5 0 0 2 11.8 18.7
53 28 9 0 - 0 2 1 0 0 1 3.2 26.3
Average 23.0 15.3 N/A N/A 0.3 52.7 0.7 0.3 0.0 1.3 7.6 23.3
Range 19-28 9-21 N/A N/A 0-1 2-80 0.5-1 0-1 0 1-2 3.2-11.8 18.7-26.3
NPS: number of native plant species (0.04 ha plot); EPS: number of exotic plant species (0.04 ha plot); QRA: qualitative regen abundance (0.04 ha plot); QRH: qualitative regen health (0.04 ha plot); NLT: number of large trees in 0.1 ha plot; FL: length of fallen logs in 0.1 ha plot; OR: proportion of native overstorey species regenerating in vegetation zone; HBT: hollow-bearing trees (0.1 ha plot); TS: number of threatened plant species (0.04 ha plot); SW: significant weeds in each plot (0.04 ha); WS: weed score; FVS: floristic value score.
Table 16. Transect results summary for Horse Park North Offset.
Plot NOS NMS NGCG NGCS NGCO ECAG ECPG ECO LXW L R BG C
55 10.5 0 20 0 10 0 0 4 72 32 0 0 0
21 7 0.5 30 0 22 24 8 40 0 12 0 2 0
53 0.5 0 38 0 50 0 0 4 8 6 0 14 0
Average 6.0 0.2 29.3 0.0 27.3 8.0 2.7 16.0 26.7 16.7 0.0 5.3 0.0
Range 0.5-10.5
0-0.5 20-38 0 10-50 0-24 0-8 4-40 0-72 6-32 0 0-14 0
NOS: native overstorey cover (50 m transect); NMS: native midstorey cover (50 m transect); NGCG: native ground cover – grasses (50 m transect); NGCS: native ground cover – subshrubs (50 m transect); NGCO: native ground cover – ‘other’ (50 m transect); ECAG: exotic annual cover - grasses (50 m transect); ECPG: exotic perennial cover - grasses (50 m transect); ECO: exotic cover- ‘other’ (50 m transect); LXW: level X weeds (50 m transect); L: litter (50 m transect); R: rock (50 m transect); BG: bare ground (50 m transect); C: cryptogram (50 m transect).

Report for
ACT Box - Gum Woodland Offset Monitoring | Parks and Conservation / Urban Reserves | 3002505
SMEC Australia | Page 34
3.5. Isaacs Ridge Offset
3.5.1. Overview
Field surveys were completed on 2 November and 21 November 2016. The transect at plot 5 was completed on the 21 November 2016 while the floristic value was assessed on 2 November 2016.
Plot locations within the Isaacs Ridge Offset area are shown in Figure 6. GPS locations for each plot are provided in Appendix J. All plots except Q06 and R01 were positioned such that the GPS co-ordinates correspond to the north-east corner. The GPS co-ordinates for Q06 and RO1 correspond to the south-east corner of the plot.
The site supports a mosaic of mature woodland and secondary grassland. Regenerating woodland trees are present in clumps throughout the Isaacs Ridge Offset and appear to be having a detrimental impact on the health of mature and regenerating trees. Watercourses throughout the area were observed to be actively eroding. Woody debris had been placed throughout the offset prior to the assessment and further woody debris has been placed following the assessment. Evidence of weed control was observed, with some adverse impacts on native forbs evident.
A complete list of all plant species identified in the plots and abundance scores is presented in Appendix K. A total of 127 species (i.e. 77 native species, 50 exotic species) were recorded. No threatened flora species were recorded. Four significant weed species were recorded; paspalum, serrated tussock, tall fescue and phalaris.
Placement of woody debris has taken place throughout the Isaacs Ridge offset, resulting in a significant increase in the fallen log length on the site. Additional woody debris was placed after monitoring took place.
The Isaacs Ridge Nature Reserve Extension Offset Management Plan (ACT Government 2015d) identifies the reserve as supporting a continuous patch of box – gum woodland. Data is summarised for the entire reserve.
3.5.2. Isaacs Ridge Offset Summary
The plot floristic diversity and structural results are summarised as per the Environmental Offsets Calculator method (ACT Government 2015a) in Table 17 and Table 18.
Plot data for all plots is summarised in Table 17. In comparison to the ACT vegetation benchmark for vegetation community ACT16 (Eucalyptus melliodora – E. blakelyi Tableland Grassy Woodland) (ACT Government 2016, Appendix A) , the average results from 2016 are as follows:
Native species richness is lower than the benchmark
Number of large trees is lower than the benchmark
Total length of fallen logs is lower than the benchmark.
Transect data for all plots is summarised in Table 18. In comparison to the ACT vegetation benchmark for vegetation community ACT16 (Eucalyptus melliodora – E. blakelyi Tableland Grassy Woodland) (ACT Government 2016) , the average results from 2016 are as follows:
Native overstorey cover is lower than the benchmark
Native midstorey cover is within the lower range for the benchmark
Native ground cover – grass is within the range for the benchmark
Native ground cover – shrubs is within the range for the benchmark
Native ground cover – other is higher than the benchmark.

Report for
ACT Box - Gum Woodland Offset Monitoring | Parks and Conservation / Urban Reserves | 3002505
SMEC Australia | Page 35
Floristic value scores for the 20 m x 20 m quadrats are summarised in Table 17. Isaacs Ridge Offset site has an average floristic value score of 15.4 (N=8), indicating a generally moderate-to-high conservation value across the site. The range of floristic value scores was 6.3-36.8 (i.e. of low conservation value to exceptional conservation value) indicating a moderate level of variability between plots.
For comparison with the Umwelt (2012) method, the floristic values scores for the 1 m x 1 metre plots are presented in Table 19 and have an average of 2.3 (N=4) and a range of 1-6.0 (i.e. of little conservation value to low conservation value). The low conservation value scores are an artefact of the small quadrat size. Data on plot disturbance collected at plots 4 and 6 as per Biometric 3.1 (NSW Government 2011) is presented in Table 20. Key observations at the two plots are that noxious weeds are abundant, canopy dieback is occurring, and that there is dense regeneration of Blakely’s red gum (Eucalyptus blakelyi) at plot 6.
The results from the rapid assessment are presented in Table 21. The rapid assessment summary was undertaken at two plots, i.e. RO1 and RO2. Key points are that for both plots, woodland trees are regenerating and noxious weeds are abundant. Exotic species dominate the groundcover in plot R01. For Plot R02, tree health is poor for Blakely’s red gum and erosion is a problem within the plot and surrounding area.
3.5.3. Recommendations
The following management is recommended for Isaacs Ridge:
Trial thinning of dense Blakely’s red gum regeneration where it appears to be having a detrimental impact on tree health
Assess potential erosion control requirements along the drainage lines
Manage vertebrate pests where woody debris has been placed
Expand the existing weed control program to include significant perennial exotic grasses, i.e. paspalum, tall fescue and phalaris, particularly in low-lying areas.
Cease collection of data according to the Umwelt (2012) method. Collection of floristic diversity and floristic value score information at a 1 m x 1 m plot as per Umwelt (2012) does not provide a useful comparison between years due to the difficulty of replicating exact plot location, and the limited and highly variable information recorded in plots of this size.
Continue collection of rapid assessment summary data at plots, as this records changes to general site character and landscape scale change which may not be otherwise collected by biometric plots.

© SMEC Australia Pty Ltd 2017. All Rights Reserved
FIGURE TITLE Isaacs Ridge offset area and plot locations.FIG NO. 6
CREATED BY N.Crook SOURCES Roadnet©basemaps/imagery2015mga: ACTMapi ©Australian Capital Territory
Location: X:\PROJECT\3002505 ACT Box Gum Woodland Mointoring\GIS\Issac_Ridge\Plot_Location.mxd
DATE 29/05/2017 COORDINATE SYSTEMGDA 94 MGA Zone 55
PAGE SIZE A4
PROJECT TITLE ACT Box Gum Woodland MonitoringPROJECT NO. 3002505
!(
!(
!(
")
")
!(
!(
!(Q04
Q03
Q01
R02
R01
Q06Q05
Q02
6.5
6.3
6.8
6.8
9.0
32.1
36.8
19.1
Mugga Ln
Long Gully Rd
0 100 200 30050
Meters1:10,000
Disclaimer: While all reasonable care has been taken to ensure the information contained on this map is up to date and accurate, thismap contains data from a number of sources - no warranty is giventhat the information contained on this map is free from error or omission. Any reliance placed on such information shall be at the sole risk of the user. Please verify the accuracy of all information prior to using it. This map is not a design document.
LEGENDSurvey Method including FVS (refer to white text)!( 1 m x 1 m plot (Umwelt 2012)
!( 20 m x 50 m plot (ACT Government 2015)
") Rapid Assessment (Umwelt 2012)
¹
Last updated by: NC4747 on 29/05/2017 at 15:46

Report for
ACT Box - Gum Woodland Offset Monitoring | Parks and Conservation / Urban Reserves | 3002505
SMEC Australia | Page 37
Table 17. 20x20 m quadrat results summary for Isaacs Ridge.
Plot NPS EPS QRA QRH NLT FL OR HBT TS SW SW FVS
1 16 21 <5 75 0 0 0.3 0 0 1 11.8 6.5
2 14 21 0 - 0 80 0 0 0 1 3.9 9.0
3 36 18 50-100 50 0 0 0.6 0 0 1 11.9 36.8
4 34 17 50-100 25 0 1 1 0 0 1 5.8 32.1
5 8 23 0 - 0 0 1 0 0 1 8.2 6.8
6 26 17 5-20 50 0 12 1 0 0 0 1.6 19.1
R01 17 18 <5 25 1 45 0.6 0 0 0 10.7 6.8
R02 15 23 0 - 0 0 0 0 0 2 11.8 6.3
Average 20.7 19.7 N/A N/A 0.1 17.2 0.5 0 0 0.8 4.5 15.4
Range 8-36 17-23 N/A N/A 0-1 0-80 0-1 0 0 0-2 6.5 6.3-26.8
NPS: number of native plant species (0.04 ha plot); EPS: number of exotic plant species (0.04 ha plot); QRA: qualitative regen abundance (0.04 ha plot); QRH: qualitative regen health (0.04 ha plot); NLT: number of large trees in 0.1 ha plot; FL: length of fallen logs in 0.1 ha plot; OR: proportion of native overstorey species regenerating in vegetation zone; HBT: hollow-bearing trees (0.1 ha plot); TS: number of threatened plant species (0.04 ha plot); SW: significant weeds in each plot (0.04 ha); WS: weed score; FVS: floristic value score.

Report for
ACT Box - Gum Woodland Offset Monitoring | Parks and Conservation / Urban Reserves | 3002505
SMEC Australia | Page 38
Table 18. Transect results summary for Isaacs Ridge.
NOS: native overstorey cover (50 m transect); NMS: native midstorey cover (50 m transect); NGCG: native ground cover – grasses (50 m transect); NGCS: native ground cover – subshrubs (50 m transect); NGCO: native ground cover – ‘other’ (50 m transect); ECAG: exotic annual cover - grasses (50 m transect); ECPG: exotic perennial cover - grasses (50 m transect); ECO: exotic cover- ‘other’ (50 m transect); LXW: level X weeds (50 m transect); L: litter (50 m transect); R: rock (50 m transect); BG: bare ground (50 m transect); C: cryptogram (50 m transect)
Table 19. 1 m x1 m quadrat results summary for Isaacs Ridge.
Plot NPS EPS SW SW FVS
1 4 10 0 3.9 1.0
2 7 12 0 5.9 1.5
3 9 6 0 1.6 6.0
5 4 12 0 4.5 1.0
Average 6 10 0 4.0 2.1
Range 4-9 6-12 0 1.6-5.9 1.0-6.0
NPS: number of native plant species (0.04 ha plot); EPS: number of exotic plant species (0.04 ha plot); TS: number of threatened plant species (0.04 ha plot); SW: significant weeds in each plot (0.04 ha); WS: weed score; FVS: floristic value score.
Plot NOS NMS NGCG NGCS NGCO ECAG ECPG ECO LXW L R BG C
Q1 1 0.5 26 0 50 84 4 28 6 6 0 0 0
Q2 0 0 38 0 22 54 2 60 8 14 0 0 0
Q3 2.5 0 58 2 24 66 0 12 0 16 0 4 0
Q4 0 0 44 0 82 12 0 22 0 4 0 2 0
Q5 0 0 44 0 12 72 0 24 0 0 0 0 0
Q6 1.5 8.5 43 0 8 30 4 20 6 42 0 4 0
R01 5 0 50 0 14 54 22 50 8 6 0 0 0
R02 0 0 32 0 72 18 8 22 8 0 0 4 0
Average 1.2 1.1 41.8 0.2 35.5 48.7 5 29.7 4.5 11 0 1.7 0
Range 0-2.5 0-8.5 32-50 0-2.5 8-50 12-72 0-22 12-60 0-8 0-16 0 0-4 0

Report for
ACT Box - Gum Woodland Offset Monitoring | Parks and Conservation / Urban Reserves | 3002505
SMEC Australia | Page 39
Table 20. Biometric assessment of disturbance for Isaacs Ridge.
Distribution attributes and history 4 4 4 4 6 6 6 6
Severity Frequency Evidence Age Severity Frequency Evidence Age
Canopy dieback L R O R L R O R
Grazing and trampling L R O R N
Soil disturbance L R O NR L R O NR
Timber harvesting N N
Flood damage N N
Firewood collection and tidy up N N
Dense regrowth post-disturbance N M O O NR
Fertiliser addition N N
Fire Damage N N
Feral Herbivores N N
Weeds M F O On M F O N
Severity codes: N=Nil, L = Light, M = Moderate, S = Severe. Frequency codes: A = Absent (i.e. n/a), Ra = Rare, Occ = Occasional, F = Frequent. Evidence: O = Observation, W = Word of mouth (e.g. landholder). Age code: On = Ongoing, R = Recent (<3 years), NR = Not recent, O = Old.

Report for
ACT Box - Gum Woodland Offset Monitoring | Parks and Conservation / Urban Reserves | 3002505
SMEC Australia | Page 40
Table 21. Rapid assessment for Isaacs Ridge.
Plot Vegetation
Type Condition
R01 Box - Gum Woodland
Dominant canopy species: yellow-box, Blakely's red gum and apple box.
No hollow bearing trees present
Recruitment of Blakely's red gum and apple box throughout the area
Understorey is largely consistent of exotic perennial and annual grasses
Few shrubs are present
Noxious weeds (i.e. St John's wort and Paterson’s curse) are abundant
Drainage line nearby
Few large scattered fallen timber presents
No rocks within the area
R02 Box - Gum Woodland
Dominant canopy species: yellow-box, Blakely's red gum
Blakely's red gum: condition is poor across established trees and regeneration
An erosion channel (shallow) is present within the 20 m x 50 m plot; bank erosion is occurring
Larger erosion channel to south
Mistletoe common amongst mature trees
Drosera peltata and sedges dominate in the moist areas
Hair grass and Paterson’s curse dominate, St John's wort is also common across the area
Shrub layer absent
Only a few scattered rocks at the surface, no rocky outcrops present
Yellow-box and red box stands to south are in better health with less canopy loss
Grass and herb layer very low. i.e. <10 cm
Report for
ACT Box - Gum Woodland Offset Monitoring | Parks and Conservation / Urban Reserves | 3002505
SMEC Australia | Page 41
3.6. Justice Robert Hope Park Offset
3.6.1. Overview
Field surveys were completed on 16 September 2016.
Plot locations within the Justice Robert Hope Park Offset area are shown in Figure 7. GPS locations for each plot are provided in Appendix L.
The site supports exceptionally large mature woodland trees, which are generally in very good condition, with patches of dense regeneration. Extensive park-care activities were evident including plantings of woodland trees, native shrubs, native forbs and native grasses. Plantings were maintained through ongoing manual weed control, installation of barriers and watering. Planting of native forbs and shrubs contributed to the conservation value of the site. Herbicide application was observed to have targeted kangaroo grass along the southern boundary of Justice Robert Hope Park.
A complete list of plant species identified in the plots and abundance scores is presented in Appendix M. A total of 34 native species and 29 exotic species were recorded.
One threatened flora species; hoary sunray (Leucochrysum albicans), was recorded. Four significant weed species, as classified by Rehwinkel (2015), were recorded; African boxthorn (Lycium ferocissimum), St John’s wort (Hypericum perforatum), Chilean needlegrass and phalaris.
Box – gum woodland at Justice Robert Hope Park comprises of a single patch. Data is summarised for the entire reserve.
3.6.2. Justice Robert Hope Park Offset Summary
The plot floristic diversity and structural results are summarised according to the Environmental Offsets Calculator method (ACT Government 2015a) in Table 22 and Table 23.
Quadrat data is summarised in Table 22. In comparison to the ACT vegetation benchmark for vegetation community ACT16 (Eucalyptus melliodora – E. blakelyi Tableland Grassy Woodland) (ACT Government 2016, Appendix A), the average results from 2016 are as follows:
Native species richness is lower than the benchmark
Number of large trees is lower than the benchmark
Total length of fallen logs is lower than the benchmark.
Transect data is summarised in Table 23. In comparison to the ACT vegetation benchmark for vegetation community ACT16 (Eucalyptus melliodora – E. blakelyi Tableland Grassy Woodland) (ACT Government 2016), the average results from 2016 are as follows:
Native overstorey cover is within the benchmark range
Native midstorey cover is within the benchmark range
Native ground cover – grass is outside and below the benchmark range
Native ground cover – shrubs is within the benchmark range
Native ground cover – other is outside and below the benchmark range.
Floristic value scores for Justice Robert Hope Park are summarised in Table 22. Plots at Justice Robert Hope Park have an average floristic value score of 5.6 (N=7), which indicates that the site has generally low conservation value. The Justice Robert Hope Park has a floristic value score range of 1-24.2 (i.e. of little conservation value to high conservation value), indicating a moderate level of variation between plots.
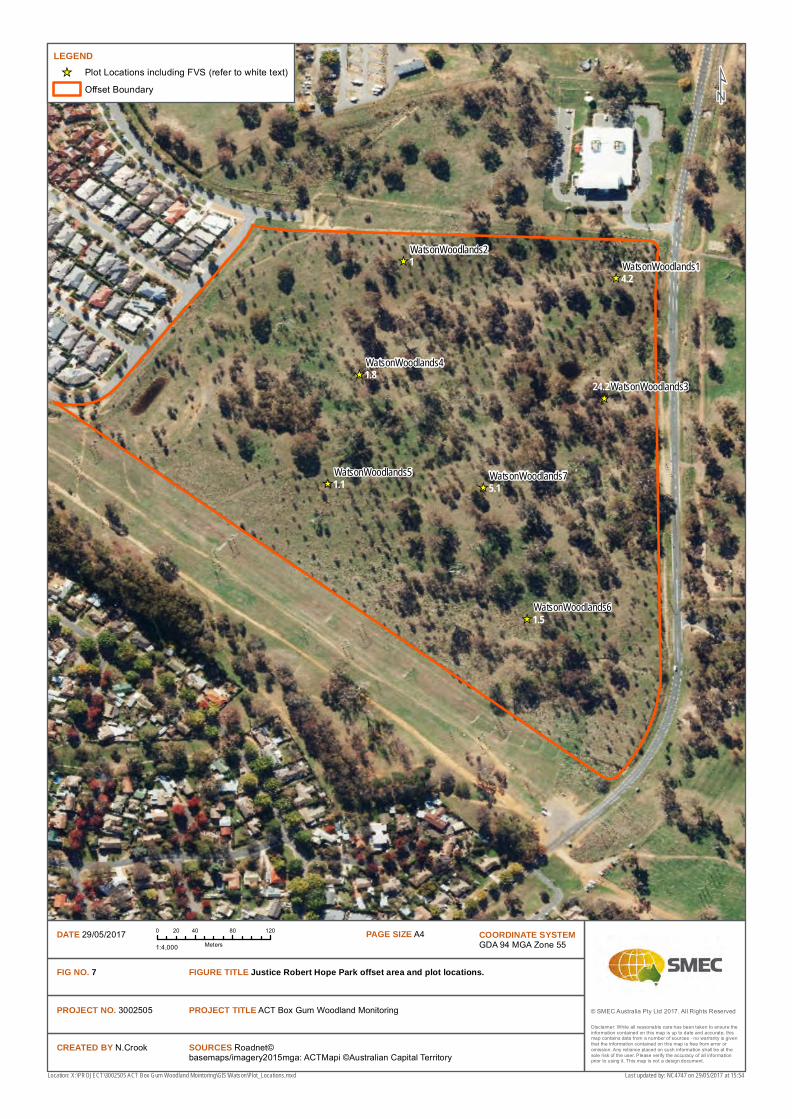
© SMEC Australia Pty Ltd 2017. All Rights Reserved
FIGURE TITLE Justice Robert Hope Park offset area and plot locations. FIG NO. 7
CREATED BY N.Crook SOURCES Roadnet©basemaps/imagery2015mga: ACTMapi ©Australian Capital Territory
Location: X:\PROJECT\3002505 ACT Box Gum Woodland Mointoring\GIS\Watson\Plot_Locations.mxd
DATE 29/05/2017 COORDINATE SYSTEMGDA 94 MGA Zone 55
PAGE SIZE A4
PROJECT TITLE ACT Box Gum Woodland MonitoringPROJECT NO. 3002505
_̂
_̂
_̂
_̂
_̂
_̂
_̂WatsonWoodlands7
WatsonWoodlands6
WatsonWoodlands5
WatsonWoodlands4WatsonWoodlands3
WatsonWoodlands2WatsonWoodlands11
5.1
1.5
1.1
1.8
4.2
24.2
0 40 80 12020
Meters1:4,000
Disclaimer: While all reasonable care has been taken to ensure the information contained on this map is up to date and accurate, thismap contains data from a number of sources - no warranty is giventhat the information contained on this map is free from error or omission. Any reliance placed on such information shall be at the sole risk of the user. Please verify the accuracy of all information prior to using it. This map is not a design document.
LEGEND_̂ Plot Locations including FVS (refer to white text)
Offset Boundary ¹
Last updated by: NC4747 on 29/05/2017 at 15:54

Report for
ACT Box - Gum Woodland Offset Monitoring | Parks and Conservation / Urban Reserves | 3002505
SMEC Australia | Page 43
Table 22. Quadrat results summary for Justice Robert Hope Park.
Plot NPS EPS QRA QRH NLT FL OR HBT TS SW WS FVS
1 7 15 <5 25 2 4.5 1 2 0 1 12.4 4.2
2 6 12 <5 75 1 8 1 1 0 0 5.7 1
3 26 12 20-50 75 1 33 1 1 1 0 5.1 24.2
4 6 13 20-50 25 1 0 1 1 0 2 13.6 1.8
5 6 11 <5 100 0 0 1 0 0 1 6.3 1.1
6 5 8 <5 25 0 0 1 0 0 1 8.9 1.5
7 7 17 5-20 - 1 84 0.67 0 0 3 15.7 5.16
Average 9.0 12.6 N/A N/A 0.9 18.5 1.0 0.7 0.1 1.1 9.7 5.6
Range 5-26 8-17 N/A N/A 0-2 0-84 0.7-1 0-2 0-1 0-3 5.1-15.7 1-24.2
NPS: number of native plant species (0.04 ha plot); EPS: number of exotic plant species (0.04 ha plot); QRA: qualitative regen abundance (0.04 ha plot); QRH: qualitative regen health (0.04 ha plot); NLT: number of large trees in 0.1 ha plot; FL: length of fallen logs in 0.1 ha plot; OR: proportion of native overstorey species regenerating in vegetation zone; HBT: hollow-bearing trees (0.1 ha plot); TS: number of threatened plant species (0.04 ha plot); SW: significant weeds in each plot (0.04 ha); WS: weed score; FVS: floristic value score.
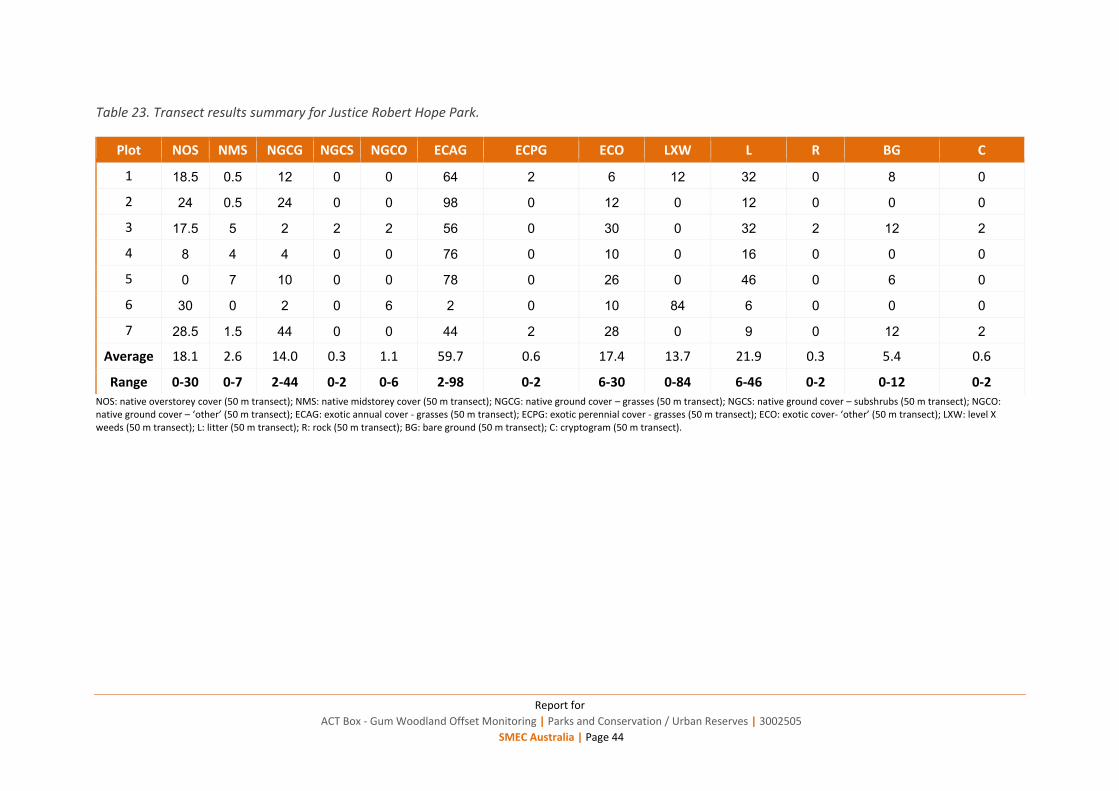
Report for
ACT Box - Gum Woodland Offset Monitoring | Parks and Conservation / Urban Reserves | 3002505
SMEC Australia | Page 44
Table 23. Transect results summary for Justice Robert Hope Park.
NOS: native overstorey cover (50 m transect); NMS: native midstorey cover (50 m transect); NGCG: native ground cover – grasses (50 m transect); NGCS: native ground cover – subshrubs (50 m transect); NGCO: native ground cover – ‘other’ (50 m transect); ECAG: exotic annual cover - grasses (50 m transect); ECPG: exotic perennial cover - grasses (50 m transect); ECO: exotic cover- ‘other’ (50 m transect); LXW: level X weeds (50 m transect); L: litter (50 m transect); R: rock (50 m transect); BG: bare ground (50 m transect); C: cryptogram (50 m transect).
Plot NOS NMS NGCG NGCS NGCO ECAG ECPG ECO LXW L R BG C
1 18.5 0.5 12 0 0 64 2 6 12 32 0 8 0
2 24 0.5 24 0 0 98 0 12 0 12 0 0 0
3 17.5 5 2 2 2 56 0 30 0 32 2 12 2
4 8 4 4 0 0 76 0 10 0 16 0 0 0
5 0 7 10 0 0 78 0 26 0 46 0 6 0
6 30 0 2 0 6 2 0 10 84 6 0 0 0
7 28.5 1.5 44 0 0 44 2 28 0 9 0 12 2
Average 18.1 2.6 14.0 0.3 1.1 59.7 0.6 17.4 13.7 21.9 0.3 5.4 0.6
Range 0-30 0-7 2-44 0-2 0-6 2-98 0-2 6-30 0-84 6-46 0-2 0-12 0-2
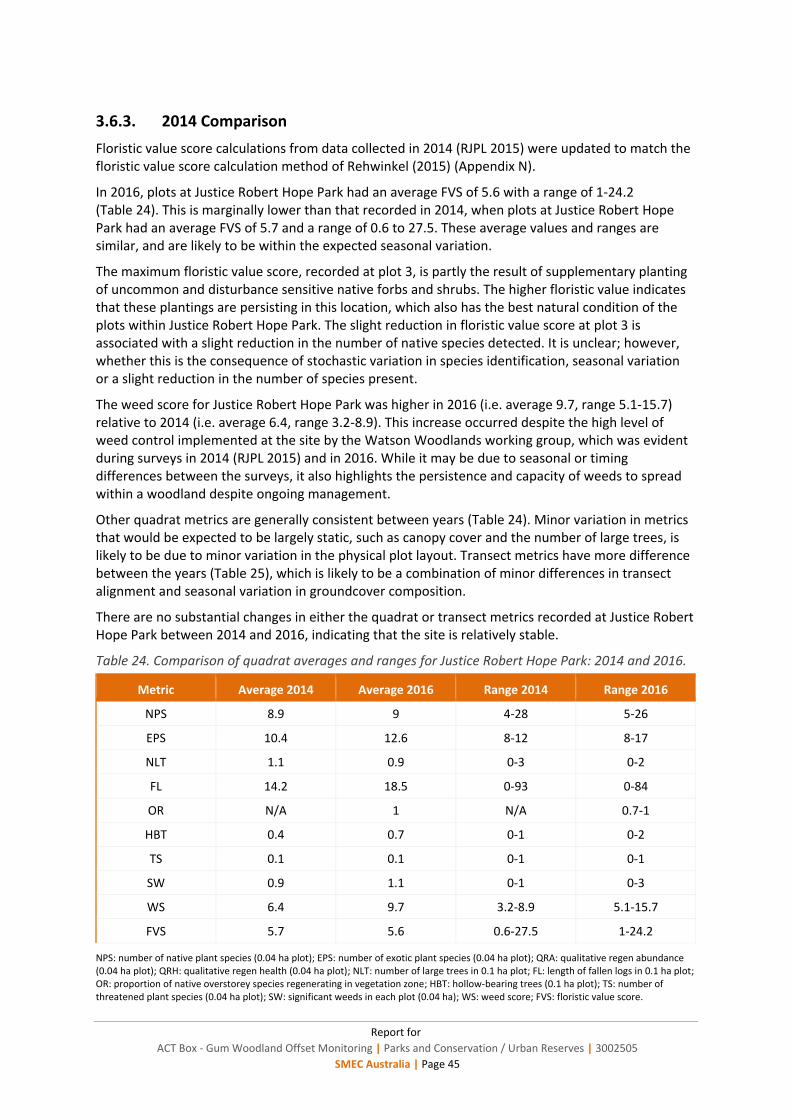
Report for
ACT Box - Gum Woodland Offset Monitoring | Parks and Conservation / Urban Reserves | 3002505
SMEC Australia | Page 45
3.6.3. 2014 Comparison
Floristic value score calculations from data collected in 2014 (RJPL 2015) were updated to match the floristic value score calculation method of Rehwinkel (2015) (Appendix N).
In 2016, plots at Justice Robert Hope Park had an average FVS of 5.6 with a range of 1-24.2 (Table 24). This is marginally lower than that recorded in 2014, when plots at Justice Robert Hope Park had an average FVS of 5.7 and a range of 0.6 to 27.5. These average values and ranges are similar, and are likely to be within the expected seasonal variation.
The maximum floristic value score, recorded at plot 3, is partly the result of supplementary planting of uncommon and disturbance sensitive native forbs and shrubs. The higher floristic value indicates that these plantings are persisting in this location, which also has the best natural condition of the plots within Justice Robert Hope Park. The slight reduction in floristic value score at plot 3 is associated with a slight reduction in the number of native species detected. It is unclear; however, whether this is the consequence of stochastic variation in species identification, seasonal variation or a slight reduction in the number of species present.
The weed score for Justice Robert Hope Park was higher in 2016 (i.e. average 9.7, range 5.1-15.7) relative to 2014 (i.e. average 6.4, range 3.2-8.9). This increase occurred despite the high level of weed control implemented at the site by the Watson Woodlands working group, which was evident during surveys in 2014 (RJPL 2015) and in 2016. While it may be due to seasonal or timing differences between the surveys, it also highlights the persistence and capacity of weeds to spread within a woodland despite ongoing management.
Other quadrat metrics are generally consistent between years (Table 24). Minor variation in metrics that would be expected to be largely static, such as canopy cover and the number of large trees, is likely to be due to minor variation in the physical plot layout. Transect metrics have more difference between the years (Table 25), which is likely to be a combination of minor differences in transect alignment and seasonal variation in groundcover composition.
There are no substantial changes in either the quadrat or transect metrics recorded at Justice Robert Hope Park between 2014 and 2016, indicating that the site is relatively stable.
Table 24. Comparison of quadrat averages and ranges for Justice Robert Hope Park: 2014 and 2016.
Metric Average 2014 Average 2016 Range 2014 Range 2016
NPS 8.9 9 4-28 5-26
EPS 10.4 12.6 8-12 8-17
NLT 1.1 0.9 0-3 0-2
FL 14.2 18.5 0-93 0-84
OR N/A 1 N/A 0.7-1
HBT 0.4 0.7 0-1 0-2
TS 0.1 0.1 0-1 0-1
SW 0.9 1.1 0-1 0-3
WS 6.4 9.7 3.2-8.9 5.1-15.7
FVS 5.7 5.6 0.6-27.5 1-24.2
NPS: number of native plant species (0.04 ha plot); EPS: number of exotic plant species (0.04 ha plot); QRA: qualitative regen abundance (0.04 ha plot); QRH: qualitative regen health (0.04 ha plot); NLT: number of large trees in 0.1 ha plot; FL: length of fallen logs in 0.1 ha plot; OR: proportion of native overstorey species regenerating in vegetation zone; HBT: hollow-bearing trees (0.1 ha plot); TS: number of threatened plant species (0.04 ha plot); SW: significant weeds in each plot (0.04 ha); WS: weed score; FVS: floristic value score.

Report for
ACT Box - Gum Woodland Offset Monitoring | Parks and Conservation / Urban Reserves | 3002505
SMEC Australia | Page 46
Table 25.Comparison of transect averages and ranges for Justice Robert Hope Park: 2014 and 2016.
Plot Average 2014 Average 2016 Range 2014 Range 2016
NOS 9.9 18.1 0-18.5 0-30
NMS 4.9 2.6 0.8-8.3 0-7
NGCG 19.1 14 2-36 2-44
NGCS 0.6 0.3 0-2 0-2
NGCO 0 1.1 0 0-6
ECAG 60 59.7 24-92 2-98
ECPG 12 0.6 0-72 0-2
ECO - 17.4 - 6-30
LXW - 13.7 - 0-84
L 7.1 21.9 0-18 6-46
R 0 0.3 0 0-2
BG 1.4 5.4 0-8 0-12
C 0 0.6 0 0-2
NOS: native overstorey cover (50 m transect); NMS: native midstorey cover (50 m transect); NGCG: native ground cover – grasses (50 m transect); NGCS: native ground cover – subshrubs (50 m transect); NGCO: native ground cover – ‘other’ (50 m transect); ECAG: exotic annual cover - grasses (50 m transect); ECPG: exotic perennial cover - grasses (50 m transect); ECO: exotic cover- ‘other’ (50 m transect); LXW: level X weeds (50 m transect); L: litter (50 m transect); R: rock (50 m transect); BG: bare ground (50 m transect); C: cryptogram (50 m transect).
3.6.4. Recommendations
The following management is recommended for Justice Robert Hope Park:
Coordinate joint management with the Watson Woodlands Working Group
Ensure that park care groups and weed control contractors can distinguish between desirable and undesirable grass species
Continue ongoing weed control and expanding weed control programs to include perennial exotic grasses, particularly paspalum and phalaris, in higher value areas
Manage vertebrate pests where woody debris has been placed
Cease any further tree planting on the site, as it is no longer required.

Report for
ACT Box - Gum Woodland Offset Monitoring | Parks and Conservation / Urban Reserves | 3002505
SMEC Australia | Page 47
3.7. The Pinnacle Offset
3.7.1. Overview
Field surveys were completed on 28 September 2016.
Plot locations within the Pinnacle Offset area are shown in Figure 8. GPS locations for each plot are provided in Appendix N.
The Pinnacle Offset supports a mosaic of mature woodland, and secondary grassland, with a patch of dry forest and associated secondary grassland in the south-east of the site. Woody debris has been placed throughout the Pinnacle Offset.
A complete list of all plant species identified in the plots and abundance scores is presented in Appendix P. A total of 76 native species and 44 exotic species were recorded.
No threatened flora species were recorded. Two significant weed species; i.e. classified as level X species in the floristic assessment method (Rehwinkel 2015), were recorded; paspalum and phalaris.
Data is summarised for the entire reserve and for the two vegetation communities present. The Offset Management Plan for the extension of the Pinnacle Nature Reserve (ACT Government 2016) identified two vegetation communities present within the Pinnacle Offset: ACT16 – Eucalyptus melliodora – E. blakelyi Tableland Grassy Woodlands and ACT25 - Eucalyptus macrorhyncha Tableland Grass / Shrub Forest. The mapping within the management plan indicates that two plots, plot 2 and plot 3, are located within ACT25 - Eucalyptus macrorhyncha Tableland Grass / Shrub Forest. The initial survey of the plots determined that that the extent of ACT25 - Eucalyptus macrorhyncha Tableland Grass / Shrub Forest within the Pinnacle Offset was less than that mapped in the management plan (SMEC 2016), and that only plot 3 was located within ACT25 - Eucalyptus macrorhyncha Tableland Grass / Shrub Forest. Plot 2 remained within the larger patch of ACT16 – Eucalyptus melliodora – E. blakelyi Tableland Grassy Woodlands.
3.7.2. The Pinnacle Offset Summary
Reserve summary
The plot floristic diversity and structural results are summarised as per the Environmental Offsets Calculator method (ACT Government 2015a) in Table 26 and Table 27.
Quadrat data is summarised in Table 26. In comparison to the ACT vegetation benchmark for vegetation community ACT16 (Eucalyptus melliodora – E. blakelyi Tableland Grassy Woodland) (ACT Government 2016, Appendix A), the average results from 2016 are as follows:
Native species richness is lower than the benchmark
Number of large trees is lower than the benchmark
Total length of fallen logs is lower than the benchmark.
Transect data is summarised in Table 27. In comparison to the ACT vegetation benchmark for vegetation community ACT16 (Eucalyptus melliodora – E. blakelyi Tableland Grassy Woodland) (ACT Government 2016), the average results from 2016 are as follows:
Native overstorey cover is outside and below the benchmark range
Native midstorey cover is within the benchmark range
Native ground cover – grass is within the benchmark range
Native ground cover – shrubs is within the benchmark range
Native ground cover – other is within the benchmark range.

Report for
ACT Box - Gum Woodland Offset Monitoring | Parks and Conservation / Urban Reserves | 3002505
SMEC Australia | Page 48
Floristic value scores for the Pinnacle Offset are summarised in Table 26. The Pinnacle Offset has an average floristic value score of 26.8 (N=6), indicating that the site generally has very high conservation value. The Pinnacle Offset has a floristic value score range of 6.4-56.4 (i.e. of low conservation value to exceptional conservation value) indicating a high level of variation between plots. The highest floristic value score of 56.4 is close to the maximum floristic value score possible for box – gum woodland sites, and indicates that the site is of exceptional conservation significance.
ACT16 – Eucalyptus melliodora – E. blakelyi Tableland Grassy Woodlands summary
The plot floristic diversity and structural results are summarised for the woodland plots (excluding plot 3) as per the Environmental Offsets Calculator method (ACT Government 2015a) in Table 26 and Table 27.
Quadrat data excluding plot 3 is summarised in Table 26. In comparison to the ACT vegetation benchmark for vegetation community ACT16 (Eucalyptus melliodora – E. blakelyi Tableland Grassy Woodland) (ACT Government 2016, Appendix A), the average results from 2016 are as follows:
Native species richness is lower than the benchmark
Number of large trees is lower than the benchmark
Total length of fallen logs is lower than the benchmark.
Transect data excluding plot 3 is summarised in Table 27. In comparison to the ACT vegetation benchmark for vegetation community ACT16 (Eucalyptus melliodora – E. blakelyi Tableland Grassy Woodland) (ACT Government 2016), the average results from 2016 are as follows:
Native overstorey cover is outside and below the benchmark range
Native midstorey cover is within the benchmark range
Native ground cover – grass is within the benchmark range
Native ground cover – shrubs is within the benchmark range
Native ground cover – other is within the benchmark range.
Floristic value scores for the box – gum woodland in the Pinnacle Offset are summarised in Table 26. The Pinnacle Offset has an average floristic value score of 20.9 (N=5), indicating that the site generally has high conservation value. The box – gum woodland within the Pinnacle Offset has a floristic value score range of 6.4-56.4 (i.e. of low conservation value to exceptional conservation value) indicating a high level of variation between plots. The highest floristic value score of 56.4 is close to the maximum floristic value score possible for box – gum woodland sites, and indicates that the site is of exceptional conservation significance.
ACT25 - Eucalyptus macrorhyncha Tableland Grass / Shrub Forest Summary
The plot floristic diversity and structural results are presented for plot 3 as per the Environmental Offsets Calculator method (ACT Government 2015a) in Table 26 and Table 27.
Quadrat data for plot 3 is summarised in Table 26. In comparison to the ACT vegetation benchmark for vegetation community ACT25 - Eucalyptus macrorhyncha Tableland Grass / Shrub Forest (ACT Government 2016, Appendix A), the average results from 2016 are as follows:
Native species richness is higher than the benchmark
Number of large trees is lower than the benchmark
Total length of fallen logs is lower than the benchmark.
Transect data for plot 3 is summarised in Table 27. In comparison to the ACT vegetation benchmark for vegetation community ACT25 - Eucalyptus macrorhyncha Tableland Grass / Shrub Forest (ACT Government 2016), the average results from 2016 are as follows:
Native overstorey cover is outside and below the benchmark range
Native midstorey cover is outside and below the benchmark range
Report for
ACT Box - Gum Woodland Offset Monitoring | Parks and Conservation / Urban Reserves | 3002505
SMEC Australia | Page 49
Native ground cover – grass is within the benchmark range
Native ground cover – shrubs is outside and below the benchmark range
Native ground cover – other is within the benchmark range.
Floristic value scores for plot 3 in the Pinnacle Offset is 56.3, which is exceptionally high. The groundcover characteristics in this area are a combination of dry forest characteristics (i.e. shrubby) and grassy woodland characteristics (i.e. high cover and diversity of native grasses and forbs). This variability is most likely to be due to historical clearing of the dry forest, which has created conditions closer to a grassy woodland and therefore favouring a diverse grassy understorey. Based on this floristic value, the site is of exceptional conservation significance.
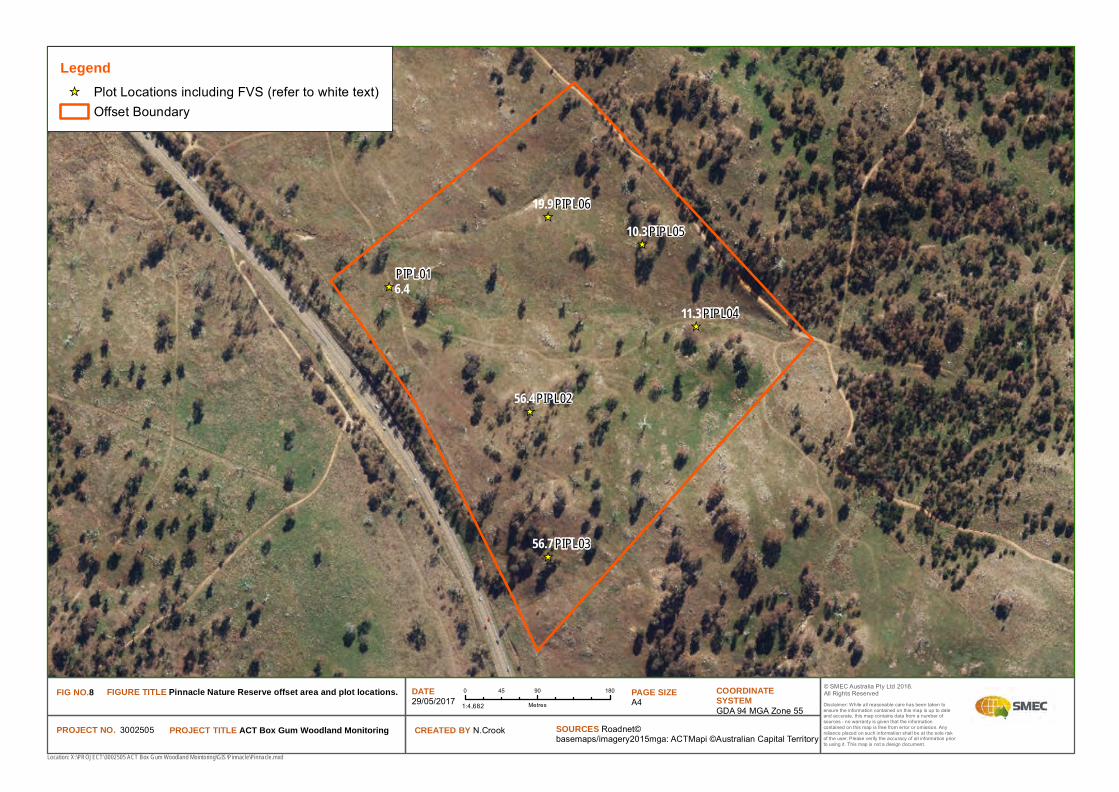
_̂
_̂
_̂
_̂
_̂
_̂PIPL02
PIPL01
PIPL06PIPL05
PIPL04
PIPL03
6.4
56.4
19.910.3
11.3
56.7
© SMEC Australia Pty Ltd 2016. All Rights Reserved
PROJECT TITLE ACT Box Gum Woodland Monitoring
¹
PROJECT NO. 3002505 CREATED BY N.Crook SOURCES Roadnet©basemaps/imagery2015mga: ACTMapi ©Australian Capital Territory
FIG NO.8 DATE 29/05/2017
COORDINATE SYSTEMGDA 94 MGA Zone 55
PAGE SIZE A4
0 90 18045
Metres1:4,682
Location: X:\PROJECT\3002505 ACT Box Gum Woodland Mointoring\GIS\Pinnacle\Pinnacle.mxd
Disclaimer: While all reasonable care has been taken toensure the information contained on this map is up to dateand accurate, this map contains data from a number ofsources - no warranty is given that the informationcontained on this map is free from error or omission. Anyreliance placed on such information shall be at the sole riskof the user. Please verify the accuracy of all information priorto using it. This map is not a design document.
FIGURE TITLE Pinnacle Nature Reserve offset area and plot locations.
Legend_̂ Plot Locations including FVS (refer to white text)
Offset Boundary
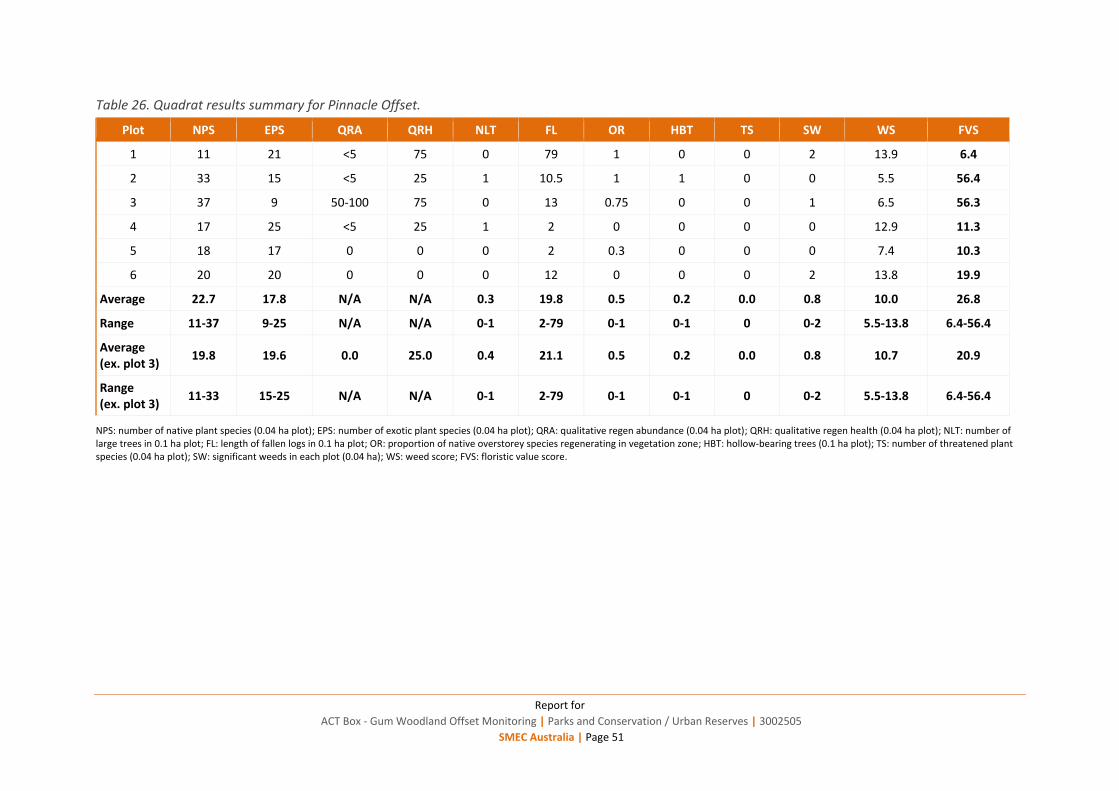
Report for
ACT Box - Gum Woodland Offset Monitoring | Parks and Conservation / Urban Reserves | 3002505
SMEC Australia | Page 51
Table 26. Quadrat results summary for Pinnacle Offset.
Plot NPS EPS QRA QRH NLT FL OR HBT TS SW WS FVS
1 11 21 <5 75 0 79 1 0 0 2 13.9 6.4
2 33 15 <5 25 1 10.5 1 1 0 0 5.5 56.4
3 37 9 50-100 75 0 13 0.75 0 0 1 6.5 56.3
4 17 25 <5 25 1 2 0 0 0 0 12.9 11.3
5 18 17 0 0 0 2 0.3 0 0 0 7.4 10.3
6 20 20 0 0 0 12 0 0 0 2 13.8 19.9
Average 22.7 17.8 N/A N/A 0.3 19.8 0.5 0.2 0.0 0.8 10.0 26.8
Range 11-37 9-25 N/A N/A 0-1 2-79 0-1 0-1 0 0-2 5.5-13.8 6.4-56.4
Average (ex. plot 3)
19.8 19.6 0.0 25.0 0.4 21.1 0.5 0.2 0.0 0.8 10.7 20.9
Range (ex. plot 3)
11-33 15-25 N/A N/A 0-1 2-79 0-1 0-1 0 0-2 5.5-13.8 6.4-56.4
NPS: number of native plant species (0.04 ha plot); EPS: number of exotic plant species (0.04 ha plot); QRA: qualitative regen abundance (0.04 ha plot); QRH: qualitative regen health (0.04 ha plot); NLT: number of large trees in 0.1 ha plot; FL: length of fallen logs in 0.1 ha plot; OR: proportion of native overstorey species regenerating in vegetation zone; HBT: hollow-bearing trees (0.1 ha plot); TS: number of threatened plant species (0.04 ha plot); SW: significant weeds in each plot (0.04 ha); WS: weed score; FVS: floristic value score.

Report for
ACT Box - Gum Woodland Offset Monitoring | Parks and Conservation / Urban Reserves | 3002505
SMEC Australia | Page 52
Table 27. Transect results summary for Pinnacle Offset.
NOS: native overstorey cover (50 m transect); NMS: native midstorey cover (50 m transect); NGCG: native ground cover – grasses (50 m transect); NGCS: native ground cover – subshrubs (50 m transect); NGCO: native ground cover – ‘other’ (50 m transect); ECAG: exotic annual cover - grasses (50 m transect); ECPG: exotic perennial cover - grasses (50 m transect); ECO: exotic cover- ‘other’ (50 m transect); LXW: level X weeds (50 m transect); L: litter (50 m transect); R: rock (50 m transect); BG: bare ground (50 m transect); C: cryptogram (50 m transect).
Plot NOS NMS NGCG NGCS NGCO ECAG ECPG ECO LXW L R BG C
1 1 0 20 0 18 46 26 38 0 12 0 4 0
2 3.5 3 90 0 2 26 0 6 0 8 2 0 8
3 7.5 0 34 0 34 6 0 12 0 12 38 12 38
4 5.5 0 32 0 8 42 2 44 2 4 16 0 6
5 7.5 0 34 0 2 24 6 32 0 0 10 2 4
6 0 0 74 0 8 26 2 2 0 0 2 18 2
Average 4.2 0.5 47.3 0.0 12.0 28.3 6.0 22.3 0.3 6.0 11.3 6.0 9.7
Range 0-7.5 0-3 20-90 0 2-34 6-46 0-26 2-44 0-2 0-12 0-38 0-18 0-38
Average (ex. plot 3) 3.5 0.6 50 0 7.6 32.8 7.2 24.4 0.4 4.8 6 4.8 4
Range (ex. plot 3) 0-7.5 0-3 20-74 0 2-18 24-46 0-26 2-44 0-2 0-12 0-16 0-18 0-8
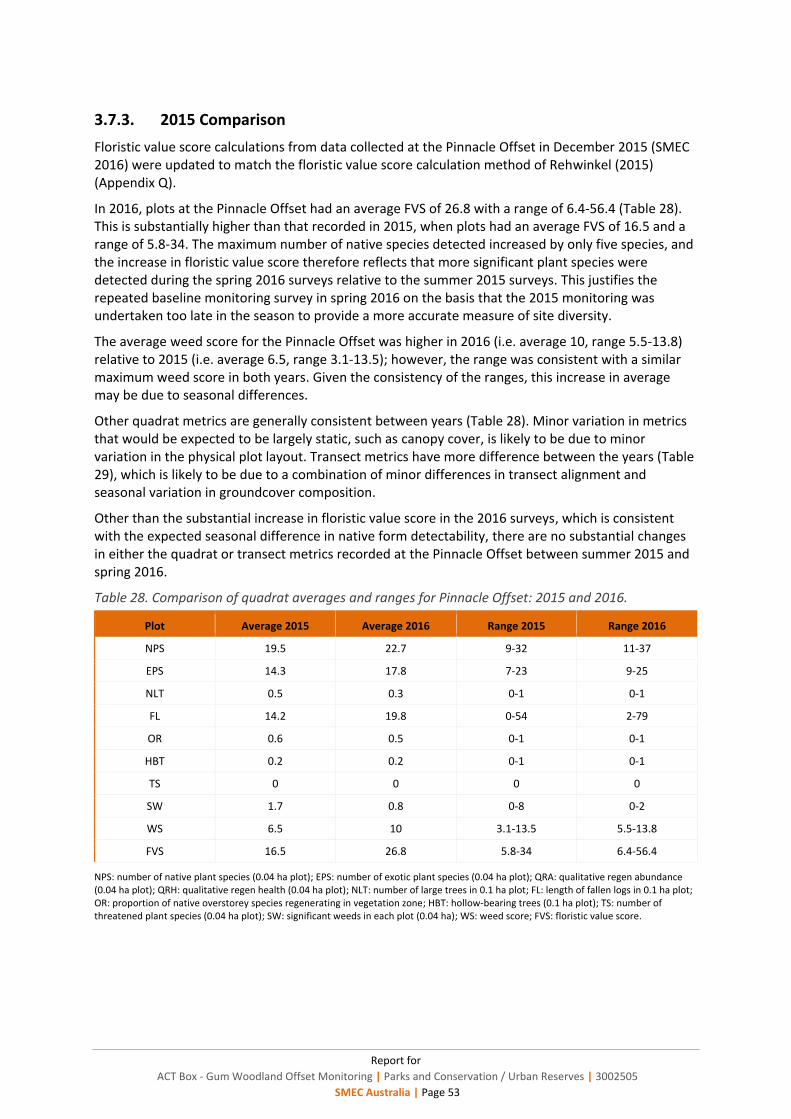
Report for
ACT Box - Gum Woodland Offset Monitoring | Parks and Conservation / Urban Reserves | 3002505
SMEC Australia | Page 53
3.7.3. 2015 Comparison
Floristic value score calculations from data collected at the Pinnacle Offset in December 2015 (SMEC 2016) were updated to match the floristic value score calculation method of Rehwinkel (2015) (Appendix Q).
In 2016, plots at the Pinnacle Offset had an average FVS of 26.8 with a range of 6.4-56.4 (Table 28). This is substantially higher than that recorded in 2015, when plots had an average FVS of 16.5 and a range of 5.8-34. The maximum number of native species detected increased by only five species, and the increase in floristic value score therefore reflects that more significant plant species were detected during the spring 2016 surveys relative to the summer 2015 surveys. This justifies the repeated baseline monitoring survey in spring 2016 on the basis that the 2015 monitoring was undertaken too late in the season to provide a more accurate measure of site diversity.
The average weed score for the Pinnacle Offset was higher in 2016 (i.e. average 10, range 5.5-13.8) relative to 2015 (i.e. average 6.5, range 3.1-13.5); however, the range was consistent with a similar maximum weed score in both years. Given the consistency of the ranges, this increase in average may be due to seasonal differences.
Other quadrat metrics are generally consistent between years (Table 28). Minor variation in metrics that would be expected to be largely static, such as canopy cover, is likely to be due to minor variation in the physical plot layout. Transect metrics have more difference between the years (Table 29), which is likely to be due to a combination of minor differences in transect alignment and seasonal variation in groundcover composition.
Other than the substantial increase in floristic value score in the 2016 surveys, which is consistent with the expected seasonal difference in native form detectability, there are no substantial changes in either the quadrat or transect metrics recorded at the Pinnacle Offset between summer 2015 and spring 2016.
Table 28. Comparison of quadrat averages and ranges for Pinnacle Offset: 2015 and 2016.
Plot Average 2015 Average 2016 Range 2015 Range 2016
NPS 19.5 22.7 9-32 11-37
EPS 14.3 17.8 7-23 9-25
NLT 0.5 0.3 0-1 0-1
FL 14.2 19.8 0-54 2-79
OR 0.6 0.5 0-1 0-1
HBT 0.2 0.2 0-1 0-1
TS 0 0 0 0
SW 1.7 0.8 0-8 0-2
WS 6.5 10 3.1-13.5 5.5-13.8
FVS 16.5 26.8 5.8-34 6.4-56.4
NPS: number of native plant species (0.04 ha plot); EPS: number of exotic plant species (0.04 ha plot); QRA: qualitative regen abundance (0.04 ha plot); QRH: qualitative regen health (0.04 ha plot); NLT: number of large trees in 0.1 ha plot; FL: length of fallen logs in 0.1 ha plot; OR: proportion of native overstorey species regenerating in vegetation zone; HBT: hollow-bearing trees (0.1 ha plot); TS: number of threatened plant species (0.04 ha plot); SW: significant weeds in each plot (0.04 ha); WS: weed score; FVS: floristic value score.

Report for
ACT Box - Gum Woodland Offset Monitoring | Parks and Conservation / Urban Reserves | 3002505
SMEC Australia | Page 54
Table 29. Comparison of transect averages and ranges for Pinnacle Offset: 2015 and 2016.
Plot Average 2015 Average 2016 Range 2015 Range 2016
NOS 5.5 4.2 0-27.5 0-7.5
NMS 0 0.5 0 0-3
NGCG 49 47.3 26-68 20-90
NGCS 0 0 0 0
NGCO 7.4 12 0-28 2-34
NOS: native overstorey cover (50 m transect); NMS: native midstorey cover (50 m transect); NGCG: native ground cover – grasses (50 m transect); NGCS: native ground cover – subshrubs (50 m transect); NGCO: native ground cover – ‘other’ (50 m transect).
3.7.4. Recommendations
The following management is recommended for the Pinnacle Offset:
Control woody weeds and serrated tussock throughout the site
Control exotic perennial grasses, phalaris and tall fescue, throughout higher value areas
Minimise grazing for biomass control purposes during spring and summer
Plant trees on the degraded higher slopes where regeneration is absent.

Report for
ACT Box - Gum Woodland Offset Monitoring | Parks and Conservation / Urban Reserves | 3002505
SMEC Australia | Page 55
4. Conclusion
The ACT Government required monitoring of box – gum woodland floristic diversity and condition for the following box – gum woodland offset areas in the ACT:
Throsby Offset, including Throsby North, Throsby East and Kenny Broadacre
Kinlyside Offset
Kenny Offset
North Gungahlin Offset
Isaacs Ridge Offset
Justice Robert Hope Park Offset
The Pinnacle Offset.
Data was collected at each of the reserves using consistent procedures and protocols (ACT Government 2015a), as required under the Commonwealth approval conditions, and relevant management plans for the offset areas.
Floristic monitoring undertaken in 2016 was undertaken between September and November 2016 with ideal survey conditions at all sites.
The floristic value scores and conservation value for each offset area is presented in Table 30. Three offset sites, i.e. Throsby, Kenny and Justice Robert Hope Park had average floristic score values less than 10 indicating that these sites have low conservation value based on groundcover floristic diversity. All other sites, i.e. Kinlyside, North Gungahlin, Isaacs Ridge and the Pinnacle had average floristic value scores between 15 and 30, indicating that these sites have moderate to very high conservation values based on groundcover floristic diversity. There was a high degree of variation in floristic condition between plots at all sites. Detailed monitoring data is summarised in the relevant sections to enable comparison with future years of monitoring.
The key management recommendations are:
Manage weeds at all sites, taking into account the following:
All contractors or community group members undertaking weed control activities should be trained in recognition of weeds and desirable native species
Consider removal of additional invasive perennial grass species such as Chilean needlegrass (Nassella neesiana), phalaris (Phalaris aquatica), paspalum (Paspalum dilatatum) and tall fescue (Festuca arundinacea) where present in high value areas
Plant trees or assist natural regeneration in landscapes where regeneration is absent from large areas or there is no source population. This is particularly relevant to the Throsby Offset.
Trial thinning of dense Blakely’s red gum (Eucalyptus blakelyi) regeneration where it appears to be having a detrimental impact on tree health
Manage vertebrate pests where woody debris has been placed
Manage stock grazing intensity, where required due to leasing or biomass management arrangements, is sufficiently low during spring and summer to enable recruitment of native forbs and grasses. A review of grazing intensity is particularly relevant for Kinlyside Nature Reserve.
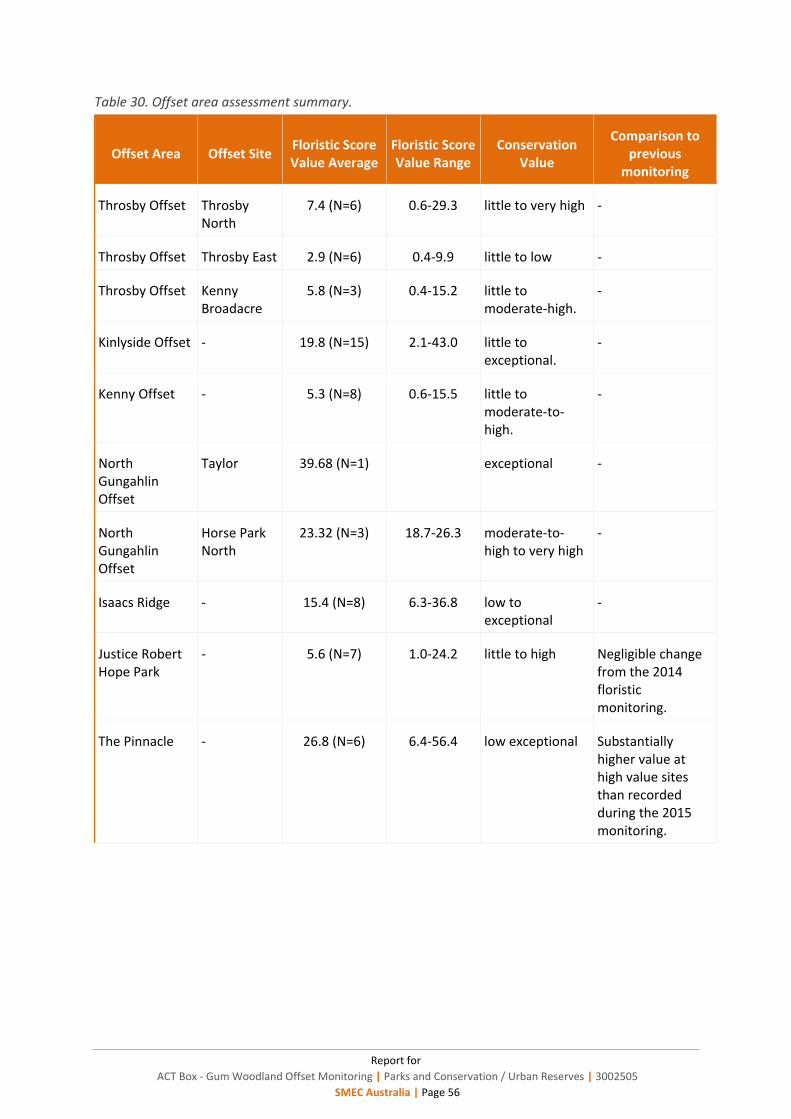
Report for
ACT Box - Gum Woodland Offset Monitoring | Parks and Conservation / Urban Reserves | 3002505
SMEC Australia | Page 56
Table 30. Offset area assessment summary.
Offset Area Offset Site Floristic Score Value Average
Floristic Score Value Range
Conservation Value
Comparison to previous
monitoring
Throsby Offset Throsby North
7.4 (N=6) 0.6-29.3 little to very high -
Throsby Offset Throsby East 2.9 (N=6) 0.4-9.9 little to low -
Throsby Offset Kenny Broadacre
5.8 (N=3) 0.4-15.2 little to moderate-high.
-
Kinlyside Offset - 19.8 (N=15) 2.1-43.0 little to exceptional.
-
Kenny Offset - 5.3 (N=8) 0.6-15.5 little to moderate-to-high.
-
North Gungahlin Offset
Taylor 39.68 (N=1) exceptional -
North Gungahlin Offset
Horse Park North
23.32 (N=3) 18.7-26.3 moderate-to-high to very high
-
Isaacs Ridge - 15.4 (N=8) 6.3-36.8 low to exceptional
-
Justice Robert Hope Park
- 5.6 (N=7) 1.0-24.2 little to high Negligible change from the 2014 floristic monitoring.
The Pinnacle - 26.8 (N=6) 6.4-56.4 low exceptional Substantially higher value at high value sites than recorded during the 2015 monitoring.

Report for
ACT Box - Gum Woodland Offset Monitoring | Parks and Conservation / Urban Reserves | 3002505
SMEC Australia | Page 57
5. References
ACT Government (2015a). ACT Environmental Offsets Calculator Operational Manual. Environment and Planning Directorate – Environment. Canberra.
ACT Government (2015b). Extension to the Mulligans Flat and Goorooyarroo Nature Reserves. Offset Management Plan (For the Throsby North, Throsby East and Kenny Broadacre Offset Areas). Territory and Municipal Services Directorate. Canberra.
ACT Government (2015c). Kinlyside Nature Reserve and Offset Area. Offset Management Plan. Territory and Municipal Services Directorate. Canberra.
ACT Government (2015d). Isaacs Ridge Nature Reserve Extension. Offset Management Plan. Umwelt Pty Ltd and Territory and Municipal Services Directorate. Canberra.
ACT Government (2016). Offset Management Plan for the Extension of the Pinnacle Nature Reserve. Parks and Conservation Service. Canberra.
Conservation Research (2015). Monitoring Guidelines for Box-Gum Woodland. Environment and Sustainable Development Directorate, Canberra.
RJPL (2015). Justice Robert Hope Park 2014 Environmental Monitoring Report. Report prepared for Parks and Conservation Service, Territory and Municipal Services Directorate. Canberra.
SMEC (2016). Pinnacle Nature Reserve Offset 2015 Monitoring Report. Report prepared for Parks and Conservation Service / Urban Reserves, Territory and Municipal Services Directorate. Canberra.
Umwelt (2012) Ecological Assessment of Proposed Offset Site for the Mugga Lane Resource Management Centre. Report prepared for ACT NoWaste, Canberra.

Report for
ACT Box - Gum Woodland Offset Monitoring | Parks and Conservation / Urban Reserves | 3002505
SMEC Australia | Page 58

Report for
ACT Box - Gum Woodland Offset Monitoring | Parks and Conservation / Urban Reserves | 3002505
SMEC Australia | Page 59
Appendices
Appendix A Vegetation Benchmarks
Appendix B Throsby Plot Locations
Appendix C Throsby Vegetation Survey Results 2016
Appendix D Kinlyside Plot Locations
Appendix E Kinlyside Vegetation Survey Results 2016
Appendix F Kenny Plot Locations
Appendix G Kenny Vegetation Survey Results 2016
Appendix H North Gungahlin Plot Locations
Appendix I North Gungahlin Vegetation Survey Results 2016
Appendix J Isaacs Ridge Plot Locations
Appendix K Isaacs Ridge Vegetation Survey Results 2016
Appendix L Justice Robert Hope Park Plot Locations
Appendix M Justice Robert Hope Park Vegetation Survey Results 2016
Appendix N Justice Robert Hope Park Updated 2014 Floristic Score Values
Appendix O Pinnacle Nature Reserve Offset Plot Locations
Appendix P Pinnacle Nature Reserve Offset Vegetation Survey Results 2016
Appendix Q Pinnacle Nature Reserve Offset Updated 2015 Floristic Score Values

Report for
ACT Box - Gum Woodland Offset Monitoring | Parks and Conservation / Urban Reserves | 3002505
SMEC Australia
Appendix A Vegetation Benchmarks
Vegetation type
Richness IPS (No. of
spp.)
Lower NOSMin (% PFC)
Upper NOSMax (% PFC)
Lower NMSMin (% PFC)
Upper NMSMax (% PFC)
Lower NGCGMin
(% PFC)
Upper NGCGMax
(% PFC)
Lower NGCSMin (% PFC)
Upper NGCSMax
(% PFC)
Lower NGCOMin
(% PFC)
Upper NGCOMax
(% PFC) NLT
Total length (FL)
(m)
Eucalyptus melliodora – E. blakelyi Tableland Grassy Woodland
35 11 32 0 12.5 23 63 0 4.5 8 16.5 5 35
Eucalyptus macrorhyncha Tableland Grass / Shrub Forest
29 20 36 2 10 14 40 6 22 4 15 20 36
Note Exotic plant cover is calculated as the percentage of total ground and mid-storey cover. Acronyms NOS Native Over-Storey NMS Native Mid-Storey NGCG Native Ground Cover Grasses NGCS Native Ground Cover Shrubs NGCO Native Ground Cover Other PFC Percent Foliage Cover IPS Indigenous Plant Species EEC Ecologically Endangered Community FL Fallen Logs (≥10 cm dia and ≥0.5 m long) NLT Number of Large Trees (Circumference ≥150 cm @ 1 m above ground OR hollow ≥5 cm wide @ ≥1 m above ground.
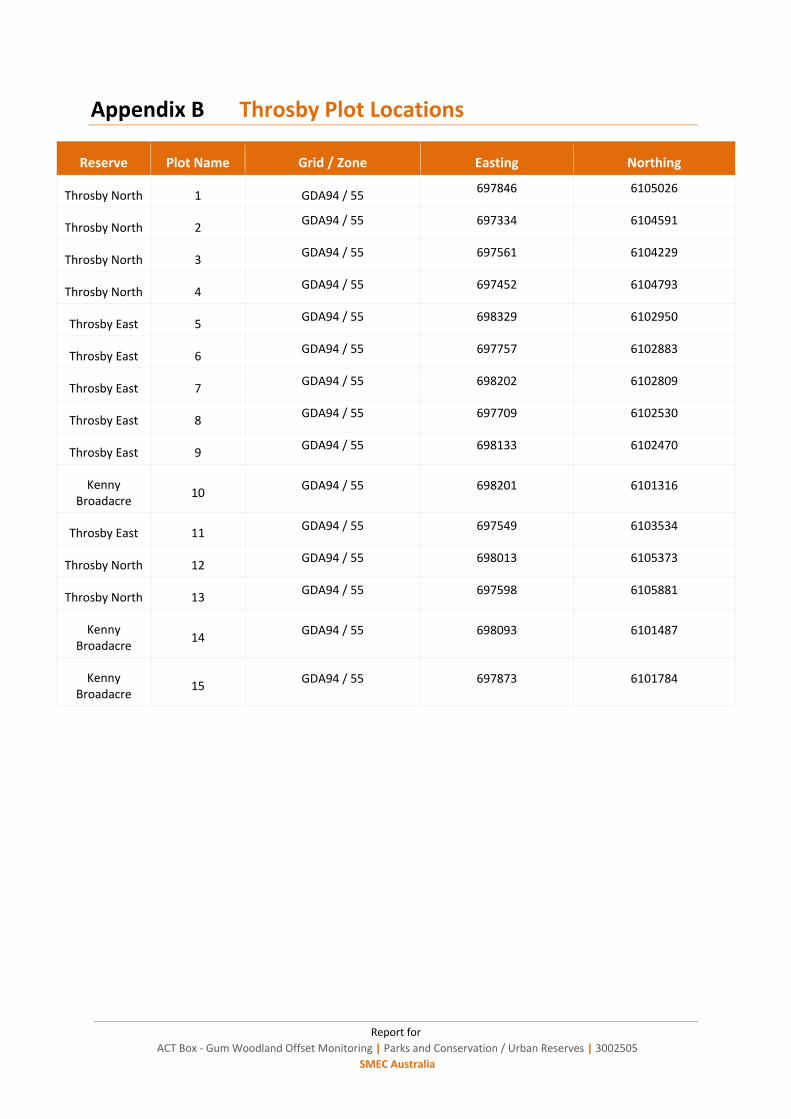
Report for
ACT Box - Gum Woodland Offset Monitoring | Parks and Conservation / Urban Reserves | 3002505
SMEC Australia
Appendix B Throsby Plot Locations
Reserve Plot Name Grid / Zone Easting Northing
Throsby North 1 GDA94 / 55 697846 6105026
Throsby North 2 GDA94 / 55 697334 6104591
Throsby North 3 GDA94 / 55 697561 6104229
Throsby North 4 GDA94 / 55 697452 6104793
Throsby East 5 GDA94 / 55 698329 6102950
Throsby East 6 GDA94 / 55 697757 6102883
Throsby East 7 GDA94 / 55 698202 6102809
Throsby East 8 GDA94 / 55 697709 6102530
Throsby East 9 GDA94 / 55 698133 6102470
Kenny Broadacre
10 GDA94 / 55 698201 6101316
Throsby East 11 GDA94 / 55 697549 6103534
Throsby North 12 GDA94 / 55 698013 6105373
Throsby North 13 GDA94 / 55 697598 6105881
Kenny Broadacre
14 GDA94 / 55 698093 6101487
Kenny Broadacre
15 GDA94 / 55 697873 6101784

Report for
ACT Box - Gum Woodland Offset Monitoring | Parks and Conservation / Urban Reserves | 3002505
SMEC Australia
Appendix C Throsby Vegetation Survey Results 2016
Complete flora list for each plot and abundance score for each species within the 20 m x 20 m plots.
Species Native/Exotic 1 2 3 4 5 6 7 8 9 10 11 12 13 14 15
Exotic species
Acetosella vulgaris E 3 1 3 2 4 3 2 3 4 3
Aira sp. E 3
Arctotheca calendula E 2 3 4 5 3 3 3 2 4 4 3 4 3
Avena sp. E 2 4 3 3 3 4 3 3 3
Briza maxima E 2
Bromus sp. E 5
Carthamus lanatus E 1
Cerastium sp. E 3
Cirsium vulgare E 1 2 2
Echium plantagineum E 4 3
Eleusine tristachya E 3 2
Erodium cicutarium E 2 4 3 3 4 3 3
Erodium brachycarpum
E 2 3 3 4 3 2
Festuca arundinacea E 1 2 5
Gamochaeta americana
E 1
Holcus lanatus E 2 3 4 4 3 3
Hordeum sp. E 6 7 7
Hypochaeris glabra E 3 2 3 3 3 3 4
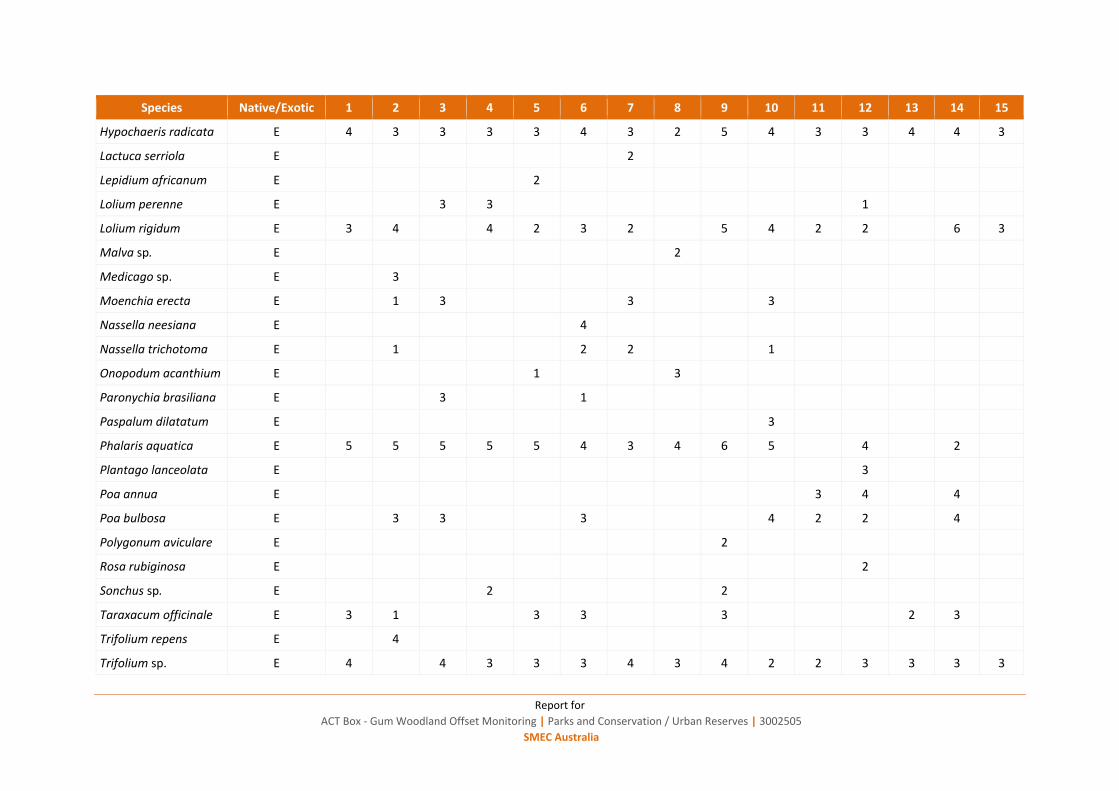
Report for
ACT Box - Gum Woodland Offset Monitoring | Parks and Conservation / Urban Reserves | 3002505
SMEC Australia
Species Native/Exotic 1 2 3 4 5 6 7 8 9 10 11 12 13 14 15
Hypochaeris radicata E 4 3 3 3 3 4 3 2 5 4 3 3 4 4 3
Lactuca serriola E 2
Lepidium africanum E 2
Lolium perenne E 3 3 1
Lolium rigidum E 3 4 4 2 3 2 5 4 2 2 6 3
Malva sp. E 2
Medicago sp. E 3
Moenchia erecta E 1 3 3 3
Nassella neesiana E 4
Nassella trichotoma E 1 2 2 1
Onopodum acanthium E 1 3
Paronychia brasiliana E 3 1
Paspalum dilatatum E 3
Phalaris aquatica E 5 5 5 5 5 4 3 4 6 5 4 2
Plantago lanceolata E 3
Poa annua E 3 4 4
Poa bulbosa E 3 3 3 4 2 2 4
Polygonum aviculare E 2
Rosa rubiginosa E 2
Sonchus sp. E 2 2
Taraxacum officinale E 3 1 3 3 3 2 3
Trifolium repens E 4
Trifolium sp. E 4 4 3 3 3 4 3 4 2 2 3 3 3 3
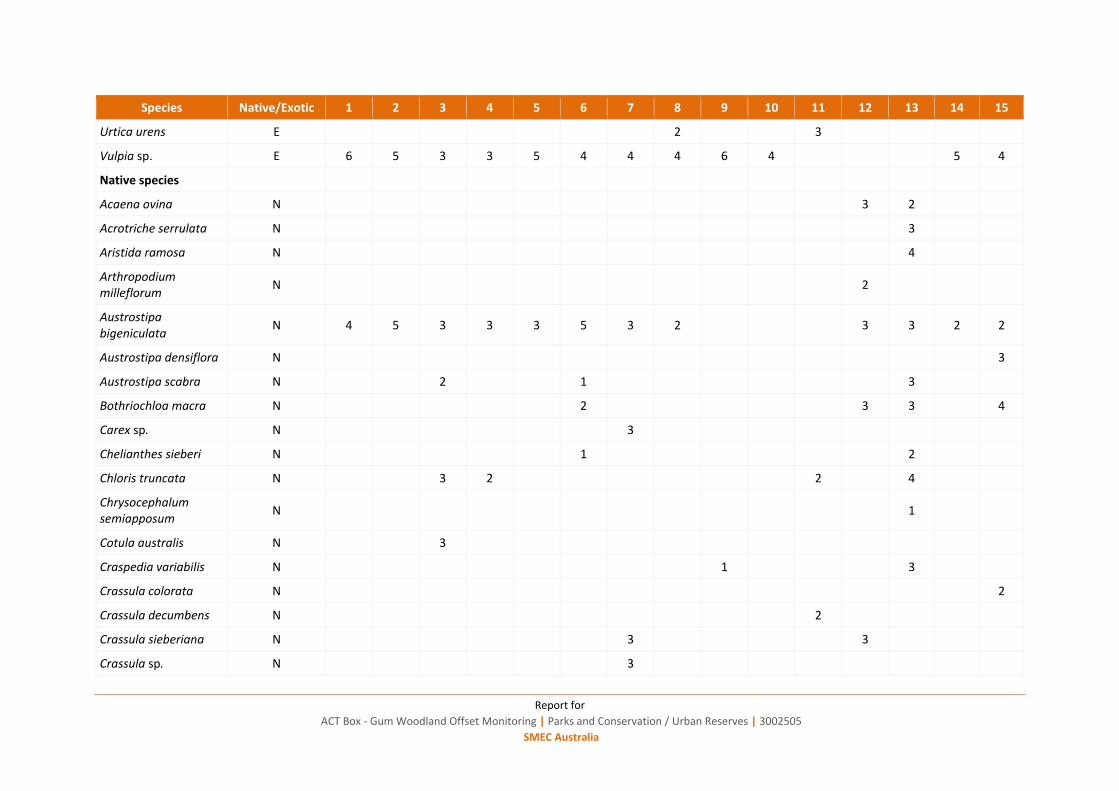
Report for
ACT Box - Gum Woodland Offset Monitoring | Parks and Conservation / Urban Reserves | 3002505
SMEC Australia
Species Native/Exotic 1 2 3 4 5 6 7 8 9 10 11 12 13 14 15
Urtica urens E 2 3
Vulpia sp. E 6 5 3 3 5 4 4 4 6 4 5 4
Native species
Acaena ovina N 3 2
Acrotriche serrulata N 3
Aristida ramosa N 4
Arthropodium milleflorum
N 2
Austrostipa bigeniculata
N 4 5 3 3 3 5 3 2 3 3 2 2
Austrostipa densiflora N 3
Austrostipa scabra N 2 1 3
Bothriochloa macra N 2 3 3 4
Carex sp. N 3
Chelianthes sieberi N 1 2
Chloris truncata N 3 2 2 4
Chrysocephalum semiapposum
N 1
Cotula australis N 3
Craspedia variabilis N 1 3
Crassula colorata N 2
Crassula decumbens N 2
Crassula sieberiana N 3 3
Crassula sp. N 3
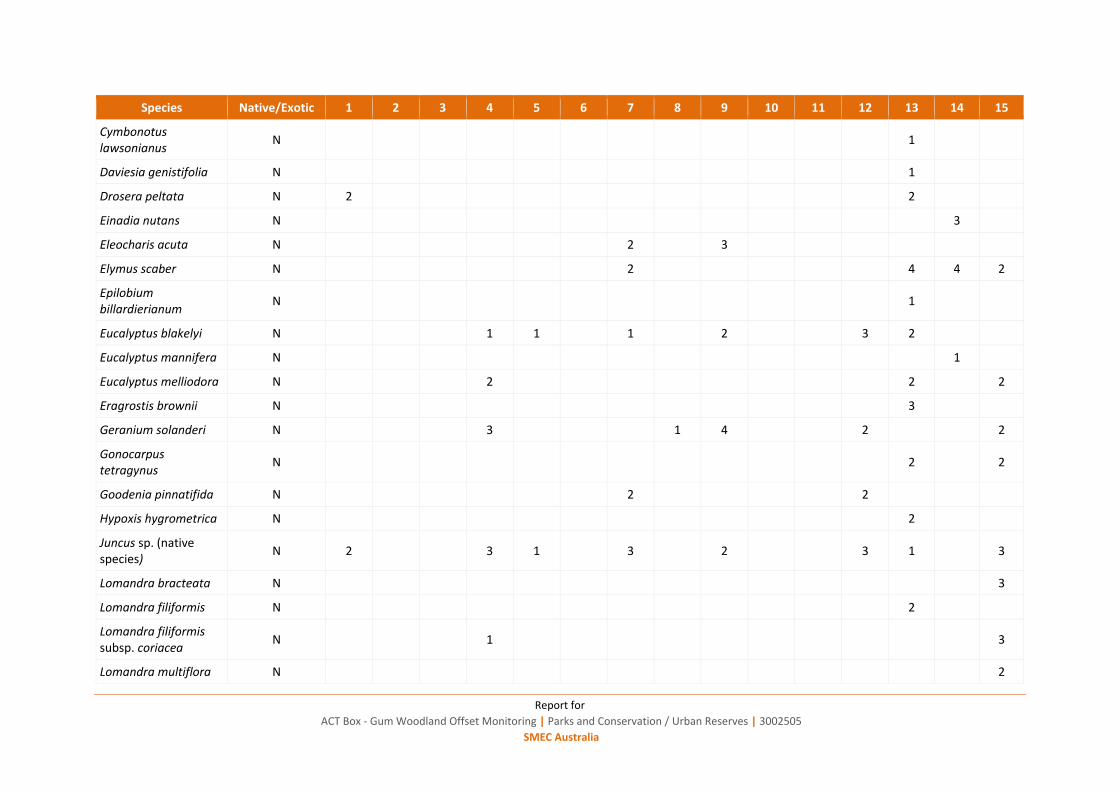
Report for
ACT Box - Gum Woodland Offset Monitoring | Parks and Conservation / Urban Reserves | 3002505
SMEC Australia
Species Native/Exotic 1 2 3 4 5 6 7 8 9 10 11 12 13 14 15
Cymbonotus lawsonianus
N 1
Daviesia genistifolia N 1
Drosera peltata N 2 2
Einadia nutans N 3
Eleocharis acuta N 2 3
Elymus scaber N 2 4 4 2
Epilobium billardierianum
N 1
Eucalyptus blakelyi N 1 1 1 2 3 2
Eucalyptus mannifera N 1
Eucalyptus melliodora N 2 2 2
Eragrostis brownii N 3
Geranium solanderi N 3 1 4 2 2
Gonocarpus tetragynus
N 2 2
Goodenia pinnatifida N 2 2
Hypoxis hygrometrica N 2
Juncus sp. (native species)
N 2 3 1 3 2 3 1 3
Lomandra bracteata N 3
Lomandra filiformis N 2
Lomandra filiformis subsp. coriacea
N 1 3
Lomandra multiflora N 2

Report for
ACT Box - Gum Woodland Offset Monitoring | Parks and Conservation / Urban Reserves | 3002505
SMEC Australia
Species Native/Exotic 1 2 3 4 5 6 7 8 9 10 11 12 13 14 15
Microlaena stipoides N 3 4 3 4 3 4 4
Microtis unifolia N 3
Oxalis perennans N 3 3 2 2 3 2 1 3
Panicum effusum N 2 4 2 3 2 3
Poa labillardierei N 1 1 2
Poa sieberiana N 2 2
Ranunculus sp. N 3 3
Rumex brownii N 3 3 2 1 3 2 4 2 2
Rytidosperma sp. N 3 5 3 3 5 4 3 4 6 6 5
Solengyne dominie N 3
Themeda australis N 3 4 4
Tricoryne elatior N 2
Triptilodiscus pygmaeus
N 1
Vittadinia muelleri N 2
Wurmbea dioica N 2 1

Report for
ACT Box - Gum Woodland Offset Monitoring | Parks and Conservation / Urban Reserves | 3002505
SMEC Australia
Appendix D Kinlyside Plot Locations
Reserve Plot Name Datum / Zone Easting Northing
Kinlyside 1 GDA94 / 55 690193 6107772
Kinlyside 2 GDA94 / 55 689779 6106364
Kinlyside 3 GDA94 / 55 689773 6106497
Kinlyside 4 GDA94 / 55 690423 6107859
Kinlyside 5 GDA94 / 55 689798 6107040
Kinlyside 6 GDA94 / 55 690229 6107062
Kinlyside 7 GDA94 / 55 689591 6105626
Kinlyside 8 GDA94 / 55 689517 6105721
Kinlyside 9 GDA94 / 55 689472 6105968
Kinlyside 10 GDA94 / 55 689853 6106084
Kinlyside 11 GDA94 / 55 690451 6106461
Kinlyside 12 GDA94 / 55 690214 6106722
Kinlyside 13 GDA94 / 55 689286 6106934
Kinlyside 14 GDA94 / 55 689829 6107478
Kinlyside 15 GDA94 / 55 690560 6107426
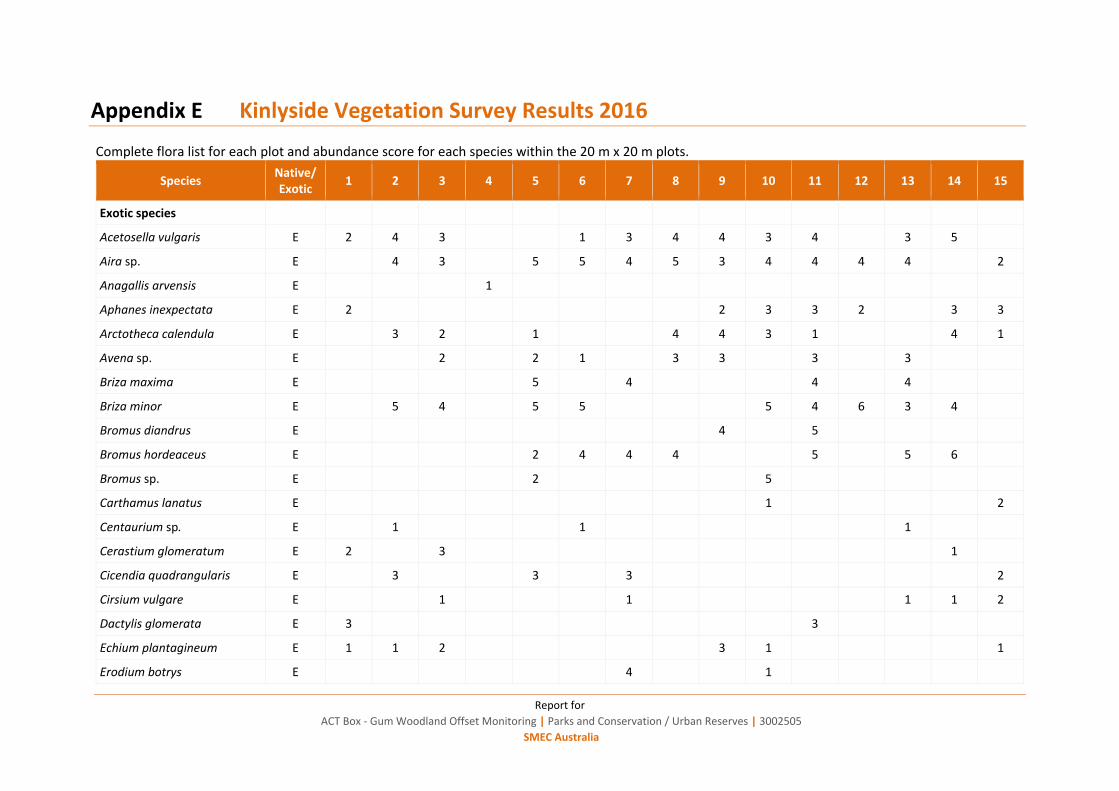
Report for
ACT Box - Gum Woodland Offset Monitoring | Parks and Conservation / Urban Reserves | 3002505
SMEC Australia
Appendix E Kinlyside Vegetation Survey Results 2016
Complete flora list for each plot and abundance score for each species within the 20 m x 20 m plots.
Species Native/ Exotic
1 2 3 4 5 6 7 8 9 10 11 12 13 14 15
Exotic species
Acetosella vulgaris E 2 4 3 1 3 4 4 3 4 3 5
Aira sp. E 4 3 5 5 4 5 3 4 4 4 4 2
Anagallis arvensis E 1
Aphanes inexpectata E 2 2 3 3 2 3 3
Arctotheca calendula E 3 2 1 4 4 3 1 4 1
Avena sp. E 2 2 1 3 3 3 3
Briza maxima E 5 4 4 4
Briza minor E 5 4 5 5 5 4 6 3 4
Bromus diandrus E 4 5
Bromus hordeaceus E 2 4 4 4 5 5 6
Bromus sp. E 2 5
Carthamus lanatus E 1 2
Centaurium sp. E 1 1 1
Cerastium glomeratum E 2 3 1
Cicendia quadrangularis E 3 3 3 2
Cirsium vulgare E 1 1 1 1 2
Dactylis glomerata E 3 3
Echium plantagineum E 1 1 2 3 1 1
Erodium botrys E 4 1

Report for
ACT Box - Gum Woodland Offset Monitoring | Parks and Conservation / Urban Reserves | 3002505
SMEC Australia
Species Native/ Exotic
1 2 3 4 5 6 7 8 9 10 11 12 13 14 15
Erodium cicutarium E 1 1 3 4 2 2 2
Holcus lanatus E 1 1 4 4 1 1 3
Hordeum sp. E 4 4 3
Hypericum perforatum E 3 2 4 2 1 2 1 1 2
Hypochaeris glabra E 3 4 3 4 4 4 4 3 3 3 3 1 3
Hypochaeris radicata E 4 3 5 3 2 3 3 3 4 4 3 3 3 3 4
Lepidium africanum E 2
Linaria pelisseriana E 1 2
Lolium perenne E 5 3 5 4 5 4 4 2 4
Lolium rigidum E 4 4 4 4 5 4 1 4 4 5 4
Modiola caroliniana E 2 1
Moenchia erecta E 3 3 3 3 2 3 3 3 3 3 2 1 3
Myostis discolour E 1 1 1 3 2
Nassella trichotoma E 2 1 2 1
Onopodum acanthium E 2
Parentucellia latifolia E 4 3 2 2 2 1 2 2 3
Paronychia brasiliana E 1 3 3
Petrorhagia nanteuilii E 1 2 3 3 3 2 2 3
Phalaris aquatica E 4 3 4 3
Plantago lanceolata E 2 1 2 3 1 1 1
Poa annua E 4 3 4 1
Poa bulbosa E 1 3 4 2 2 4 4
Rosa rubiginosa E 1 1 1 1 2 1 2 1 1 3 1

Report for
ACT Box - Gum Woodland Offset Monitoring | Parks and Conservation / Urban Reserves | 3002505
SMEC Australia
Species Native/ Exotic
1 2 3 4 5 6 7 8 9 10 11 12 13 14 15
Sherardia arvensis E 2 3 2 2
Silybum marianum E 1 2
Sonchus sp. E 1 1
Stellaria media E 2 3
Taraxacum officinale E 3 2 3
Tolpis barbata E 1
Trifolium arvense E 1 1 1 2 1
Trifolium campastre E 4 4 3 4 3 3 3 4 3 3 4 2
Trifolium repens E 3 3 4 3 5 4 4 3 3 3 4 4 3
Urtica sp. E 5
Vulpia sp. E 4 4 4 6 6 4 3 5 3 4 4
Native species
Acaena ovina N 1 1 2 2 4 1 2 1 2 3
Acrotriche serrulata N 2 1 3 3
Adiantum aethiopica N 1
Aristida ramosa N 3
Asperula conferta N 3 3 3 4 3 3 2 3 3 4
Asperula scoparia N 3
Austrostipa bigeniculata N 4 4 4 4 4
Austrostipa scabra N 4 5 4 4 4
Bothriochloa macra N 6 6 5 4 6 4 5 4 4 4 4 5
Brachloma daphnoides N 1
Bulbine bulbosa N 1 2 3 3
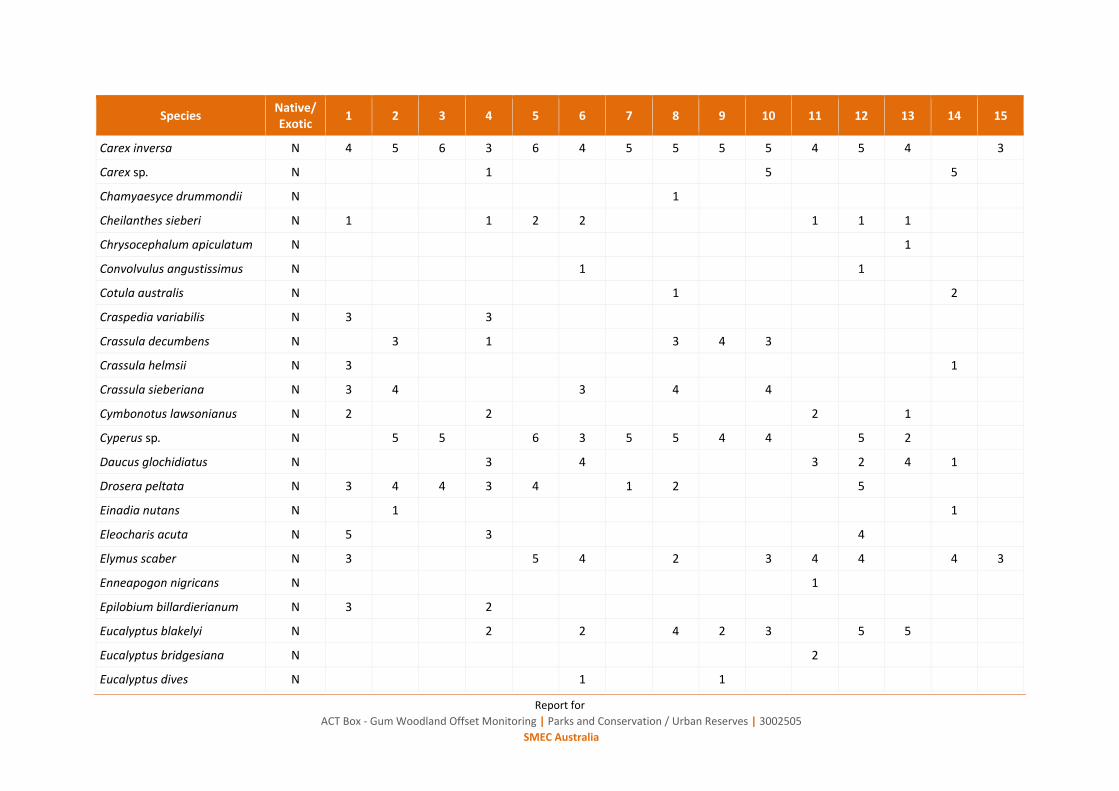
Report for
ACT Box - Gum Woodland Offset Monitoring | Parks and Conservation / Urban Reserves | 3002505
SMEC Australia
Species Native/ Exotic
1 2 3 4 5 6 7 8 9 10 11 12 13 14 15
Carex inversa N 4 5 6 3 6 4 5 5 5 5 4 5 4 3
Carex sp. N 1 5 5
Chamyaesyce drummondii N 1
Cheilanthes sieberi N 1 1 2 2 1 1 1
Chrysocephalum apiculatum N 1
Convolvulus angustissimus N 1 1
Cotula australis N 1 2
Craspedia variabilis N 3 3
Crassula decumbens N 3 1 3 4 3
Crassula helmsii N 3 1
Crassula sieberiana N 3 4 3 4 4
Cymbonotus lawsonianus N 2 2 2 1
Cyperus sp. N 5 5 6 3 5 5 4 4 5 2
Daucus glochidiatus N 3 4 3 2 4 1
Drosera peltata N 3 4 4 3 4 1 2 5
Einadia nutans N 1 1
Eleocharis acuta N 5 3 4
Elymus scaber N 3 5 4 2 3 4 4 4 3
Enneapogon nigricans N 1
Epilobium billardierianum N 3 2
Eucalyptus blakelyi N 2 2 4 2 3 5 5
Eucalyptus bridgesiana N 2
Eucalyptus dives N 1 1

Report for
ACT Box - Gum Woodland Offset Monitoring | Parks and Conservation / Urban Reserves | 3002505
SMEC Australia
Species Native/ Exotic
1 2 3 4 5 6 7 8 9 10 11 12 13 14 15
Eucalyptus macrorhyncha N 1 1 2 3
Eucalyptus melliodora N 1
Eucalyptus nortonii N 2
Euchiton sp. N 2 2 3 2 2 1 1 1 3 1 2 3
Euchiton sphaericus N 1 2 3
Galium sp. N 1
Geranium retrosum N 2 1
Geranium solanderi N 2 2 3 3 3 3 2
Glycine sp. N 1
Gonocarpus tetragynus N 2 4 2 2 2
Goodenia hederacea N 1 1
Haloragis heterophylla N 1 2 2
Hibbertia obtusifolia N 2 1
Hydrocotyle laxiflora N 2 2 2 3 3 3 3 2
Hypericum gramineum N 2 4 2 1 3 2
Hypoxis hygrometrica N 3 1 2
Juncus sp. (native species) N 2 1 2 1 2 1 1 1 1 2 2
Leptorhynchos squamatus N 4 3 4 3
Lomandra bracteata N 1
Lomandra filiformis N 1 1 2 1 3 3 2 3
Lomandra filiformis subsp. coriacea
N 2 2
Lomandra sp. N 2

Report for
ACT Box - Gum Woodland Offset Monitoring | Parks and Conservation / Urban Reserves | 3002505
SMEC Australia
Species Native/ Exotic
1 2 3 4 5 6 7 8 9 10 11 12 13 14 15
Luzula densiflora N 2 4 3 4 3 1
Melichrus urceolatus N 2 1 2
Microlaena stipoides N 5 3 4 4 4 4 4 5 6
Microseris lanceolata N 2
Microtis unifolia N 1 1 1 2 2 1
Ophioglossum lusitanicum N 2
Oxalis perennans N 1 2 2 2 2 2 2 2 3 3 1 3
Panicum effusum N 5 4 4 3 1 4 4 4
Plantago varia N 2 3 4
Poa labillardierei N 2
Poa sieberiana N 1 1 2
Poa sp. N 4 2
Rumex brownii N 1 1 1 1 1 1 1 4 1 1
Rytidosperma carphoides N 4
Rytidosperma pallidum N 2
Rytidosperma sp. N 3 4 5 4 5 4 4 4 5 5 5 5 5 3
Schleranthus diander N 3 4
Schoenus apogon N 5 4 1 4
Solenogyne dominii N 3 3 3 1 2 3 1 2
Sorghum leiocladum N 1
Stellaria pungens N 1
Stuartina muelleri N 2 2
Themeda australis N 5 5 6 5 6 1
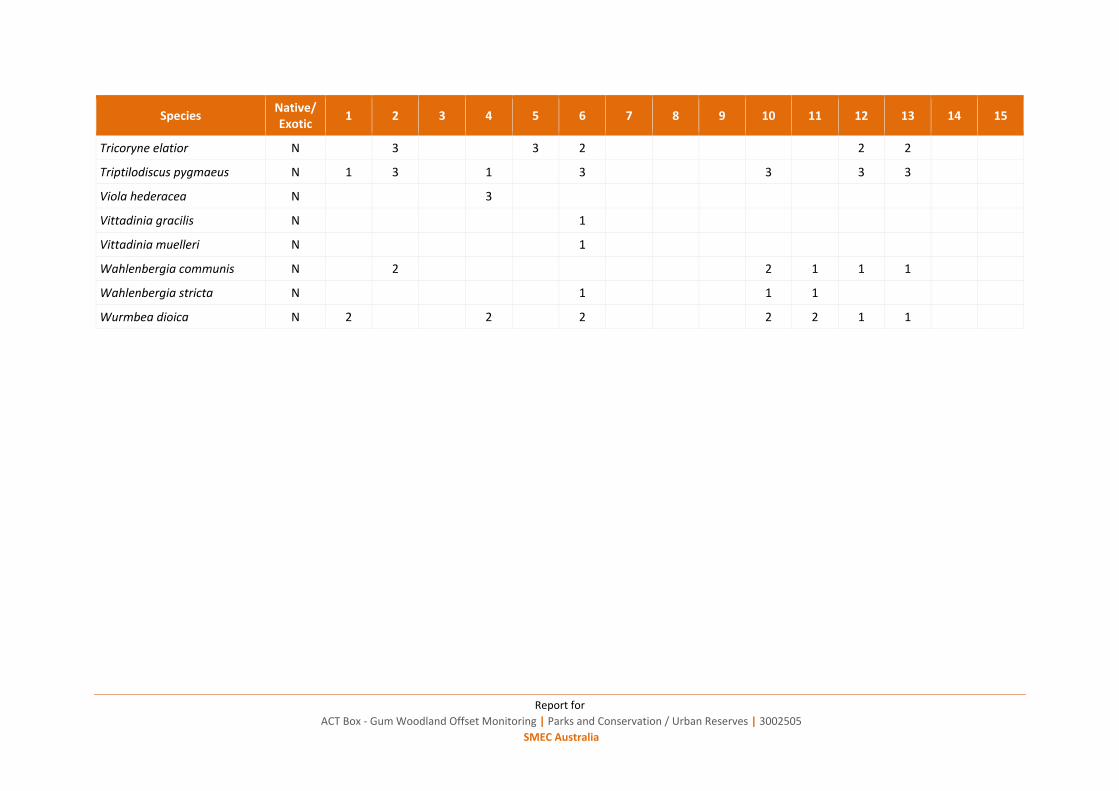
Report for
ACT Box - Gum Woodland Offset Monitoring | Parks and Conservation / Urban Reserves | 3002505
SMEC Australia
Species Native/ Exotic
1 2 3 4 5 6 7 8 9 10 11 12 13 14 15
Tricoryne elatior N 3 3 2 2 2
Triptilodiscus pygmaeus N 1 3 1 3 3 3 3
Viola hederacea N 3
Vittadinia gracilis N 1
Vittadinia muelleri N 1
Wahlenbergia communis N 2 2 1 1 1
Wahlenbergia stricta N 1 1 1
Wurmbea dioica N 2 2 2 2 2 1 1
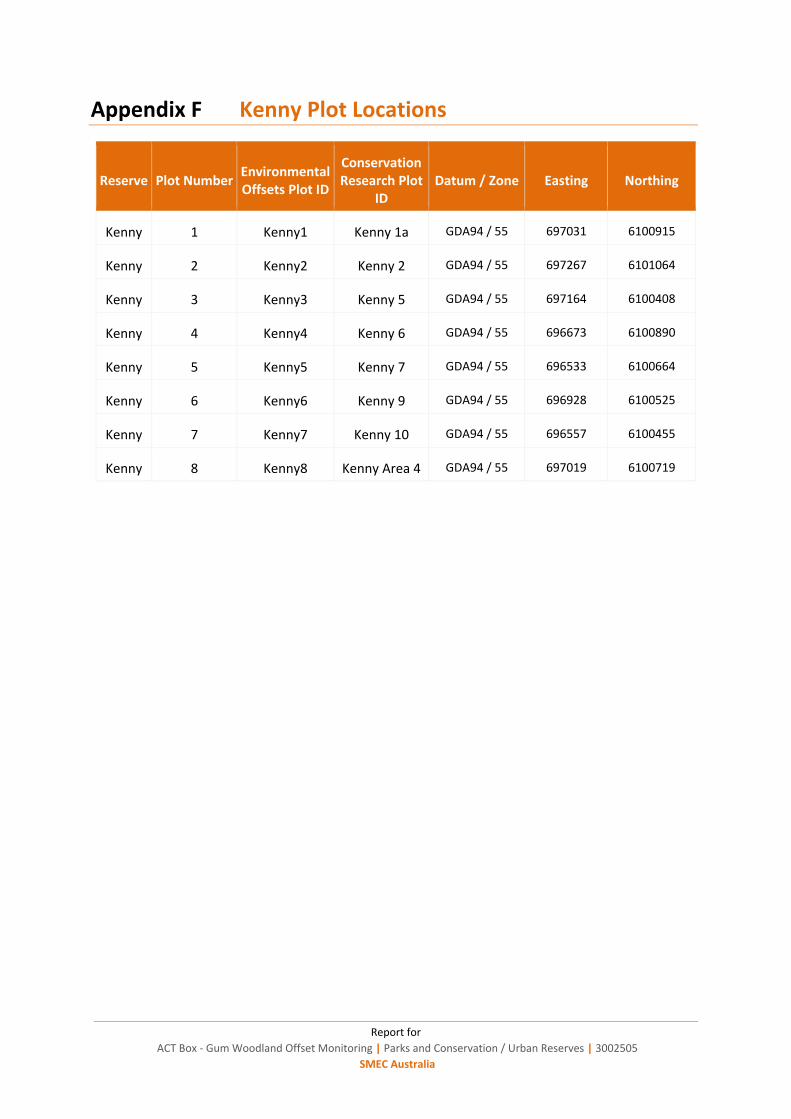
Report for
ACT Box - Gum Woodland Offset Monitoring | Parks and Conservation / Urban Reserves | 3002505
SMEC Australia
Appendix F Kenny Plot Locations
Reserve Plot Number Environmental Offsets Plot ID
Conservation Research Plot
ID Datum / Zone Easting Northing
Kenny 1 Kenny1 Kenny 1a GDA94 / 55 697031 6100915
Kenny 2 Kenny2 Kenny 2 GDA94 / 55 697267 6101064
Kenny 3 Kenny3 Kenny 5 GDA94 / 55 697164 6100408
Kenny 4 Kenny4 Kenny 6 GDA94 / 55 696673 6100890
Kenny 5 Kenny5 Kenny 7 GDA94 / 55 696533 6100664
Kenny 6 Kenny6 Kenny 9 GDA94 / 55 696928 6100525
Kenny 7 Kenny7 Kenny 10 GDA94 / 55 696557 6100455
Kenny 8 Kenny8 Kenny Area 4 GDA94 / 55 697019 6100719
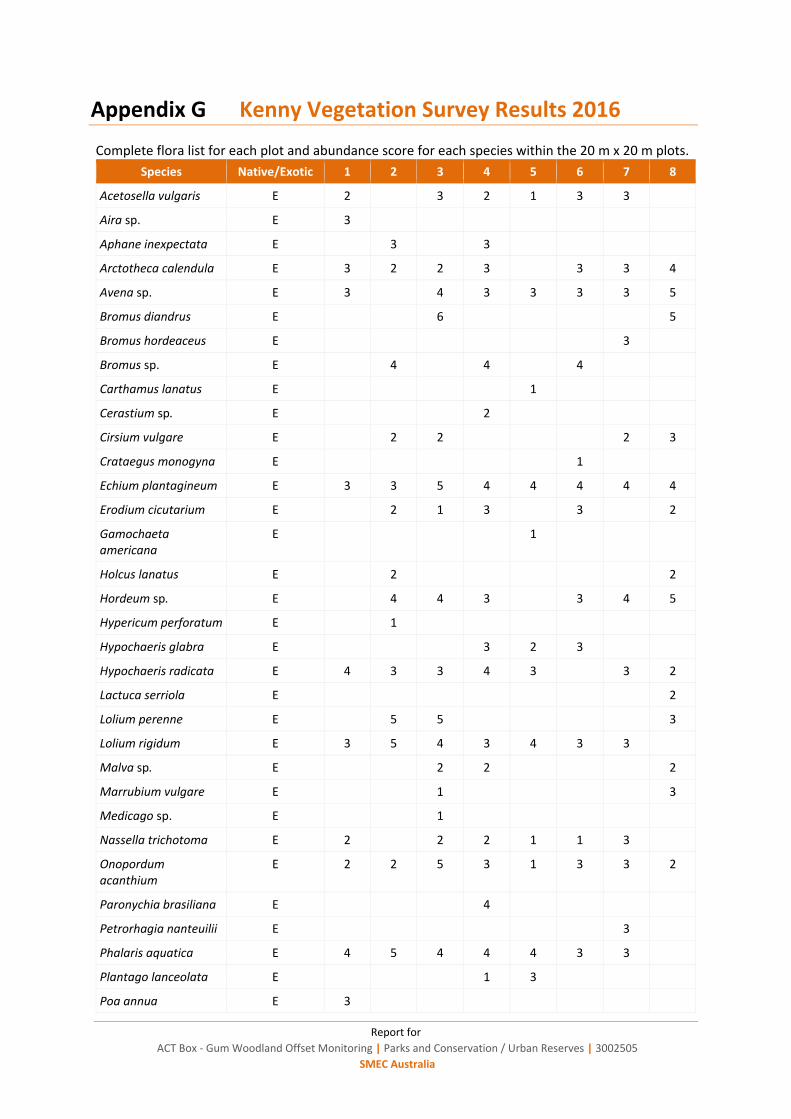
Report for
ACT Box - Gum Woodland Offset Monitoring | Parks and Conservation / Urban Reserves | 3002505
SMEC Australia
Appendix G Kenny Vegetation Survey Results 2016
Complete flora list for each plot and abundance score for each species within the 20 m x 20 m plots.
Species Native/Exotic 1 2 3 4 5 6 7 8
Acetosella vulgaris E 2 3 2 1 3 3
Aira sp. E 3
Aphane inexpectata E 3 3
Arctotheca calendula E 3 2 2 3 3 3 4
Avena sp. E 3 4 3 3 3 3 5
Bromus diandrus E 6 5
Bromus hordeaceus E 3
Bromus sp. E 4 4 4
Carthamus lanatus E 1
Cerastium sp. E 2
Cirsium vulgare E 2 2 2 3
Crataegus monogyna E 1
Echium plantagineum E 3 3 5 4 4 4 4 4
Erodium cicutarium E 2 1 3 3 2
Gamochaeta americana
E 1
Holcus lanatus E 2 2
Hordeum sp. E 4 4 3 3 4 5
Hypericum perforatum E 1
Hypochaeris glabra E 3 2 3
Hypochaeris radicata E 4 3 3 4 3 3 2
Lactuca serriola E 2
Lolium perenne E 5 5 3
Lolium rigidum E 3 5 4 3 4 3 3
Malva sp. E 2 2 2
Marrubium vulgare E 1 3
Medicago sp. E 1
Nassella trichotoma E 2 2 2 1 1 3
Onopordum acanthium
E 2 2 5 3 1 3 3 2
Paronychia brasiliana E 4
Petrorhagia nanteuilii E 3
Phalaris aquatica E 4 5 4 4 4 3 3
Plantago lanceolata E 1 3
Poa annua E 3
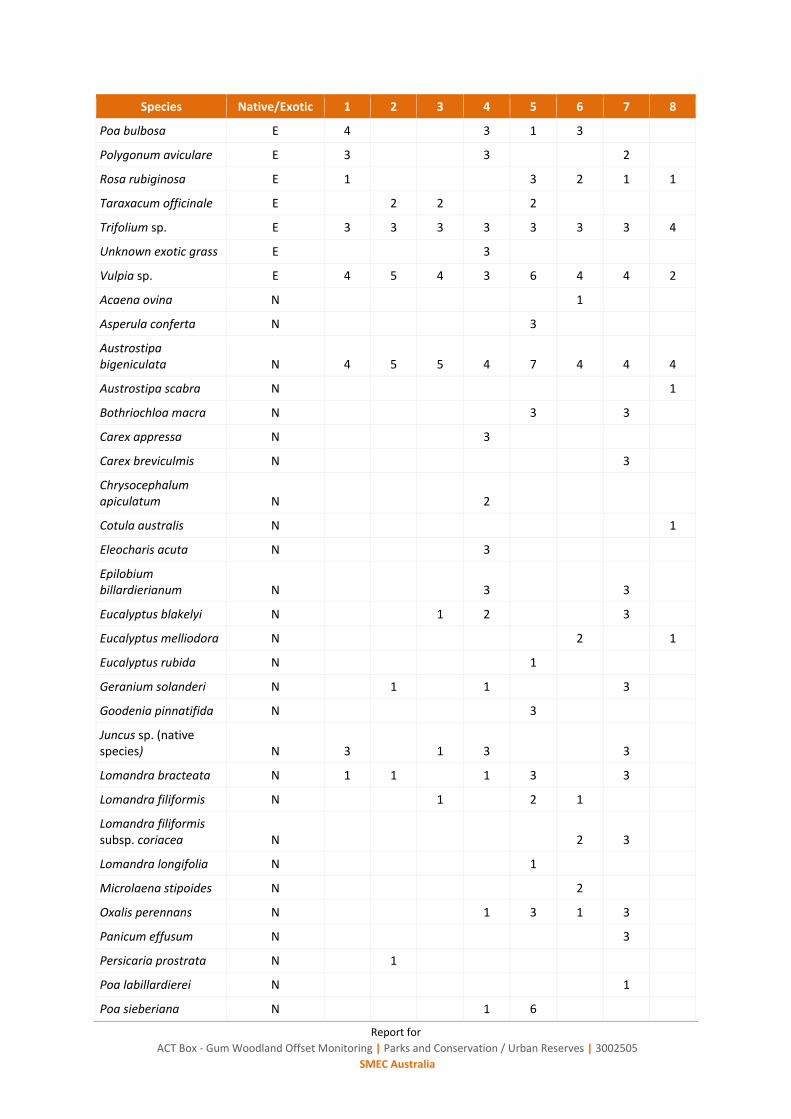
Report for
ACT Box - Gum Woodland Offset Monitoring | Parks and Conservation / Urban Reserves | 3002505
SMEC Australia
Species Native/Exotic 1 2 3 4 5 6 7 8
Poa bulbosa E 4 3 1 3
Polygonum aviculare E 3 3 2
Rosa rubiginosa E 1 3 2 1 1
Taraxacum officinale E 2 2 2
Trifolium sp. E 3 3 3 3 3 3 3 4
Unknown exotic grass E 3
Vulpia sp. E 4 5 4 3 6 4 4 2
Acaena ovina N 1
Asperula conferta N 3
Austrostipa bigeniculata N 4 5 5 4 7 4 4 4
Austrostipa scabra N 1
Bothriochloa macra N 3 3
Carex appressa N 3
Carex breviculmis N 3
Chrysocephalum apiculatum N 2
Cotula australis N 1
Eleocharis acuta N 3
Epilobium billardierianum N 3 3
Eucalyptus blakelyi N 1 2 3
Eucalyptus melliodora N 2 1
Eucalyptus rubida N 1
Geranium solanderi N 1 1 3
Goodenia pinnatifida N 3
Juncus sp. (native species) N 3 1 3 3
Lomandra bracteata N 1 1 1 3 3
Lomandra filiformis N 1 2 1
Lomandra filiformis subsp. coriacea N 2 3
Lomandra longifolia N 1
Microlaena stipoides N 2
Oxalis perennans N 1 3 1 3
Panicum effusum N 3
Persicaria prostrata N 1
Poa labillardierei N 1
Poa sieberiana N 1 6

Report for
ACT Box - Gum Woodland Offset Monitoring | Parks and Conservation / Urban Reserves | 3002505
SMEC Australia
Species Native/Exotic 1 2 3 4 5 6 7 8
Rumex brownii N 3 2 2 3 2
Rytidosperma sp. N 2 4 1 3 3
Schoenus apogon N 3
Tricoryne elatior N 1

Report for
ACT Box - Gum Woodland Offset Monitoring | Parks and Conservation / Urban Reserves | 3002505
SMEC Australia
Appendix H North Gungahlin Plot Locations
Plot Name Zone Easting Northing
Horse Park North Offset Area 69 55 691324 6109372
Jacka Offset Area 55 55 693943 6110219
Jacka Offset Area 21 55 693218 6110010
Jacka Offset Area 53 55 694241 6110132
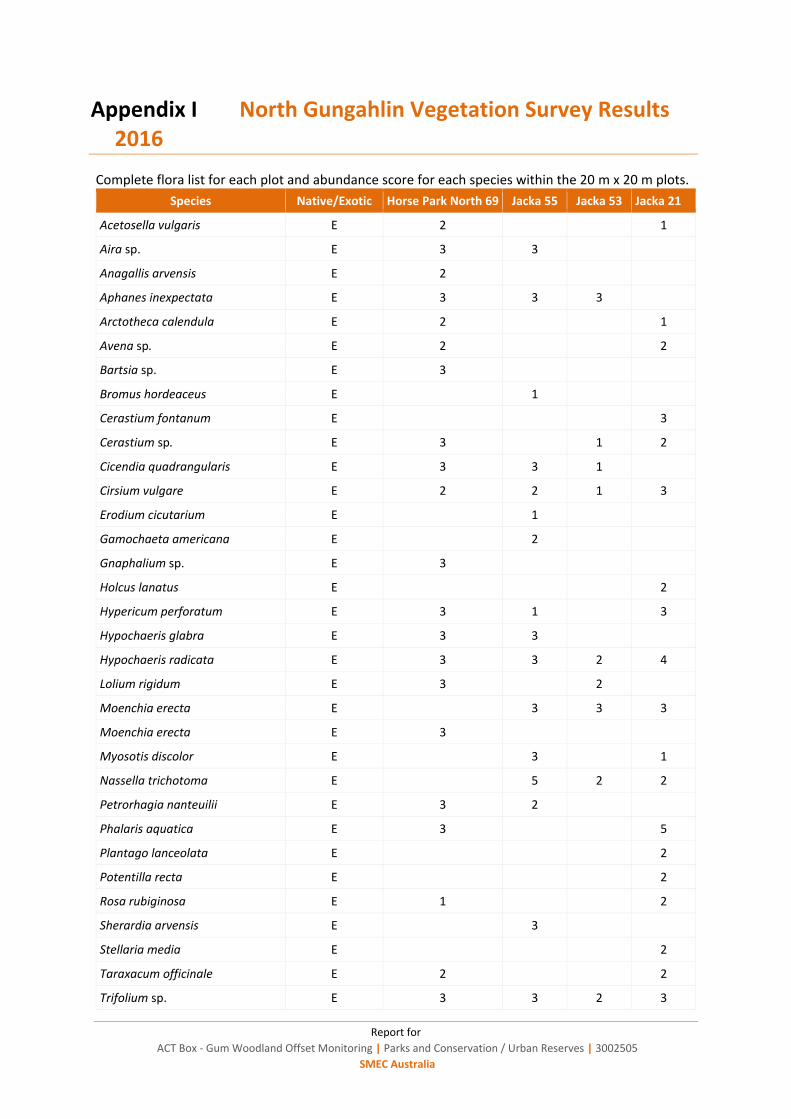
Report for
ACT Box - Gum Woodland Offset Monitoring | Parks and Conservation / Urban Reserves | 3002505
SMEC Australia
Appendix I North Gungahlin Vegetation Survey Results 2016
Complete flora list for each plot and abundance score for each species within the 20 m x 20 m plots.
Species Native/Exotic Horse Park North 69 Jacka 55 Jacka 53 Jacka 21
Acetosella vulgaris E 2 1
Aira sp. E 3 3
Anagallis arvensis E 2
Aphanes inexpectata E 3 3 3
Arctotheca calendula E 2 1
Avena sp. E 2 2
Bartsia sp. E 3
Bromus hordeaceus E 1
Cerastium fontanum E 3
Cerastium sp. E 3 1 2
Cicendia quadrangularis E 3 3 1
Cirsium vulgare E 2 2 1 3
Erodium cicutarium E 1
Gamochaeta americana E 2
Gnaphalium sp. E 3
Holcus lanatus E 2
Hypericum perforatum E 3 1 3
Hypochaeris glabra E 3 3
Hypochaeris radicata E 3 3 2 4
Lolium rigidum E 3 2
Moenchia erecta E 3 3 3
Moenchia erecta E 3
Myosotis discolor E 3 1
Nassella trichotoma E 5 2 2
Petrorhagia nanteuilii E 3 2
Phalaris aquatica E 3 5
Plantago lanceolata E 2
Potentilla recta E 2
Rosa rubiginosa E 1 2
Sherardia arvensis E 3
Stellaria media E 2
Taraxacum officinale E 2 2
Trifolium sp. E 3 3 2 3
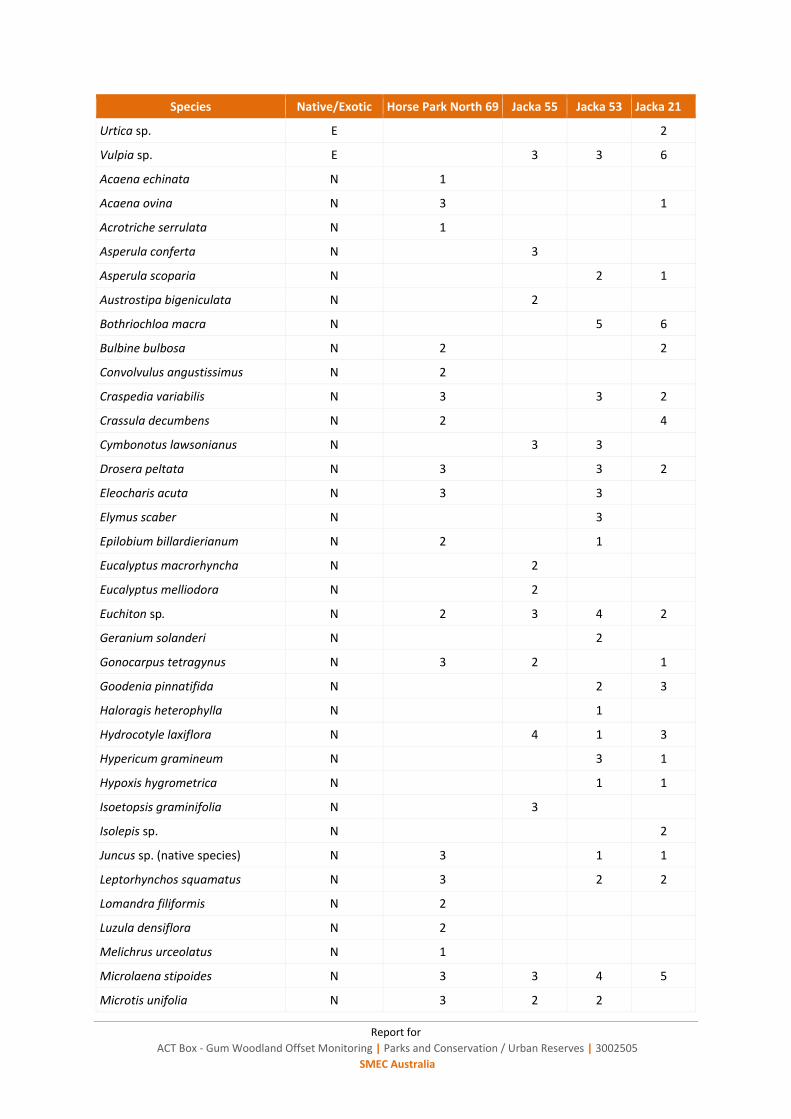
Report for
ACT Box - Gum Woodland Offset Monitoring | Parks and Conservation / Urban Reserves | 3002505
SMEC Australia
Species Native/Exotic Horse Park North 69 Jacka 55 Jacka 53 Jacka 21
Urtica sp. E 2
Vulpia sp. E 3 3 6
Acaena echinata N 1
Acaena ovina N 3 1
Acrotriche serrulata N 1
Asperula conferta N 3
Asperula scoparia N 2 1
Austrostipa bigeniculata N 2
Bothriochloa macra N 5 6
Bulbine bulbosa N 2 2
Convolvulus angustissimus N 2
Craspedia variabilis N 3 3 2
Crassula decumbens N 2 4
Cymbonotus lawsonianus N 3 3
Drosera peltata N 3 3 2
Eleocharis acuta N 3 3
Elymus scaber N 3
Epilobium billardierianum N 2 1
Eucalyptus macrorhyncha N 2
Eucalyptus melliodora N 2
Euchiton sp. N 2 3 4 2
Geranium solanderi N 2
Gonocarpus tetragynus N 3 2 1
Goodenia pinnatifida N 2 3
Haloragis heterophylla N 1
Hydrocotyle laxiflora N 4 1 3
Hypericum gramineum N 3 1
Hypoxis hygrometrica N 1 1
Isoetopsis graminifolia N 3
Isolepis sp. N 2
Juncus sp. (native species) N 3 1 1
Leptorhynchos squamatus N 3 2 2
Lomandra filiformis N 2
Luzula densiflora N 2
Melichrus urceolatus N 1
Microlaena stipoides N 3 3 4 5
Microtis unifolia N 3 2 2

Report for
ACT Box - Gum Woodland Offset Monitoring | Parks and Conservation / Urban Reserves | 3002505
SMEC Australia
Species Native/Exotic Horse Park North 69 Jacka 55 Jacka 53 Jacka 21
Oreomyrrhis eriopoda N 3
Oxalis perennans N 2 2 2
Panicum effusum N 4 5
Poa labillardierei N 1
Poa sieberiana N 2
Pratia pedunculata N 5
Ranunculus papulentus N 2
Ranunculus sp. N 5 1
Rumex brownii N 3 1
Rytidosperma sp. N 4 3
Schoenus apogon N 4 2 3
Scleranthus biflorus N 2 2
Scleranthus diander N 1
Solenogyne dominii N 3 2
Themeda australis N 4 5 2
Tricoryne elatior N 3 1 1
Triptilodiscus pygmaeus N 3 3
Veronica calycina N 3
Vittadinia muelleri N 3
Wurmbea dioica N 3 2 2 2
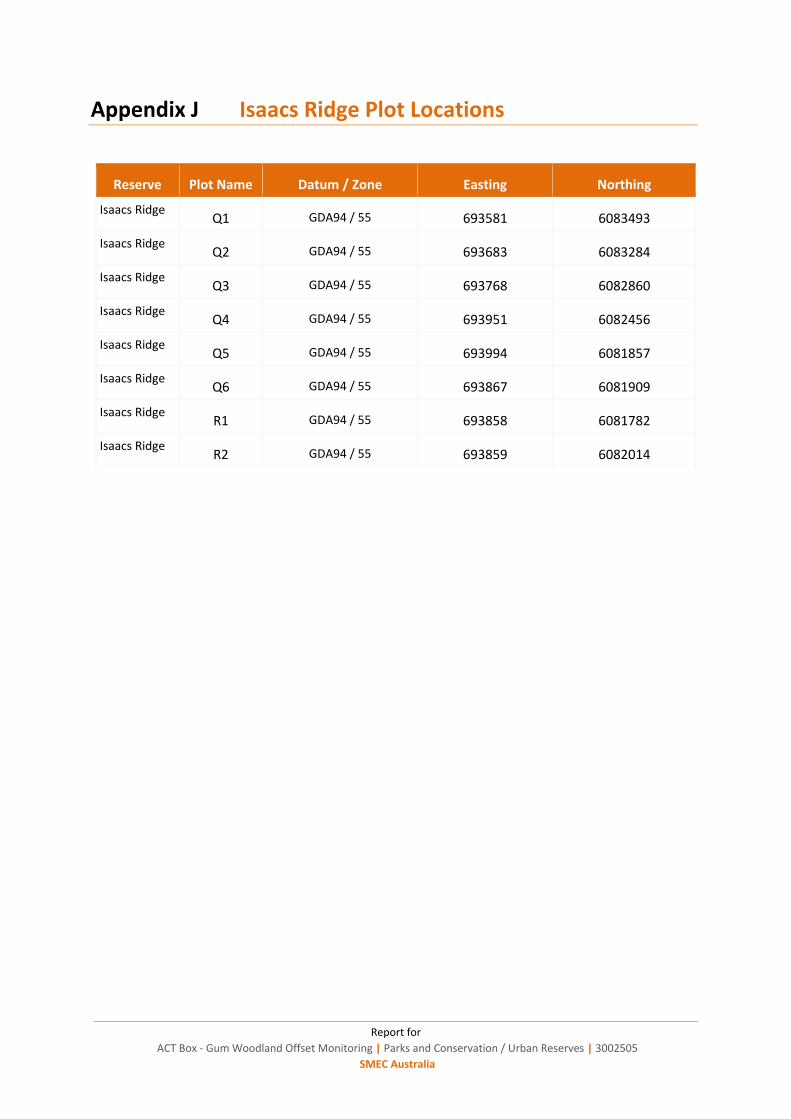
Report for
ACT Box - Gum Woodland Offset Monitoring | Parks and Conservation / Urban Reserves | 3002505
SMEC Australia
Appendix J Isaacs Ridge Plot Locations
Reserve Plot Name Datum / Zone Easting Northing
Isaacs Ridge Q1 GDA94 / 55 693581 6083493
Isaacs Ridge Q2 GDA94 / 55 693683 6083284
Isaacs Ridge Q3 GDA94 / 55 693768 6082860
Isaacs Ridge Q4 GDA94 / 55 693951 6082456
Isaacs Ridge Q5 GDA94 / 55 693994 6081857
Isaacs Ridge Q6 GDA94 / 55 693867 6081909
Isaacs Ridge R1 GDA94 / 55 693858 6081782
Isaacs Ridge R2 GDA94 / 55 693859 6082014

Report for
ACT Box - Gum Woodland Offset Monitoring | Parks and Conservation / Urban Reserves | 3002505
SMEC Australia
Appendix K Isaacs Ridge Vegetation Survey Results 2016
Complete flora list for each plot and abundance score for each species within the 20 m x 20 m plots.
Species Native/Exotic Q1 Q2 Q3 Q4 Q5 Q6 RO1 RO2
Acetosella vulgaris E 3 2 4
Aira sp. E 3 3 4 3 4 2 4
Arctotheca calendula E 2 3
Bartsia sp. E 2 2
Briza maxima E 3
Briza minor E 5 5 5 3 4
Bromus diandrus E 4 3 4
Bromus hordeaceus E 5 5 3 3 3 4 5
Bromus sp. E 5 4 6
Carthamus lanatus E 1
Centaurium sp. E 2 3 2 1
Cerastium sp. E 4 3 1 2 2
Cirsium vulgare E 4 3 1 2 2 2 2
Conyza sp. E 1 2
Cyperus eragrostis E 1 1
Echium plantagineum E 3 3 2 2 4 3 4 3
Erodium botrys E 3
Festuca arundinacea E 3 4 3
Gamochaeta americana E 1
Hirschfeldia incana E 2
Holcus lanatus E 2 2 3 1
Hypericum perforatum E 1 3 3 3 4 3 3 4
Hypochaeris glabra E 2 4 3 3
Hypochaeris radicata E 4 3 3 3 3 3 1 4
Lactuca serriola E 1 1 1 2
Lolium perenne E 4
Lycium ferocissimum E 1 3
Modiola caroliniana E 1 2
Nassella trichotoma E 2
Parentucellia latifolia E 3 3 2 2 2 4
Paronychia brasiliana E 1 1
Paspalum dilatatum E 2 2
Petrorhagia nanteuilii E 3 2
Phalaris aquatica E 4 4

Report for
ACT Box - Gum Woodland Offset Monitoring | Parks and Conservation / Urban Reserves | 3002505
SMEC Australia
Species Native/Exotic Q1 Q2 Q3 Q4 Q5 Q6 RO1 RO2
Plantago lanceolata E 3 2 3 4 5 3 3 4
Prunus sp. E 1
Rosa rubiginosa E 2 1 1 1
Salvia verbenaca E 1
Silene gallica E 2 2 2
Sonchus sp. E 1 2 2 2 2
Spergularia rubra E 2
Stellaria media E 2
Taraxacum officinale E 3
Tragopogon sp. E 2 1
Trifolium campestre E 5 1 4 3 2
Trifolium sp. E 3 3
Trifolium subterraneum E 4 4 4 3 1 2
Verbascum thapsus E 3 4
Verbascum virgatum E 2
Vulpia sp. E 5 5 3 4 4 3 4 3
Acaena novae-zelandiae N 1
Acaena ovina N 1 1 3 3 4 2 2
Acrotriche serrulata N 1
Asperula conferta N 3
Austrostipa bigeniculata N 4 4
Austrostipa scabra N 5 3
Bothriochloa macra N 5 5 5 5 4 2 6
Brachyscome sp. N 2
Bulbine bulbosa N 4 2 1
Carex bichenoviana N 3 1
Carex breviculmis N 2
Carex inversa N 4 4 3 2 2
Cassinia longifolia N 2
Chamaesyce drummondii N 3 3 2
Cheilanthes sp. N 1 1
Chrysocephalum apiculatum N 3 1
Chrysocephalum semipapposum
N 1
Convolvulus angustissimus N 1
Crassula sieberiana N 1 2
Cymbonotus lawsonianus N 1
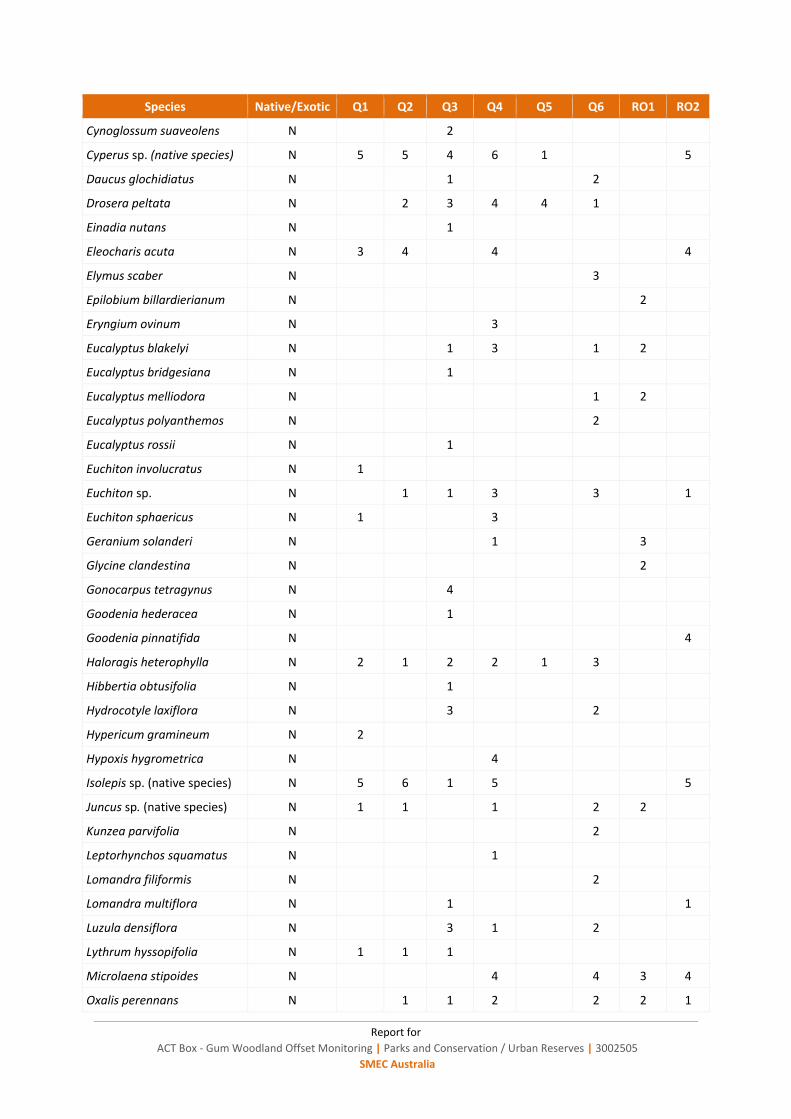
Report for
ACT Box - Gum Woodland Offset Monitoring | Parks and Conservation / Urban Reserves | 3002505
SMEC Australia
Species Native/Exotic Q1 Q2 Q3 Q4 Q5 Q6 RO1 RO2
Cynoglossum suaveolens N 2
Cyperus sp. (native species) N 5 5 4 6 1 5
Daucus glochidiatus N 1 2
Drosera peltata N 2 3 4 4 1
Einadia nutans N 1
Eleocharis acuta N 3 4 4 4
Elymus scaber N 3
Epilobium billardierianum N 2
Eryngium ovinum N 3
Eucalyptus blakelyi N 1 3 1 2
Eucalyptus bridgesiana N 1
Eucalyptus melliodora N 1 2
Eucalyptus polyanthemos N 2
Eucalyptus rossii N 1
Euchiton involucratus N 1
Euchiton sp. N 1 1 3 3 1
Euchiton sphaericus N 1 3
Geranium solanderi N 1 3
Glycine clandestina N 2
Gonocarpus tetragynus N 4
Goodenia hederacea N 1
Goodenia pinnatifida N 4
Haloragis heterophylla N 2 1 2 2 1 3
Hibbertia obtusifolia N 1
Hydrocotyle laxiflora N 3 2
Hypericum gramineum N 2
Hypoxis hygrometrica N 4
Isolepis sp. (native species) N 5 6 1 5 5
Juncus sp. (native species) N 1 1 1 2 2
Kunzea parvifolia N 2
Leptorhynchos squamatus N 1
Lomandra filiformis N 2
Lomandra multiflora N 1 1
Luzula densiflora N 3 1 2
Lythrum hyssopifolia N 1 1 1
Microlaena stipoides N 4 4 3 4
Oxalis perennans N 1 1 2 2 2 1
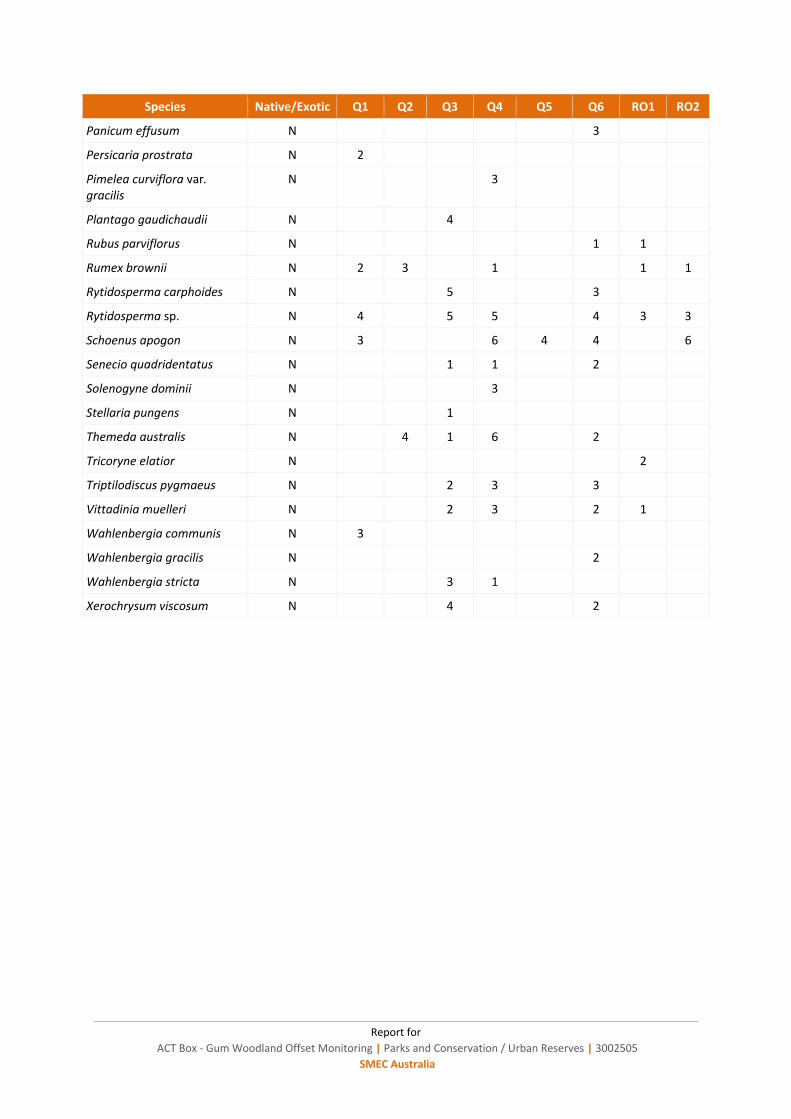
Report for
ACT Box - Gum Woodland Offset Monitoring | Parks and Conservation / Urban Reserves | 3002505
SMEC Australia
Species Native/Exotic Q1 Q2 Q3 Q4 Q5 Q6 RO1 RO2
Panicum effusum N 3
Persicaria prostrata N 2
Pimelea curviflora var. gracilis
N 3
Plantago gaudichaudii N 4
Rubus parviflorus N 1 1
Rumex brownii N 2 3 1 1 1
Rytidosperma carphoides N 5 3
Rytidosperma sp. N 4 5 5 4 3 3
Schoenus apogon N 3 6 4 4 6
Senecio quadridentatus N 1 1 2
Solenogyne dominii N 3
Stellaria pungens N 1
Themeda australis N 4 1 6 2
Tricoryne elatior N 2
Triptilodiscus pygmaeus N 2 3 3
Vittadinia muelleri N 2 3 2 1
Wahlenbergia communis N 3
Wahlenbergia gracilis N 2
Wahlenbergia stricta N 3 1
Xerochrysum viscosum N 4 2

Report for
ACT Box - Gum Woodland Offset Monitoring | Parks and Conservation / Urban Reserves | 3002505
SMEC Australia
Appendix L Justice Robert Hope Park Plot Locations
Reserve Plot Name Datum / Zone Easting Northing
Justice Robert Hope Park 1 GDA94 / 55 697079 6098827
Justice Robert Hope Park 2 GDA94 / 55 696895 609849
Justice Robert Hope Park 3 GDA94 / 55 697066 6098700
Justice Robert Hope Park 4 GDA94 / 55 696854 6098730
Justice Robert Hope Park 5 GDA94 / 55 696824 6098615
Justice Robert Hope Park 6 GDA94 / 55 696994 6098468
Justice Robert Hope Park 7 GDA94 / 55 696959 6098608

Report for
ACT Box - Gum Woodland Offset Monitoring | Parks and Conservation / Urban Reserves | 3002505
SMEC Australia
Appendix M Justice Robert Hope Park Vegetation Survey Results 2016
Complete flora list for each plot and abundance score for each species within the 20 m x 20 m plots.
Species Native/ Exotic
1 2 3 4 5 6 7
Exotic species
Acetosella vulgaris E 1 2 3 5 2
Arctotheca calendula E 5 5 1 3
Avena sp. E 6 6 3 5 6 6
Bromus sp. E 5 5 4 3
Dactylis glomerata E 2
Echium plantagineum E 6 4 3 5
Echium vulgare E 5
Erodium cicutarium E 5 2 7 4 2
Holcus lanatus E 1 2 5 3
Hordeum sp. E 6 5
Hypericum perforatum E 5 1 2 5
Hypochaeris glabra E 5 3 4
Hypochaeris radicata E 5 4 4
Lactuca serriola E 5
Lolium rigidum E 5 5 4 5 2 3
Lycium ferocissimum 2
Malva sp. E 4 1 1
Marrubium vulgare E 3
Medicago sp. E 1 2 3
Modiola caroliniana E 4
Nassella neesiana E 4 3 3
Onopordum acanthium E 5 3 1 4 2
Phalaris aquatica E 6 1 7 3
Plantago lanceolata E 3 4 5 3 5 3
Poa annua E 1
Rosa rubiginosa E 1 3
Taraxacum officinale E 4 2
Trifolium sp. E 5 2 3 5 3 4 3
Urtica sp. E
Vulpia sp. E 5 4 3 7 3 5 6

Report for
ACT Box - Gum Woodland Offset Monitoring | Parks and Conservation / Urban Reserves | 3002505
SMEC Australia
Species Native/ Exotic
1 2 3 4 5 6 7
Native species
Acacia mearnsii E 5
Acaena novae-zelandiae 3 3
Amyema sp. N 3
Austrostipa bigeniculata N 6 5 5 6 5 4 4
Bothriochloa macra N 4
Bulbine bulbosa N 1
Bursaria spinose N 2
Calocephalus citreus N 2
Crassula sieberiana N 3 1
Cullen microcephalum N 1 3
Cymbonotus preissianus N 1
Daucus glochidiatus N 1
Dianella revolute N 2
Einadia nutans N 5 3
Elymus scaber N 4 2
Eryngium ovinum N 1
Eucalyptus blakelyi N 1 5
Eucalyptus bridgesiana N 1
Eucalyptus melliodora N 3 1 3 3
Geranium solanderi N 4 1
Goodenia hederacea N 2
Indigofera adesmiifolia N 3
Juncus sp. (native species) N 4
Leptorhynchos squamatus N 3
Leucochrysum albicans N 1
Lomandra bracteata N 1
Lomandra filiformis N 1 1
Microlaena stipoides N 4 5 1
Oxalis perennans N 5 1 3 5 2
Rumex brownii N 2 2 5 5
Rytidosperma sp. N 4 5 5
Schoenus apogon N 5
Tricoryne elatior N 1
Wahlenbergia sp. N 2

Report for
ACT Box - Gum Woodland Offset Monitoring | Parks and Conservation / Urban Reserves | 3002505
SMEC Australia
Appendix N Justice Robert Hope Park Updated 2014 Floristic Score Values
Plot NPS EPS SW WS FVS
1 5 9 1 5.4 2.5
2 9 11 1 7.0 4.1
3 28 11 1 6.3 27.5
4 4 12 1 5.2 1.0
5 4 8 0 3.2 0.6
6 4 12 1 8.8 0.4
7 8 10 1 8.9 3.7
Average 8.9 10.4 0.9 6.4 5.7
Range 4-28 8-12 0-1 3.2-8.9 0.6-27.5
NPS: number of native plant species (0.04 ha plot); EPS: number of exotic plant species (0.04 ha plot); SW: significant weeds in each plot (0.04 ha); WS: weed score; FVS: floristic value score.

Report for
ACT Box - Gum Woodland Offset Monitoring | Parks and Conservation / Urban Reserves | 3002505
SMEC Australia
Appendix O Pinnacle Nature Reserve Offset Plot Locations
Reserve Plot Name Datum / Zone Easting Northing
Pinnacle Nature Reserve Offset 1 GDA94 / 55 684746 6095889
Pinnacle Nature Reserve Offset 2 GDA94 / 55 684924 6095735
Pinnacle Nature Reserve Offset 3 GDA94 / 55 685058 6095739
Pinnacle Nature Reserve Offset 4 GDA94 / 55 685242 6096025
Pinnacle Nature Reserve Offset 5 GDA94 / 55 685242 6096127
Pinnacle Nature Reserve Offset 6 GDA94 / 55 685058 6096161

Report for
ACT Box - Gum Woodland Offset Monitoring | Parks and Conservation / Urban Reserves | 3002505
SMEC Australia
Appendix P Pinnacle Nature Reserve Offset Vegetation Survey Results 2016
Complete flora list for each plot and abundance score for each species within the 20 m x 20 m plots.
Species Native/ Exotic 1 2 3 4 5 6
Exotic species
Acetosella vulgaris E 4 3 1 4 4 4
Aira sp. E 3 4 3 4 3
Arctotheca calendula E 4 4 3 3
Avena sp. E 4 3 3 3
Briza minor E 3
Bromus hordeaceus E 4
Bromus sp. E 4
Carthamus lanatus E 2 2 3 3
Centaurium sp. E 2 3 2
Cerastium fontanum E 3
Cerastium glomeratum E 3 3
Cicendia quadrangularis E 3
Cirsium vulgare E 2
Conzya sp. E 2 1
Cynodon dactylon E 3
Echium plantagineum E 3 3 2
Erodium cicutarium E 1 3
Gamochaeta americana E 3 1
Geranium molle E 2 2 3
Hirshfeldia incana 2
Holcus lanatus E 2 3
Hordeum sp. E 4
Hypericum perforatum E 2 2 2
Hypochaeris glabra E 3 3 2 2
Hypochaeris radicata E 4 3 3 3 4 4
Lactuca serriola E 2 1 1
Lolium rigidum E 5 2 3
Malva sp. E 3
Marrubium vulgare E 3
Modiola caroliniana E 1
Moenchia erecta E 3 3 3
Paspalum dilatatum E 2 3
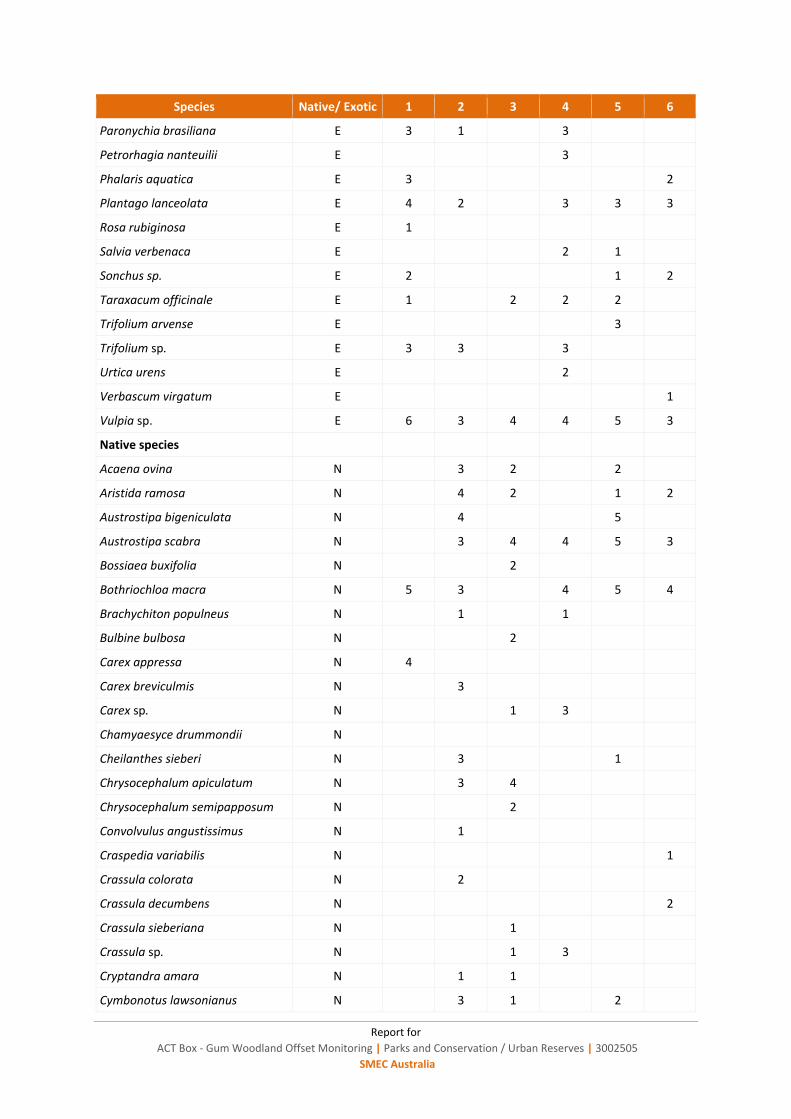
Report for
ACT Box - Gum Woodland Offset Monitoring | Parks and Conservation / Urban Reserves | 3002505
SMEC Australia
Species Native/ Exotic 1 2 3 4 5 6
Paronychia brasiliana E 3 1 3
Petrorhagia nanteuilii E 3
Phalaris aquatica E 3 2
Plantago lanceolata E 4 2 3 3 3
Rosa rubiginosa E 1
Salvia verbenaca E 2 1
Sonchus sp. E 2 1 2
Taraxacum officinale E 1 2 2 2
Trifolium arvense E 3
Trifolium sp. E 3 3 3
Urtica urens E 2
Verbascum virgatum E 1
Vulpia sp. E 6 3 4 4 5 3
Native species
Acaena ovina N 3 2 2
Aristida ramosa N 4 2 1 2
Austrostipa bigeniculata N 4 5
Austrostipa scabra N 3 4 4 5 3
Bossiaea buxifolia N 2
Bothriochloa macra N 5 3 4 5 4
Brachychiton populneus N 1 1
Bulbine bulbosa N 2
Carex appressa N 4
Carex breviculmis N 3
Carex sp. N 1 3
Chamyaesyce drummondii N
Cheilanthes sieberi N 3 1
Chrysocephalum apiculatum N 3 4
Chrysocephalum semipapposum N 2
Convolvulus angustissimus N 1
Craspedia variabilis N 1
Crassula colorata N 2
Crassula decumbens N 2
Crassula sieberiana N 1
Crassula sp. N 1 3
Cryptandra amara N 1 1
Cymbonotus lawsonianus N 3 1 2
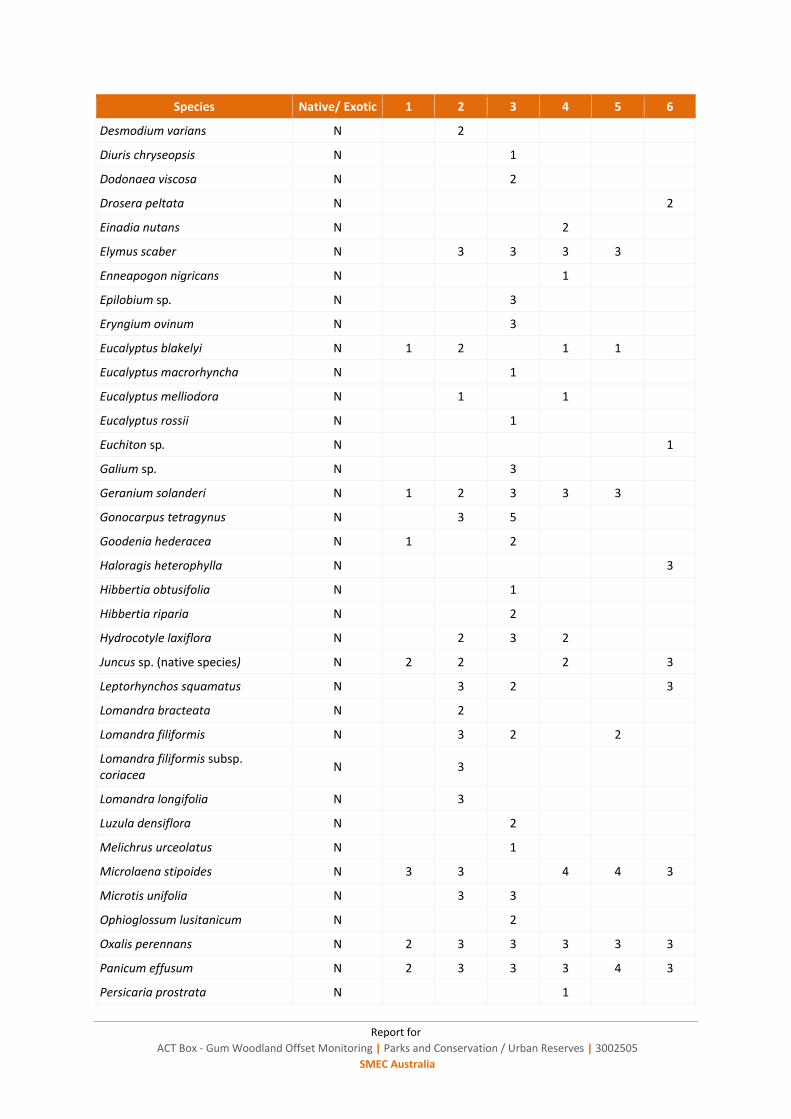
Report for
ACT Box - Gum Woodland Offset Monitoring | Parks and Conservation / Urban Reserves | 3002505
SMEC Australia
Species Native/ Exotic 1 2 3 4 5 6
Desmodium varians N 2
Diuris chryseopsis N 1
Dodonaea viscosa N 2
Drosera peltata N 2
Einadia nutans N 2
Elymus scaber N 3 3 3 3
Enneapogon nigricans N 1
Epilobium sp. N 3
Eryngium ovinum N 3
Eucalyptus blakelyi N 1 2 1 1
Eucalyptus macrorhyncha N 1
Eucalyptus melliodora N 1 1
Eucalyptus rossii N 1
Euchiton sp. N 1
Galium sp. N 3
Geranium solanderi N 1 2 3 3 3
Gonocarpus tetragynus N 3 5
Goodenia hederacea N 1 2
Haloragis heterophylla N 3
Hibbertia obtusifolia N 1
Hibbertia riparia N 2
Hydrocotyle laxiflora N 2 3 2
Juncus sp. (native species) N 2 2 2 3
Leptorhynchos squamatus N 3 2 3
Lomandra bracteata N 2
Lomandra filiformis N 3 2 2
Lomandra filiformis subsp. coriacea
N 3
Lomandra longifolia N 3
Luzula densiflora N 2
Melichrus urceolatus N 1
Microlaena stipoides N 3 3 4 4 3
Microtis unifolia N 3 3
Ophioglossum lusitanicum N 2
Oxalis perennans N 2 3 3 3 3 3
Panicum effusum N 2 3 3 3 4 3
Persicaria prostrata N 1

Report for
ACT Box - Gum Woodland Offset Monitoring | Parks and Conservation / Urban Reserves | 3002505
SMEC Australia
Species Native/ Exotic 1 2 3 4 5 6
Plantago varia N 3 2
Poa labillardierei N 3
Poa sieberiana N 3 5 3 2
Ranunculus sp. N 2 2
Rumex brownii N 3 2 1 3
Rytidosperma sp. N 4 5 5 3
Scleranthus biflorus N 1
Senecio quadridentatus N 1
Senecio sp. N 1
Solengyne gunnii N 2
Themeda australis N 4 4 4 4 4
Tricoryne elatior N 2 2
Triptilodiscus pygmaeus N 3 3
Vittadinia muelleri N 3 1
Wahlenbergia sp. N 2
Wurmbea dioica N 3 3 2 2 2
Xerochrysum viscosum N 1

Report for
ACT Box - Gum Woodland Offset Monitoring | Parks and Conservation / Urban Reserves | 3002505
SMEC Australia
Appendix Q Pinnacle Nature Reserve Offset Updated 2015 Floristic Score Values
Plot NPS EPS SW WS FVS
1 9 16 2.0 13.5 5.8
2 22 16 0.0 4.9 24.2
3 32 8 8.0 2.4 34.0
4 20 23 0.0 9.3 12.6
5 19 16 0.0 5.5 14.6
6 15 7 0.0 3.1 7.6
Average 19.5 14.3 1.7 6.5 16.5
Range 9-32 7-23 0-8 3.1-13.5 5.8-34
NPS: number of native plant species (0.04 ha plot); EPS: number of exotic plant species (0.04 ha plot); SW: significant weeds in each plot (0.04 ha); WS: weed score; FVS: floristic value score.