ACSEE2015 - Reference#16801 (July 14, 2015 04 18...
13
Whether to Invest in Smart Technology or Elsewhere – a Decision Support Tool Kanishka Chauhan, Indian Institute of Technology Hyderabad, India Mohammad Moiez Gohar, Indian Institute of Technology Hyderabad, India MV Panduranga Rao, Indian Institute of Technology Hyderabad, India The Asian Conference on Sustainability, Energy and the Environment 2015 Official Conference Proceedings Abstract Most small-scale industries and household complexes in developing countries face a financial dilemma regarding installation of energy saving technologies like smart lighting. Given an initial capital, it is often not clear whether to invest it in such technologies or elsewhere that gives better returns on investment. For example, if the users of the building are sufficiently energy aware to turn off their personal appliances and lights before leaving a room, it can be argued that the initial capital is better invested elsewhere. We introduce a tool that helps concerned decision makers compare the savings due to installation of smart technologies against alternative investment avenues. Keywords: Building Occupancy, Energy Awareness, Networks of Stochastic Timed Automata, Statistical Model Checking iafor The International Academic Forum www.iafor.org
Transcript of ACSEE2015 - Reference#16801 (July 14, 2015 04 18...

Whether to Invest in Smart Technology or Elsewhere – a Decision Support Tool
Kanishka Chauhan, Indian Institute of Technology Hyderabad, India Mohammad Moiez Gohar, Indian Institute of Technology Hyderabad, India
MV Panduranga Rao, Indian Institute of Technology Hyderabad, India
The Asian Conference on Sustainability, Energy and the Environment 2015
Official Conference Proceedings
Abstract Most small-scale industries and household complexes in developing countries face a financial dilemma regarding installation of energy saving technologies like smart lighting. Given an initial capital, it is often not clear whether to invest it in such technologies or elsewhere that gives better returns on investment. For example, if the users of the building are sufficiently energy aware to turn off their personal appliances and lights before leaving a room, it can be argued that the initial capital is better invested elsewhere. We introduce a tool that helps concerned decision makers compare the savings due to installation of smart technologies against alternative investment avenues. Keywords: Building Occupancy, Energy Awareness, Networks of Stochastic Timed Automata, Statistical Model Checking
iafor The International Academic Forum
www.iafor.org

1. Introduction Non-renewable energy sources are depleting at an alarming rate today. It is therefore necessary to conserve energy. One major area where a lot of energy is wasted is household and office electrical power. Modern homes have several power consuming appliances like fans, bulbs, etc. that are left switched on even when not in use. One way to avoid this kind of power wastage is to equip homes and offices with smart technologies like smart lighting systems that switch off when not in use. But such smart technologies require capital investment. For households and offices with limited budgets, it is not easy to decide whether to invest in such technologies or somewhere else that gives higher returns. The energy awareness of the users of the building plays a major role in this decision. If the average user is responsible enough to switch off devices most of the times when they are not in use, it can be argued that the investment is better made elsewhere. It is therefore desirable to have a tool that gives a quantitative justification of such decisions. In this paper, we combine building occupancy simulation techniques with statistical model checking tools for probabilistic timed systems to arrive at such justifications. While a straightforward stochastic simulation can yield some interesting observations, statistical model checking can provide more accurate answers to complex queries. Model checking involves description of the system in a mathematically precise language, the specification of requirements in an appropriate system of logic and automatically checking if the model satisfies the specified requirements. Statistical model checking is a technique that provides answers faster, albeit at the expense of accuracy, as opposed to symbolic/numerical approaches that are accurate but computationally expensive. In this paper, we use Networks of Stochastic Timed Automata (NSTA) for modeling the system, weighted Metric Interval Temporal Logic (MITL) to specify our requirements regarding energy savings, and the UPPAAL Statistical Model Checker to do the model checking. Specifically, our approach answers the following question: Given (i) an initial capital of P units of money required for smart technology (such as smart lighting and smart heating systems) (ii) a rate r of return on an alternative investment plan, (iii) the average energy awareness of the users (measured as the probability switching off power when not in use, averaged over all users), and (iv) the building occupancy profile (obtained through occupancy simulation techniques reported in literature), should P be invested in smart technologies or in the alternative plan? The paper is organized as follows. Section 2 gives a brief overview of the various concepts, techniques and tools used in this work. Section 3 explains the model checking approach and discusses the results. Section 4 gives a brief description of a simulations based approach and a comparison with results from the model checking approach. 2. Preliminaries Our work uses concepts from different areas of research. We briefly discuss each in turn. The reader is encouraged to refer to the relevant citations for details.
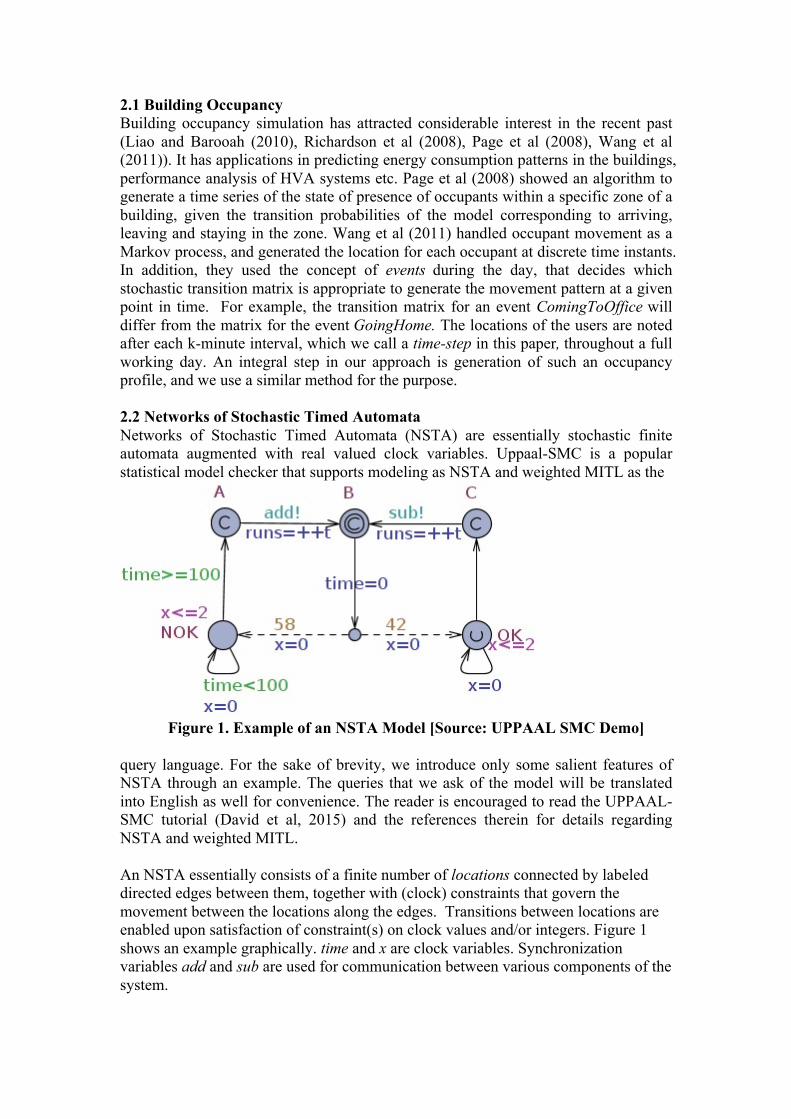
2.1 Building Occupancy Building occupancy simulation has attracted considerable interest in the recent past (Liao and Barooah (2010), Richardson et al (2008), Page et al (2008), Wang et al (2011)). It has applications in predicting energy consumption patterns in the buildings, performance analysis of HVA systems etc. Page et al (2008) showed an algorithm to generate a time series of the state of presence of occupants within a specific zone of a building, given the transition probabilities of the model corresponding to arriving, leaving and staying in the zone. Wang et al (2011) handled occupant movement as a Markov process, and generated the location for each occupant at discrete time instants. In addition, they used the concept of events during the day, that decides which stochastic transition matrix is appropriate to generate the movement pattern at a given point in time. For example, the transition matrix for an event ComingToOffice will differ from the matrix for the event GoingHome. The locations of the users are noted after each k-minute interval, which we call a time-step in this paper, throughout a full working day. An integral step in our approach is generation of such an occupancy profile, and we use a similar method for the purpose. 2.2 Networks of Stochastic Timed Automata Networks of Stochastic Timed Automata (NSTA) are essentially stochastic finite automata augmented with real valued clock variables. Uppaal-SMC is a popular statistical model checker that supports modeling as NSTA and weighted MITL as the
Figure 1. Example of an NSTA Model [Source: UPPAAL SMC Demo] query language. For the sake of brevity, we introduce only some salient features of NSTA through an example. The queries that we ask of the model will be translated into English as well for convenience. The reader is encouraged to read the UPPAAL-SMC tutorial (David et al, 2015) and the references therein for details regarding NSTA and weighted MITL. An NSTA essentially consists of a finite number of locations connected by labeled directed edges between them, together with (clock) constraints that govern the movement between the locations along the edges. Transitions between locations are enabled upon satisfaction of constraint(s) on clock values and/or integers. Figure 1 shows an example graphically. time and x are clock variables. Synchronization variables add and sub are used for communication between various components of the system.

The label “x<=2” stands for an invariant condition meaning that the system cannot remain in this location when the clock time exceeds 2. A guard (e.g. the “ time>=100” label on the edge going from location labeled NOK) on the other hand, determines the earliest the automaton can make transition along the edge. Non-clock variables can be updated, and the clock variables reset along the edges. For example, runs=++t is an update on the integer variable runs, and the updates x=0 and time=0 are clock reset operations. The dashed edges represent the probability with which the system can transit from one location to any location. The numbers of the dashed edges represent the probability ratio with which a particular transition may take place. For example, in this scenario, the system can go from the location B to location NOK, or to location OK, with probabilities, 58/(58+42) and 42/(58+42), respectively. 3. Methodology The main idea behind our approach can be broadly described as follows: 1. Consider a building with of m rooms and a user community of size n. For each user Ui of the building, we create the time sequence of occupancy in various rooms. As mentioned previously, this is done using existing agent based building occupancy simulation techniques that model the movement of each person as a Markov process as in Wang et al (2011). (We use a time-step size k=10 and the events GoingHome, WalkAround, and ComingToOffice. We consider a building of three rooms, with a total user community of six, each potentially assigned to an initial room.) 2. User Ui turns off personal appliances with the probability pi when leaving a room. Thus, pi quantifies the energy awareness of user Ui. In this work, we assume every user has an average energy awareness (∑pi)/n. Had smart technologies been installed, the appliances would have been necessarily turned off for the interval the user remains out of the room. Therefore, if smart technologies are installed, energy savings occur precisely during the intervals when the user leaves the room forgetting to turning off personal devices and lights. 3. This saving is compared against the returns of the alternative investment. 3.1 Statistical Model Checking Approach 3.1.1 Modeling the System The system is modeled as a parallel composition of three timed automata: Timer, Person, and Control. We explain each automaton in detail. But before that, we list below important data structures used: pid: variable to identify each user rid: variable to identify each room ts: integer variable denoting time-step. numTimeSteps: constant denoting the total number of time-steps in one working day. morning: variable denoting the time at which the first event ends. evening: variable denoting the time at which the second event ends. night: variable denoting the time at which the third event ends. room[pid]: variable to denote the current location of user pid.

roomPat[pid][rid][ts]: 3-dimensional array capturing the occupancy data for each user pid, in room rid, at time-step ts. roomPat[pid][rid][ts] is 1, if user pid is in room rid at time-step ts. ePat[pid][rid][ts]: 3-dimensional array capturing the energy pattern for each user pid, in room rid, at time-step ts. ePat is 1, if user pid is consuming energy in room rid at time-step ts, remains 1 if the user forgets to switch off the power before leaving the room, and is set to 0 otherwise. movementMatrix: data structure representing the probabilities of movements of the users from one room to another. sincere[pid][ts]: denotes whether or not the user pid switched off the power before leaving room at time-step ts. A. The Timer Automaton The Timer Automaton (Figure 2) maintains the time-step for each event and in the end, computes the energy if smart technology is used. The automaton works as follows:
Figure 2. Timer Automaton The automaton moves from its initial start location to the wait location at the end of each 10-minute time-step. This is ensured by the guard t≥10 and the invariant t≤10. A synchronization signal “go” is sent to the Person automaton to indicate that the occupant can change location as determined by the probability distribution over the outgoing edges. There is one more guard on the edge going from start to wait: ts<numTimeSteps, which indicates that this automaton will run only till the number of time-steps equivalent to one day observations. When ts becomes equal to or exceeds numTimeSteps, the automaton moves from the start location to the done location. At this point, an internal function is invoked that calculates the energy that would have been saved during the day if smart technologies had been installed. B. The Person Automaton This automaton (Figure 3) models the movement of the occupants from one location to another. There are 3 rooms, and an outside location. Each occupant starts from outside (represented by the Outside location) and moves into the room assigned to them after receiving the go signal from the timer automaton. The guard ts<evening

ensures that this transition happens only before the last event, i.e. evening. The update roomPat[pid][0][ts] = 1 updates the room occupancy info of room0 in the matrix roomPat which basically captures the occupancy profile of each occupant at each time-step. This captures the first event - ComingToOffice. The next event is WalkAround in which the occupants move from one room to another based on the probability of movements. The go signal from the timer automaton sets this event in motion, and the automaton moves to the location WalkAround from either of the three locations viz. Room0, Room1, or Room2. From this location, the automaton either transits to location LeaveRoom or RemainInside based on the probability weights on the dashed-edges (2/5 and 3/5, here). These weights are directly taken from the movement matrix discussed earlier, and represented as ratio of weights. Now based upon which room the occupant was in before leaving his room, the automaton transits to either location A, or B or C. From each of these locations, the automaton transits to either of the locations Room0 or Room1 or Room2 depending again, on the probability weights.
Figure 3. Person Automaton
This transition sets out the signal goout[pid] to the control automaton indicating that the person is leaving the room. The update function update(pid, x, y) is called to update the occupancy matrix indicating that the person has moved from room x to room y. The guard ts≤evening on the edge going out from WalkAround ensures that

walk-around happens no later than evening, after which the occupant has to go home or remain inside the room. If the automaton moves to the location RemainInside from the location WalkAround, then it will transit to the location it was earlier in. This is ensured by the guard room[pid] == x, checking if the person was in room x earlier or not. This is indicated by the signal noChange to the control automaton. Along the transition from RemainInside to either of the locations representing the rooms, roomPat array is updated to denote that person is still in that room by setting roomPat[pid][x][ts] to 1. The last event is GoingToHome. The signal eve received from the timer automaton captures this event.
Figure 4. Control Automaton The automaton upon receiving the eve signal, moves to either Outside or RemainInside location denoting that the person has gone home or has remained inside the room he was in. If the person goes out, then the signal goout is sent to the control automaton, and the noChange signal is sent if he stays inside his room. The loop between the locations Outside and OutToOut is to indicate that all the events are over and the person stays outside. This is achieved through the synchronization channels eve and noChange. C. The Control Automaton The control automaton (Figure 4) basically deals with the energy part of our problem, that is, it updates the energy pattern array that stores the information about the energy consumption by the occupants at each time-step in each room. The automaton works as follows. Initially the automaton is in the start location and then it moves to either the switchOff or forgetBeforeLeaving based on the energy awareness of the occupant indicated by off[pid] and on[pid]. In either case the sincerity array sincere[pid][ts] is updated to indicate if the power being utilized was switched off or not. Again, the probabilities of switching off or leaving it on are represented by the probability weights, off[pid] and on[pid]. These three automata together represent the system.

3.1.2 Model Checking the System As described earlier, model checking is done by expressing the properties to be checked in the form of weighted MITL queries. Figure 5 describes is a snapshot of the statistical parameters set in UPPAAL-SMC for the experiments. Table 1 describes some important queries and their results.
Figure 5. Statistical Parameters set in UPPAAL SMC

Table 1.
weighted MITL Query Meaning Result Pr [≤1000] (saving≥50 and
saving ≤100 ) Prob. that saving is between 50
and 100 [0.3898, 0.4898]
E[≤1000,100] {max:saving} What is the expected max. saving within time period 1000 in a total
of 100 simulations [With Average Sincerity being
0.7]
E(max:saving)
=316.31
Pr([100,600](forget≥remember)) Prob. that the total no. of times occupants forgot to switch off was
at least as much as the no. of times they remembered to switch
off within time period 100 and 600
[0.9500,1.0000]
E[≤600,100] {max:remember} What is the expected max. no. of times the occupants remember to switch off within time period 600
in a total of 100 simulations? [With Average Sincerity being
0.3]
E(max:remembe
r) =40.96
E[≤600,100] {max:forget} What is the expected max. no. of times the occupants forget to switch off within time period 600 in a total of 100 simulations?
[With Average Sincerity being 0.3]
E(max:forget)
=99.51
Pr [≤1000] (saving≥100 and saving ≤150 )
Prob. that saving is between 100 and 150 within 1000 time period
[0.0, 0.09738]
4.1 Plain Simulation Approach The idea behind this approach is similar, and also involves generating the occupancy profile using the method explained of Wang et al (2011). What remains to be done is to generate the energy usage pattern, which captures the information about the state of power (on or off) at each time-step, based on the average level of energy awareness of the occupants. Having obtained the energy pattern matrix, we count those time-steps in which the energy was being consumed without user presence in the room. Based on the occupancy profile and the energy profile thus generated, we have the energy savings as depicted in Figure 6.

Figure 6. Energy Saved (in time-steps)
This figure depicts one-day savings in terms of the total number of time-steps in which the occupant forgot to switch off the power they were using just before leaving the room. The x-axis is the simulation number, and the y-axis is the savings in time-steps. The graph is plotted with different values of average sincerity level or energy awareness of the occupants. As is clear from the plot, energy savings is quite high when the avg. sincerity level is less. But as the sincerity level increases, the energy saved decreases, which is as expected. Following is a rough translation of energy savings into monetary savings: Considering, an initial investment = INR 50001 x 3 rooms = INR 15000 Cost per unit power 1 kWh = INR 5 No. of units consumed = (Watt x Hour) / 1000 Average wattage per device: 20 W (Assumed) One time-step = 10 minutes = 10/60 hour Average One Day Savings = INR (20 * No. of time-steps/6)*5/1000 = time-steps/60. Table 2 draws a comparison between the investment in smart technology and elsewhere. The savings in time-steps are obtained by averaging the energy saved over 100 runs of the program with varying energy awareness indicated by the first column. ‘y’ means that money should be invested in smart technology because the savings thus obtained would exceed that obtained by investing money elsewhere with rate of return on investment being r; and ‘n’ indicates that it should be invested in the other alternative. Table 3 compares the values for energy saved (in time-steps) using the two approaches.
1 Rough estimate based on information available on http://goo.gl/RoYm5H

Table 2 Avg. Sincerity p 1 day savings
(time-steps) 5 year savings (INR) r=6% r=8% r=10%
0.1 901.14 27409.675 y y y 0.3 694.24 21116.467 y n n
0.5 502.61 15287.721 n n n 0.7 299.05 9096.104 n n n
0.9 103.56 3149.95 n n n 1.0 0 0 n n n
Table 3
Avg. Sincerity p Plain Simulation Model Checking
0.1 901.14 965.68 0.3 694.24 766.32
0.5 502.61 536.71 0.7 299.05 316.31
0.9 103.56 105.36 1.0 0 0

Acknowledgements
This work was supported by the project on Cyber Physical Systems at IIT Hyderabad funded by Department Electronics and Information Technology (DeitY), Govt. of India.

References C. Liao and P. Barooah, An integrated approach to occupancy modeling and estimation in commercial buildings, American Control Conference (ACC) 2010, IEEE, pp. 3130–3135, 2010. I. Richardson, M. Thomson, and D. Infield, A high-resolution domestic building occupancy model for energy demand simulations, Energy and Buildings 40 (8), Elsevier, pp. 3130–3135, 2008. J. Page, D. Robinson, N. Morel and J.-L. Scartezzini. A generalised stochastic model for the simulation of occupant presence, in Energy And Buildings, vol. 40, pp. 83-98, 2008. C. Wang, D. Yan, and Y. Jiang, A novel approach for building occupancy simulation, Building Simulation, Volume 4 (2), Springer, pp. 149–167, 2011. A. David, K. G. Larsen, A. Legay, M. Mikučionis, and D. B. Poulsen, Uppaal SMC Tutorial, International Journal on Software Tools for Technology Transfer 17(4), pp. 1–19, 2015. Contact email: [email protected] Contact email: [email protected] Contact email: [email protected]