
Acoustic Emission Examination of Polymer-Matrix Composites · ACOUSTIC EMISSION EXAMINATION OF...
16
ACOUSTIC EMISSION EXAMINATION OF POLYMER-MATRIX COMPOSITES JÜRGEN BOHSE BAM, Federal Institute for Materials Research and Testing Unter den Eichen 87, D-12200 Berlin, Germany Abstract This article shall illustrate which general information about initiation and accumulation of damages, critical damage stages and stable macro-crack propagation in polymer-matrix compos- ites arise from conventional AE features and analysis of AE signals. It is referred to currently used methods for classification and identification of AE sources. Studies of stressed specimens cut from laminates with different lay-ups are performed to receive basic information about the AE indication of micro- and macro-failure processes of materials used for the design of compos- ite structures. Micro-failure by inter-fiber fracture indicates a critical stress/strain state, which should not be exceeded for a long life-time. Results of the theoretical analysis of inter-fiber and fiber fracture in laminates under tension are compared with monitored stress dependent AE be- havior. Another important damage process that can significantly reduce the residual strength or life-time of composite structures is the macroscopic delamination within weak areas. AE exami- nations of the static interlaminar fracture behavior of unidirectional, continuous fiber-reinforced laminates under different fracture modes are discussed. AE results from pressure tests of exter- nally non-damaged and damaged filament wound all-composite pressure cylinders are presented and criteria for identification of “heavy” damages such as impacts and flaws are suggested. Fi- nally, particular problems associated with the distortion of stress waves at wave propagation and by the AE transducer are pointed out. The affiliated problems of the identification of AE source mechanisms in polymer-matrix composites using AE signals are discussed. 1. Introduction AE measurement technique is based on generation of acoustic (elastic stress or pressure) waves by fast propagating micro-failure processes or other sources. Highly sensitive piezoelec- tric transducers passively detect these waves by dynamic surface motion on sub-nanometer scale and convert it into an electric signal. The practically used frequency range is about 50 kHz to 1 MHz. Lower frequencies are often associated with extraneous noise sources or resonance effects of the transducer case. Higher frequencies are excessively attenuated by polymer-matrix materi- als and, hence, these high-frequency parts of waves are carried to a distance no longer than a few centimeters from the source location. AE testing is a real-time measuring and on-line evaluation technique. It basically shall give information as to when (time, external loading parameter), how many (rate), how intense (ampli- tude, energy) and where (location of AE sources) stress-wave emitting damage processes in specimens or structures occur. However, the interpretation of AE signals and the separation of “true” damage sources from extraneous noise or rubbing of fracture surfaces is still a major prob- lem of this method. For a long time only conventional AE features, e.g., peak amplitude, AE counts, duration, etc. of the signals or its distributions and correlation plots were used. Recent developments in hardware components for AE monitoring and new methods of AE signal analy- sis seem to yield additional information for the identification of AE source mechanisms. J. Acoustic Emission, 22 (2004) 208 © 2004 Acoustic Emission Group
Transcript of Acoustic Emission Examination of Polymer-Matrix Composites · ACOUSTIC EMISSION EXAMINATION OF...

ACOUSTIC EMISSION EXAMINATION OF POLYMER-MATRIX
COMPOSITES
JÜRGEN BOHSE
BAM, Federal Institute for Materials Research and Testing Unter den Eichen 87, D-12200 Berlin, Germany
Abstract
This article shall illustrate which general information about initiation and accumulation of damages, critical damage stages and stable macro-crack propagation in polymer-matrix compos-ites arise from conventional AE features and analysis of AE signals. It is referred to currently used methods for classification and identification of AE sources. Studies of stressed specimens cut from laminates with different lay-ups are performed to receive basic information about the AE indication of micro- and macro-failure processes of materials used for the design of compos-ite structures. Micro-failure by inter-fiber fracture indicates a critical stress/strain state, which should not be exceeded for a long life-time. Results of the theoretical analysis of inter-fiber and fiber fracture in laminates under tension are compared with monitored stress dependent AE be-havior. Another important damage process that can significantly reduce the residual strength or life-time of composite structures is the macroscopic delamination within weak areas. AE exami-nations of the static interlaminar fracture behavior of unidirectional, continuous fiber-reinforced laminates under different fracture modes are discussed. AE results from pressure tests of exter-nally non-damaged and damaged filament wound all-composite pressure cylinders are presented and criteria for identification of “heavy” damages such as impacts and flaws are suggested. Fi-nally, particular problems associated with the distortion of stress waves at wave propagation and by the AE transducer are pointed out. The affiliated problems of the identification of AE source mechanisms in polymer-matrix composites using AE signals are discussed. 1. Introduction
AE measurement technique is based on generation of acoustic (elastic stress or pressure) waves by fast propagating micro-failure processes or other sources. Highly sensitive piezoelec-tric transducers passively detect these waves by dynamic surface motion on sub-nanometer scale and convert it into an electric signal. The practically used frequency range is about 50 kHz to 1 MHz. Lower frequencies are often associated with extraneous noise sources or resonance effects of the transducer case. Higher frequencies are excessively attenuated by polymer-matrix materi-als and, hence, these high-frequency parts of waves are carried to a distance no longer than a few centimeters from the source location.
AE testing is a real-time measuring and on-line evaluation technique. It basically shall give information as to when (time, external loading parameter), how many (rate), how intense (ampli-tude, energy) and where (location of AE sources) stress-wave emitting damage processes in specimens or structures occur. However, the interpretation of AE signals and the separation of “true” damage sources from extraneous noise or rubbing of fracture surfaces is still a major prob-lem of this method. For a long time only conventional AE features, e.g., peak amplitude, AE counts, duration, etc. of the signals or its distributions and correlation plots were used. Recent developments in hardware components for AE monitoring and new methods of AE signal analy-sis seem to yield additional information for the identification of AE source mechanisms.
J. Acoustic Emission, 22 (2004) 208 © 2004 Acoustic Emission Group

2. AE Tools for Identification and Evaluation of Damage Stages
Currently used AE tools for the identification and evaluation of damage or fracture stages of polymer composites are summarized in the following overview (see also Fig. 1):
Changes in AE activity or AE intensity with time or external parameter
First AE hits/events (1) → onset of damage processes
Characteristic changes of AE hit/count/event/energy rate or cumulative sum (2) → progressive increase – “knee point” (progressive damage and/or occurrence of new
failure mechanisms) → continued holding or increasing AE activity and intensity during hold periods of load-
ing (achievement of unstable damage stages) → increasing AE activity during unloading (rubbing of damaged areas, e.g. delaminated
surfaces) AE amplitude distribution (3)
→ number and types of failure mechanisms → high amplitude hits
Felicity ratio (ratio of the load at onset of significant AE during reloading to the previously applied maximum load)
→ ultimate failure warning if it falls below a certain value (≤ 0.90 - 0.95)
Location of AE sources
Planar or zonal location of single events or event clusters → location, size, shape and growth direction of AE active zones, which are characteris-
tic for individual forms of damage (delamination, impact, flaw)
Identification of AE sources Tools:
• conventional AE features (peak amplitude, counts, duration and energy of the signal are dependent on transducer, frequency filter and/or threshold)
• AE feature histograms and correlation plots (e.g. log duration (or counts) vs peak amplitude)
• waveform / wave mode analysis (wavelets) • frequency spectrum (FFT) • pattern recognition by means of neuronal networks • inverse moment tensor analysis • modeling of AE sources identification of AE source mechanisms → separation of "true" damage mechanisms from extraneous noise sources
(hydraulic noise, water flow, rubbing etc.)
The interpretation of AE results is also supported by finite element (FE) modeling of local stress/strain conditions as well as by micro-mechanical modeling of failure processes in lami-nates (inter-fiber failure or fiber break).
209

Fig. 1 AE from unidirectional aramide-fiber-reinforced polyamide composite during tensile test.
Active failure mechanisms in polymer-matrix composites which should be detected by the AE method are
• matrix cracking • fiber/matrix interface debonding • fiber break • intra- or interlaminar crack (delamination) propagation.
A number of general approaches used for identification of AE sources are described in the literature [1, 2]. In reference [2] also specific problems and ways to the interpretation of AE sig-nals from composite materials are discussed. From composites mostly thin-walled structures are manufactured. Therefore, mainly plate waves are generated from AE sources. Modal analysis of plate waves is based on a preferred stimulation of specific wave modes by different fracture modes, fracture geometries and location of sources (bulk or surface) and has the purpose to rec-ognize out-of-plane (delamination mechanism) and in-plane (fiber break) sources. Longitudinal (extensional mode) and shear components (flexural mode) of the signals are analyzed by wavelet transform (time-frequency domain) which is suitable for AE signals whose statistical properties change with time as in the case of plate waves. The method of inverse moment tensor analysis of AE signals from volume waves of sources tries to separate shear cracks from tensile cracks dur-ing nucleation of the fracture process zone and crack propagation in larger isotropic structures.
A comparative analysis of selected international and national standards and guidelines on AE testing yields an assessment of the current status of standardization [3]. 210

3. Analysis of Micro-Failure Processes
For dimensioning of structures it is important to have reliable failure models. However, mod-ern physically interpretable failure criteria should be based on specified modes of failure [4, 5]. The referred criterion describes initial failure by an inter-fiber fracture mode and ultimate macro-failure by fiber fracture. Therein, inter-fiber fracture means both interfacial failure (fiber/matrix debonding) and matrix cracking. Aims of the studies were to check the fitness for use of failure models and a better interpretation of AE signals by theoretically expected modes of micro-failure. Another interesting question is what stress level is relevant for a significant reduction of fatigue life-time and how it is expressed in the AE characteristics.
Fig. 2 AE behavior (signal amplification = 60 dB) and failure analysis of two carbon-fiber/epoxy laminates by means of modeling of inter-fiber failure and fiber break (arrows). Here, #45 indi-cates ±45˚ plies.
211

The stress for inter-fiber fracture strongly depends on fiber/matrix adhesion, matrix strength, fiber orientation and volume of fibers. Due to the problem with a reliable analytical approxima-tion of the intra-laminar failure the database for modeling were extracted from experimental re-sults.
Figure 2 shows AE test results compared with theoretical results of a layer-by-layer stress and failure analysis of carbon-fiber/epoxy laminates by use of the inter-fiber fracture (IFF) and fiber break criterion. For calculation of inter-fiber fracture of laminates the tensile strength for pure 90° layers with load application transverse to the fiber orientation and the shear strength of 0° layers parallel to the fiber orientation (characterizing shear failure of #45° laminates: #45˚ = ±45˚) were used.
Because of its high sensitivity the AE technique indicates the occurrence of micro-damages
long before ultimate macro-failure. Naturally, the sensitivity of detection and, hence, the deter-mination of stresses where first AE hits are observed depends on the detection threshold. During our tests AE signals of different characteristics are detected at about 60-70% of the theoretical approximated loading levels for initiation of inter-fiber fracture and fiber break. Thereby differ-ent failure processes are indicated by its individual AE characteristic (here the dimension of AE activity means hits/s and AE intensity is given by mVs/hit):
• Laminate (90°)6 / (#45°)3 / (90°)6: transverse failure of fiber/matrix interfaces and matrix in 90° laminated layers are of low AE activity and AE intensity whereas shear failure of ma-trix and interfaces in #45° woven layers superposed by delamination processes between 90° and #45° layers are of medium AE intensity but high AE activity; pure shear deforma-tion in #45° layers produce very high AE activity after ultimate fracture of 90° layers at the stress maximum.
• Woven fabrics (0°/90°): transverse failure of fiber/matrix interfaces and matrix (90° direc-tion); breaks of fiber bundles in 0° direction is associated with very high AE intensity at stresses higher approximately 70% of the ultimate laminate strength.
From this an energy criterion for separation of inter-fiber and fiber failures in specimens can
be derived by means of the conventional AE features signal peak amplitude and signal energy. Breaks of fiber bundles are detected by AE signals with ten to hundredfold higher amplitudes and energy rates than matrix cracking.
The comparison of results from fatigue tests and AE examination of the damage progress
shows that the critical stress/strain state which should not exceeded for a long life-time is deter-mined by the onset of first and continuous AE. In carbon-fiber reinforced epoxy composites, that means a stress level of about 20-25% of the ultimate laminate strength.
The methodology of a layer-by-layer stress and micro-failure analysis combined with AE ex-
amination naturally can be applied to composite structures to approximate maximum stress levels for a long life and to support the optimization of laminate lay-ups. 4. Studies of Delamination Behavior
Several standardized fracture mechanics tests are used for the purpose to determine the resis-tance against inter-laminar crack propagation. The delamination behavior of unidirectional fiber-reinforced polymer laminates made from glass-fibers or carbon-fibers with thermoplastic or
212

epoxy matrix were studied using different fracture tests such as Double Cantilever Beam test (mode I), End Notched Flexure test (mode II) und Mixed Mode Bending test (mixed mode I/II) [6, 7].
The application of AE examination has two aims. On the one hand this technique shall con-tribute to a more objective determination of initiation loads (for micro-crack initiation and onset of macroscopic delamination) and to overcome the problems arising from the difficult and sub-jective optical observation of the delamination growth on the edge of the specimen. On the other hand AE examination gives additional information on micro-processes which appear during de-lamination for a better micro-mechanical understanding of the toughness behavior. Those ex-periments exemplify one of the most frequent macroscopic failure processes in composite struc-tures.
An example is given in Fig. 3. It shows the AE behavior of a unidirectional reinforced com-posite during mode I delamination.
Fig. 3. Loading (top left) and fixed AE transducer position for location of AE sources in delami-nation tests (bottom left). Time-dependent delamination load (line) and AE signal energy (points) from DCB (mode I) tests on unidirectional reinforced glass-fiber/polypropylene (top right). Time-dependent position and size of the damage zone determined by location of AE events with amplitudes at the transducer ≥ 60 dBAE (bottom right).
213

For the first objective following statements resulted: • Location of AE sources around the delamination tip enable the determination of
° position of the delamination front ° initiation points (loads):
INITlocAE: micro-crack initiation at the delamination tip INI-PROPlocAE: onset of macroscopic delamination propagation
° delamination speed ° size and shape of energy-dissipative zones around the delamination tip (with the assis-tance of FE modeling).
• If the delamination is connected with similar failure processes such as matrix cracking and fiber/matrix interface debonding a correlation between AE energy and mechanically released energy during stable delamination propagation exists. In the case of fiber frac-ture in the bent cantilevers or break of bridging fibers the correlation becomes non-linear – AE burst signals with high energy are produced but only a small mechanical energy is released (Fig. 4). Breaks of bridging fibers between the opened delamination surfaces frequently occur specially in composites with weak interface adhesion and result in AE sources behind the delamination tip (Fig. 5).
• Number and intensity of AE signals are dependent on matrix and fiber material as well as fiber/matrix adhesion. Therefore, above-mentioned energy correlation has to be estab-lished for each composite material.
Fig. 4 Correlation between mechanical energy release and AE energy during mode I delamina-tion of glass-fiber/polypropylene uni-directional (UD)-composites: (left) for one specific delami-nation test; (right) for stable delamination propagation in different composites with varied poly-propylene matrices and adhesion .
With reference to detectability and size assessment of propagating delamination areas in composite structures it can be concluded that mode I delamination generates most and strongest AE sources associated with the largest process zone around the delamination tip compared with other fracture modes. Maximum AE peak amplitudes detected a few cm from the source are 90 to 100 dBAE, but maximum amplitudes from shear fracture mode II are only 70 to 80 dBAE. Con-sequently, the detectability of propagating delamination tips should be good. Most of the AE sources are positioned at areas behind the delamination tip. Unstable fracture stages with high delamination speeds and development of large delamination cracks (e.g., fast splitting of UD-filaments at hoop-wrapped pressure cylinders) yield AE signals with high peak amplitudes and high energies.
214

Fig. 5 Images of fracture surface (left) and bridging fibers (right) from mode I delamination. 5. AE Inspection of Pressure Cylinders
In order to investigate the AE characteristic of damages in all-composite cylinders (made of a plastic liner and fully-wrapped with a filament wound carbon-fiber/epoxy shell) the cylinders were externally damaged by impacts or flaws and were pressurized up to the allowed test pres-sure. After a varying number of internal pressure cycles the cylinders were inspected performing pressure tests accompanied by AE testing (Fig. 6). For the purpose of comparison also a non-damaged cylinder whose micro-damages only results from pure pressure cycling was inspected.
Fig. 6 Transducer mounting for separate AE testing of cylinder No. 3.
215

For example, Fig. 7 shows AE results from a pressure test of an impact damaged cylinder (impact with Wkin. = 2 x 70 J in the central part of an oil-filled cylinder) after 5000 pressure cy-cles (∆p = 5 – 300 bar) up to a test pressure of 360 bar.
Fig. 7 AE testing of MCS 6.8litre/300bar all-composite cylinder after 5000 cycles; (left) without external damage; (right) with impact damage.
top: test pressure, AE hit rate, peak amplitude and energy of AE signals vs. time middle: energy sum of hits detected by different transducer groups vs. test pressure bottom: planar located AE sources; cluster size: range/20 [5%] and minimum level: E > 10.000
216
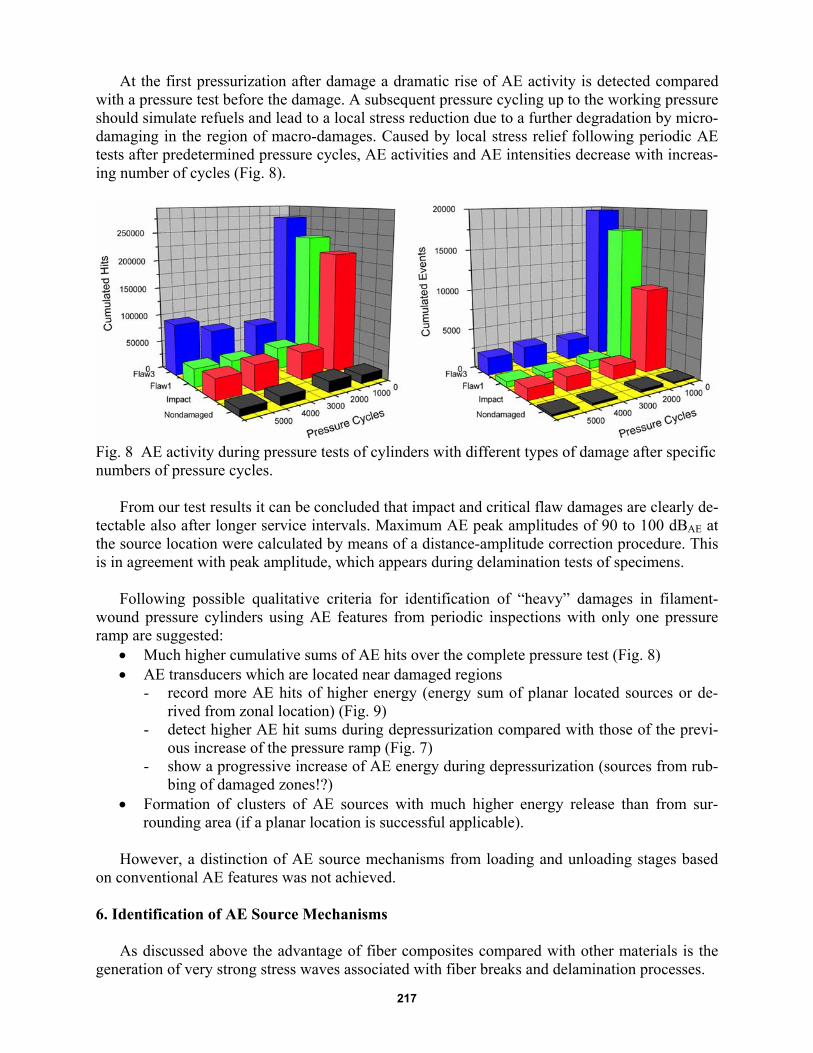
At the first pressurization after damage a dramatic rise of AE activity is detected compared with a pressure test before the damage. A subsequent pressure cycling up to the working pressure should simulate refuels and lead to a local stress reduction due to a further degradation by micro-damaging in the region of macro-damages. Caused by local stress relief following periodic AE tests after predetermined pressure cycles, AE activities and AE intensities decrease with increas-ing number of cycles (Fig. 8).
Fig. 8 AE activity during pressure tests of cylinders with different types of damage after specific numbers of pressure cycles.
From our test results it can be concluded that impact and critical flaw damages are clearly de-tectable also after longer service intervals. Maximum AE peak amplitudes of 90 to 100 dBAE at the source location were calculated by means of a distance-amplitude correction procedure. This is in agreement with peak amplitude, which appears during delamination tests of specimens.
Following possible qualitative criteria for identification of “heavy” damages in filament-
wound pressure cylinders using AE features from periodic inspections with only one pressure ramp are suggested:
• Much higher cumulative sums of AE hits over the complete pressure test (Fig. 8) • AE transducers which are located near damaged regions
- record more AE hits of higher energy (energy sum of planar located sources or de-rived from zonal location) (Fig. 9)
- detect higher AE hit sums during depressurization compared with those of the previ-ous increase of the pressure ramp (Fig. 7)
- show a progressive increase of AE energy during depressurization (sources from rub-bing of damaged zones!?)
• Formation of clusters of AE sources with much higher energy release than from sur-rounding area (if a planar location is successful applicable).
However, a distinction of AE source mechanisms from loading and unloading stages based
on conventional AE features was not achieved. 6. Identification of AE Source Mechanisms
As discussed above the advantage of fiber composites compared with other materials is the generation of very strong stress waves associated with fiber breaks and delamination processes.
217

Fig. 9 Transducer location dependent AE monitoring (transducer 3 and 4 near the damaged re-gion).
In previous papers [8, 9] we suggested a method to distinguish matrix cracking and fiber-break sources by a power spectrum analysis of the monitored AE waveforms. It was assumed that matrix cracks have at least 70 % of the signal power in the 100 to 350 kHz and fiber break in the 350 to 700 kHz frequency interval.
New results and a better understanding of the effects of wave propagation show that we must
be careful with the conclusion drawn from this method. Effects of wave propagation such as geometrically determined attenuation, wave-mode interactions, reflections, mode conversions at free surfaces, etc. cause a clearly marked change of the wave in time and frequency domain on its path from the source location to the transducer position. In addition composites with a visco-elastic polymer matrix possess a comparatively high material attenuation, which is dependent on frequency, temperature and wave modes especially for frequencies greater than about 400 kHz.
Figure 10 demonstrates the strong difference in the waveforms and frequency spectra with
different transducer spacing to one and the same AE source. These results show that our above-mentioned method of identification of AE source mechanisms from its power spectra is strongly restricted to a very short distance of a few mm from the source.
In addition to geometrical and materials influences, modulations of waveforms and spectra
by the strong frequency dependent sensitivity of AE transducers and electronic frequency filters must be accounted for. All these effects cause spectra of AE signals, which have no similarity with theoretically assumed AE sources. The main influence in the frequency domain comes from
218

Fig. 10 Distance dependent waveforms and power spectra of AE signals from single glass-fiber fragmentation (fiber diameter 80 µm) in epoxy matrix (recorded with PAC-Pico transducers of shown frequency response, amplifier with HP-filter 20 kHz, sampling 5 MHz) at a distance of 7 mm (top) and 43 mm (bottom; only the first counts of the waveform are shown) from the source. the more or less resonant behavior of piezoelectric AE transducer (Fig. 11). From activation of high-frequency resonance of AE transducer it only can be concluded that the AE source is broadband beyond this frequency range.
Technical structures from composite materials have plate-like geometries and the transport of
mechanic/acoustic energy is realized by plate waves (Fig. 12). Hence, an alternative method for separation of different modes of fracture seems to be the
modal analysis of plate waves. That means the main direction of source movement stimulates a preferred plate wave mode. For example, Fig. 13 shows waves generated by Hsu-Nielsen sources of different directionality. A pencil-lead break parallel to the plate (as fiber-break in-plane)
219

Fig. 11 Calculated spectrum of AE signal from the product of transfer functions Hi of the AE source, propagation medium (100 mm in PMMA rod), AE transducer and electronic system for waveform recording in the frequency domain (HAE = HS · HM · HT · HE).
Fig. 12 Velocity of Lamb waves (S0: extensional wave mode, A0: flexural wave mode) for wave propagation parallel to fiber orientation . stimulates a much stronger S0-wave mode than a lead break perpendicular to the plate (as de-lamination out-of-plane). But the problem of waveform and spectrum influences caused by high materials attenuation especially of high-frequency parts and by the AE transducer thereby also must be taken into account. That means for polymer-matrix composites there is practically no chance of source identification from frequency spectra of AE signals after long wave travel and also unless really flat and broadband transducers are used.
220

Fig. 13 Wavelet transform (time-frequency domain) of signals generated by Hsu-Nielsen sources in UD-glass-fiber/polypropylene at a distance of 300 mm from the broadband AE transducer PAC-S9208 (wave propagation parallel to fiber orientation).
221

7. Conclusions
• AE testing is a powerful method for online detection and analysis of matrix, fiber and inter-face related active fracture processes in composite materials.
• A number of tools for identification and evaluation of damage stages and failure mechanisms exists. They are based on changes in AE activity or intensity features, location of AE sources as well as the analysis of waveforms, spectra and wave modes from AE signals.
• The methodology of a layer-by-layer stress analysis of laminates combined with AE exami-nation is a good instrument to calculate critical stresses for inter-fiber and fiber fracture and of maximum allowable stress levels for a long life-time.
• Combination of fracture mechanics studies of delamination and AE measurement gives addi-tional information on micro-processes and a better micro-mechanical understanding of the toughness behavior.
• Stress waves emitted by fiber breaks cause much higher AE amplitudes than other mecha-nisms such as matrix cracking. Propagating delamination also produces strong AE sources from areas near the delamination tip.
• At pressure tests “heavy” damages in structures, such as impacts and flaws, are detectable by formation of cluster of located high-energy AE sources and a significantly higher AE activity and intensity, especially during depressurization periods.
• From studies of transfer functions of components of the measuring chain it must be con-cluded that it is difficult to separate micro-failure mechanisms in polymer-matrix composites from frequency spectra of AE signals. The source information is mainly distorted by the high attenuation of polymer materials related to high-frequency parts of stress waves and the transfer function of the AE transducer.
• Due to all discussed problems it is deduced that an identification of AE sources from fre-quency spectra of AE signals after long wave travel is not possible. Possibly this could be achieved by means of a numerical modeling of AE sources and the wave propagation in time and place. For this purpose source function, transfer function of wave-guiding medium, ge-ometry of the examined structure and characteristic of used AE transducer must be clearly defined.
References 1. Kishi, T., Higo, Y., Ohtsu, M. and Yuyama, S. (Eds.) (2000), Progress in Acoustic Emission
X, 15th International Acoustic Emission Symposium, 11-14 September 2000, Tokyo, Japan, Japanese Society for Non-Destructive Inspection.
2. Kishi, T., Ohtsu, M. and Yuyama, S. (Eds.) (2000), Acoustic Emission – Beyond the Millen-nium, 11-14 September 2000, Tokyo, Japan, Elsevier Science Ltd..
3. Brunner, A.J. and Bohse, J. (2002), “Acoustic Emission standards and guidelines 2002: a comparative assessment and perspectives”, NDT.net – September 2002, 7 (09).
4. Hinton, M.J., Kaddour, A.S. and Soden, P.D. (2002), “A comparison of the predictive capa-bilities of current failure theories for composite laminates, judged against experimental evi-dence”, Compos. Sci. Technol. 62, 1725-1797.
5. Puck, A. and Schürmann, H. (2002), “Failure analysis of FRP laminates by means of physi-cally based phenomenological models”, Compos. Sci. Technol. 62, 1633-1662.
222

6 Bohse, J., Krietsch, T., Chen, J. and Brunner, A.J. (2000), “Acoustic Emission Analysis and Micro-mechanical Interpretation of Mode I Fracture Toughness Tests on Composite Materi- als”, 2nd ESIS Conference on Fracture of Polymers, Composites and Adhesives, Les Diablerets, Switzerland, September 13-15, 1999, ESIS Publication No. 27, Elsevier Science Ltd., 15-26.
7. Bohse, J. and Chen, J.H. (2001), “Acoustic Emission Examination of Mode I, Mode II and Mixed-Mode I/II Interlaminar Fracture of Unidirectional Fiber-Reinforced Polymers”, J. Acoustic Emission, 19, 1-10.
8. Krietsch, T. and Bohse, J. (1998), “Selection of Acoustic Emissions and Classification of Damage Mechanisms in Fiber Composite Materials”, Progress in Acoustic Emission IX, Big Island, Hawaii, USA, August 9-14, IV30-IV39.
9. Bohse, J. (2000), “Acoustic emission characteristics of micro-failure processes in polymer blends and composites”, Compos. Sci. Technol. 60, 1213-1226.
223


![Polymer matrix composites [pmc]](https://static.fdocuments.in/doc/165x107/5877c8191a28ab39588b6079/polymer-matrix-composites-pmc.jpg)

