ACKNOWLEDGMENTS - imtfi.uci.edu all... · ATM Automated teller machine ... a document outlining...
112
Transcript of ACKNOWLEDGMENTS - imtfi.uci.edu all... · ATM Automated teller machine ... a document outlining...

2 DIGITAL FINANCIAL SERVICES IN NIGERIA
D E C E M B E R 2 0 1 6
ACKNOWLEDGMENTS
This State of Market Report for Nigeria synthesizes the insights, ideas
and contributions aggregated through various interactions with
regulators, operators and industry experts. The Lagos Business School
Digital Financial Services Team is grateful to all who graciously spared
time to participate and contribute to this project.
We acknowledge the support of the Bill & Melinda Gates Foundation
(BMGF) Financial Services for the Poor (FSP) team, especially Dilly
Aberra, Abi Jagun, David Lubsinski, for their guidance, contributions and
support and the Financial Inclusion Secretariat (FIS) of the Central Bank
of Nigeria (CBN) led by Temitope Akin-Fadeyi. Editorial and document
production managed by Kasher Consulting, Design and concept -
Levitate Creative Studio.
PROJECT TEAMOlayinka David-West authored the report with contributions from
Olubanjo Adetunji, Olawale Ajai, Timothy Aluko, Olufemi Isheyemi,
Nkemdilim Iheanachor, Ikechukwu Kelikume, Omotayo Muritala, Ijeoma
Nwagwu, Cassandra Offodile, Adedoyin Salami and Immanuel Umukoro.

DIGITAL FINANCIAL SERVICES IN NIGERIA

4D E C E M B E R 2 0 1 6
DIGITAL FINANCIAL SERVICES IN NIGERIA

BACKGROUND 5
PART 2
PART 3
APPENDICIES
CONTENTS
ACRONYMS
EXECUTIVE SUMMARY
PART 1
Background
Country Profile
Financial Inclusion Overview
Consumer Insights
Supplier Insights
Sustainable Business Models
Way Forward
26
74
92
6
8
14
16
18
22
28
58
76
86
6 DIGITAL FINANCIAL SERVICES IN NIGERIA
D E C E M B E R 2 0 1 6
ACRONYMSDIGITAL FINANCIAL SERVICES IN NIGERIA

BACKGROUND 7
A2F Access to Finance
AC Annual costs
ACPS Average Cost-Per-Transaction
ACTA Accounts, CICO, Transactions and Adjacencies
AFC Annual fixed cost
AFI Alliance for Financial Inclusion
AMCON Asset Management Corporation of Nigeria
AML Anti-money Laundering
AMOC Annualised monthly operational cost
ARCs Assets, Resource and Capabilities
ASC Amortised start-up cost
ASOC Average Start-up Cost
AT Annual transactions (volumes)
ATL Above-the-Line
ATM Automated teller machine
B2B Business-to-Business
B2G Business-to-Government
B2P Business-to-Person
BMGF Bill & Melinda Gates Foundation
BTL Below-the-Line
CB Community Bank
CBN Central Bank of Nigeria
CDD Customer Due Diligence
CGAP Consultative Group to Assist the Poor
CICO Cash-in Cash-out
CPF Consumer Protection Framework
DFID Department for International Development
DFS Digital Financial Service
DMB Deposit Money Bank
DML Digital mobile licence
EFInA Enhancing Financial Innovation & Access
FI Financial Inclusion
FII Financial Inclusion Insights
FIS Financial Inclusion Secretariat
FLF Financial Literacy Framework
FMCG Fast-moving consumer goods
FSS Financial system stability
G2B Government-to-Business
G2P Government-to-Person
GDP Gross Domestic Product
GPZ Geo-political zone
ICT Information and Communications Technology
IVC Industry Value Chain
KYC Know Your Customer
MC Monthly costs
MDA Ministries, Departments and Agencies
MFB Microfinance Bank
MMO Mobile money operator
MNO Mobile network operator
MOC Monthly operational costs
MSC Monthly start-up costs
MT Monthly transactions
NCC Nigeria Communications Commission
NCS National Central Switch
NDIC Nigeria Deposit Insurance Corporation
NFIS National Financial Inclusion Strategy
NFLF National Financial Literacy Framework
NIBSS Nigeria Inter-bank Settlement System
NITEL Nigerian Telecommunications Limited
NPL Non-Performing Loans
NTB Nigerian Treasury Bills
OTC Over the Counter
P2B Person-to-Business
P2G Person-to-Government
P2P Person-to-Person
PIN Personal Identification Number
POS Point of Sale
PPI Progress out of Poverty Index
PSSP Payment Solution Service Provider
PTSP Payment Terminal Service Provider
SUBA Sub-Agent
USD United States Dollar
USSD Unstructured Supplementary Service Data
VAS Value Added Service
VTU Virtual Top-Up
8 DIGITAL FINANCIAL SERVICES IN NIGERIA
D E C E M B E R 2 0 1 6
EXECUTIVE SUMMARY
By current mobile telephony adoption estimates, Nigeria’s mobile money market should be in the mid-stages of development. With 21 licensed mobile money operators and an adult population with 40 per cent financially
excluded, DFS adoption rates have fallen below estimates deduced from population volumes.
Nonetheless, the national financial inclusion strategy, a document outlining targets to enhance financial
inclusion, projects to increase inclusion to 80 per cent by 2020. In real terms, the strategy seeks to
add more than 18 million adults to the formal and informal space by 2020. In a bid to close the current
gaps, this report presents the state of the market providing insights into the landscape of digital
financial services (DFS) for the unbanked/poor in Nigeria. The report explains market
dynamics, ecosystem participants, supplier capabilities and sustainable
business models.

9
EXECUTIVE SUMMARY
EXECUTIVE SUMMARY
MARKET DYNAMICS
The under-banked and unbanked citizens of Nigeria are predominantly women and youths between the ages of 18 and 35 with minimal education and either unemployed or in low-income earning jobs. Aside financial services - payments, savings and credit products, additional value proposition components include usage (accessibility, affordability and the lack of complications) and system (reliability and security) attributes.
The low economic activity amongst the under-banked and unbanked is a major inhibitor to adoption of mobile money. Added to issues such as lack of awareness, products-needs gap, product complexity and usage difficulty. In the case of credit, the support of family and friends are substitute alternatives that also limit adoption. Utility cost inhibitors are further classified as monetary and non-monetary. Monetary costs which include direct charges/fees for transactions, account registration and minimum balance maintenance are constrained by consumer socio-economic status. Amongst these under-banked and unbanked citizens, non-monetary costs are attributed to perceived cumbersome and complicated bank processes that amount to usage difficulties and delays, access to identity documents and travel costs resulting from distance of service locations, most especially in rural locations.
Current domestic remittance volumes through DFS are in excess of N1.9 trillion (send/outbound) and N3.2 trillion (receive/inbound) representing 17 and 26 per cent of the estimated total remittance market
respectively. International remittance volumes are in the range of N259 billion (send/outbound) and N155 billion (receive/inbound), representing 0.6 and 2.9 per cent respectively. Savings and credit
penetration rates are in the range of 66 and 23 per cent respectively and minimal acceptance and adoption of other financial services such as insurance and pensions, possibilities for DFS
growth abound.

10 DIGITAL FINANCIAL SERVICES IN NIGERIA
D E C E M B E R 2 0 1 6
DFS ECOSYSTEM AND CAPABILITIES
Figure 1: DFS ecosystem
The DFS ecosystem is richly populated with MMOs, super-agents and agent aggregators and sub-agents at the core. These together form the core suppliers that acquire and develop capabilities to create and deliver consumer value propositions. Core DFS suppliers have developed sufficient physical resources required for business operations. At the lowest level of the capabilities pyramid are people, locations, technology, activities and finance. Moving higher up the pyramid, human capital and institutional capabilities are at various stages of development. As illustrated in Table 1, the checkmarks represent the presence of dominant capabilities amongst core supplier groups.
Table 1: Capabilities summary

11EXECUTIVE SUMMARY
CLOSING THE GAPS - RECOMMENDATIONS
The recommendations below propose initiatives to close the gaps and grow DFS adoption.
BUILD NETWORK EFFECTS
Irrespective of strategy or industry approach, the need for demand side economies of scale, also known as network effects are essential to DFS adoption and utility amongst the under-banked and unbanked populations. Thus, ecosystem approaches to collectively build network effects that enhance the value of DFS cannot be overstated. This requires collaborative ecosystem strategies that enhance the national vision of financial inclusion, scheme and operator services.
ADOPT NEW BUSINESS MODELS
The ability to meet the customer value propositions requires supplier business models that support payments and industry value chains (IVCs) through focused or specialist models. Focused business models target the delivery of efficient payment or financial services via mobile channels. These are also applicable to affinity (women, youth, religious group) or lifestyle customer segments. Specialist models target more complex industry value chains building solutions that not only support commercial activity but also embed industry business rules and processes. These models are more suited to operators that have the requisite system design (software development) capabilities.
ALTER THE FINANCIAL MODEL - REDUCE TRANSACTION COSTS
Notwithstanding, DFS mobile money operators are constrained by high cost structures (start-up, fixed and operating) that translate into high cost-to-serve estimates, often resulting in high cost-to-use. With relatively high fixed, start-up and operational costs combined with low consumer adoption and hence low transaction volumes, the average transaction cost incurred by the MMOs is just below N132.00 (one hundred and thirty two naira). The corresponding transaction cost for over-the-counter (OTC) services at sub-agent locations averages about N604 (six hundred and four naira). Cost reductions can be achieved by:
A: CHEAPER SOLUTIONS:
The possibility of adopting open systems such as blockchain systems is another cost-reduction approach that can be deployed by suppliers as opposed to traditional transaction processing and switching systems. Using blockchain technology, person-to-person (P2P) transactions are direct, eliminating the intermediaries and thus cheaper and faster, yet secure. Alternatively, the development of solutions locally will reduce software support and maintenance fees that are volume-dependent and subject to exchange rate risk.
B: PATIENT CAPITAL:
Unlike banking, the returns associated with serving bottom of the pyramid markets are slower. Thus, the combination of high costs of doing business as well as lack of patient capital in support of long-term investments restricts long-term interest and commitment to the business.
C: INCREASE REVENUES STREAMS:
Non-bank MMOs may focus on specialist models that involve development of fee-earning software solutions.

12 DIGITAL FINANCIAL SERVICES IN NIGERIA
D E C E M B E R 2 0 1 6
DEVELOP CAPABILITIES
At the lowest level, the industry needs to develop specialist knowledge and skills in payments systems and software development. The human capabilities to create, deliver and support efficient operations and services through practices such as inclusive business design, business process management (BPM), business intelligence and service management need further development. Specialist knowledge of route-to-market and trade promotion strategies to enhance the DFS reach and adoption should be replicated from the consumer goods industry that have a track record of successfully serving bottom of the pyramid markets. Inclusive business strategies to serve the under-banked and unbanked consumer segments need to be crafted, taking cognizance of specific business model designs. This, combined with collaborative arrangements amongst operators towards the common vision of financial inclusion is vital.
ALTER INDUSTRY STRUCTURES
A: SUPPLY-SIDE
The current industry structure supporting financial inclusion is fragmented with numerous operators promoting proprietary branded DFS. To promote interoperability, connection to the National Central Switch (NCS) is stipulated in the mobile money guidelines; in practice transaction exchanges between operators are rare. This gap either limits adoption or increases the number of relationships and network complexity. Reducing network complexity and relationships may require a scheme-oriented view with multiple interconnected and interoperable operators. Alternatively, the adoption of two-sided market structures, known as digital platforms should also be considered. Redefining the industry and applying platform concepts would facilitate the emergence of one or more platforms facilitating interactions between producers and consumers.
B: BUILD INDEPENDENT AGENTS
The paucity of critical mass and interoperability is magnified at the agency level; this is further complicated by the unhealthily high competition for agent retention amongst MMOs and super-agents. Through network effects, a reversal of the current supply-side push in favour of agent demand-pull is anticipated. As such, alternative agent management models and possible agent independence will complement existing methods.

13
REPORT STRUCTURE
This report is in 3 parts. Part one sets the context and the problem with an introduction to the country and the state of financial inclusion. Part two presents the demand-side and supply-side components of the business model starting with customer segment profiles and value propositions for DFS amongst under-banked and unbanked adult Nigerians. Also included in part two are ecosystem capabilities employed in development and delivery of DFS. The report concludes with recommendations of sustainable business models drawing additional insights from distribution networks in fast moving consumer goods (FMCG) industry.
EXECUTIVE SUMMARY

14
PART 1DIGITAL FINANCIAL SERVICES IN NIGERIA

BACKGROUND 15
Background
Country Profile
Financial Inclusion Overview

16 DIGITAL FINANCIAL SERVICES IN NIGERIA
D E C E M B E R 2 0 1 6
ABOUT LBS
Lagos Business School (LBS) began in 1991 as the Centre for Professional Communications (CPC), offering management courses relevant to the Nigerian business environment. It was previously owned by the African Development Foundation (ADF), a Nigerian not-for-profit educational foundation, but is now owned by the Pan-Atlantic University Foundation (PAUF).
LBS began a joint Executive MBA programme with IESE Business School, Barcelona in 1996. In January 2002, the Federal Government granted approval for the establishment of Pan-African University (now Pan-Atlantic University), and Lagos Business School thus became the first school of the University able to offer its own Executive MBA programme in the same year. The full-time MBA programme was added in 2003 to develop younger professionals as functional managers with global perspectives and practical management knowledge relevant to the Nigerian business environment. By 2007, LBS had consolidated its status as Nigeria’s premier business school by ranking for the first time among the top 50 business schools in the world, in the area of open enrolment programmes, by the Financial Times of London. LBS is the still the only Nigerian business school to be included in this prestigious world ranking.
BACKGROUND

BACKGROUND 17
LBS, supported by the Bill & Melinda Gates Foundation (BMGF), embarked on a two-year research project titled “sustainable business models for delivering digital financial services to lower income unbanked citizens of Nigeria”. The project seeks to better understand how providers can bring digital financial services to Nigeria in a profitable and sustainable way - including studying the specific delivery and access constraints and unique barriers we must overcome in Nigeria to enhance access and inherently financial inclusion. The project will also examine the issue of distribution and the design of convenient and pro-poor agent networks. This research will be conducted in several phases through in-person engagements with industry experts and stakeholders.
PROJECT BACKGROUND
The adoption and access to mobile communications systems (voice and data) has altered digital divide reports that typically denounced progress in most African economies. For example, Nigeria has recorded remarkable increases in teledensity; in Kenya, the high adoption rates of mobile money service, M-Pesa has highlighted the significance of digital payments forming a foundation for other digital financial services (DFS). M-Pesa’s success has however not been replicated in most other African markets like Nigeria whose national financial inclusion strategy targets 80% of adult Nigerians will be financially served by formal and informal service providers by 2020. 1 Thus, the absence of an evidence-base acquired through research to support reform at the regulatory, market or customer-levels makes financial inclusion aspirations difficult to attain.
The mobile money licensing regime in Nigeria, like Bangladesh, excludes the sole participation of mobile telecommunications operators that have successfully deployed such services in various other markets. Regulatory gaps account for this scenario and this report attempts to unpack the licensing regime to provide a clear understanding of the characteristics and opportunities in the Nigerian market. The success of mobile money as a mechanism for reducing financial exclusion and economically empowering the poor is fundamental to social and economic development goals. Against this backdrop, this project is aimed at enhancing the policy and regulation, knowledge base, and DFS operation in Nigeria. The project involves the investigation of the mobile money ecosystem towards the development of sustainable business models for delivering DFS to lower income unbanked Nigerians. It seeks to address the evident supply, demand and regulatory asymmetries in Nigeria’s mobile money market. Additional project information is available in Appendix 3.
This State of the Market Report is the first project output with focus on the supply-side view and through the presentation of consumer knowledge (segments and value propositions) as well as a proposal of sustainable business models alongside capabilities and constraints. In addition, the analysis of DFS economics illustrates utility and service costs.
1 Central Bank of Nigeria. (2012). National Financial Inclusion Strategy. Abuja: Central Bank of Nigeria.

18 DIGITAL FINANCIAL SERVICES IN NIGERIA
D E C E M B E R 2 0 1 6
COUNTRY PROFILE
NIGERIA The Federal Republic of Nigeria is Africa’s most populous country with a current projected population of 180 million people2, located in West Africa with an area covering the size of 923,768 square km. The country is located in the coastal states of West Africa on the shores of the Gulf of Guinea, with Benin to the west, Niger to the north, Chad to the northeast, and Cameroon to the east and south east.
In 2014, Nigeria carried out a rebasing of its Gross Domestic Product (GDP) exercise that broadened the sectors contributing to its GDP, officially putting the country as the largest economy in Africa with a GDP of USD 510 billion from about USD 270 billion. The over 89.9 per cent increase in GDP is due mainly to sectors such as telecommunication, movie and retail sectors that were previously not captured in the national income data.
Nigeria comprises of 36 states and a Federal Capital Territory with the nation’s capital located in Abuja. Nigeria runs a Presidential system that comprises of three tiers of government - executive, legislature and judiciary. The official language in Nigeria is English; however there are over 250 ethnic groups in the country which can be divided into three main groups: Hausa-Fulani in the north, Yoruba in the southwest, and Igbo in the southeast.
Nigeria is currently the largest oil producer in Africa and the 11th largest in the world with proven oil reserves of 37.2 billion barrels3. However, problems such as increased militancy in the Niger Delta and pipeline vandalisation have reduced the country’s production in the second quarter to less than 1.4 million barrels per day from the budgeted 2.2 million barrels in the 2016 appropriation bill.
The Nigerian economy is currently in a recession with GDP growth rate declining to an all time low of -0.36 per cent and -0.26 per cent in the first and second quarter of 2016. The poor performance of the economy is also reflected in the country’s exchange rate, which has been devalued by more than 168 per cent at the parallel market segment and is currently exchanging at N450/USD 1.00 as against N167.17/USD 1.00 in the second quarter of 2014.
2 Central Intelligence Agency - https://www.cia.gov/library/publications/the-world-factbook/geos/ni.html 3 Oil and Gas in Africa: Reserves, potentials and prospects of Africa - https://www.kpmg.com/Africa/en/IssuesAndIn sights/Articles-Publications/Documents/KPMG%20Oil%20and%20Gas%20Sector%20report%20updated.pdf

19COUNTRY PROFILE
NIGERIA 2015 MIDYEAR POPULATION BY AGE AND GENDER
Males: 92,588,169
15.2
<0.01%
<0.01%
0.01%
0.03%
0.11%
0.25%
0.44%
0.64%
0.84%
1.08%
1.41%
1.81%
2.29%
2.86%
3.40%
3.92%
4.55%
5.35%
6.43%
7.22%
8.36%
100+
95-99
90-94
85-89
80-84
75-79
70-74
65-69
60-64
55-59
50-54
45-49
40-44
35-39
30-34
25-29
20-24
15-19
10-14
5-9
0-4
<0.01%
<0.01%
0.01%
0.04%
0.13%
0.28%
0.47%
0.69%
0.90%
1.12%
1.40%
1.70%
2.10%
2.69%
3.23%
3.76%
4.36%
5.12%
6.14%
6.89%
7.97%
11.47 .6 3.80
Females: 88,973,887Gender Ratio (M/F): 1:041
15.211.47.63.80
Source: US Census Bureau Total Population: 181, 562, 056181,562,056

20 DIGITAL FINANCIAL SERVICES IN NIGERIA
D E C E M B E R 2 0 1 6
INDUSTRY
At independence in 1960, Nigeria’s industrial sector was dominated by the agricultural sector. The country’s favourable weather, arable land mass and abundant cheap labour drove productivity in the agricultural sector. However, with the discovery of crude oil in 1956, the structure of the Nigerian economy shifted from the agriculture to oil and gas. Since 1970, the oil and gas sector has been the primary source of foreign exchange earnings and government revenue. Presently, Oil and Gas account for over 90% of export earnings and more than 72% of export revenue. The current structure of the Nigerian Economy in Q2: 2016 is such that agricultural sector contributes about 22.6 per cent to GDP while industry and service sectors contributes about 22.7 per cent and 54.8 per cent to GDP respectively.
FINANCIAL SYSTEM
As in other countries, the financial system in Nigeria is made up of regulators, operators, agents and users which interact, which interact with each other and the rest of the world to foster sustainable economic development. The system includes a wide range of financial actors and agencies.
The commercial banking industry established since 1892 has evolved significantly as a result of economic and systemic failures that have led to reforms. Even though CBN commenced the gradual increase of minimum paid-up capital requirements in 1997, a major step affecting bank capitalisation was the increase, in 2004, of mandatory minimum capital requirement from N2bn to N25bn. This led to sector consolidation resulting in a reduction of the number of banks from 89 to 25. Other reforms have seen the establishment of Micro-finance banks to serve the lower users of financial services. A Banking Sector crisis in 1989, in part a fallout of the global financial crisis, led to the establishment of the Asset Management Corporation of Nigeria (AMCON) to act as ‘bad bank’ – acquiring and managing the non-performing loans of Banks (NPLs).
These various reforms have essentially resulted in fewer, well capitalised and better-managed institutions with local and global recognition of rating agencies such as Fitch and Standards and Poor.
The contribution of the financial service sector to real GDP in Q2:2016 is put at 3.05 per cent, lower than the contribution of 3.35 per cent recorded in the corresponding quarter of 2015, an indication of weak linkages to the real sector.
TELECOMMUNICATIONS
The Nigerian telecommunications industry, previously under the monopoly of government owned Nigerian Telecommunications Limited (NITEL), was incapable of meeting the volume and quality demands of Nigerians. The performance of the Nigeria’s telecommunications sector since independence did not peak until the 2000 liberalisation of the sector. The government’s main objective was to grow the nation’s telecommunications infrastructure rapidly and ensure a competitive market place that would improve quality and make services affordable to most of the population. Hence in 2001, the Nigeria Communications Commission (NCC) successfully conducted the auction for three digital mobile licences (DML). This gave rise to a telecommunications revolution that saw steady growth in teledensity.
By Q2:2016, real GDP contribution from the information and communications sector was 12.68 per cent.

21COUNTRY PROFILE
180M
160M
140M
120M
100M
80M
60M
40M
20M
0M
110%
100%
90%
80%
70%
60%
50%
40%
30%
20%
10%
0%
CountryPopulation
Year
Tele
den
sity
2001 2003 2005 2007 2009 2011 2013 2015
2001 2003 2005 2007 2009 2011 2013 2015
180M
160M
140M
120M
100M
80M
60M
40M
20M
0M
100%
90%
80%
70%
60%
50%
40%
30%
20%
10%
0%
CountryPopulation
Year
Inte
rnet
pen
etra
tio
n
POPULATION-INTERNET PENETRATION
POPULATION-TELEPHONE DENSITY
22 DIGITAL FINANCIAL SERVICES IN NIGERIA
D E C E M B E R 2 0 1 6
FINANCIAL INCLUSION
INTRODUCTION
Financial inclusion has become topical in the discourse of poverty reduction in all regions of the world, especially developing countries. The Consultative Group to Assist the Poor (CGAP104) reports that currently, the world’s poor live and work in an informal economy characterised by lack of access to a bank, savings account, debit card, insurance, or line of credit, which compels them to rely on informal means of managing money such as family and friends, cash-on-hand, pawn-brokers, moneylenders, or keeping it under the mattress- options which in most cases are insufficient, ineffective, risky, expensive, and unpredictable.
Donors, policy makers and development institutions remain concerned on how to get as many people into the formal financial access strand, mainly to help alleviate poverty, improve access to formal financial products and services – all aimed towards attainment of development goals, reduction of income inequality, mitigate financial risks, financial empowerment and ultimately boost economic activities both at individual and national levels.
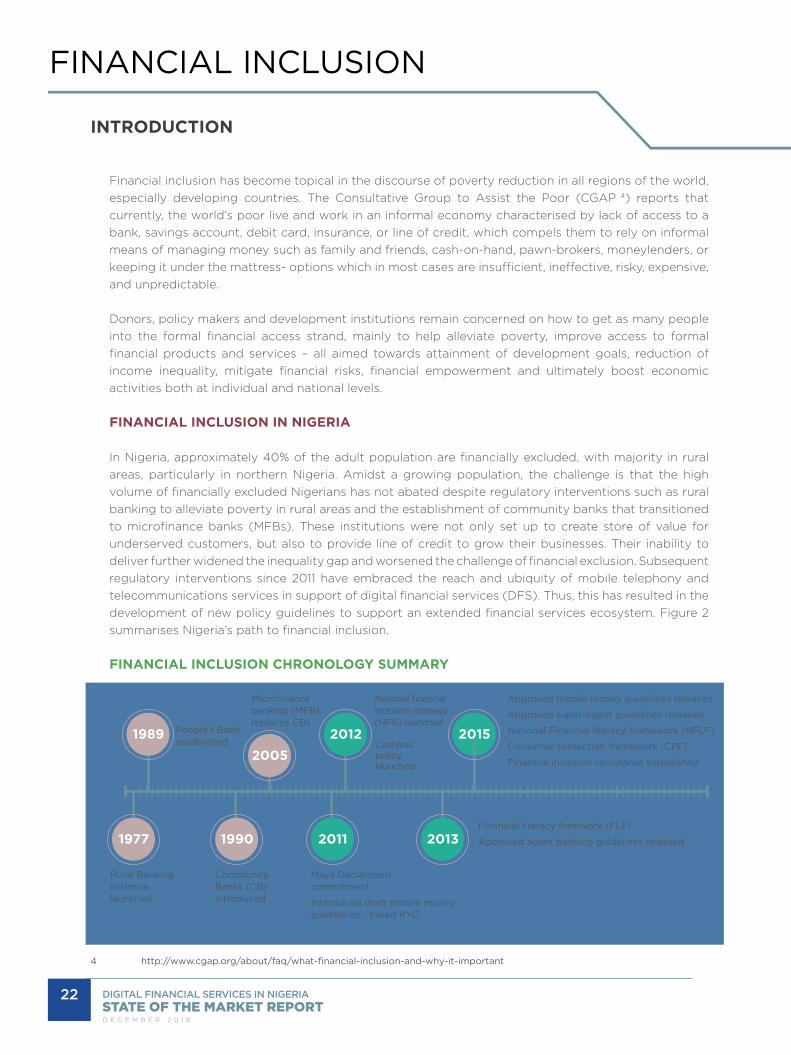
FINANCIAL INCLUSION IN NIGERIA
In Nigeria, approximately 40% of the adult population are financially excluded, with majority in rural areas, particularly in northern Nigeria. Amidst a growing population, the challenge is that the high volume of financially excluded Nigerians has not abated despite regulatory interventions such as rural banking to alleviate poverty in rural areas and the establishment of community banks that transitioned to microfinance banks (MFBs). These institutions were not only set up to create store of value for underserved customers, but also to provide line of credit to grow their businesses. Their inability to deliver further widened the inequality gap and worsened the challenge of financial exclusion. Subsequent regulatory interventions since 2011 have embraced the reach and ubiquity of mobile telephony and telecommunications services in support of digital financial services (DFS). Thus, this has resulted in the development of new policy guidelines to support an extended financial services ecosystem. Figure 2 summarises Nigeria’s path to financial inclusion.
FINANCIAL INCLUSION CHRONOLOGY SUMMARY
4 http://www.cgap.org/about/faq/what-financial-inclusion-and-why-it-important
Figure 2: FI Chronology
1977
1989 2015
1990 2013
Rural Bankinginitiative launched
Community Banks (CB)introduced
Financial literacy framwork (FLF)
Approved agent banking guidelines released
Approved mobile money guidelines released
Approved super-agent guidelines released
National Financial literacy framework (NFLF)
Consumer protection framework (CPF)
Financial inclusion secretariat established
Microfinance banking (MFB) replaces CBs
People’s Bankestablished Cashless
policylaunched
National financial inclusion strategy (NFIS) launched
2011
Maya Declaration commitment
Introduced draft mobile money guidlelines - tiered KYC
20122005

23FINANCIAL INCLUSION
REGULATORY OVERVIEW
The Central Bank mandated to maintain financial systems stability has primary regulatory (and supervisory) oversight of DFS, including mobile money. Introduced in 2011 and finalised in 2015, 2 operating models for mobile money services were proposed – bank-led and non-bank led. Other regulatory authorities active in the ecosystem include the Nigerian Deposit Insurance Corporation (NDIC) for deposit insurance and NCC for telecommunications services (such as value added services and infrastructure). Alongside periodically renewable licenses obtained from CBN, MMO operators must obtain a unique scheme code from the Nigeria Inter-Bank Settlement System (NIBSS), and register unique short codes from NCC. Even though the guidelines do not explicitly demand pass through insurance, the deposit scheme security protects consumer deposits from MMO dissolution. In all, these frameworks and guidelines help create an enabling environment for the orderly introduction, governance and management of mobile payment services. Details of licensed mobile money operators and super-agents are presented in appendices 1 and 2 respectively.
NATIONAL FINANCIAL INCLUSION STRATEGY
The National Financial Inclusion Strategy (NFIS) was launched in 2012 to further enhance financial inclusion. The NFIS outlines goals for the adoption and access to financial services, with the overall objective to reduce exclusion to 20% by 2020 aims to increase the adoption by the formally and informally served and complemented by targets for the various financial services (see Figure 3). Specific targets on access to financial services channels (digital and physical) were also stipulated (Refer to Figure 4 and Figure 5.
TARGETS - GLOBAL ADOPTION
Figure 3: NFIS national FI target
TARGETS - FINANCIAL SERVICES
Figure 4: NFIS target breakdown
0% 100%75%50%25%
NFIS Target(2020)
Formally served Informally served Informally excluded
0% 100%75%50%25%
Insurance
Credit
Pensions
Savings
Payments
Formally served Formally excluded
60%
60%
60%
40%
30%
40%
40%
40%
60%
70%

24 DIGITAL FINANCIAL SERVICES IN NIGERIA
D E C E M B E R 2 0 1 6
Branches
850
7.5
Quantity Per 100,000 Adults
MFB branches
ATMs
POS
Mobile agents 62
59.6
5
TARGETS - CHANNELS
Figure 5: NFIS channel targets
WHERE WE ARE?
SAVINGS
Even though the cumulative impact of regulatory interventions has improved access to finance since measurements commenced in 2008, reported 2014 measures illustrate the gap across each underserved user group (see Figure 6). While the size of the under-banked (informally served) is on target, the challenge remains amongst the unbanked (formally excluded) and banked (formally served), which need to reduce and grow by about 17 per cent respectively.
By gender: 2013 - 0.1 per cent (male); 0 per cent (female); 2014 – 0.4 per cent (male; 0.3 per cent (female)
By location: 2013 - 0.1 per cent (urban), 0 per cent (rural); 2014 - 0.6 per cent (urban), 0.1 per cent (rural); 2015 - 0.1 per cent (urban), 0 per cent (rural)

25
FINANCIAL INCLUSION STRANDS
Figure 6: FI Strands (compiled from EFinA, Intermedia and Global Findex data)
FINANCIAL INCLUSION CURRENT STATUS
Figure 7: FI gaps
By reducing frictions within and across industries thereby enhancing productivity, increasing the pool of of funds available in the formal economy and creating jobs, McKinsey projects that by 2025 DFS could increase Nigeria’s GDP by 12.4 per cent or $88 billion (Eighty Eight billion US dollars) (McKinsey Global Institute, 2016).
McKinsey Global Institute. (2016). DIGITAL FINANCE FOR ALL: POWERING INCLUSIVE GROWTH IN EMERGING ECONOMIES (pp. 1–124). McKinsey Global Institute.
FINANCIAL INCLUSION

26
PART 2DIGITAL FINANCIAL SERVICES IN NIGERIA

BACKGROUND 27
Consumer Insights
Introduction
Key Findings
Consumer Value Proposition
Supplier Insights
Introduction
Key Findings
Cost to Serve

28 DIGITAL FINANCIAL SERVICES IN NIGERIA
D E C E M B E R 2 0 1 6
CONSUMER INSIGHTS
DEMAND SIDE
INTRODUCTIONThe adoption of DFS by under-banked and unbanked population is subject to better understanding of the consumer - geographic and socio-economic profiles - household and individual, digital characteristics, financial services need, constraints, and cost to use. Even though consumer studies have been conducted, in-depth examination of the consumer data to define consumer profiles of the underserved has not been the focus of these studies. Thus, to better guide suppliers and operators of financial services to the under-banked and unbanked consumer segments, better understanding of the target consumer segment as addressed in this part of the study is imperative.
The operational definitions employed forthwith are:
• Banked: An individual one who owns or has access to a bank account either with a deposit money bank (DMB) or microfinance bank (MFB) or uses services provided by other financial institutions such as insurance companies, pension, etc.
• Under-banked: An individual as one who has access to other informal financial services such as Ajo, Esusu, etc.
• Unbanked: An individual who does not own or have access to a bank account and does not participate in other financial services such as Ajo, Esusu, etc.
Thus, the banked or under-banked are financially served while the unbanked are financially excluded.
OBJECTIVESIn light of high mobile telephony penetration, DFS especially mobile money is a purposeful tool capable of addressing financial service needs and hence financial inclusion gaps in Nigeria. However, the dearth of consumer data, especially amongst members of the informal sector characterised as either under-banked or unbanked, is an additional constraint impacting business development activities of MMOs. This report addresses the market-data gap through the identification of consumer characteristics and proposing target consumer profiles of the under-banked and unbanked. In addition, using existing adoption and utility data, defines consumer value propositions derived from the analysis of financial service needs, inhibitors and perceived benefits. Special focus on the cost-to-use financial services builds deeper understanding of the nature of costs in support of the formulation of more inclusive consumer value propositions.
METHOD
DATA SOURCESThe analysis of Nigerian consumers and consumer profiling was conducted using secondary data acquired from three distinct sources - EFInA, Intermedia and Global Findex. In particular, EFInA’s Access to Financial (A2F) Services in Nigeria surveys of 2008, 2010, 2012 and 2014; Intermedia’s Financial Inclusion Insights (FII) Wave 1 survey in 2014 and the follow-up study on Government-to-Person (G2P) payments Wave 2 in June, 2015; and the World Bank’s Global Financial Inclusion (Global Findex) Database 2011 and 2014.

29CONSUMER INSIGHTS
ACCESS TO FINANCE (A2F)Enhancing Financial Innovation and Access (EFInA) is a development organisation established in 2007and funded by the UK Government’s Department for International Development (DFID) and the Bill & Melinda Gates Foundation (BMGF) to promote financial inclusion in Nigeria. One of EFInA’s core activities is the biennial Access to Financial Services (A2F) nationwide survey. The A2F survey is a nationally representative demand-side study that covers over 20,000 consumers and provides relevant and reliable data on the demand for and usage of a range of financial products (formal and informal), input to evidence-based financial inclusion policies & reform, credible benchmarks and indicators for financial access, and defines and quantifies the market opportunity for the low income segment.
FINANCIAL INCLUSION INSIGHTS (FII)The Financial Inclusion Insights (FII) by Intermedia comprise quantitative surveys and linked qualitative studies to explore the “what”, “how” and “why” of demand-side trends in DFS. Unlike the A2F study that focuses on broad financial services sector, the FII programme focuses on demand-side trends in mobile money and other DFS. FII survey is based on rigorous methodologies using demographic and psychographic measures and the Grameen Foundation’s Progress out of Poverty Index (PPI). The FII programme currently conducts research in eight countries with a 6000 sample size, each in Bangladesh, Indonesia, Nigeria and Pakistan; a 3,000 sample size, each in Kenya, Tanzania and Uganda; and a 45,000 sample size in India.
GLOBAL FINDEXThe World Bank Global Financial Inclusion Index (Findex) programme is a database providing insights into financial inclusion around the world. The Global Findex database, a global database on financial inclusion provides data on how individuals save, borrow, make payments, and manage risks. The Global Findex is based on interviews with about 150,000 adults in over 160 countries with a sample size of approximately 1,000 respondents in each country, collected in partnership with the Gallup World Poll and support of Bill & Melinda Gates Foundation
METHOD/APPROACHPrior to data extractions, the datasets were categorised according to classification groups using pre-defined operational definitions - banked, under-banked and unbanked. Relevant survey variables are identified and mapped alongside the research questions. Where relevant data variables were available, the data summaries were extracted and the summary table extracts are subsequently transformed into charts and profiles.

DIGITAL FINANCIAL SERVICES IN NIGERIA
D E C E M B E R 2 0 1 6
The contextual understanding of individual Nigerian consumers is framed within the community and household contexts that better explains consumer trends and patterns.
30

31
KEY FINDINGS
CONSUMER CHARACTERISTICS
In the collectivist Nigerian society, an individual is influenced by household as well as community members. Thus, the presentation of consumer demographics looks outside-in; as illustrated in see Figure 8 - from the community view represented by geography and geopolitical zone to household view prior to the presentation of the individual view of demographic and socio-economic characteristics.
To enhance readability, the data strands are illustrated using aggregate data from the multiple data sources analysed. Taking methodological differences into consideration, complete strands by source are included in Appendix 4.
CONSUMER FRAME
Figure 8: Consumer view
The contextual understanding of individual Nigerian consumers is framed within the community and household contexts that better explains consumer trends and patterns.
THE COMMUNITY VIEW
The community view of the under-banked and unbanked is illustrated using two attributes - location and geo-political zone (GPZ). Location characteristics are simply urban or rural while the geo-political zones are national demarcations as devised and used by government based on cultural, ethnic and historical similarities with the distribution of economic, political, and educational resources.
The datasets confirm the gradual increase in urban dwellers amongst both the under-banked and unbanked populations. While this pattern aligns with rising urban population trends10, majority of Nigerians remain rural dwellers.
LOCATION
The location strands (Figure 9) and average analysis (Figure 10) of the under-banked and unbanked contrasts 2015 urban-rural division statistics11reporting 52 per cent rural dwellers. While some improvements are evident, the average differences between datasets may be explained by varying sampling strategies; the proportions are somewhat consistent and representative of national urban-rural population distributions.
10 Mo Ibrahim Foundation. (2015). African Urban Dynamics. 11 http://www.geohive.com/earth/pop_urban.aspx
Community
Household
Individual
CONSUMER INSIGHTS

32 DIGITAL FINANCIAL SERVICES IN NIGERIA
D E C E M B E R 2 0 1 6
LOCATION STRANDS
Figure 9: Location strands
LOCATION ANALYSIS
Figure 10: Location summary analysis
Rural Urban

33
REGIONAL DISTRIBUTION
In spite of the improvements since measurement commenced in 2008, analysis of access to financial services by GPZ shows varying trends (see Figure 11 and Figure 12). The North-West reports the highest number of unbanked and under-banked (Intermedia), while the North-East reports declining under-banked alongside increasing unbanked populations. These patterns may be attributed to sampling variances (NW) or terrorism insurgencies (NE) and result in irregular access to financial services over time. The relatively high volumes of under-banked in the South West may be attributed to Lagos State: Nigeria’s commercial capital and most densely populated state.
GEO-POLITICAL ZONE STRANDS
Figure 11: Region strands
CONSUMER INSIGHTS
North central North East North West South East South South South West

34 DIGITAL FINANCIAL SERVICES IN NIGERIA
D E C E M B E R 2 0 1 6
GEO POLITICAL ZONE ANALYSIS
Figure 12: Region summary analysis
HOUSEHOLD VIEW
From the household perspective, we evaluate the under-banked and unbanked using two criteria - household size and household income.
The household view reports majority of Nigerian households with 4 or more members (Figure 13 and Figure 14), albeit of low economic status. More than 90 per cent amongst the under-banked and unbanked have income levels below $2.50 and live below the poverty line (Figure 15 and Figure 16). This pattern is not only consistent with the rural dwellers, but is also further explained in the individual socio-economic analyses.

35
HOUSEHOLD SIZE STRANDS
Figure 13: Household size strands
CONSUMER INSIGHTS
One Two Three Four Five Six - Seven Eight or more

36 DIGITAL FINANCIAL SERVICES IN NIGERIA
D E C E M B E R 2 0 1 6
HOUSEHOLD SIZE ANALYSIS
Figure 14: Household summary size analysis

37
HOUSEHOLD INCOME STRANDS
Figure 15: Household income strands
HOUSEHOLD INCOME ANALYSIS
Figure 16: Household summary income analysis
INDIVIDUAL VIEW
The individual view is presented using demographic attributes - gender, age, and marital status - followed by socio-economic attributes - education, employment and income.
CONSUMER INSIGHTS
Above poverty line Below poverty line

38 DIGITAL FINANCIAL SERVICES IN NIGERIA
D E C E M B E R 2 0 1 6
DEMOGRAPHICS
GENDER
As illustrated in Figure 17 and Figure 18, the gender distributions are almost equal amongst the unbanked, albeit a gradual increase in female access statistics over the years, female volumes are marginally higher.
GENDER STRANDS
Figure 17: Gender access strands
GENDER ANALYSIS
Figure 18: Gender summary analysis
Male Female

39
AGE
Even though the access strand reports across age groups, the youth segment within the ages of 15/18 to 34 is most vulnerable.
AGE STRANDS
Figure 19: Age strands
CONSUMER INSIGHTS
55-6435-4415-24 & 18-24 Over 6545-5425-34

40 DIGITAL FINANCIAL SERVICES IN NIGERIA
D E C E M B E R 2 0 1 6
AGE ANALYSIS
Figure 20: Age summary analysis

41
MARITAL STATUS
Combined with earlier reports on gender access, the dominance of the monogamously married amongst the under-banked and unbanked can be attributed to women (Figure 21 and Figure 22). The other status worthy of note is the singles, which correlates with the age analysis, where the target populations are in the youth segment.
MARITAL STATUS STRANDS
Figure 21: Marital status strands
CONSUMER INSIGHTS

42 DIGITAL FINANCIAL SERVICES IN NIGERIA
D E C E M B E R 2 0 1 6
MARITAL STATUS ANALYSIS
Figure 22: Marital status summary analysis
SOCIO-ECONOMIC
EDUCATION
Figure 23 and Figure 24 illustrate that the lion share of the under-banked and unbanked possess primary or secondary education.

43
EDUCATION STRANDS
Figure 23: Education strands
EDUCATION ANALYSIS
Figure 24: Education summary analysis
CONSUMER INSIGHTS

44 DIGITAL FINANCIAL SERVICES IN NIGERIA
D E C E M B E R 2 0 1 6
EMPLOYMENT
Notwithstanding a high proportion of the under-banked and unbanked are reported to have jobs, the nature of the job (formal or informal sector) is not consistently reported.
EMPLOYMENT STATUS STRANDS
Figure 25: Employment status strands
EMPLOYMENT STATUS ANALYSIS
Figure 26: Employment status analysis
INCOME
As discussed earlier, even though the populations are reporting jobs (see Figure 25 and Figure 26), their financial capability is somewhat limited given the high proportions living below the poverty line (Figure 27). Summary analysis of individual incomes confirms this trend (Figure 28).
Don’t have job Have job

45
INCOME LEVEL AND INCOME EARNED STRANDS
Figure 27: Income level and income earned strands
CONSUMER INSIGHTS
INCOME LEVEL AND INCOME EARNED ANALYSES
Figure 28: Income level and income
earned analyses
Inco
me
Ear
ned
Ana
lysi
sIn
com
e le
vel A
naly
sis
Inco
me
Ear
ned
Str
and
sIn
com
e Le
vel S
tran
ds

46 DIGITAL FINANCIAL SERVICES IN NIGERIA
D E C E M B E R 2 0 1 6
ASSETS
Access or ownership of a mobile device, a requisite of consumer readiness for digital inclusion is illustrated in Figure 29 and Figure 30. In addition, analysis of identification documents, a requisite for subscriber identification module (SIM) registration and hence telephone ownership is highlighted in Figure 31.
PHONE ACCESS STRANDS
Figure 29: Phone access strands
PHONE OWNERSHIP ANALYSIS
Figure 30: Phone access analysis
No Yes

47CONSUMER INSIGHTS
IDENTIFICATION DOCUMENTATION
Figure 31: Identification documents analysis

48 DIGITAL FINANCIAL SERVICES IN NIGERIA
D E C E M B E R 2 0 1 6
COMPETENCIES
Consumer competencies of financial services (money) and mobile telephone use requisite for effective use of DFS.
FINANCIALThe trends of financial literacy demonstrated through literacy of basic financial concepts (Figure 33) are similar amongst the under-banked and unbanked.
FINANCIAL LITERACY
Figure 32: Literacy of financial concepts
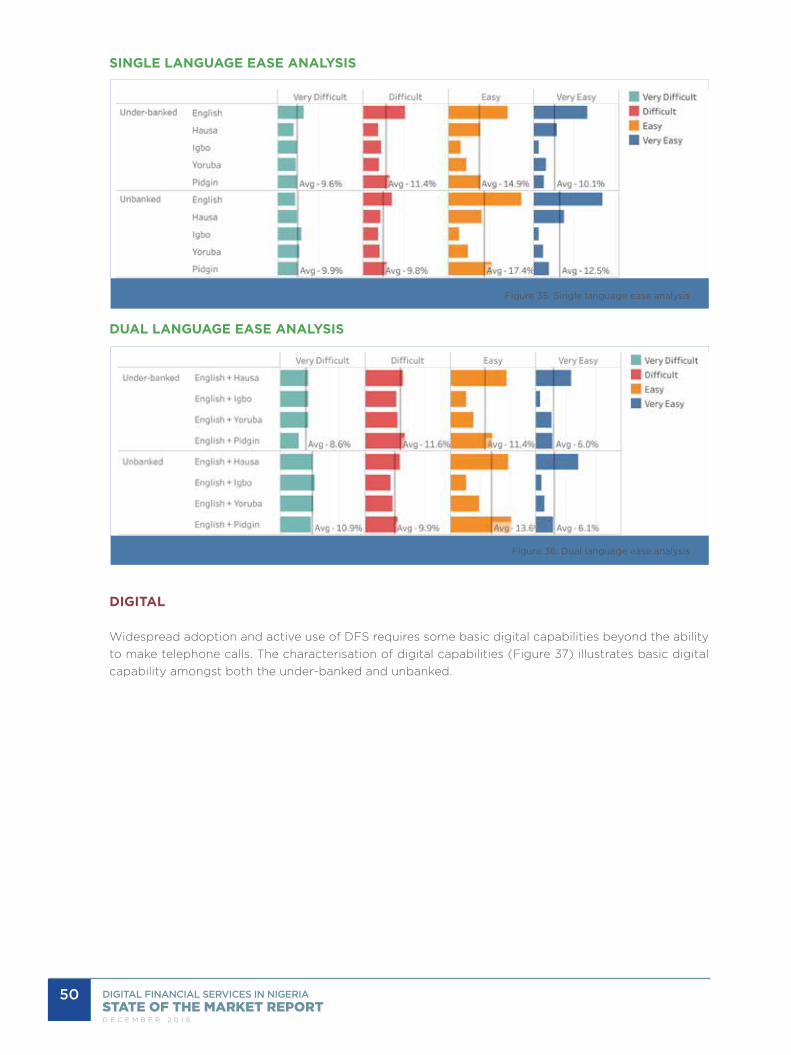
LANGUAGE
Language capabilities, another indicator used to evaluate consumer readiness, were assessed based on reading ability and ease (Figure 33 - Figure 36). Amongst the under-banked, capability in English is consistent amongst respondents surveyed. However, with the unbanked respondents, Hausa is the local language with the highest ability. Ease of English is also highest amongst the reporting population; however when mixed with a local dialect, the combination of English and Hausa is more common.

49
LANGUAGE ABILITY STRANDS
Figure 33: Single language reading ability
LANGUAGE ABILITY ANALYSIS
Figure 34: Single language reading ability analysis
CONSUMER INSIGHTS
50 DIGITAL FINANCIAL SERVICES IN NIGERIA
D E C E M B E R 2 0 1 6
SINGLE LANGUAGE EASE ANALYSIS
Figure 35: Single language ease analysis
DUAL LANGUAGE EASE ANALYSIS
Figure 36: Dual language ease analysis
DIGITAL
Widespread adoption and active use of DFS requires some basic digital capabilities beyond the ability to make telephone calls. The characterisation of digital capabilities (Figure 37) illustrates basic digital capability amongst both the under-banked and unbanked.

51
DIGITAL CAPABILITIES ANALYSIS
Figure 37: Digital capabilities analysis
PROFILE SUMMARIES
In sum, the under-banked and unbanked consumer profiles presented illustrate their community, household and individual perspectives (Figure 38), but also provide detailed insights of individual assets and capabilities (Figure 39).
CONSUMER INSIGHTS

52 DIGITAL FINANCIAL SERVICES IN NIGERIA
D E C E M B E R 2 0 1 6
CONSUMER DEMOGRAPHIC PROFILE
Figure 38: Consumer demographic profiles
CONSUMER ASSETS & CAPABILITIES PROFILE
Figure 39: Consumer capability profiles

53
CONSUMER VALUE PROPOSITION
FINANCIAL SERVICES NEEDS
Financial service needs among adult Nigerians typically support individual and business income and expenses that meet functional, social or emotional needs. These include:
• Payments: in the simplest form, payments for goods and services such as utilities (communications, power, etc.) and education are common. Domestic and international remittances are also categorised as payments.
• Large Value Purchases: the one-time acquisition of items such as white goods, motor vehicles, other business equipment and landed property constitute purchases that warrant significant financial resources and planning through products such as savings.
• Future needs/Emergencies: the lack of social welfare systems warrants individual financial provision for emergencies like medical/health care costs or funeral costs following an untimely death. Self-sustenance upon retirement and education also constitute needs.
• Social/Lifestyle: The payment of social events such as weddings and other notable landmarks constitute a financial service need.
DOMESTIC PAYMENTS GRID
PERSON BUSINESS GOVERNMENT
Personinbound/outbound remittancescash in/cash out
Wageswelfarepensionsagriculture credits
Business
bills - electricity, cable TVothers - school, medical, servicesairtime/top-upsavings/investments
supplier/distributor payments investments
agriculture credits
Governmentbills/tariffstaxes
bills/tariffstaxes agriculture inputs
n/a
Figure 40: Domestic payments grid
INTERNATIONAL PAYMENTS GRID
PERSON BUSINESS
Person inbound/outbound remittances n/a
Businessinbound/outbound remittancesothers - school, medical
inbound/outbound remittances
Figure 41: International payments grid
CONSUMER INSIGHTS

54 DIGITAL FINANCIAL SERVICES IN NIGERIA
D E C E M B E R 2 0 1 6
INHIBITORS OF FINANCIAL SERVICES
The financial service inhibitors identified amongst Nigerian consumers can be categorised as socio-economic and product/service (Figure 42).
FINANCIAL INCLUSION INHIBITORS
Figure 42: DFS inhibitors
SOCIO-ECONOMIC CONSTRAINTS
Socio-economic inhibitors, limiting access to financial services, are hinged on the lack of economic activity as a result of under-employment and unemployment. Hence, individuals with no irregular income sources or insufficient cash are unlikely to access or need financial services. In addition, illiteracy is another socio-economic inhibitor.
PRODUCT/SERVICE INHIBITORS
Product/service inhibitors stem from the inability of financial products/services to meet basic needs due to product complexity that may be amplified by limited or no financial education and awareness. The associated rigorous workflows and processes of some financial services also delimit use. All in all, the associated risks of product and process complexities, especially in the case of healthcare emergencies,

55
include prolonged illness, disabilities or even death. Finally, recent bank failures and cases of poor corporate governance have impacted reputation and brand equity, and also reduced trust levels. In addition to cost-to-use constraints, the cumulative effect of these has resulted in the quest for alternative providers not limited to family and friends and other informal sources.
COST-TO-USE
Access to financial service providers is another constraint. The sparse distribution of financial access points, most pertinent amongst the majority of Nigerian rural dwellers, increases travel distance and ultimately costs. The high costs of financial services, especially amongst the underserved and low socio-economic class are also delimiting. A summary of monetary and non-pecuniary utility costs is illustrated in Figure 43.
UTILITY COSTS
Figure 43: Cost-to-use summary
BENEFITS OF FINANCIAL SERVICES
In Nigeria, the benefits of financial services are somewhat difficult to classify due to inhibitors. One of the largest gains of financial services is perceived safety of funds. However, crises in the financial services industry have eroded trust. The benefits of convenience or ease or time-savings are also discounted by the limited access to service points. The limited access to finance common amongst under-banked and unbanked individuals and micro-small and medium sized (MSMEs) is also delimited by utility and access costs.
VALUE PROPOSITION
We draw our value propositions from the analysis of consumer profiles, financial service needs, inhibitors and benefits.
Financial services are required to facilitate the following:
• Payments: domestic and international; inbound and outbound; person-to-person (P2P), person-to-business/government (P2B/G), government/business-to-person (G/B2P)
• Savings: cash savings for large purchases, business investment
CONSUMER INSIGHTS
Non-Monetary
Bank processes
Account use difficulty
Account charges/fees Identification documentationUnder-banked/Unbanked

56 DIGITAL FINANCIAL SERVICES IN NIGERIA
D E C E M B E R 2 0 1 6
• Credit: in the absence of substantial savings, credit products aid the acquisition of large purchases and response to exigencies
In spite of the need for the protection and security for emergency situations and future well-being that are supported by insurance and pension products respectively, their value propositions, evidenced by the weak demand/need. Investment products also have weak value propositions among the under-banked and unbanked.
In as much as the financial services sought are a combination of processes and products, system security and reliability in addition to the under-listed usage attributes are important to the under-banked and unbanked.
• Affordable: the socio-economic status of the underserved warrants services of minimal or no costs. This is pertinent given the comparative costs of the alternative, cash, are not borne by the consumers.
• Accessible: access to financial services not only supports convenience or ease, but provides (time and transportation) savings.
• Uncomplicated: the elimination of complex and non-value adding processes without necessarily increasing risk or reducing controls.
• Value: the current socio-economic status of under-banked and unbanked Nigerians necessitates a different approach to customer analysis. Frequency and monetary analysis of domestic remittances shows that 60-70 per cent of the transactions are carried out of 1 - 3 times each month. On the monetary side, about 55 per cent of the transactions are below N5,000 and another 20 per cent between N5,000 and N10,000.
CONFIRMATION OF CONSUMER PROFILES: ANOVA ANALYSIS
Further analysis of the data using the analysis of variance (ANOVA) method empirically confirms the under-banked and unbanked are characteristically different from the banked, suggesting perhaps that the same products presently deployed in serving the banked are inappropriate for the under-banked and unbanked. These results further demonstrate that the consumer profile attributes - gender, marital status, education, age, rural-urban classification, employment status and income - are qualifying characteristics of the under-banked and unbanked. The results show that, as a group, the under-banked and the unbanked are less educated than the banked population. It also shows that, in terms of age, the unbanked generally tend to be younger than the under-banked and banked. Also in terms of employment status and income, the unbanked tend to be the most vulnerable in the unemployed category and thus the lowest income levels when compared to the under-banked and banked. Generally the banked population largely consists of employed persons with the highest average income when compared to the under-banked and the unbanked population.
The analyses of financial services utility equally show that the under-banked and unbanked have empirically different financial services’ habits. As a group, the unbanked can be classed as the most vulnerable (at risk) with little or no savings when compared to the under-banked and the banked. However, a very small percentage of these unbanked have applied for loans while no member of the under-banked and unbanked populations has an insurance policy. On the other hand, savings is more common than access to loans and the use of insurance among the banked.

57
CONFIRMATION OF CONSUMER PROFILES: FOCUS GROUPS
Findings from focus group discussions, to some extent, support profiles derived from the analysis of secondary data sources of the under-banked and unbanked, and their relative digital financial service needs. The unbanked Nigerians are generally characterised by unemployment, low-income levels, urgency for subsistence cash and little of awareness of banking benefits. These attributes are particularly true for those below 35 years. The under-banked, on the other hand, predominantly engaged in farming and petty trading activities, have paltry income levels to meet basic subsistence needs, and little or no savings.
In both groups, these attributes reflect socio-economic challenges alongside the inability to use bank facilities particularly for females, rural dwellers, and those below 35 years. While a substantial number seemed unaware of digital financial services, the knowledgeable perceive the service as a fast way to conduct business transactions and transfer funds. Meanwhile, DFS usage challenges include perceived technology complexity, lack of mobile phones, low level of education, high charges, perceived non-existence of one-on-one customer care, insecurity and fraud, and network infrastructure in rural areas. Notwithstanding the challenges, prominent financial service needs include transactions and bill payments, mostly for males, and emergency cash withdrawal for
females.
The analyses of financial services utility equally show that the under-banked and unbanked have empirically different financial services habits.
CONSUMER INSIGHTS

58 DIGITAL FINANCIAL SERVICES IN NIGERIA
D E C E M B E R 2 0 1 6
INTRODUCTIONThe delivery, growth and sustainability of DFS is often influenced by market enabling policies, market dynamics and supplier capabilities. While industry regulations in emerging markets are often inhibitive10, the capabilities and preparedness of DFS operators to understand market dynamics and regulations are requisite to designing appropriate products and devising strategies for effective DFS delivery encompassing viable business models that foster sustainability and competitiveness. Consequently, diverse resources and capabilities (physical, human and institutional) need to be deployed by operators in gaining and sustaining competitive advantage for DFS delivery in Nigeria.
OBJECTIVESThis effort to assess supplier readiness and capacity involved: 1) mapping the DFS ecosystem and identifying the actors, roles, incentives and limitations; 2) identifying key resources and capabilities deployed; 3) establishing associated cost-to-serve.
METHOD
DEFINING CAPABILITIES
The collection of Assets, Resource and Capabilities (ARCs) examined were derived from extant strategic management literature on firm-based resources (resource-based view of the firm) and [dynamic] capabilities. Each ARC was reviewed for relevance using the following criteria: 1) project objectives; 2) DFS ecosystem resources and capabilities; 3) regulatory guidelines. Figure 44 represents the taxonomy of ARCs reviewed.
ARCs TAXONOMY
Figure 44: Taxonomy of resources
10 Policy inhibitions include capitalization requirements, prohibition of direct MNO participation and the restriction of non- bank led operators earning float income.
SUPPLIER INSIGHTS

59SUPPLIER INSIGHTS
ARC TAXONOMY DESCRIPTIONS
ARCs DESCRIPTION
INSTITUTIONAL
Execution/Leadership Leadership and management perceptions, capabilities and understanding
Competition/Strategy Ability to acquire and utilise market and competitive knowledge to enhance business, operations and competitive advantage
Culture The collection of norms and beliefs guiding the institution and business activities
Brand Perceptions of brand equity as well as ARCs deployed in the brand development
HUMAN CAPITAL
Competencies The collection of managerial qualities and abilities (competencies) deployed throughout the business
Knowledge The collection of experience, knowledge and insights of personnel
Partners Institutional partners and partnerships arrangements
PHYSICAL
People The people and structures employed in attaining organisational goals
Locations Represents the physical office locations representing geographic reach
Activities The core business activities (processes) employed for DFS operations
Technology The collection of technology systems and capabilities for inter-operable DFS platform operations
Finance Financial resources and cash flows to meet establishment, fixed and operational costs
SAMPLING
Rich detail of MMO operations was acquired by semi-structured interviews with randomly selected licensed MMOs - 3 bank-led and 5 non-bank led, while industry benchmark data was acquired using the survey method. Knowledge of the agency perspective was acquired through semi-structured interviews with 2 super-agents and enumerator-administered surveys of one hundred and sixty-eight sub-agents in urban and rural locations within the Federal Capital Territory, Lagos, Ogun, Niger and Nassarawa States.

60 DIGITAL FINANCIAL SERVICES IN NIGERIA
D E C E M B E R 2 0 1 6
KEY FINDINGS
ECOSYSTEM SUMMARY
Figure 45 presents the DFS ecosystem map illustrating the actors. The ecosystem can be broadly categorised into three distinctive layers of core business, extended enterprise and the full business ecosystem. The core business layer constitutes MMOs acting as product/service producers, super-agents and agent aggregators who are responsible for agent development and management, and sub-agents who serve as intermediaries between MMOs and consumers. The extended enterprise encompasses customers, supply chain partners and regulators or standard setting organisations. The outer layer comprises other stakeholders such as investors, industry associations, development agencies and academia. Presented alongside capabilities are summaries of roles, incentives and limitations of the core businesses. Descriptor summaries of non-core ecosystem actors are in Appendix 5.
DFS ECOSYSTEM
Figure 45: DFS ecosystem

61
CORE CAPABILITIES
INTRODUCTION
Using the taxonomy of capabilities in Figure 44, the collection of physical, human and organisational resources acquired and developed by core DFS businesses are summarised in subsequent paragraphs.
MOBILE MONEY OPERATOR CAPABILTIES
RESOURCES
The nature of core business activities and financial resources available to MMOs determines human and technology resource needs. These allocations differ significantly between non-bank led and bank-led MMOs that are leveraging existing resources in their DFS initiatives for the under-banked and unbanked. MMO business activities and functions are guided by strategic and/or tactical business decisions which revolve around business operations - business development, agent management, technology - infrastructure and software engineering; financial management and control and service delivery - customer care.
In bank-led MMOs, existing departments manage activities such as technology, compliance and risk. The number of personnel engaged within each MMO varies and is related to the business activities, geographical expanse and strategic view of DFS. Where bank-led models treat DFS operations as
SUPPLIER INSIGHTS

62 DIGITAL FINANCIAL SERVICES IN NIGERIA
D E C E M B E R 2 0 1 6
products, they are usually subsumed within the business unit responsible for channels; on the other hand, the social enterprise view is predominant amongst non-bank led operators. The ownership of IT systems is guided by decisions such as software buy vs. build; data centre insource vs. outsource, and the like. Non-bank MMOs with existing software development capacity tend to build, whilst others acquire off-the-shelf products from international software solutions providers. The licensing requirements of software acquisitions require advance payments and subsequent annual maintenance fees. Additional costs are also incurred where contextual customisations or modifications are required.
With DMBs owning ICT infrastructure, the emergence of third party data centres has put an end to the need by newly established non-bank led MMOs to build data centre with availability 24 hours a day/7 days a week/365 days a year (24/7/365).
Other than financial resources necessary for business operations and technology, the current MMO licensing regime mandates capitalisation of N2 billion (two billion naira). However, this does not apply to late entrant DMBs operating bank-led models for existing customers or offering tier-1 banking, and imposes a heavy capital burden on start-ups.
Although MMOs have representation in most Nigerian states, main office premises that hosts core resources are located in either Lagos or Abuja. Bank-led MMOs take advantage of the existing branch networks to support field services; through a network of agents, non-bank led MMOs develop the capacity as business determines.
HUMAN CAPITAL CAPABILITIES
With a nascent payments industry, industry personnel have evolved from the banking industry with a predominant banking-oriented mindset. The fundamental difference between payments and banking businesses nonetheless warrants the need for human capital with competences that span payments and inclusive business development based on formal and informal approaches. Formal methods such as face-to-face training are limited since they are often acquired outside Nigeria’s borders. Informal on-the-job approaches are infused through collaborative relationships and partnerships with international organisations. In all, with the exemption of general administration and support functions such as finance and administration, human resources, the core competencies observed include software development, market research, innovation or product development (research and development), agent management, settlement and reconciliation, risk and compliance. Major strategic partnership categories comprise infrastructure (telecoms, IT), distribution (agent network), transaction (settlement and payments) and specialised (government, development agencies, etc.). Institutional partnerships amongst MMOs are limited as observed through insufficient interoperability at agent storefronts.
INSTITUTIONAL CAPABILITIES
DMBs, being more established, have higher brand equity and nationwide visibility than relatively new non-bank led MMOs. By virtue of economies of scale, these capabilities not only enhance their negotiation abilities with outdoor advertising agencies and regulators, but also lowers above-the-line (ATL) advertising costs. On the other hand, non-bank led MMOs deploy centralised operations complemented by dispersed third-party agent, are not only relatively unknown, but have limited advertising and market development capacity. The observed norms and behaviours within MMOs are closely associated with institutional values and objectives. In bank-led MMOs, this is based on the opportunities associated with access to new customer segments - lower income customer segments; whilst non-bank led MMOs project national development and social enterprise motives. As a result of the nascent nature of the industry, competition is relatively minimal (see Figure 46) in a somewhat fragmented industry. Internal rivalry amongst existing providers is low; with cash being the dominant substitute or DFS alternative alongside registered PSSPs (FinTechs). Amongst others, the upward
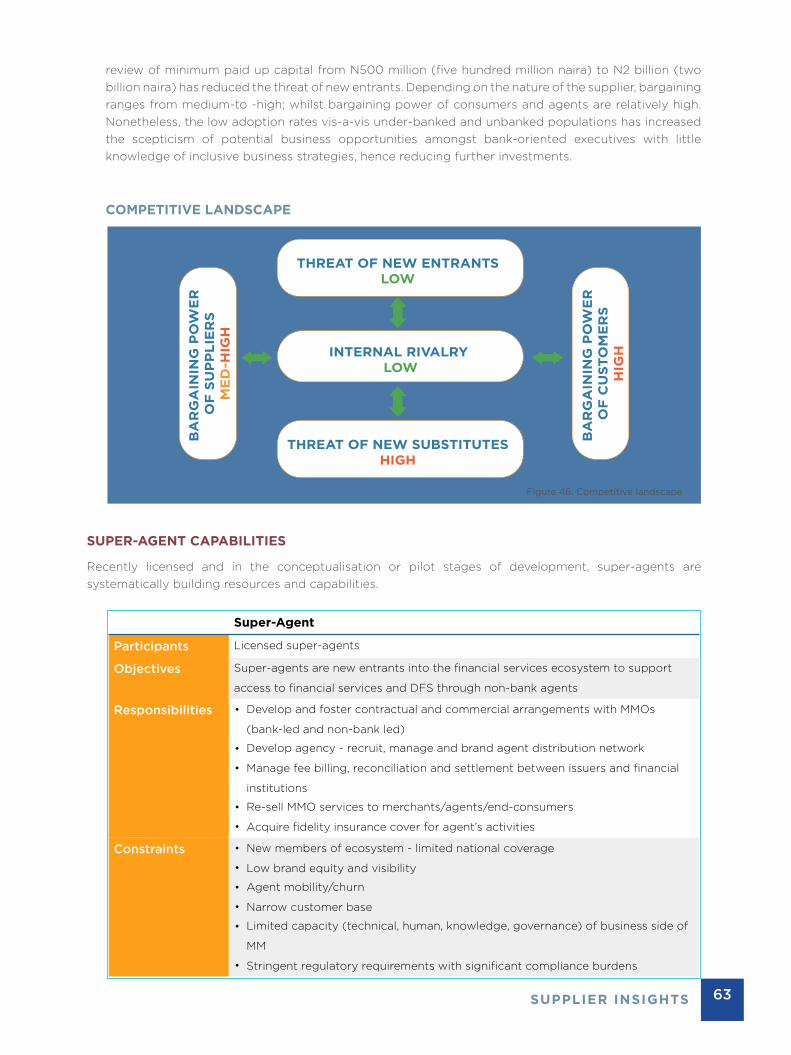
63
review of minimum paid up capital from N500 million (five hundred million naira) to N2 billion (two billion naira) has reduced the threat of new entrants. Depending on the nature of the supplier, bargaining ranges from medium-to -high; whilst bargaining power of consumers and agents are relatively high. Nonetheless, the low adoption rates vis-a-vis under-banked and unbanked populations has increased the scepticism of potential business opportunities amongst bank-oriented executives with little knowledge of inclusive business strategies, hence reducing further investments.
COMPETITIVE LANDSCAPE
Figure 46: Competitive landscape
SUPER-AGENT CAPABILITIES
Recently licensed and in the conceptualisation or pilot stages of development, super-agents are systematically building resources and capabilities.
SUPPLIER INSIGHTS

64 DIGITAL FINANCIAL SERVICES IN NIGERIA
D E C E M B E R 2 0 1 6
RESOURCES
The core business activities of super-agents are limited to agent network development and management and business development to enhance transaction throughput. Still in evolutionary stages, super-agents operate with minimal personnel and only core structures, and non-core functions provided by company affiliations. Sub-agents are either recruited actively through periodic nationwide recruitment drives or passively through product launches or partnership arrangements in locations. Hence the centralised organisation structure and location often inhibit continuous recruitment drives. Although sub-agent management tactics vary, the adoption of FMCG route-to-market concepts combining direct and indirect channels were observed. These monitoring agents are equipped with mobile technology assets to enhance monitoring sub-agent activities especially useful for the effective monitoring of float and liquidity positions. In addition to non-core activities, super-agents also leverage existing software licenses and hardware infrastructure, with the intention to scale as business volumes increase. In addition to business start-up and operational costs, the licensing regime of super-agents mandates financial resources - minimum shareholders funds of N50 million (fifty million naira).
HUMAN CAPITAL CAPABILITIES
The human capital capabilities of super-agents in early developmental stages are rudimentary. Nevertheless, MNO-owned super-agents have inherited sub-agent partnerships, channel distribution structures as well as knowledge incentive and compensation schemes,
With minimal human capital super-agents under the control of MNOs are better positioned with knowledge of agent relationships as well as established partnerships and incentive structures.
INSTITUTIONAL CAPABILITIES
With the exception of MNOs that have retail outlets nationwide, super-agents have low brand equity. As three of the four licensed super-agents have affiliations with ecosystem actors, alignment between institutional strategies and activities/objectives of the parent companies is evident where mobile money business is complementary. Even though competition levels amongst super-agents are non-existent, the super-agent license model directly competes with MMOs who have been burdened with network development to date.
Agent aggregators support access to financial services and DFS through non-bank agents

65
SUB-AGENT CAPABILITIES
Sub-agents provide the face-to-face, over the counter (OTC) interactions with DFS customers. This section presents extant resources and capabilities.
RESOURCES
The resource profile of sub-agents is somewhat minimal and dependent on customer demand and business activity levels (see Figure 47). As such, sub-agents are typically engaged in other commercial activities illustrated in Figure 48. In such operations, at least one personnel is dedicated to DFS operations and activities. While the portfolio of customer-facing financial activities and processes are delimited by MMO representation and the extant portfolio of transaction and account/wallet management services, other process activities include customer registration, encompassing KYC. Back office processes such as rebalancing, transaction settlement and reconciliation are also activity dependent. As expected, agent-acquired smartphones are the predominant mobile device; while computers, tablets, non-feature phones and POS/virtual top-up (VTU) terminals are also supported. All sub-agent business activities are cash-backed and thus dependent on their investment capacity; hence financial capacity (float) is required to fund day-to-day business operations well as ICT device acquisition.
SUPPLIER INSIGHTS
Sub-agents are customer-facing financial service points offering access to financial services and DFS

66 DIGITAL FINANCIAL SERVICES IN NIGERIA
D E C E M B E R 2 0 1 6
SUB-AGENT TRANSACTIONS
Figure 47: Sub-agent transactions by MMO
SUB-AGENT COMMERCIAL ACTIVITIES
Figure 48: Sub-agent commercial activities

67
HUMAN CAPITAL CAPABILITIES
Sub-agency partnerships are acquired either directly with MMOs or indirectly through super-agents, with the former being more dominant. To facilitate adoption, storefront operators have developed additional capacity in end-user capacity building (60 per cent) and word-of-mouth marketing (58 per cent). These, in addition to proximity and availability at the last mile, sub-agents have developed customer loyalty through trust and ethical practices that result in customer referrals. To enhance continuous and uninterrupted service delivery, sub-agents also combine float and liquidity management skills with quick and convenient rebalancing tactics.
INSTITUTIONAL CAPABILITIES
While the combination of conventional institutional resources - brand, culture and leadership are not dominant or relevant amongst sub-agents, community trust and acceptance are comparable substitutes. In the absence of product differentiation, sub-agents compete with value added service (VAS) providers representing MNOs that vend mobile top-up and other payments services; however, the competition levels will only grow with increasing sub-agency capacity.
CONCLUSION
The age or maturity of ecosystem participants is associated with resource capacities. While some physical resources are easier to acquire, the development of human capital and institutional capabilities require time.
COMPETENCIES SPECTRUM
Figure 49: Competencies spectrum
SUPPLIER INSIGHTS
68 DIGITAL FINANCIAL SERVICES IN NIGERIA
D E C E M B E R 2 0 1 6
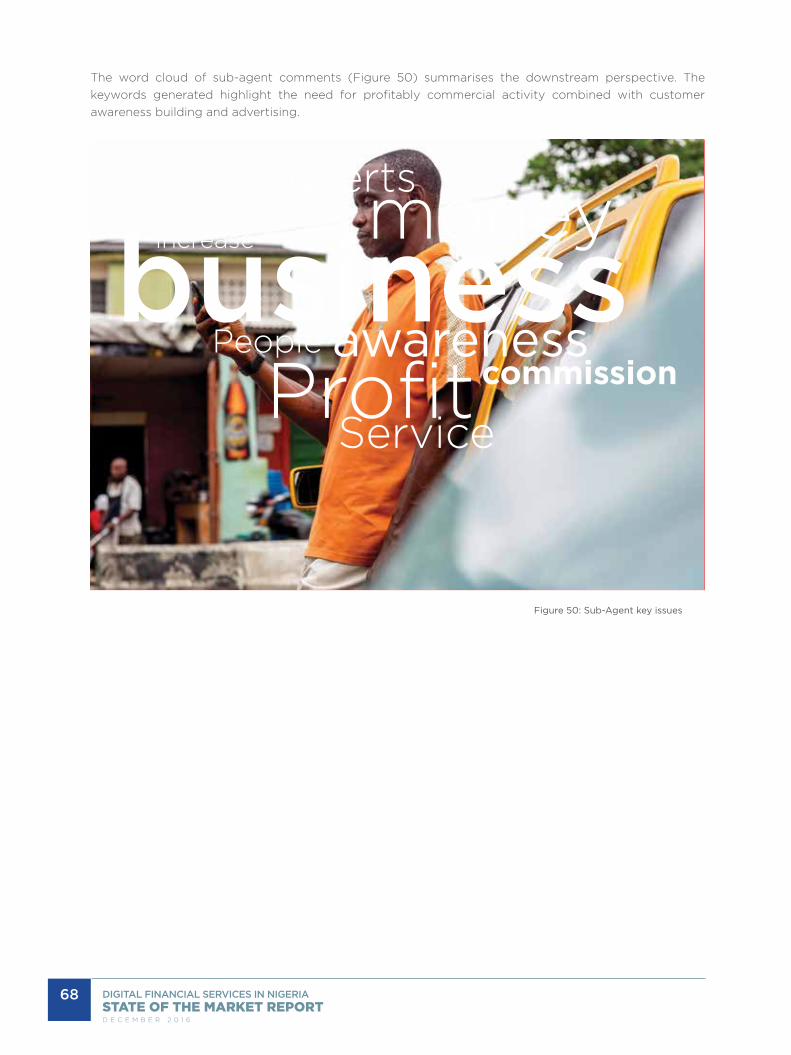
The word cloud of sub-agent comments (Figure 50) summarises the downstream perspective. The keywords generated highlight the need for profitably commercial activity combined with customer awareness building and advertising.
Figure 50: Sub-Agent key issues

69
COST-TO-SERVE
MOBILE MONEY OPERATOR ANALYSIS
The cost-to-serve analysis is the computation for MMO of the Average Cost-Per-Transaction (ACPS) computed using the methodology described below and averages of the costs and transaction volume data reported by MMOs. The variables employed in the analysis are illustrated in Table 2.
ACPS (MMO) = AC/AT, WHERE
• Annual costs (AC) = annual fixed cost (AFC) + annualised monthly operational cost (AMOC) + the start-up cost (ASC)
• Annual fixed costs (AFC) = depreciation costs on MMO’s fixed assets including furniture, rent, IT Platform, equipment, vehicles, and so on
• Operational costs (AMOC) = annualised monthly expenses on salary & wages, advertising, transmission (paid to telcos), processing, overhead and other expensess
• Start-up costs (ASOC) = one-off costs incurred prior to MMO’s commercial launch. These costs include licensing cost, IT acquisition & deployment costs, IT integration costs and so on. In the base case, the start-up cost is over a period of four years
• Annual transactions (AT) = sum of all mobile money transactions supported by the MMO including bill payment, remittances, cash-in, cash-out, merchant payment, airtime top-up, salary payment and other MM transactions
Table 2: MMO cost-to-serve analysis
VARIABLE BANK-LED NON-BANK LED
INDUSTRY AVERAGE
Cost per transaction (ACPS) ₦93.90 ₦182.15 ₦131.59
Average Annual Fixed Cost (AFC) ₦83.75M ₦228.33M ₦145.71M
Average Start-up Cost (ASOC) ₦75M ₦125M ₦96.43M
Average Operational Cost (AMOC) ₦172.5M ₦247.5M ₦210M
Average total annual cost (AC) ₦331.25M ₦600.83M ₦452.14M
Operating Expenses (as a percentage) 52% 41% 46%
Annual transaction volumes (AT) 3.53M 3.3M 3.44M
Bill Payment 636,000 1,375,066 931,626
Local Remittance 102,000 1,157,226 524,090
Cash-In 540,000 332,850 457,140
Merchant Payment 481,600 413,886 454,514
Airtime Top-up 586,000 15,960 357,984
Cash-Out 554,000 3,144 333,658
International Remittance 480,000 0 288,000
Salary Payment 148,000 402 88,961
SUPPLIER INSIGHTS

70 DIGITAL FINANCIAL SERVICES IN NIGERIA
D E C E M B E R 2 0 1 6
Figure 51: MMO cost-to-serve
SUB-AGENT ANALYSIS
In the same vein, the average sub-agent cost-per-transaction (ACPS) is described using the methodology below and averages of the costs and transaction volume data reported by the sub-agents. The variables employed in the analysis are illustrated in Table 3.
ACPS (SUBA) = MC/MT, WHERE
• Monthly costs (MC) = monthly agent start-up cost of the agent’s start-up cash/e-float (MSC) + monthly operational costs (MOC)
• Monthly start-up costs (MSC) = opportunity cost of the float set aside for the mobile money business. In the base case, the monthly return on the 91-day Nigerian Treasury Bills (NTB) is used. Monthly cost of 1.2 per cent of float used
• Monthly Operational costs (MOC): includes expenses incurred by the agents in running the business in a month such as expenses on trips to banks for liquidity management (rebalancing), airtime expenses on calls/data (for complaints’ resolutions) and other monthly expensess
• Monthly transactions (MT) - sum of all mobile money services rendered by the agent in a month including airtime top-up, utility payment, sending/receiving money, cash-in, cash-out, customer registration, savings, PIN/Passcode change, wallet maintenance, school fee payment, credit, loan repayment and others

71
Table 3: Sub-agent cost-to-serve analysis
VARIABLE LAGOS AREA ABUJA AREA URBAN RURAL INDUSTRY AVERAGE
Cost per transaction ₦674.78 ₦374.65 ₦625.54 ₦480.29 ₦604.35
Average start-up cash/e-float amount
₦61,449.28 ₦84,500.00 ₦63,298.61 ₦79,166.67 ₦65,565.48
Cash/e-float start-up monthly cost
₦737.39 ₦1,014.00 ₦759.58 ₦950.00 ₦786.79
Average monthly operating costs
₦24,782.61 ₦19,000.00 ₦24,618.06 ₦18,541.67 ₦23,750.00
Average total monthly costs
₦25,520.00 ₦20,014.00 ₦23,377.64 ₦19,491.67 ₦24,536.79
Monthly transaction volumes
37.82 53.42 40.57 40.58 40.60
Airtime Top-up 8.72 7.03 8.78 6.21 8.42
Utility Payment 7.54 5.82 7.72 4.27 7.23
Send Money 6.09 7.70 6.22 7.31 6.38
Cash-In 4.67 7.48 5.15 5.29 5.17
Cash Out 3.46 6.93 3.84 5.52 4.08
Receive Money 3.08 5.97 3.38 4.92 3.60
Customer Registration
1.67 2.65 1.84 1.83 1.84
Savings 1.18 2.65 1.30 2.29 1.44
PIN/Passcode Change 0.43 2.10 0.66 1.15 0.73
Wallet Maintenance 0.35 1.92 0.66 0.46 0.63
School Fee Payment 0.31 1.00 0.48 0.00 0.43
Credit 0.20 1.10 0.34 0.46 0.36
Loan Repayment 0.12 1.07 0.19 0.88 0.29
SUPPLIER INSIGHTS

72 DIGITAL FINANCIAL SERVICES IN NIGERIA
D E C E M B E R 2 0 1 6
Figure 52: Sub-agent cost-to-serve
ACTIVITY-BASED COSTS
Extending the cost-to-serve analysis to the activity level, the ACTA (Activities, Cash-in Cash-out (CICO), Transitions and Adjacencies)9 payments framework specifies the core activities. The cost per activity illustrated in Table 4 is derived from cost per transaction (ACPS(mmo)), average channel cost, average activity time and overall average activity time. Process/activity-level cost-to-serve analysis to compute specific activity costs was built using duration estimates (see Table 5) generated from process maps.
Table 4: Activity costs
ACPS (MMO)ACPS (SUBA)
ACTIVITY COST PER ACTIVITY
BRANCH/AGENT SELF-SERVICE
AVERAGE CHANNEL COST ₦172.39 ₦90.79
N131.59
N604.35
Accounts (A) ₦127.49 ₦81.13
CICO (C) ₦127.49 N/A
Transactions (T) ₦133.28 ₦100.44
Adjacencies (A) ₦301.33 N/A
9 Voorhies, R., Lamb, J., & Oxman, M. (2013). Fighting poverty, profitably. Seattle: Bill & Melinda Gates Foundation
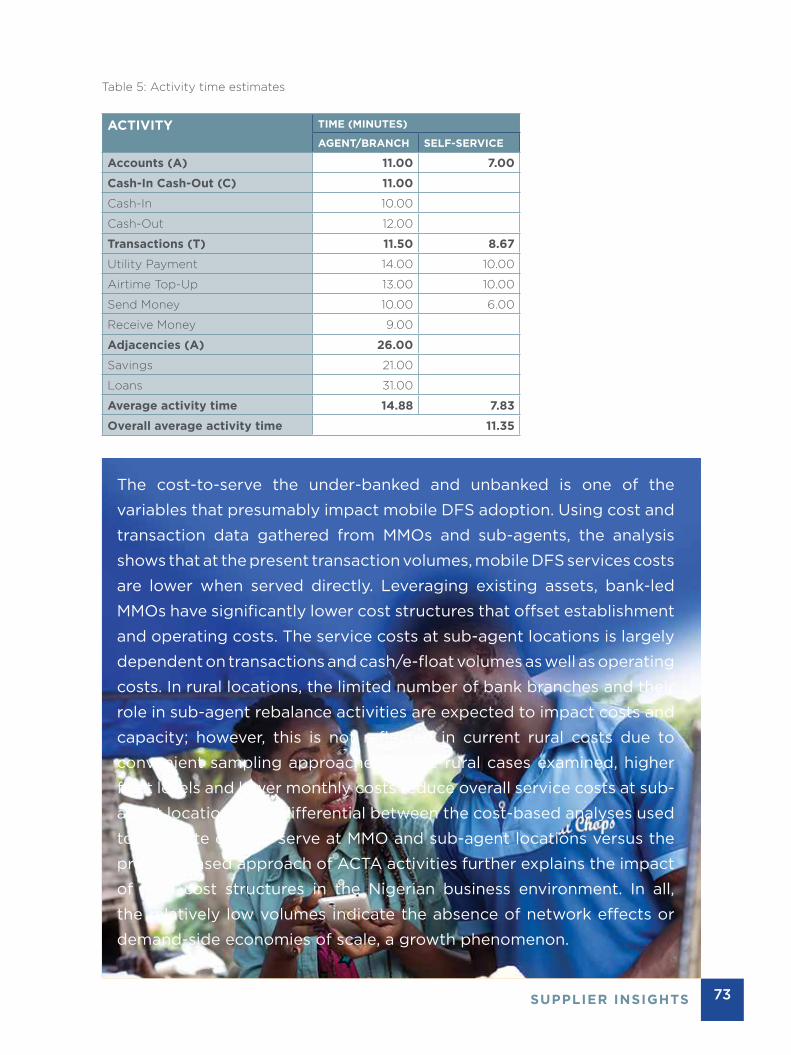
73SUPPLIER INSIGHTS
Table 5: Activity time estimates
ACTIVITY TIME (MINUTES)
AGENT/BRANCH SELF-SERVICE
Accounts (A) 11.00 7.00
Cash-In Cash-Out (C) 11.00
Cash-In 10.00
Cash-Out 12.00
Transactions (T) 11.50 8.67
Utility Payment 14.00 10.00
Airtime Top-Up 13.00 10.00
Send Money 10.00 6.00
Receive Money 9.00
Adjacencies (A) 26.00
Savings 21.00
Loans 31.00
Average activity time 14.88 7.83
Overall average activity time 11.35
The cost-to-serve the under-banked and unbanked is one of the
variables that presumably impact mobile DFS adoption. Using cost and
transaction data gathered from MMOs and sub-agents, the analysis
shows that at the present transaction volumes, mobile DFS services costs
are lower when served directly. Leveraging existing assets, bank-led
MMOs have significantly lower cost structures that offset establishment
and operating costs. The service costs at sub-agent locations is largely
dependent on transactions and cash/e-float volumes as well as operating
costs. In rural locations, the limited number of bank branches and their
role in sub-agent rebalance activities are expected to impact costs and
capacity; however, this is not reflected in current rural costs due to
convenient sampling approaches. In the rural cases examined, higher
float levels and lower monthly costs reduce overall service costs at sub-
agent locations. The differential between the cost-based analyses used
to compute cost-to-serve at MMO and sub-agent locations versus the
process-based approach of ACTA activities further explains the impact
of high cost structures in the Nigerian business environment. In all,
the relatively low volumes indicate the absence of network effects or
demand-side economies of scale, a growth phenomenon.

74
PART 3DIGITAL FINANCIAL SERVICES IN NIGERIA

BACKGROUND 75
Sustainable Business Models
Way Forward

76 DIGITAL FINANCIAL SERVICES IN NIGERIA
D E C E M B E R 2 0 1 6
INTRODUCTION
Drawing from the consumer and supplier evidence base, this conclusion presents sustainable DFS business models alongside capacity gaps and network distribution insights from the fast-moving consumer goods (FMCG) sector.
SUSTAINABLE BUSINESS MODELS

77SUSTAINABLE BUSINESS MODELS
SUSTAINABLE BUSINESS MODELS
Three business model categories are identified to deliver sustainable digital financial services to lower income unbanked Nigerians - focused, specialist and blended. The focused model provides efficient and reliable payments or collections services to government agencies, utility companies and employers. Focused models may also be adopted to serve affinity and lifestyle groups and to support other financial services such as savings, insurance, and credits.
The specialist models on the other hand are bespoke in addressing frictions in industry value chains (IVC) and institutions - agriculture, healthcare, government welfare, and so on. These specialist models are also adaptable to emergency situations arising from terrorism or other disasters. The blended model combines both attributes of focused and specialist models.
Institutional resources and capabilities can be exploited to leverage business models. For example, existing physical locations such as branches may be used to delimit the geographical scope - national, state or regional - of the business model. Figure 53 exemplifies the relationship between business model and technology capabilities; highlighting the need of systems integration capabilities in focused models and complete software development capabilities in specialist models.
Figure 53: Sustainable business models

78 DIGITAL FINANCIAL SERVICES IN NIGERIA
D E C E M B E R 2 0 1 6
BUSINESS MODEL CANVAS (BMC) DESCRIPTION
Figure 54 summarises the study findings using the business model canvas (BMC).
The value propositions for DFS are largely payments, savings and credit; constrained by system attributes (security and reliability) as well as usage attributes, namely accessibility, affordability and level of complication. Even though existing customer segments include banked and service-partner customers, the under-banked and unbanked can be drawn by demographic variables such as gender (women), age profiles (youth aged 18-35) and education levels (semi-educated). Other socio-economic variables that can be used to segment customers include employment status and income. Industry value chain (IVC) consumers such as farmers, health worker or suppliers of physical goods are also target customer segments. Distribution channel options include the use of self-service channels - mobile (USSD, app, SMS), online (web) and ATM; over the counter (OTC) approaches at agent storefronts, branches and merchant locations. Above-the-line (ATL) communication channels employed include flyers and banners, commercials and social media, while below-the-line (BTL) communication channels are essentially market outreaches. For customer support, two approaches are dominant, namely direct and indirect.
Using direct support channels services are provided via call centres, customer service desks at bank branches, in-app help, website frequently asked questions (FAQs), live chat and social media handles. Indirect support services are provided at agents and merchant locations. Personal assistance and self-service are useful in maintaining customer relationships. Field service officers and business development (account) managers are responsible for managing agents and partner relationships respectively. Consumer relationships, on the other hand, are developed through promotions and relationships with agents and merchant storefronts. The revenue streams for DFS providers are primarily from transaction margins. Meanwhile, bank-led DFS operators, also acting as settlement banks earn float income, and MMOs with software development capacities that provide specialist IVC services earn development fees from such activities. There are also intangible revenues including grants such as the EFInA innovation grant as well as other industry awards and recognitions.
With the exception of intellectual resources - brand equity and customer transaction data, the complement of resources - financial, human and physical are easily replicable. These are complemented by key activities illustrated in the competencies spectrum (Figure 49). Although the nature of partnerships in the industry varies, core partnerships for infrastructure provision, transaction switching and distribution are essential to all providers. Other partnerships include specialist IVC and service or investment partnerships. As described in the cost-to-serve analysis, accompanying costs categories encompass fixed, start-up (technology, license, integration) and operational (commercial and infrastructure).

79
DFS BUSINESS MODEL CANVAS
Figure 54: DFS business model canvas
The economic mapping using the ACTA (Accounts, CICO, Transactions and Adjacencies) framework10 highlights model differences between bank-led and non-bank led operators as well as current and future options that are dependent on approaches taken to address industry and institutional gaps.
CURRENT FUTUREBank-led Non-bank led Bank-led Non-bank led
Account (A)
CICO (C)
Transactions (T)
Adjacencies (A)
10 Voorhies, R., Lamb, J., & Oxman, M. (2013). Fighting poverty, profitably. Seattle: Bill & Melinda Gates Foundation.
Infrastructure - MNO - IT Vendors - Call Centre (BPO)
Distribution- Super-Agents/ Agent Aggregators- Agent Network/ Agent
Service Partners- MTN/Diamond - Etisalat/GTB (BPO)
Transaction - Switch- Payments Collectors
Specialist - Industry Associations- Govt/Dev MDAs
SUSTAINABLE BUSINESS MODELS
Investment
Customer support/service delivery
Technology - systems development/ integration- Platform operations
Agent & partner management - Recruitment - Monitoring - Training - Incentives
Business operations - business development - settlement & reconciliation - risk & compliance
System attributes- Secure - Reliable
User attributes- Accessible - Affordable - Uncomplicated
DFS - Payments- Savings- Credit
Self-service
Personal assistance- @agent store front/IVC rep- @bank branch- online chat
Socio-economic - Semi-educated - Unemployed- Low-income earners
Bank customers
Demographic - Women- Youth (18-35)
Sevice-partner consumers
IVC consumers - farmers - health workers - suppliers
Physical - branches - agent/merchant storefronts
Financial - Capitalisation - Startup costs - OPEX
Human - IT - agent/field services - business development managers
Intellectual - Brand equity - customer data
Support - Direct: call centre, in-branch, in-app, website faqs & live chat, social media - Indirect: Agents, merchants
Distribution - Mobile: USSD, STK, App, SMS - Internet: Web - Physical : ATM, Agent, Branch, Merchants
Communication - ATL: flyers, banners, web, TVCs, social media - BTL: market outreach
Fixed
Operating - Insurance - Personnel
Startup
- Infrastructure - License
Commercial - agent commissions - transmission
Bespoke software development fees Transaction
Margins
Grants, awards & recognitions
Float income (Bank-led)

80 DIGITAL FINANCIAL SERVICES IN NIGERIA
D E C E M B E R 2 0 1 6
ENHANCING CORE CAPABILITIESIn spite of the capacity developed for the effective operations, the cost-to-serve analysis demonstrates the need for sizeable scale and hence additional capacity, key of which are:
PHYSICAL
PAYMENTS PROFESSIONALS: The re-education of current and upcoming industry experts will require operational and managerial knowledge of payments and the development of a new breed of payments professionals.
PATIENT CAPITAL: DFS addressing lower consumer segments require long-term to “patient” capital sources. As well as the additional Naira to support software maintenance agreements, MMOs with off-the-shelf volume-based software licenses will require scare foreign capital resources to support increased transaction or customer volumes.
INTEGRATED SYSTEMS: The technology (software integration) between scheme operators and switching partners will require seamless integration to reduce transaction and settlement failures to the barest minimum.
HUMAN
INCLUSIVE BUSINESS DESIGN: the consumer profiles alongside the social enterprise perspective of non-bank MMOs, it is evident that DFS businesses cannot and should not operate using the same economic principles employed by DMBs. Nonetheless, this not only requires inclusive business design (social enterprise) skills, but also changes in orientation and mindset, especially at executive (decision making) levels.
SOFTWARE DEVELOPERS/INTEGRATORS: The need for superior software development capacity to build and integrate systems for current and future market needs should lead to the development of a competency model for payments systems developers, which can be built with the assistance of international card and payments organisations. Sharing such a competency model with existing capacity building organisations can aid the production of industry ready software development capacity.
BUSINESS PROCESS MANAGEMENT (BPM): Given the current volumes of bank customers and DFS accounts, ecosystem actors are not skilled or equipped to manage and serve large customer and agent volumes. Hence, scaling the DFS through substantive customers and transactions increases would raise customer service to unprecedented levels. As such, attention to business process improvement practices acquired either as a result of certification from institutions like International Standards Organisation (ISO) and The Smart Campaign or process improvement approaches like BPM will be necessary. Enhanced process management capacity will also aid the efficacy of agent lifecycle management.

81
SERVICE DELIVERY: The rollout of ATMs and other electronic banking channels has exposed responsiveness failures in DMBs. While precautions are necessary, the prompt resolution of such failures is mandatory for systems integrity. In the area of settlement, although DMBs are equipped with online real-time systems, some process activities are still conducted in batches. In their capacity as settlement banks, the effective settlement or prioritisation of MMO transactions is mandatory given the implications of transactions being rejected/failing due to negative balances.
BUSINESS INTELLIGENCE: The transaction volumes sought will be plagued with fraud attempts as well as previously undefined consumer spending patterns. As such, the industry will need to migrate from the current fraud reporting portal to a more proactive approach using intelligent algorithms that protect systems integrity and reliability by identifying possible fraudulent transactions prior to execution. These intelligent algorithms ought to be contextual, built from knowledge acquired from trends and patterns.
PRODUCT DEVELOPMENT: The lack of differentiation in the product offerings of MMOs highlights the need for innovative product solutions that address consumer needs and frictions in IVCs.
LIQUIDITY MANAGEMENT: Unconventional thinking to manage liquidity and rebalance needs of agents, especially in rural areas will need to be developed. As such, open minds to unorthodox solutions concealed within the economic and commerce activities of the area will be required.
INSTITUTIONAL
CO-OPETITION: even though the internal rivalry amongst core ecosystem providers is low, the industry needs co-opetition towards the common vision of financial inclusion. Poor collaboration is often inhibited by financial interchange arrangements that may be deemed inequitable to parties concerned. In cases where agreements are reached, additional cost burdens are transferred to already disadvantaged end-users, minimising adoption and use. This lack of cooperation buttresses the minimal roles played by microfinance banks that have close knit relationships and access to the underserved communities.
PARTNER DIVERSIFICATION: The view of sub-agents business activities illustrates the combination of agency with other business activities. This multi-service retail perspective can be extended to the operator view of agency and the possibility of developing partnerships with diverse businesses that require physical service points. This multi-service agency perspective could alter agency and business partnerships.
STRATEGY:
Overlaying these business models onto Porter’s generic strategies model, operators can be better guided on appropriate strategic options from which they can derive positioning that would confer competitive advantage. While existing banking services are representative of cost- and differentiation-focused strategies, the hallmarks of the focused and specialist models are exemplified by the cost leadership and differentiation strategies respectively (see Figure 55).
SUSTAINABLE BUSINESS MODELS

82 DIGITAL FINANCIAL SERVICES IN NIGERIA
D E C E M B E R 2 0 1 6
GENERIC STRATEGIES
Figure 55: Generic strategies
ENHANCING ECOSYSTEM CAPABILITIESVISIBILITY: The various capacity advancements proposed cannot be effective without widespread visibility of representative service or industry logos.
SCHEME INTEROPERABILITY: The ability to conduct inter-scheme transactions at the agent storefront would further enhance scheme operations and adoption.
CONSUMER ENGAGEMENT: The cost-to-serve analysis confirms the lower cost of self-service transactions, hence it is imperative that more intensive customer engagement methods be utilised to stimulate adoption and frequent use.
INFRASTRUCTURE: Nationally available and reliable telecommunications networks to support all DFS channels (SMS, USSD, online) underpin scalability and entire system integrity.
COMPETITION REGULATION: The scale advantages of the DMBs enable them to introduce tier 1 or USSD banking products targeted at the under-banked and unbanked in a manner that appears not to improve financial inclusion, in apparent unfair competition to MMO’s who have more inclusive business models, products and are exclusively positioned for the ‘bottom of the pyramid’ financial market. There is a danger of a crowding out’ effect on MMOs, failure or undue delay of the objective of improving inclusion if policy and regulatory supervision remains blindsided or unresponsive to this scenario. With bank-led operators ability to leverage existing cost structures such as IT and channels (branches), non-bank led MMOs have significantly higher service costs (see cost-to-serve analysis). In the case of consumers, complementary initiative to address low adoption include:
• Financial literacy and education programmes to improve mobile money awareness and adoption
• Economic stimulants that either generate employment or social welfare schemes that provide the under-banked and unbanked access to cash

83
CHANNEL AND SERVICE MANAGEMENT: LESSONS FROM FMCGS
Using data acquired from semi-structured interviews with sales directors of FMCGs with channel management experiences from two additional industries - telecoms and pay TV, the following insights on channel and service management strategies have been drawn.
UTILISE DIRECT AND INDIRECT DISTRIBUTION CHANNELS
• Carefully select channel locations using knowledge of how and where targeted consumers make buying decisions• Carefully select channel partners - seek credible and motivated business-minded owners. However, be mindful of key-man risks and look out for succession plans, especially in family- owned businesses• Support granular multi-channel distribution structures• Ensure channel partners have sufficient and sustainable resources (physical, human, financial, and knowledge) • Incentivise the channels partners using financial and non-financial benefits• Develop and support channel partners through formal and informal mechanisms
MANAGE FOR OPTIMAL PERFORMANCE
• Employ lifecycle management ( see Figure 57)• Monitor and control (operational audit)• Measure KPIs
UNDERSTAND ADDRESSABLE (TARGET) MARKETS, CUSTOMER SEGMENTS AND LOCATIONS
• Use business intelligence techniques like extrapolation to identify trends and patterns• Set targets using forecasting techniques• Apply Nigeria’s diverse context when allocating and distributing resources
PROMOTE SERVICE EXCELLENCE SUCH THAT PRODUCTS ARE THE BY-PRODUCT OF QUALITY PROCESSES AND ACTIVITIES
• Support service excellence with prevention, detection and correction mechanisms
PROMOTE THE TRADE BY MARKETING THE VALUE PROPOSITION THE PRODUCT ADDRESSES - USE ABOVE-THE-LINE (ATL) AND BELOW-THE-LINE (BTL) TECHNIQUES
• Engage customers/consumers directly • Use face-to-face interactions to build awareness and receive feedback • Offer trials or simulations• Generate demand
SHARE YOUR CORPORATE PHILOSOPHY/CULTURE
• Demand quality• Sanction and penalise and even terminate relationships when necessary• Use legal structures
SUSTAINABLE BUSINESS MODELS

84 DIGITAL FINANCIAL SERVICES IN NIGERIA
D E C E M B E R 2 0 1 6
ROUTE-TO-MARKET STRUCTURES
Figure 56: Routes-to-market
across FMCGs
CHANNEL LIFECYCLE
Figure 57 Distribution lifecycle
PERFORMANCE MANAGEMENT
RISKMANAGEMENT

85SUSTAINABLE BUSINESS MODELS
From the preceding insights, we deduce that the overarching responsibilities for effective channel management entail the direct ownership, management and control of consumer relationships, outsourcing other transactional activities. These are supported by effective distribution/route-to-market (RTM) (see Figure 56) and trade promotion strategies.

86 DIGITAL FINANCIAL SERVICES IN NIGERIA
D E C E M B E R 2 0 1 6
OPPORTUNITIES FOR DFS DIGITAL OPPORTUNITIES
PLATFORM THINKING
The institutional gaps observed may warrant platform business concepts and explained using platform dichotomies introduced by Accenture CTO, Paul Daugherty at the 2015 MIT Platform Strategy Summit11. These dichotomies do not only help explain the challenges, but support the industry with solutions derived from platform strategy concepts. The first dichotomy, compete vs. partner builds on the platform strategy concept known as winner-takes-all. The relatively high resource commitments required delimits platform survivability; distinguishing between builders and participants. Hence, not all platforms can be builders, nonetheless participation opportunities (through leverage and open strategies) abound. Closely related to this is the contrasting viewpoint of invest vs. leverage. In the era of competing scarce resources, capital investment decisions in assets like IT need to be explored carefully giving preference to alternative models that leverage resources. The dichotomy, proprietary vs. open relates to current models that only support products offered by the MMO and related partners as opposed to opening the platform to other service providers, supporting the ability to directly offer their products.
Finally, the product vs. outcome dichotomy addresses the objective of either delivering DFS via mobile channels or addressing the measurable outcome and national target, financial inclusion.
DISTRIBUTED LEDGER SYSTEMS
The use of distributed ledgers or blockchain systems as the underlying transaction processing platform is a concept that can be applied to financial services as demonstrated by Bitcoin. Unlike centralised and proprietary traditional transaction processing and settlement systems owned by the financial institutions, switches or processors, these blockchain systems are open, decentralised. Thus, eliminating intermediary financial institutions and associated high service charges/fees, making person-to-person (P2P) transactions direct, cheaper and faster.
ECONOMIC OPPORTUNITIES
In spite of the low adoption rates, our estimates presented in subsequent sections demonstrate DFS opportunities in payments (domestic and international), savings and credits.
DOMESTIC PAYMENTS
Figure 58 presents current payments patterns highlighting utility and location (origin and destination) information. The location patterns highlight the significance of key Nigerian States - Lagos, Rivers, FCT and Kano. While this can guide supplier product development initiatives, using current transaction volumes, projected market size extrapolations are also highlighted.
11 http://platforms.mit.edu/2015/files/02_Paul_Daugherty_The_Platform_Revolution.pdf
CONCLUDING REMARKS- WAY FORWARD

87
Figure 58: Domestic payments: projections and patterns
INTERNATIONAL PAYMENTS
The pattern analyses of international payments however tell a different story. The data demonstrates outgoing funds support regional trade activity in Ghana and Benin Republic. Incoming remittances are primarily for domestic use from Nigerians in the Diaspora. Likewise, Figure 59 quantifies DFS market opportunities.
Figure 59: International payments: projections and patterns
OPPORTUNITY TRENDS
OPPORTUNITY TRENDS
SUSTAINABLE BUSINESS MODELS

88 DIGITAL FINANCIAL SERVICES IN NIGERIA
D E C E M B E R 2 0 1 6
SAVINGS
Figure 60: Savings: projections and patterns
CREDIT
Figure 61: Credit: projections and patterns
In spite of the low adoption rates, estimates presented in subsequent sections demonstrate DFS opportunities in payments (domestic and international), savings and credits.
McKinsey reports that these opportunities potentially contribute the following economic benefits:
• Job Creation: Increasing DFS adoption levels could produce a ripple effect on employment presenting growth opportunities in the small and medium enterprise (SME) category. By 2025, it is estimated that DFS could contribute up to 3 million jobs.
• Productivity: The transaction efficiencies of DFS, especially in G2P or G2C payments can potentially reduce costs and increase productivity in Government. Likewise, in private enterprise, ease of payments reduces transaction times and other industry value chain frictions. These reductions could be in the rage of $2 million, increasing government and business cash flows.
• GDP: In all, these equate to an increased GDP growth of 12.4 per cent or the equivalent $88 billion.
OPPORTUNITY TRENDS
OPPORTUNITY TRENDS

89
WAY FORWARD
The development of capabilities and business model design would not be complete without strategies for creating network effects and amendments to existing agency and operator industry structures.
BUILDING DEMAND-SIDE NETWORK EFFECTS
Five years into the mobile money licensing regime, Nigerian operators should be in the high growth stage12; with 15 per cent of the GSM subscribers being active mobile money users. Using total number of active lines reported by NCC in July 201613, the active subscriber base should be in the range of 22.9 million. Unfortunately, this is not the case, hence the need of strategies to drive adoption and reach critical mass.
Pricing is an adoption barrier for low-income under-banked and unbanked citizens and should be at the core in conceiving approaches to building demand-side network effects. Some approaches that could be used to manipulate price and generate network effects are:
• Reduce operating costs: While maintaining the current industry average volumes, operator cost reduction strategies can be achieved by leveraging resources and capabilities through partnerships or co-opetition arrangements. In the same vein, lower agent monthly operating costs translate to reduced service costs.
• Grow volumes: Even though transaction volume growth will reduce costs, the cost-to-use or cost-to-serve dynamics reported highlight the pricing dilemma, a chicken-and-egg situation that can be eased by directly subsidising costs (either transmission or utility).
VIEW OF AGENCY
The criticality of agency networks to the success of DFS alongside the costs-associated with developing agents is a natural source of friction inhibiting interoperability. In as much as licensed MMOs and super-agents have direct “ownership” of such channels, substantiating the fear of agent mobility. Thus, sub-agents should be viewed as independent, commercially oriented going concerns with long-term interests in vending financial services. By independent, sub-agents should not be labelled by operator-representation but as a retail point rendering DFS; an objective detailed within the super-agent guidelines. In this vein, the value proposition for CICO should be refined with effective liquidity management strategies congruent with current business operations.
INDUSTRY EVOLUTION
The current industry structure (Figure 62) consists of numerous independent scheme operators distributing, either directly or indirectly, DFS to consumers in exchange for fee payments. In the first proposal, the industry is conceived as networked schemes of independent operators and scheme agents. The final model proposed adopts a platform approach with a scheme platform facilitating interactions amongst ecosystem participants - producers and consumers. Even though both proposed industry arrangements are applicable to focused and specialist business models, the platform structure better supports the reusable concepts akin to the sharing economy.
12 Almazán, M, & Vonthorn, N. (2014, November). Mobile money profitability: a digital ecosystem to drive healthy margins. Retrieved April 8, 2015, from https://gsmaintelligence.com/research/?file=36bdd61c360f63277be0d219e0db6f68& download13 http://www.ncc.gov.ng/index.php?option=com_content&view=article&id=125&Itemid=73
SUSTAINABLE BUSINESS MODELS

90 DIGITAL FINANCIAL SERVICES IN NIGERIA
D E C E M B E R 2 0 1 6
MAKING MARKETS WORK
Finally, the extent to which markets work effectively, the necessity and appropriateness of interventions in Nigeria’s DFS ecosystem need to be the subject of further enquiry - especially in relation to the associated development and economic benefits of financial inclusion. The success (or failure) of the DFS ecosystem is largely dependent on the nature, coherence, consistency and completeness of enabling policies (as well as complementary inclusive economic, administrative or pro-poor social interventions) to address issues such as access by the large and significant rural population; cost-to-serve; use; efficient and competitive industry configurations; and people.
Figure 62: Mobile money industry evolution

91SUSTAINABLE BUSINESS MODELS

92
APPENDICESDIGITAL FINANCIAL SERVICES IN NIGERIA

BACKGROUND 93
APPENDICES

94 DIGITAL FINANCIAL SERVICES IN NIGERIA
D E C E M B E R 2 0 1 6
APPENDIX 1: LICENSED MMOS
PRODUCT COMPANY WEBSITE YEAR LICENSED AVAILABLE REGULATORY
MODEL
GTMobileMoney GTBank Plchttp://www.gtbplc.com
2011 Y Bank-led
FirstMonie
Pridar Systems Limited, subsidiary of First Bank
http://www.firstmonie.com
2012 Y Bank-led
*909# Mobile Money
Stanbic IBTC https://web.909wallet.com
2012 Y Bank-led
Ecobank Mobile Money
Ecobankhttp://www.ecobank.com/mobilemoney.aspx
2012 Y Bank-led
EazyMoney Zenith Bankhttp://www.eazymoney.com.ng
2012 Y Bank-led
ReadyCashParkway Projects
http://www.readycash.com.ng/
2012 Y Non-bank led
PocketMoni eTranzacthttp://www.pocketmoni.com
2013 Y Non-bank led
Paga PagaTechhttp://www.pagatech.com
2011 Y Non-bank led
Fortis Mobile Money
Fortis MFBhttp://www.fortismobilemoney.com
2011 Y Bank-led
QikQik Eartholeumhttp://www.eartholeum.com/about-qikqik-1.html
2011 Y Non-bank led
Teasy Mobile Teasy Mobilehttp://teasymobile.com
2011 Y Non-bank led
Mimo Mkudihttps://www.mimo.com.ng/about
2011 Y Non-bank led
PIDO (Payment Irrespective of Distance or Obstacles)
PayComhttp://www.paycom-ng.com/
2011 Y Non-bank led

95
Vcash
VTNetwork, Virtual Terminal Network
https://www.virtualterminal-network.com/Home/
2011 Y Non-bank led
PaymeeCellulant Nigeria Ltd.
http://paymee.com.ng
2012 Y Non-bank led
Access Money Access Bankhttps://www.accessbankplc.com
2014 Y Bank-led
Diamond Y’elloDiamond Bank
http://diamondbank.com/index.php/savings-accounts/diamond-y-ello-account
2014 Y Bank-led
U-MoAfri-Pay/United Bank for Africa
http://afri-pay.com 2011 N Bank-led
Kegow
Chams Mobile/Bancore Limited
https://kegow.com 2011 Y Non-bank led
FETSwallet
Funds & Electronic Transfer Solutions (FETS) Limited
https://www.fetswallet.com
2011 Y Non-bank led
MonitiseMonitise MM Nigeria Limited
N/A 2011 N Non-bank led
Konga Pay (formerly EzPayAfrica)
Konga https://www.kongapay.com
2011 Y Non-bank led
APPENDICES

96 DIGITAL FINANCIAL SERVICES IN NIGERIA
D E C E M B E R 2 0 1 6
APPENDIX 2: LICENSED SUPER-AGENTS
PRODUCT/COMPANY WEBSITE LICENSE STATUS
Glo Xchange/Globacom Limitedhttp://www.gloworld.com/ng/mobile-money/glo-xchange/
Approval in principle (AIP)
Interswitch Financial Inclusion Services (IFIS)/Interswitch Limited
https://www.interswitchgroup.com/ng/services/financial-inclusion
2016
Innovectives http://www.innovectives.com 2016
Etisalat Nigeriahttp://etisalat.com.ng/financial-services/
2016
APPENDIX 3 - ABOUT THE PROJECT
With the support of the Bill and Melinda Gates Foundation (BMGF), this project, sustainable business models for delivering digital financial services to lower income unbanked citizens of Nigeria, initiated in November 2015, is a two-year initiative that aims to:
• Increase understanding of the economics of DFS providers
• Increase understanding of environmental factors impacting success of DFS businesses
• Identify market-enabling policy interventions for greater MNO participation
• Build the capacity of LBS to become subject matter expert on sustainable DFS business models
• Build the DFS business development and management know-how of business leaders
The broad focus of this project is to deeply explore the DFS industry in Nigeria and improve the general understanding of the economic and business models (year one-2016) as well as regulatory landscape (year 2 – 2017), for delivering DFS to the poor in Nigeria. It seeks to understand the current state of play in the country’s DFS through understanding of the overarching regulatory structures, provider characteristics and practices: distribution structures, capital structures, size, operational performance, strategic planning, revenue and market dynamics. In addition to this, the study will seek to identify, examine inclusive and sustainable business models of mobile money providers and/or uses that serve the poor and generate sufficient revenue.
Methodologically, the research phase entails mixed methods research to understand the customer value proposition and existing business models of mobile money operators, the economics and regulation of mobile money, with a view to evaluating fit for the unbanked poor. The project will, of necessity, generate hypothetical models that address the financial needs of the unbanked poor.
The dissemination phase involves the engagement of stakeholders and policy makers. The stakeholder engagement, structured as a plenary forum, will present a “State of the Market report” of the main research findings and outcomes from the various platforms of activity including the student competition. The focus of the engagement, against the backdrop of the State of the Market report, is policy engagement addressing market-enabling policy interventions

97
APPENDIX 4 - STRANDS BY DATA SOURCE
COMMUNITY VIEW
FIGURE 1: LOCATION STRANDS
FIGURE 2: REGION STRANDS
APPENDICES

98 DIGITAL FINANCIAL SERVICES IN NIGERIA
D E C E M B E R 2 0 1 6
HOUSEHOLD VIEW
FIGURE 3: HOUSEHOLD SIZE STRANDS
FIGURE 4: HOUSEHOLD INCOME STRANDS
INDIVIDUAL VIEW
FIGURE 5: GENDER STRANDS

99
FIGURE 6: AGE STRANDS
FIGURE 7: MARITAL STATUS STRANDS
APPENDICES

100 DIGITAL FINANCIAL SERVICES IN NIGERIA
D E C E M B E R 2 0 1 6
FIGURE 8: EDUCATION STRANDS
FIGURE 9: EMPLOYMENT STATUS STRANDS
FIGURE 10: INCOME STRANDS

101
APPENDIX 5 - ECOSYSTEM ACTOR SUMMARIES
APPENDICES

102 DIGITAL FINANCIAL SERVICES IN NIGERIA
D E C E M B E R 2 0 1 6

103APPENDICES

104 DIGITAL FINANCIAL SERVICES IN NIGERIA
D E C E M B E R 2 0 1 6

105APPENDICES

106 DIGITAL FINANCIAL SERVICES IN NIGERIA
D E C E M B E R 2 0 1 6

107APPENDICES

108 DIGITAL FINANCIAL SERVICES IN NIGERIA
D E C E M B E R 2 0 1 6

109
APPENDIX 6: INTERVIEW PARTICIPANTS
COMPANY PRODUCT INTERVIEWEE ACTOR CATEGORY
Diamond Bank Plc. Diamond Y’ello Robert Giles Bank-led MMO
First Bank Plc FirstmonieChuma EzirimAbed Ugwueke
Bank-led MMO
Fortis Microfinance Bank
Fortis Mobile Money Jero Omare-Ogah Bank-led MMO
Celluant Cellulant Oluwasanmi Akinmusire Non-bank led MMO
Funds & Electronic Transfer Solutions (FETS) Limited
my.wallet Tade Odunowo Non-bank led MMO
Pagatech Limited PagaTayo OviosuWunmi Asenuga
Non-bank led MMO
Parkway Projects Limtied
ReadyCash Uzo Eziukwu Non-bank led MMO
Teasy Teasy Musa Ali Baba Non-bank led MMO
Globacom Limited Glo Xchange Esaie Diei Super-agent
Interswitch Financial Inclusion Services (IFIS)
IFIS Mike Ogbalu Super-agent
APPENDICES

110 DIGITAL FINANCIAL SERVICES IN NIGERIA
D E C E M B E R 2 0 1 6
NOTES