Acknowledgements - Alive and Thrive · The concept of food system captures the food environment...
40
Transcript of Acknowledgements - Alive and Thrive · The concept of food system captures the food environment...

Acknowledgements
We are grateful to the Central Statistical Agency for providing access to datasets used in the analysis. We thank Kebede Tafesse, Victor Pinga, Dr. Girma Abebe and Regional NSA Advisors, namely Dires Beza, Haimanot Woldemariam, Habtu Assefa, Muluken Tamene, Alemayehu Lebeta, and Muhyadin Mohammed as well as the colleagues at the Food and Nutrition Coordination Office at the Ministry of Agriculture for useful comments on the earlier versions of this document. Alive & Thrive is an initiative to save lives, prevent illness, and ensure healthy growth and development through improved breastfeeding and complementary feeding practices. Good nutrition in the first 1,000 days, from conception to 2 years of age, is critical to enable all children to lead healthier and more productive lives. Alive & Thrive is scaling up nutrition through large-scale programs in several countries in Asia and Africa and through strategic technical support and the dissemination of innovations, tools, and lessons worldwide. Alive & Thrive is funded by the Bill & Melinda Gates Foundation and the governments of Canada and Ireland. The initiative is managed by FHI 360. The Alive & Thrive initiative, managed by FHI 360, is currently funded by the Bill & Melinda Gates Foundation, Irish Aid, the Tanoto Foundation, and UNICEF.
Disclaimer This publication has not been peer reviewed. Any opinions stated in this publication are those of the author(s) and are not necessarily representative of or endorsed by IFPRI.
Suggested Citation Hirvonen K, and Wolle A. Consumption, production, market access and affordability of nutritious foods in the SNNP Region of Ethiopia. Addis Ababa, Ethiopia: Alive & Thrive and International Food Policy Research Institute, 2019.
Alive & Thrive FHI 360 1825 Connecticut Avenue NW Washington, DC 20009 [email protected] www.aliveandthrive.org

2
Table of contents
1. Introduction .......................................................................................................................... 3 2. Description of the data sources used in this report .............................................................. 5
2.1. Demographic and Health Survey (DHS) data .............................................................. 5 2.2. PSNP and FtF evaluation surveys ................................................................................ 5 2.3. CSA agricultural sample survey data ........................................................................... 8 2.4. CSA retail price survey data ......................................................................................... 8
3. Consumption of nutritious foods ......................................................................................... 9 3.1. Child diets ..................................................................................................................... 9 3.2. Women's diets ............................................................................................................. 14
4. Food production from a nutrition perspective ................................................................... 19 5. Market availability of nutritious foods .............................................................................. 21 6. Affordability of nutritious foods ........................................................................................ 25 7. Conclusions ........................................................................................................................ 30
7.1. Legumes and nuts ....................................................................................................... 31 7.2. Dairy products ............................................................................................................ 31 7.3. Flesh foods .................................................................................................................. 31 7.4. Eggs ............................................................................................................................ 31 7.5. Vitamin A-rich fruits and vegetables .......................................................................... 32 7.6. Other fruits and vegetables ......................................................................................... 32 7.7. Limitations .................................................................................................................. 32
References ................................................................................................................................. 33 Appendix A: Initiation of complementary feeding in PSNP areas of SNNP ........................... 37 Appendix B: Recalculating affordability considering the second cheapest food items in fruit and vegetable categories ........................................................................................................... 39

3
1. Introduction
Poor dietary quality is a significant risk factor for stunting and micronutrient deficiencies among
young children and globally one of the leading causes of premature death and disease (Arimond
& Ruel, 2004; Forouzanfar et al., 2015).
Dietary quality is typically proxied by diversity of the consumed diet. Foods with similar
nutritional qualities are first grouped together and dietary diversity is measured by the number of
different food groups consumed in a certain time interval. For example, the World Health
Organization recommends that children 6-23 months consume at least from four food groups
(out of seven) every day. Based on this metric, Ethiopian children in this age range consume one
of the least diversified diets in sub-Saharan Africa (Hirvonen, 2016) with only 14 percent
meeting the WHO recommendation (CSA & ICF, 2016). Recent analysis of the timing of growth
faltering of young children suggests that poor complementary feeding practices, including poor
dietary quality, is an important risk factor for stunting in Ethiopia (Hirvonen, Headey, Golan, &
Hoddinott, 2019). The available evidence suggests that diets are monotonous also at the
household level. For example, in 2011, the average Ethiopian household consumed only 42 kg of
fruits and vegetables in a year per adult equivalent (Hassen Worku, Dereje, Minten, & Hirvonen,
2017) – far below the World Health Organization’s recommendation of 146 kg per year (Hall,
Moore, Harper, & Lynch, 2009).
Such monotonous diets are likely to increase the risk of various chronic diseases. For example, a
recent global study indicated elevated mortality as well as major cardiovascular disease risk
when energy intake from carbohydrates exceed 60 percent (Dehghan et al., 2017). This is
particularly worrying for Ethiopia as recent estimates by the Ethiopian Public Health Institute
suggest that 60-80 percent of the energy intake of children and adults comes from carbohydrates
(Misganaw et al., 2017). Meanwhile cardiovascular diseases are among the top causes of
premature mortality in the country (Misganaw et al., 2017). Another indication of limited dietary
quality is that micronutrient deficiencies in Ethiopia are widespread. Nearly 60 percent of young
children are anemic (CSA & ICF, 2016) and more than one-third suffer from Vitamin A
deficiency (Demissie, Ali, Mekonen, Haider, & Umeta, 2010). Recent research from Ethiopia
further highlights the importance of fruit and vegetable consumption among pregnant and
lactating women. Data from health centers in rural Oromia, Zerfu, Pinto, and Baye (2018) find

4
that pregnant women who consumed fruits and dark green leafy vegetables more frequently were
less likely to experience adverse pregnancy outcomes. Moreover, analyzing samples of
breastmilk from mothers in rural Amhara, Abebe, Haki, Schweigert, Henkel, and Baye (2018)
find very low concentrations of Vitamin A in milk.
These issues are well-acknowledged by the government of Ethiopia. The national nutrition
programme sets out ambitious plans to increase the year-around availability, access and
consumption of nutritious foods (GFDRE, 2016a). Through its 'Seqota Declaration of 2015,'
Ethiopia further announced its ambitious goal of ending child malnutrition by 2030 (GFDRE,
2016b). These nutrition strategies are endorsed by several ministries highlighting that the
emerging consensus that combating under-nutrition and poor diets requires multi-sectoral efforts
(Menon & Frongillo, 2018).
At core of these efforts is the urgent need to transform food systems in Ethiopia to support
healthier diets (Gebru et al., 2018). The concept of food system captures the food environment
(affordability and accessibility), consumer preferences, and the food supply system that is formed
of production, storage, transportation, processing, and marketing (Scott, 2017). It is now well
acknowledged that the dietary choices of individuals are determined by the surrounding food
system.
Against this backdrop, in this report, we aim to gain a better understanding of the food sub
system1 in the Southern Nations, Nationalities, and Peoples' (SNNP) region of Ethiopia by
analyzing the affordability, accessibility, and consumption of nutritious foods. 2 The region hosts
more than 17 million people out of which most reside in rural areas and rely on agricultural
production as their main livelihood (CSA, 2018a). About 39 percent of the children under 5 in
SNNP are chronically under-nourished (or stunted) (Hirvonen et al., 2019) while 15 percent of
the women 15-49 years of age are underweight (CSA & ICF, 2016).3 Moreover, according
1 We call this a sub system analysis because due to data limitations, we do not assess consumer preferences and we also are forced to overlook (due to data limitations) important parts of the food supply system: storage, transportation, processing, marketing as well as inter-regional and international trade. 2 Similar analysis was carried out for six regions in total: Afar, Amhara, Oromia, Somali, SNNP, and Tigray. 3 About 6 percent of the women in this age group in SNNP are over-weight or obese.
5
Ethiopian Public Health Institute (EPHI), 13 percent of children 6-59 months are Vitamin A
deficient (EPHI, 2016).
This report is structured as follows. In the subsequent section, we describe the data used in this
report. In section 3, we assess the consumption of nutritious foods among vulnerable groups:
young children and mothers. In section 4, we assess the production of nutritious foods in the
region. In section 5, we study the availability of nutritious foods in rural markets. In section 6,
we assess the affordability of nutritious foods in the region. Section 7 concludes and summarizes
the findings.
2. Description of the data sources used in this report
All the analyses in this report are based on secondary data collected by the Central Statistical
Agency (CSA) of Ethiopia or the International Food Policy Research Institute (IFPRI). This
section describes these data sources.
2.1. Demographic and Health Survey (DHS) data We use the 2016 Demographic and Health Survey (DHS) data for Ethiopia to analyze child diets.
This survey is nationally as well as regionally representative and was implemented by the CSA
with technical assistance from the ICF. The interviews took place between January 18, 2016, and
June 27, 2016. A total of 16,650 households were interviewed in all regions of Ethiopia, and 1,897
households in SNNP. Apart from rich information on various health outcomes and socio-economic
characteristics, the DHS collects information about complementary feeding practices of young
children.
2.2. PSNP and FtF evaluation surveys We use the PSNP and FtF evaluation data sets to assess diets of adult women (mothers) as well
as market availability of nutritious foods.
In 2016, the International Food Policy Research Institute was tasked by the Bill and Melinda
Gates Foundation to evaluate the impact of the nutrition sensitive components of the PSNP. To
this end, we fielded a baseline survey in PSNP localities in Amhara, Oromia, SNNP, and Tigray.
This baseline survey was administered in two parts. The first baseline survey took place in
March 2017. In this round, 2,635 households with a child less than 2 years of age were
interviewed. Out of these, 662 households originated from SNNP. Roughly half of the sampled

6
households benefitted from the PSNP and the other half identified themselves as poor but did not
benefit from the program. The second baseline survey took place roughly six months later in
August 2017. In this round, the survey teams visited the same households that were interviewed
in the March round. A total of 2,569 households were interviewed, indicating a dropout
(attrition) rate of 3 percent. The first endline survey took place in March 2019. Again more than
2,500 households were interviewed in the same localities.
In this report, we use the August 2017 round to assess women's dietary diversity in PSNP
localities. To assess market availability of nutritious foods, we use the March 2019 survey round.
The reason for using this round is that we improved the market questionnaire by including more
food items, especially with respect to animal-sourced foods.
These PSNP survey are geographically widespread having been administered in 264 kebeles in
88 woredas in the four regions (66 kebeles and 22 woredas from SNNP). Despite this, the
surveys focused on localities in which the PSNP is operational and therefore these data are not
representative of the country, nor any of the four regions.
In our attempt to address this limitation about representativeness, we append the analysis with
the FtF survey that was based on similar survey instruments as the BMGF-PSNP survey. The FtF
survey data were collected between September and October 2018 in Amhara, Oromia, SNNP and
Tigray regions. These data were collected to obtain post-intervention (endline) information in
localities that received investments aimed at improving agricultural production and nutrition
under the Feed the Future (FtF) program funded by the United States Agency for International
Development (USAID). The sample is large – 3,890 households – and widely distributed, the
survey having been implemented in 151 kebeles in 51 woredas. In SNNP, 817 households from
60 kebeles in 20 woredas were interviewed. As with the BMGF-PSNP survey, it is important to
note that while these data sets are representative of the zone of influence within which the FtF
program operates, they are not nationally or regionally representative.
Figure 2.1 shows the geographical overlap of the two surveys in the highlands.
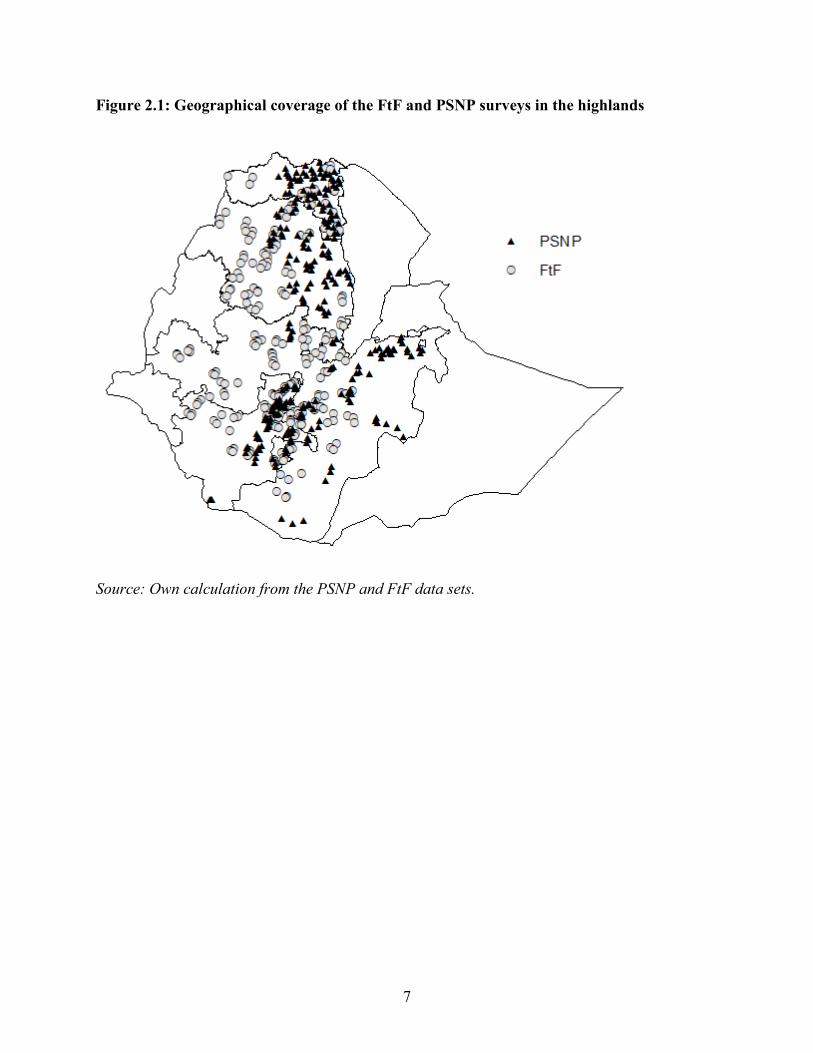
7
Figure 2.1: Geographical coverage of the FtF and PSNP surveys in the highlands
Source: Own calculation from the PSNP and FtF data sets.
8
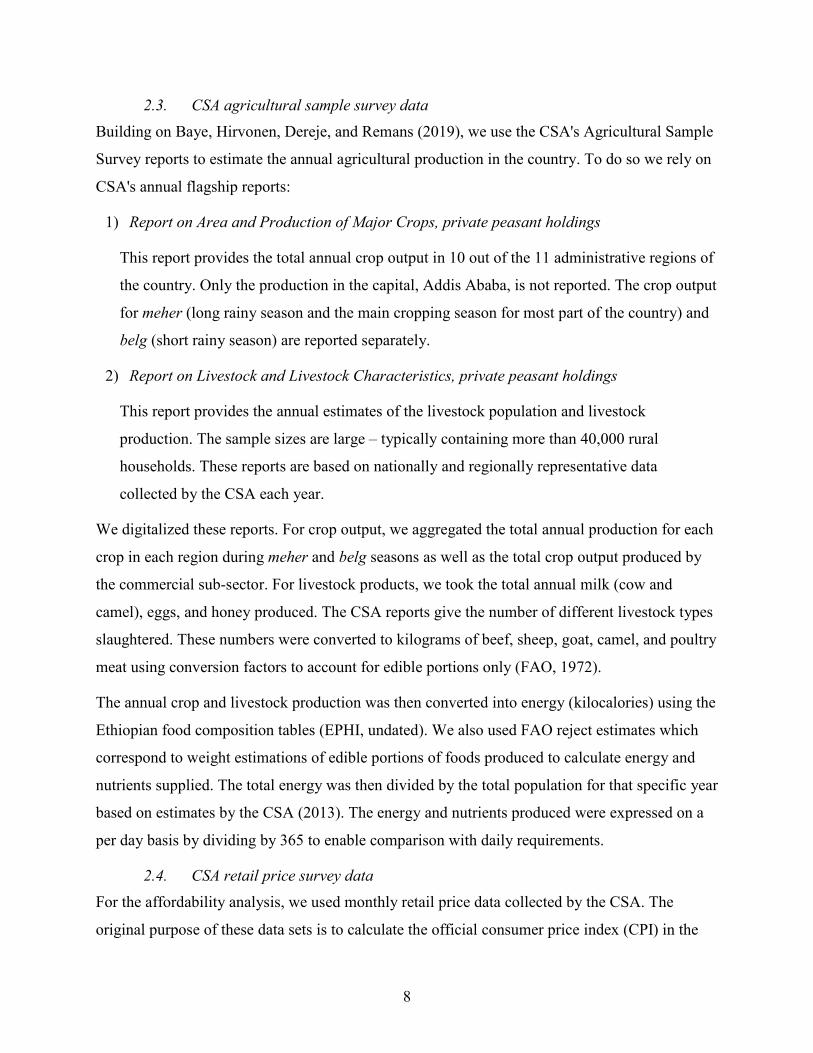
2.3. CSA agricultural sample survey data Building on Baye, Hirvonen, Dereje, and Remans (2019), we use the CSA's Agricultural Sample
Survey reports to estimate the annual agricultural production in the country. To do so we rely on
CSA's annual flagship reports:
1) Report on Area and Production of Major Crops, private peasant holdings
This report provides the total annual crop output in 10 out of the 11 administrative regions of
the country. Only the production in the capital, Addis Ababa, is not reported. The crop output
for meher (long rainy season and the main cropping season for most part of the country) and
belg (short rainy season) are reported separately.
2) Report on Livestock and Livestock Characteristics, private peasant holdings
This report provides the annual estimates of the livestock population and livestock
production. The sample sizes are large – typically containing more than 40,000 rural
households. These reports are based on nationally and regionally representative data
collected by the CSA each year.
We digitalized these reports. For crop output, we aggregated the total annual production for each
crop in each region during meher and belg seasons as well as the total crop output produced by
the commercial sub-sector. For livestock products, we took the total annual milk (cow and
camel), eggs, and honey produced. The CSA reports give the number of different livestock types
slaughtered. These numbers were converted to kilograms of beef, sheep, goat, camel, and poultry
meat using conversion factors to account for edible portions only (FAO, 1972).
The annual crop and livestock production was then converted into energy (kilocalories) using the
Ethiopian food composition tables (EPHI, undated). We also used FAO reject estimates which
correspond to weight estimations of edible portions of foods produced to calculate energy and
nutrients supplied. The total energy was then divided by the total population for that specific year
based on estimates by the CSA (2013). The energy and nutrients produced were expressed on a
per day basis by dividing by 365 to enable comparison with daily requirements.
2.4. CSA retail price survey data For the affordability analysis, we used monthly retail price data collected by the CSA. The
original purpose of these data sets is to calculate the official consumer price index (CPI) in the

9
country. These price data are collected from about 110 markets in all regions of Ethiopia with the
number of markets approximately proportional to the region's size in terms of population. The
CSA enumerators visit these markets every month and collect price data for more than 400 food
and non-food items. For each item, the enumerators target three price quotations from different
traders. For more information about this survey, see Headey, Nisrane, Worku, Dereje, and
Taffesse (2012) and Bachewe, Hirvonen, Minten, and Yimer (2017).
3. Consumption of nutritious foods
3.1. Child diets Child diets are described using the World Health Organization recommended infant and young
child feeding (IYCF) indicators, which are widely accepted and used to capture optimal feeding
practices in populations (WHO, 2010). Here we focus on indicators related to adequate
consumption of high-quality complementary foods that are dense in key micro and macronutrients.
We assess this using the protocols recommended by the World Health Organization (WHO, 2008).
The DHS-2016 survey asked mothers a series of yes/no questions about foods consumed in the
past 24 hours by children 6-23 months. These responses were grouped into the following
categories:
1. Grains, roots, and tubers (e.g., barley, enset, maize, teff, and wheat);
2. Legumes and nuts (e.g. chickpea, beans, groundnut);
3. Dairy products (milk, yogurt, cheese);
4. Flesh foods (meat, poultry, and fish products);
5. Eggs;
6. Vitamin A-rich fruits and vegetables (e.g. mango, pumpkin, carrots);
7. Other fruits and vegetables (e.g. onions, tomatoes, bananas).
This yields a count ranging in value from zero to seven. WHO (2008) recommends that children
in this age range consume daily at least from four food groups out of the above seven food groups.
This number was selected to maximize the likelihood that in addition to the staple food (grain,
root, tuber), the child consumed animal-source foods as well as fruits and vegetables in the
previous day (WHO, 2008).

10
This relatively simple indicator is highly correlated with more detailed measures of food intake
(Ruel, 2003) as well as with children's micronutrient intakes4. Moreover, several studies show
strong correlations with this dietary diversity score and longer term measures of children’s
nutritional status (e.g. child stunting prevalence) in a number of countries including Bangladesh,
Ethiopia, India, and Zambia (Jones et al., 2014).
In SNNP, the average 6-23-month-old child consumes from 1.7 food groups and 12.9 percent of
the children meet the criteria for minimum dietary diversity (at least four food groups in the last
24 hours). Children's diets are more diverse in urban areas; 10.7 percent of the rural children and
34.0 percent of the urban children in SNNP met the minimum dietary diversity.
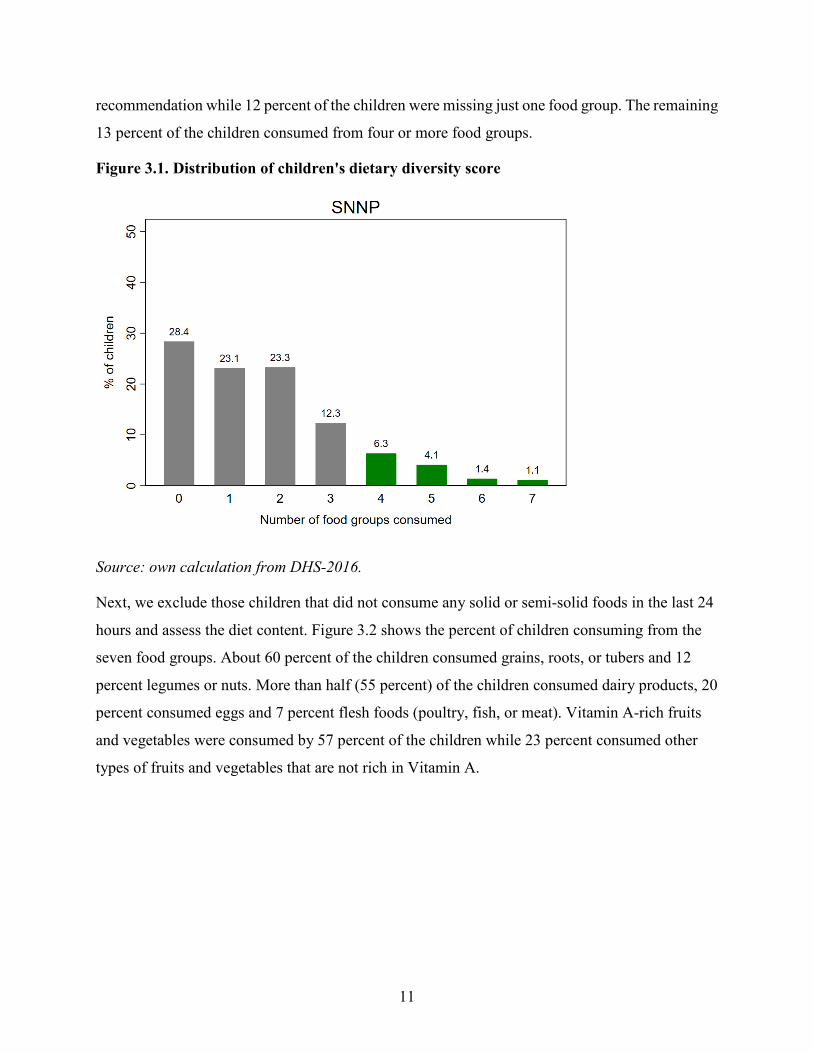
Figure 3.1 shows the full distribution of children's dietary diversity in the region. We can use this
graph to understand how far the children are from meeting the recommended dietary diversity. The
bars falling short from the recommended four food groups are marked with gray color. Starting
from the bottom part of the distribution, we see that a large fraction of children (28 percent) did
not consume from any food groups in the previous 24 hours.5
As this is a relatively high percentage, we highlight two things. First, the BMGF-PSNP survey
conducted in the PSNP woredas shows similar percentages in this regard; in March2017 and
August2017, about 20 percent of the children in SNNP in the same age range (6-23 months) did
not consume from any of the seven food groups in the past 24 hours. Second, the same survey
indicates widespread misperceptions about the correct timing when children should be transitioned
from exclusive breastfeeding to complementary foods. Appendix A provides more details on this.
Meanwhile, 23 percent of the children consumed only from one food group. For these children,
the dietary diversity would have to increase by three food groups in order to meet the minimum
recommended dietary diversity. About 23 percent were two food groups shy from meeting the
4 See Moursi et al. (2008); Daniels, Adair, Popkin, and Truong (2009), Kennedy, Pedro, Seghieri, Nantel, and Brouwer (2007) and Steyn, Nel, Nantel, Kennedy, and Labadarios (2006). 5 The BMGF-PSNP survey conducted in the PSNP woredas shows similar percentages in this regard; in March2017 and August2017, about 20 percent of the children in SNNP in the same age range (6-23 months) did not consume from any of the seven food groups in the past 24 hours.
11
recommendation while 12 percent of the children were missing just one food group. The remaining
13 percent of the children consumed from four or more food groups.
Figure 3.1. Distribution of children's dietary diversity score
Source: own calculation from DHS-2016.
Next, we exclude those children that did not consume any solid or semi-solid foods in the last 24
hours and assess the diet content. Figure 3.2 shows the percent of children consuming from the
seven food groups. About 60 percent of the children consumed grains, roots, or tubers and 12
percent legumes or nuts. More than half (55 percent) of the children consumed dairy products, 20
percent consumed eggs and 7 percent flesh foods (poultry, fish, or meat). Vitamin A-rich fruits
and vegetables were consumed by 57 percent of the children while 23 percent consumed other
types of fruits and vegetables that are not rich in Vitamin A.
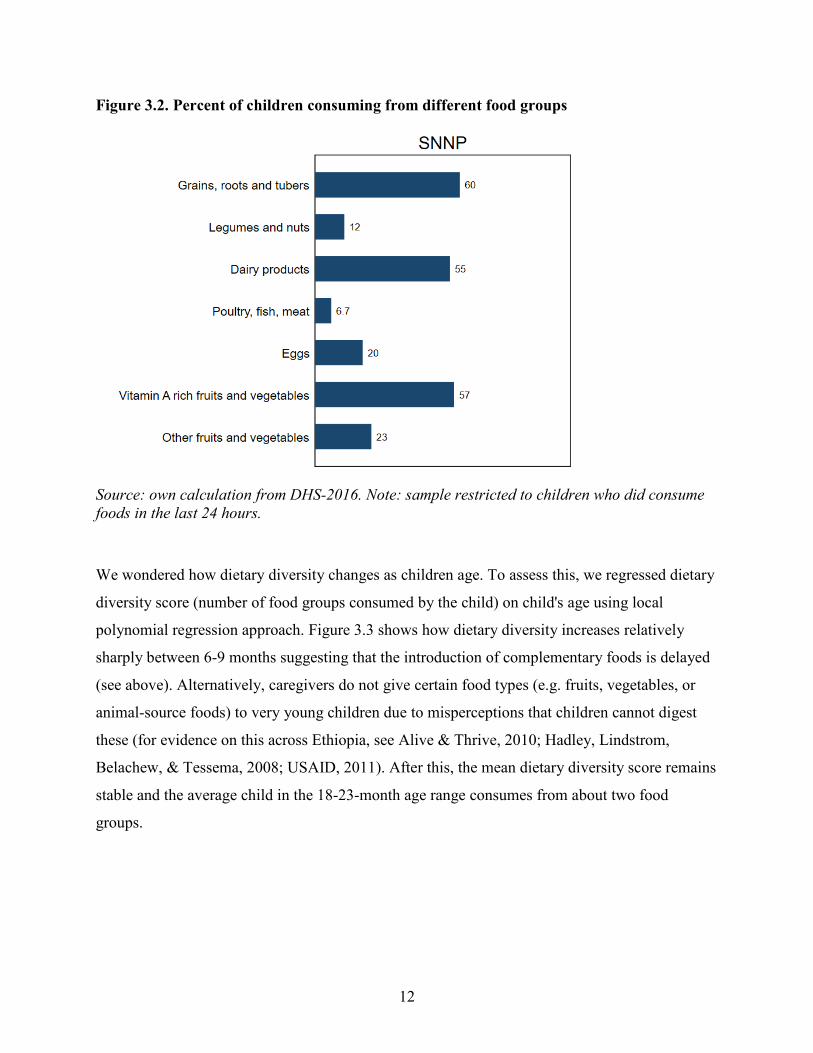
12
Figure 3.2. Percent of children consuming from different food groups
Source: own calculation from DHS-2016. Note: sample restricted to children who did consume foods in the last 24 hours.
We wondered how dietary diversity changes as children age. To assess this, we regressed dietary
diversity score (number of food groups consumed by the child) on child's age using local
polynomial regression approach. Figure 3.3 shows how dietary diversity increases relatively
sharply between 6-9 months suggesting that the introduction of complementary foods is delayed
(see above). Alternatively, caregivers do not give certain food types (e.g. fruits, vegetables, or
animal-source foods) to very young children due to misperceptions that children cannot digest
these (for evidence on this across Ethiopia, see Alive & Thrive, 2010; Hadley, Lindstrom,
Belachew, & Tessema, 2008; USAID, 2011). After this, the mean dietary diversity score remains
stable and the average child in the 18-23-month age range consumes from about two food
groups.

13
Figure 3.3. Relationship between child dietary diversity and child's age
Note: Local polynomial regression. Shaded areas represent 95% confidence intervals. Source: own calculation from DHS-2016.
There is an emerging consensus among researchers and practitioners that income growth alone
will not address poor dietary quality (Ruel, Alderman, Maternal, & Group, 2013). To illustrate
this, we regressed child dietary diversity on an aggregated wealth measure based on household's
ownership of different durable assets. Figure 3.4 shows how children originating from wealthier
households consume a more diverse diet but even in the richest households, the average child
consumes only from two or three food groups.

14
Figure 3.4. Relationship between child dietary diversity and household wealth
Note: Local polynomial regression. Shaded areas represent 95% confidence intervals. The vertical dashed line represents 90th percentile of the wealth index distribution; 90 % of the (child) sample are located on the left side of this line. Source: own calculation from DHS-2016.
3.2. Women's diets We assessed maternal diets using FAO and FHI 360 (2016) guidelines that group women's food
consumption into 10 food groups:
1. All starchy staple foods;
2. Beans and peas;
3. Nuts and seeds;
4. Dairy;
5. Flesh foods;
6. Eggs;
7. Vitamin A-rich dark green leafy vegetables;
8. Other vitamin A-rich vegetables and fruits;
9. Other vegetables;

15
10. Other fruits.
This yields a dietary diversity score ranging from 0 to 10. Minimum Dietary Diversity (MDD-
W) is met if the mother consumed from five or more food groups during the 24-hour window.
The average mother in the BMGF-PSNP sample consumed from 2.1 food groups (out of 10).
Figure 3.5 shows the full distribution of mothers' dietary diversity score in PSNP woredas in
August 2017. As before, the bars falling short from five food groups are marked with gray color.
We see that only 2.6 percent of the mothers met the minimum dietary diversity of five food
groups. Meanwhile, 30 percent of the mothers consumed only from one food group. These
women would have to increase their dietary diversity by four food groups in order to meet the
minimum recommended dietary diversity. About 36 percent of the women were three food
groups shy from meeting the recommendation while 24 percent needed two food groups to meet
(MDD-W). About 8 percent of the women were missing just one food group.
Figure 3.5. Distribution of mothers' dietary diversity score, PSNP areas in SNNP
Source: own calculation from PSNP-2018.
Figure 3.6 shows the percent of mothers consuming from the 10 food groups. More than 80
percent of the mothers consumed starchy staple foods while beans or peas were consumed by 17
percent of the mothers. Nearly 13 percent of the mothers consumed dairy, but the consumption

16
of other animal-sourced foods was rare: only 1 percent consumed meat products or eggs. More
than half of the mothers (55 percent) consumed Vitamin A-rich dark green leafy vegetables and
8 percent other vitamin A-rich fruits and vegetables. Less than 3 percent consumed other types of
fruits and 31 percent other types of vegetables.
Figure 3.6. Percent of mothers consuming from different food groups, PSNP areas in SNNP
Source: own calculation from PSNP-2017.
The FtF data collected in July 2018 confirm these findings. The data sets do not allow us to
construct the same 10-food group indicator.6 Instead, we used an earlier women's dietary
diversity score indicator developed by FAO (2012). This indicator is based on the following nine
food groups:
1. Grains, roots, and tubers;
2. Legumes and nuts;
3. Dairy products (milk, yogurt, cheese);
4. Organ meat;
6 This is because the questionnaire did not separate nuts and seeds from legumes.
17
5. Eggs;
6. Flesh foods and other misc. small animal protein;
7. Vitamin A dark green leafy vegetables;
8. Other Vitamin A-rich vegetables and fruits;
9. Other fruits and vegetables.
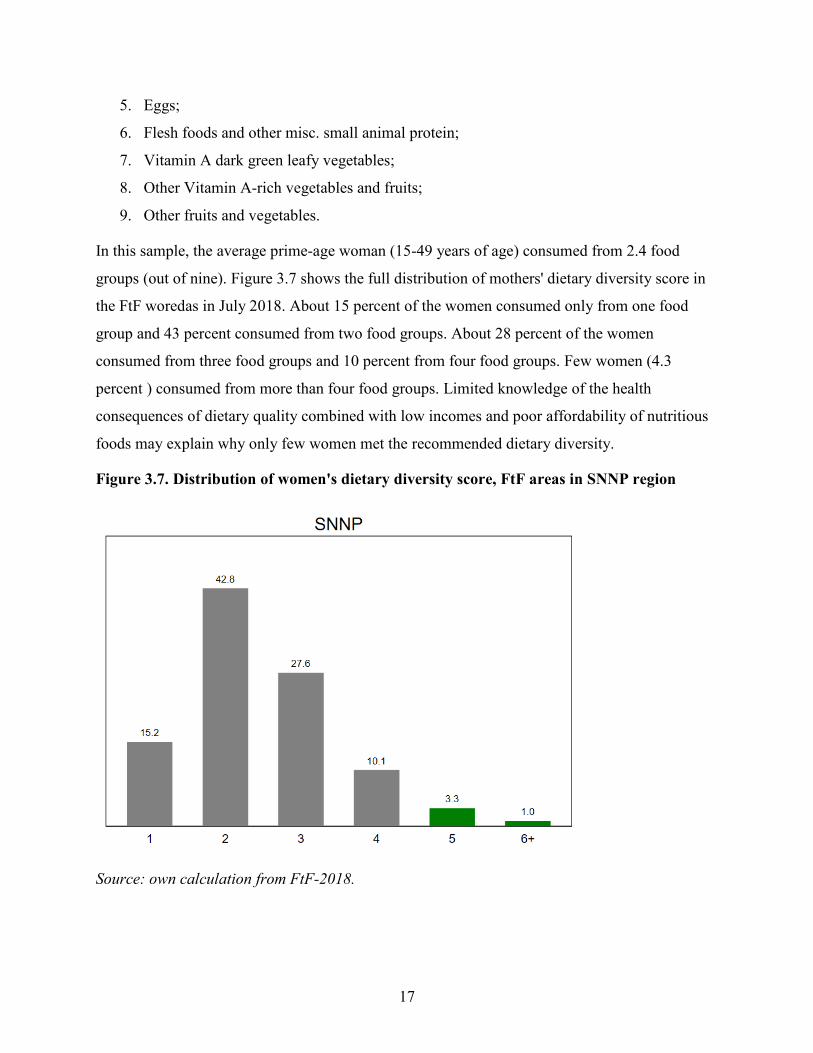
In this sample, the average prime-age woman (15-49 years of age) consumed from 2.4 food
groups (out of nine). Figure 3.7 shows the full distribution of mothers' dietary diversity score in
the FtF woredas in July 2018. About 15 percent of the women consumed only from one food
group and 43 percent consumed from two food groups. About 28 percent of the women
consumed from three food groups and 10 percent from four food groups. Few women (4.3
percent ) consumed from more than four food groups. Limited knowledge of the health
consequences of dietary quality combined with low incomes and poor affordability of nutritious
foods may explain why only few women met the recommended dietary diversity.
Figure 3.7. Distribution of women's dietary diversity score, FtF areas in SNNP region
Source: own calculation from FtF-2018.

18
Figure 3.8 shows the percent of mothers in FtF areas consuming from the nine food groups. As
in the PSNP areas, food consumption is concentrated on starchy staples and Vitamin A dark
green leafy vegetables. The consumption of animal-sourced foods is somewhat more common in
the FtF areas, possibly reflecting differences in income levels. Otherwise, the consumption
patterns are very similar to those observed for the PSNP sample.
Figure 3.8. Percent of mothers consuming from different food groups, FtF areas in SNNP region
Source: own calculation from FtF-2018.
19
4. Food production from a nutrition perspective
In this section, we examine the agricultural production in the region from a nutrition perspective.
Using CSA's agricultural sample survey data, we disaggregate the production into the seven-food
groups used to measure children's dietary diversity in section 3.1. To capture the foods that are
not categorized in the seven-food groups (e.g. red peppers, garlic, coffee, sugarcane, and honey),
we add an additional food group and called it ‘other foods.’ We then convert the amounts
produced to calories using the Ethiopian food composition tables (EPHI, undated) and FAO
reject estimates which correspond to weight estimations of edible portions of foods produced to
calculate energy supplied. The total energy is then divided by the total population for that
specific year reported in CSA (2013). Finally, the energy produced is expressed on a per day
basis by dividing by 365 to enable comparison with daily requirements. 7
Table 4.1 shows the daily total energy production per capita per these food groups. First, the total
calorie production calories nearly doubled between 2011 and 2015. This increase was largely
driven by the production of grains, roots, and tubers. In this food group, the amount of calories
produced increased by a staggering 115 percent. Second, we see that the agricultural production
is heavily concentrated on the production of grains, roots, and tubers that accounted for 85
percent of all calories produced in the region in 2015.8 Legumes and nuts account for 5 percent
of the total calorie production. The remaining six food groups account for nearly 10 percent of
the total calories produced in the region. Table 4.2 compares these production levels to
population-adjusted estimated average requirements for energy and various nutrients. We see
that the production level in the region is sufficient to meet most micronutrient requirements but
insufficient when it comes to energy and protein.
7 The implicit assumption here is that the availability of energy (and nutrients) is constant across seasons. This is unlikely to be the case: agricultural production in Ethiopia is largely rain-fed (Taffesse, Dorosh, & Gemessa, 2012), and therefore highly seasonal. Hirvonen, Taffesse, and Worku (2016) show how household energy intakes vary across seasons. 8 It is instructive to compare this production share to international dietary recommendations. For example, the recently developed diet recommendation by the EAT-Lancet commission recommends that only one-third of the total daily calories come from grains, roots, and tubers (Willett et al., 2019).

20
Table 4.1. Total energy production per capita per day, 2011-2015, by food categories
2011 2012 2013 2014 2015 Grains, roots, and tubers 1,303 1,400 2,072 3,113 2,807 Legumes and nuts 143 123 141 144 174 Dairy products 78 71 93 67 70 Poultry, fish, meat 5.0 5.4 4.0 4.4 4.9 Eggs 3.0 2.1 2.4 2.4 2.5 Vitamin A-rich fruits and vegetables 2.1 2.6 2.3 1.9 2.4 Other fruits and vegetables 31 36 33 32 42 Other foods 132 116 133 167 183 Total 1,699 1,757 2,480 3,531 3,286
Source: Own calculation from CSA agricultural sample surveys. Amounts are kilocalories.
Table 4.2 Prevalence (%) of energy and nutrient gaps relative to population-adjusted estimated average requirements in 2015
% Energy (kcal) 10.0 Protein (g) 8.8 Vitamin A (µg RAE) 0.0 Ascorbic acid (mg) 0.0 Iron (mg) 0.0 Zinc (mg) 0.0 Calcium (mg) 3.1 Thiamine (mg) 0.0 Niacin (mg) 0.1 Riboflavin (mg) 0.2
Source: Baye et al. (2019)
Several limitations need to be considered when interpreting the results presented in this section.
First, these estimates ignore international trade in agricultural products. However, exports form
only 2 percent of the total domestic production. Meanwhile, the FAO food balance sheet data
indicates that less than 4 percent of the domestic food supply in Ethiopia comes from imports,
out of which nearly all are cereals (Baye et al., 2019). Consequently, the estimates are likely to
be slightly underestimated, especially for the energy produced in the country. Second, there are
several factors which limit the extent to which the produced calories and nutrients are actually
available for human consumption. These factors include post-harvest losses, food waste,

21
seasonality of food production, food prices, food preparation, and intra-household distribution all
affect what is actually consumed from what is produced. That said, the purpose of this exercise is
to highlight what could be achieved with more efficient post-harvest handling, better market
integration, storage, and processing infrastructures along with improved consumer behavior.
5. Market availability of nutritious foods
In this section we assess the availability of nutritious foods in rural markets. As shown by
Sibhatu and Qaim (2017), nutritious foods, such as fruits, vegetables, meat and eggs, are largely
sourced from markets in rural Ethiopia. The exception is dairy for which the markets are missing
or poorly functioning (Hoddinott, Headey, & Dereje, 2015).
Together, the PSNP and FtF survey teams visited 97 rural communities in 33 woredas in rural
SNNP. In each community, the team visited the local food market to assess food availability and
prices. A novel feature of these market surveys was that the enumerators recorded whether the
food item is available in the market.9 Both surveys fielded a similar market questionnaire.
We group these data using the 10-food group categorization used to analyze women's dietary
diversity in Section 3.2, with the exception that we do not include the starchy staple food group
in the analysis.10
Table 5.1 shows the market availability in the beans and peas food group. We see that market
availability is not a major constraint for this food group. The most common food items in the
markets in this food group are chick pea, horse bean, lentils, and cowpea.
9 Standard market surveys do not typically collect this information. As a result, the end-user of the data cannot be sure whether the price observation is missing because the item did not exist in the market or because of a data entry or other mistake. 10 It is tempting to compare these market availability findings to the production figures presented in Section 4. There are several factors at play why the market availability and agricultural output (measured in calories) figures seem out of sync. First, the market availability analysis does not consider price. Indeed, foods may be available in the markets but because of limited supply the prices are high, thereby excluding the poorest consumers from purchasing these items. We assess affordability in the next section. Second, for some of these items, the calorie density (kcal/kg) is low. This is particularly the case for green leafy vegetables such as kale and spinach. Third, production of many fruits and vegetables is largely seasonal, which means that the total annual production may be low while the production (and hence) availability in one particular season is high. Fourth, some of the foods sold at the markets may come from other regions.

22
Table 5.1. Market availability of food items in the Beans and peas food group, by survey
Beans and peas (7 items in both surveys) PSNP (%) FtF (%) Bean, white 22.8 29.0 Bean, brown 22.8 0.0 Cowpea 70.2 48.4 Horse bean 87.7 80.6 Chick pea 70.2 32.3 Lentils 87.7 54.8 Green bean 0.0 12.9
Source: Own calculation from BMGF-PSNP (March-2019) and FtF (September-October 2018) surveys. The market availability in the nuts and seeds food group is summarized in Table 5.2. Groundnuts
were available in 37 percent of the markets in the PSNP survey and nearly half of the markets in
the FtF survey. Fenugreek was available in 74 percent in the markets where the PSNP operates
and 52 percent of the markets where the FtF operates.
Table 5.2. Market availability of food items in the Nuts and seeds food group, by survey
Nuts and seeds (5 items in both surveys) PSNP (%) FtF (%) Groundnut 36.8 48.4 Groundnut flour 1.8 6.5 Fenugreek 73.7 51.6 Vetch 10.5 9.7 Sesame 1.8 12.9
Source: Own calculation from BMGF-PSNP (March-2019) and FtF (September-October 2018) surveys.
Table 5.3 shows the market availability for the items in the dairy food group. Fresh milk was
available in 10 percent of the markets in the PSNP survey and 32 percent of the markets visited
by the FtF survey team. Powdered milk is not widely available in these markets. Local cheese
was more widely available, found in 68 percent of the PSNP markets and 71 percent of the FtF
markets. Yoghurt was available in less than 24 percent of the markets.

23
Table 5.3. Market availability of food items in the Dairy food group, by survey
Dairy (5 items in both surveys) PSNP (%) FtF (%) Fresh milk 10.5 32.3 Powdered milk 0.0 9.7 Yoghurt 14.0 19.4 Cheese 68.4 71.0 Fermented milk (ergo) 7.0 3.2
Source: Own calculation from BMGF-PSNP (March-2019) and FtF (September-October 2018) surveys.
Table 5.4 shows the availability of meat products (flesh foods). Fish was not found from any of
the markets. More than half of the markets had beef but other cut meat (goat, lamb, chicken,
camel) was rarely available in these markets (Table 5.4). If the consumer wanted chicken, he or
she had to buy a live chicken and slaughter it at home as chicken meat is hardly available in
these markets.
Table 5.4. Market availability of food items in the Flesh foods food group, by survey
Flesh foods (9 items in both surveys) PSNP (%) FtF (%) Dried fish 0.0 0.0 Fresh fish 0.0 0.0 Beef meat (not live) 50.9 64.5 Goat meat (not live) 17.5 6.5 Mutton meat (not live) 3.5 19.4 Chicken (live) 82.5 80.6 Chicken meat (not live) 0.0 3.2 Camel meat (not live) 0.0 0.0
Source: Own calculation from BMGF-PSNP (March-2019) and FtF (September-October 2018) surveys. Eggs are available in nearly all markets (Table 5.5) as are Vitamin A-rich dark green leafy
vegetables, especially Ethiopian kale (Table 5.6). Spinach is available in only about 12 percent
of the markets visited in the PSNP survey and only 6.5 percent of the markets visited in the FtF
survey.
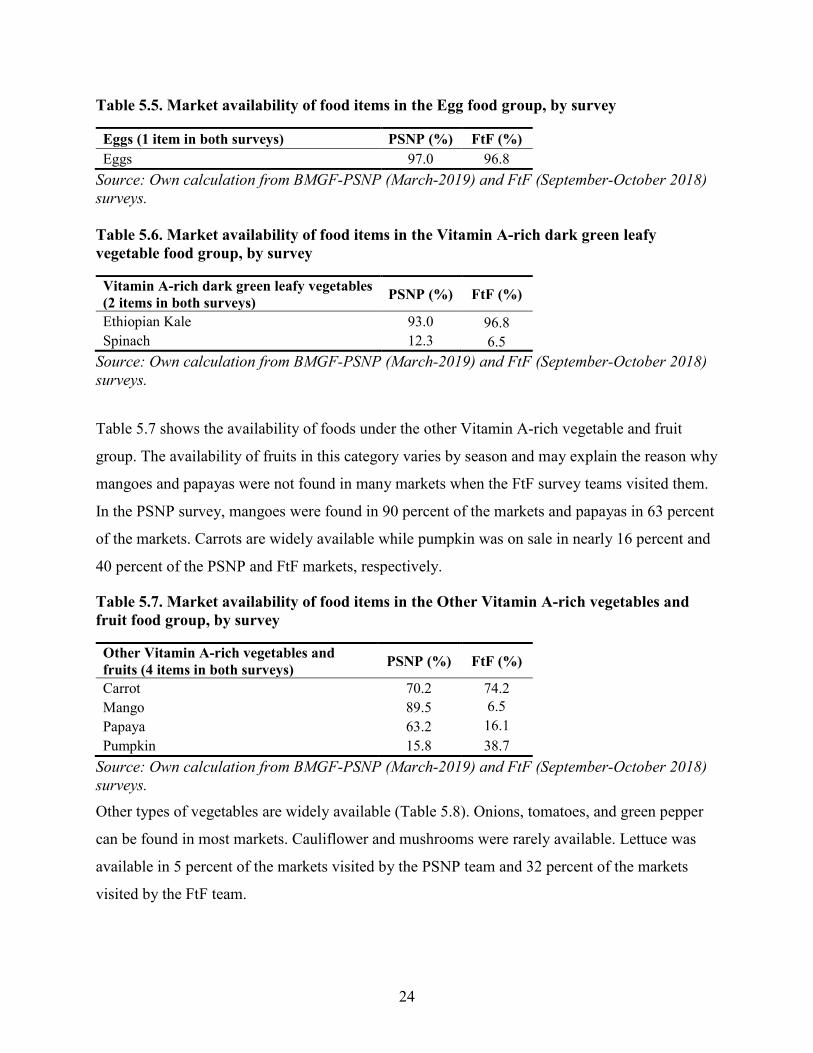
24
Table 5.5. Market availability of food items in the Egg food group, by survey
Eggs (1 item in both surveys) PSNP (%) FtF (%) Eggs 97.0 96.8
Source: Own calculation from BMGF-PSNP (March-2019) and FtF (September-October 2018) surveys. Table 5.6. Market availability of food items in the Vitamin A-rich dark green leafy vegetable food group, by survey
Vitamin A-rich dark green leafy vegetables (2 items in both surveys) PSNP (%) FtF (%)
Ethiopian Kale 93.0 96.8 Spinach 12.3 6.5
Source: Own calculation from BMGF-PSNP (March-2019) and FtF (September-October 2018) surveys.
Table 5.7 shows the availability of foods under the other Vitamin A-rich vegetable and fruit
group. The availability of fruits in this category varies by season and may explain the reason why
mangoes and papayas were not found in many markets when the FtF survey teams visited them.
In the PSNP survey, mangoes were found in 90 percent of the markets and papayas in 63 percent
of the markets. Carrots are widely available while pumpkin was on sale in nearly 16 percent and
40 percent of the PSNP and FtF markets, respectively.
Table 5.7. Market availability of food items in the Other Vitamin A-rich vegetables and fruit food group, by survey
Other Vitamin A-rich vegetables and fruits (4 items in both surveys) PSNP (%) FtF (%)
Carrot 70.2 74.2 Mango 89.5 6.5 Papaya 63.2 16.1 Pumpkin 15.8 38.7
Source: Own calculation from BMGF-PSNP (March-2019) and FtF (September-October 2018) surveys. Other types of vegetables are widely available (Table 5.8). Onions, tomatoes, and green pepper
can be found in most markets. Cauliflower and mushrooms were rarely available. Lettuce was
available in 5 percent of the markets visited by the PSNP team and 32 percent of the markets
visited by the FtF team.

25
Table 5.8. Market availability of food items in the Other vegetable food group, by survey
Other vegetables (6 items in both surveys) PSNP (%) FtF (%) Onion 100.0 96.8 Tomato 94.7 71.0 Mushroom 0.0 0.0 Lettuce 5.3 32.3 Cauliflower 3.5 6.5 Green pepper 89.5 90.3
Source: Own calculation from BMGF-PSNP (March-2019) and FtF (September-October 2018) surveys.
Other fruits (that are not rich in Vitamin A) are widely available in SNNP (Table 5.9). Bananas,
lemons and avocados were found from most markets. Oranges were common in FtF localities in
September-October but only available in 32 percent of the markets in PSNP areas in March
2019. Cactus fruit and melons were not available at the time the enumerators visited these
markets.
Table 5.9. Market availability of food items in the Other fruit food group, by survey
Other fruits (6 items in both surveys) PSNP (%) FtF (%) Banana 100.0 93.5 Orange 31.6 71.0 Cactus fruit 0.0 0.0 Lemon (lomi) 71.9 90.3 Avocado 93.0 71.0 Melon 0.0 0.0
Source: Own calculation from BMGF-PSNP (March-2019) and FtF (September-October 2018) surveys.
6. Affordability of nutritious foods
In this section, we assess the affordability of nutritious foods in SNNP. We use the seven-food
group categorization used to assess children's diets in Section 2.1, except we omit the first food

26
group: grains, roots, and tubers. We define affordability as the share of total income needed to
consume the recommended daily amount of the food group. 11
Ethiopia has not yet developed its own nutritional guidelines or eating recommendations.
Therefore, we have to use international nutritional guidelines to determine the recommended
intake for each food group. Here, we use the recently developed recommendations by the EAT-
Lancet Commission on Food, Planet and Health (Willett et al., 2019). The EAT diet
recommendations attempt to maximize health benefits while minimizing the diet's negative
impact on environment. Hence, the diet recommendation puts more emphasis on plant-based
foods (legumes, nuts, vegetables, and fruits), and less on meat and eggs. 12
Table 6.1 maps these recommendations to the six food groups.
Table 6.1. EAT-Lancet Commission's intake recommendations, by food group
Food group grams per day Legumes and nuts 125 Dairy products 250 Poultry, fish, and meat 71 Eggs 13 Vitamin A-rich fruits and vegs 200 Other fruits and vegetables 300
Source: Willet et al (2019).
Of note is that nutritional needs vary by age, sex and physical activity levels. The EAT-Lancet
Commission's dietary recommendations are for healthy individuals 2 years or older. Infants and
young children (less than 2 years of age) are growing rapidly and therefore have very different
requirements than others (Willett et al., 2019). The purpose of the affordability analysis carried
out here is not to calculate the cost of an optimal diet for children or women. Rather we aim to
11 These calculations do not account for refuse factors and therefore these affordability estimates should be considered as lower bound. 12 As noted by Willett et al (2019), the recommended amount of animal-source foods may be sub-optimal for many sub-Saharan African countries. More specifically, the authors write (p.10) that "[b]ecause many regions, such as sub-Saharan Africa, still face severe burdens of undernutrition and malnutrition, and growing children often do not obtain adequate quantities of nutrients from plant-source foods alone, the role of animal-source foods should be examined carefully".
27
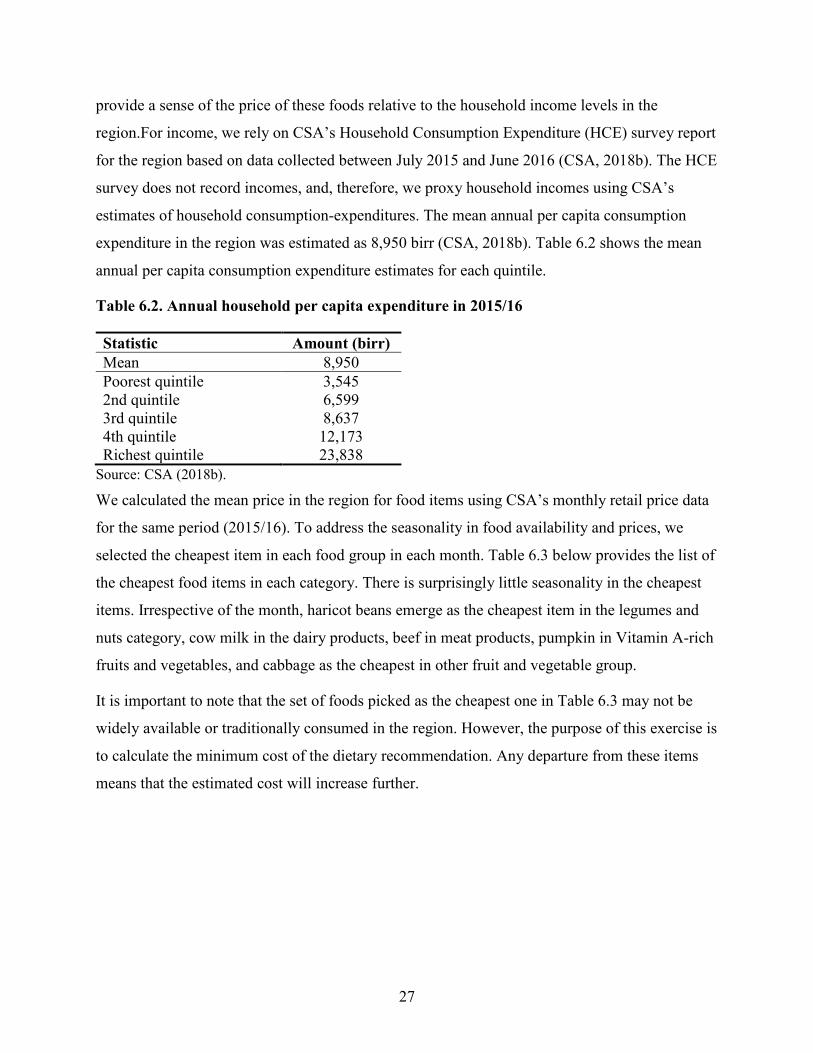
provide a sense of the price of these foods relative to the household income levels in the
region.For income, we rely on CSA’s Household Consumption Expenditure (HCE) survey report
for the region based on data collected between July 2015 and June 2016 (CSA, 2018b). The HCE
survey does not record incomes, and, therefore, we proxy household incomes using CSA’s
estimates of household consumption-expenditures. The mean annual per capita consumption
expenditure in the region was estimated as 8,950 birr (CSA, 2018b). Table 6.2 shows the mean
annual per capita consumption expenditure estimates for each quintile.
Table 6.2. Annual household per capita expenditure in 2015/16
Statistic Amount (birr) Mean 8,950 Poorest quintile 3,545 2nd quintile 6,599 3rd quintile 8,637 4th quintile 12,173 Richest quintile 23,838
Source: CSA (2018b).
We calculated the mean price in the region for food items using CSA’s monthly retail price data
for the same period (2015/16). To address the seasonality in food availability and prices, we
selected the cheapest item in each food group in each month. Table 6.3 below provides the list of
the cheapest food items in each category. There is surprisingly little seasonality in the cheapest
items. Irrespective of the month, haricot beans emerge as the cheapest item in the legumes and
nuts category, cow milk in the dairy products, beef in meat products, pumpkin in Vitamin A-rich
fruits and vegetables, and cabbage as the cheapest in other fruit and vegetable group.
It is important to note that the set of foods picked as the cheapest one in Table 6.3 may not be
widely available or traditionally consumed in the region. However, the purpose of this exercise is
to calculate the minimum cost of the dietary recommendation. Any departure from these items
means that the estimated cost will increase further.

28
Table 6.3. Cheapest food item in each food group
Year Month Legumes and nuts
Dairy products
Poultry, fish and meat
Eggs Vitamin A-rich fruits and vegs
Other fruits and vegetables
Average Haricot beans Cow milk Beef Egg Pumpkin Cabbage
2015
July Haricot beans Cow milk Beef Egg Pumpkin Cabbage August Haricot beans Cow milk Beef Egg Pumpkin Cabbage September Haricot beans Cow milk Beef Egg Pumpkin Cabbage October Haricot beans Cow milk Beef Egg Pumpkin Cabbage November Haricot beans Cow milk Beef Egg Pumpkin Cabbage December Haricot beans Cow milk Beef Egg Pumpkin Cabbage
2016
January Haricot beans Cow milk Beef Egg Pumpkin Cabbage February Haricot beans Cow milk Beef Egg Pumpkin Cabbage March Haricot beans Cow milk Beef Egg Pumpkin Cabbage April Haricot beans Cow milk Beef Egg Pumpkin Cabbage May Haricot beans Cow milk Beef Egg Pumpkin Cabbage June Haricot beans Cow milk Beef Egg Pumpkin Cabbage
Note: Cow milk refers to unpasteurized milk. Source: Own calculation from CSA price data.
We then used the prices of the above food items to calculate the total annual cost of consuming
the recommended serving reported in Table 6.1. To get the share of total income needed to meet
the recommended intake, we divided the total annual cost of the recommended intake by the
annual per capita consumption expenditure value divided by 365 (to get the daily cost per
person).
Table 6.4 provides the results.13 Following the EAT diet would mean that the average resident in
SNNP would spend 4 percent of their income on legumes and nuts, 16 percent on dairy, 37
percent on meat, 4 percent on eggs, 2 percent on Vitamin A-rich fruits and vegetables, and 6
percent of other fruits and vegetables. These percentages are much higher for the poorest
households for which many of these recommendations are out of reach. Therefore, the poorest
13 It is worth noting here that as per the Engel's law, the average Ethiopian allocates a large fraction of their budget on food. Therefore the shares allocated to food are high, irrespective of which diet recommendation we use.

29
households may require special attention when nutrition-sensitive agriculture and other policies
are planned.14
Despite the moderate emphasis on meat products in the EAT diet, consuming the recommended
intake (71 grams) would be expensive in SNNP. For the average resident in the region, this
would mean spending 37 percent of their budget just on meat products. For the poorest
households, a daily ration of 71 grams of meat would take 93 percent of their total budget.
The EAT-Lancet commission recommends consuming 13 grams of eggs every day. Considering
that the local egg weighs about 35 grams, this means consuming two to three eggs per week. For
the average resident in SNNP, this would mean allocating 4 percent of the budget on eggs. For
the poorest, the corresponding share would be 10 percent.
A large part of the daily calories in the EAT diet comes from the consumption of fruits and
vegetables. Here we have divided these into items that are rich in Vitamin A and other items.
Consuming 200 grams of fruits and vegetables that are rich in Vitamin A would mean allocating
a mere 2 percent of the budget on these items at the mean income level. For the poorest, the
corresponding share is 5 percent. Following the recommended intake for other fruits and
vegetables would take 6 percent of the total budget at the mean income level and 16 percent at
income level of the poorest households.
Table 6.4. Percent of household income needed to meet the recommended intake, by income quintile
Mean income
Poorest quintile
2nd quintile
3rd quintile
4th quintile
Richest quintile
Legumes and nuts 4 10 6 4 3 2 Dairy products 16 41 22 17 12 6 Poultry, fish, and meat 37 93 50 38 27 14 Eggs 4 10 5 4 3 1 Vitamin A-rich fruits and vegs 2 5 3 2 2 1 Other fruits and vegetables 6 16 9 7 5 2 Total 69 175 95 72 52 26
14 It is important to note here that nutrition provisions have recently been integrated into Ethiopia's productive safety net program (PSNP) that covers 8 million poor rural people (Bossuyt, 2017).

30
Finally, pumpkin and cabbage were identified as the cheapest items in their food groups (Table
6.3). These foods are not widely consumed in Ethiopia, perhaps because they can only be bought
in large quantities (in terms of weight) and in absence of preservation technologies are not
actually affordable. This prompts us to explore the sensitivity of these estimates considering the
second cheapest item in the fruit and vegetable food groups (see Appendix B). These results are
presented in Table 6.5. As expected, the percent of income needed to meet the recommended
intake somewhat increases. For the average resident, following the EAT recommendation for
Vitamin A-rich fruit and vegetables would cost 4 percent of the total budget. The corresponding
share among the poorest households is 11 percent. As for other fruits and vegetables, 11 percent
is needed at the mean income level and 26 percent at the income level of the poorest household.
Table 6.5. Percent of household income needed to meet the recommended intake, by income quintile
Mean income
Poorest quintile
2nd quintile
3rd quintile
4th quintile
Richest quintile
Vitamin A-rich foods and fruits 4 11 6 5 3 2 Other fruits and vegetables 11 26 14 11 8 4
7. Conclusions
This report has analyzed consumption, production, market availability, and affordability of
nutritious foods in the SNNP region of Ethiopia. In this section, we summarize the findings.
Children's and women's diets in the region are monotonous. Only 13 percent of the children 6-23
months meet the WHO recommended dietary diversity (four food groups out of seven). Less
than 3 percent of the women meet the recommended dietary diversity for adult women (five food
groups out of 10). Further analyses suggest that one reason for poor dietary diversity among
infants and young children is delayed initiation of complementary foods. Other possible
explanations include misperceptions around when to introduce certain foods to young children as
well as poor affordability of certain foods, such as ASFs.
Nearly 36 percent of children would need to add one or two additional food groups to their diet
to meet the four-food group recommendation. Should this happen, the share of children
31
achieving the minimum dietary diversity would increase to 49 percent. With this in mind, the
following passages discuss the non-starchy staple food groups and their potential of reaching the
most households for in the region to improve dietary diversity.
7.1. Legumes and nuts Legumes and nuts are not widely consumed among children and adult women in SNNP.
Meanwhile, they are widely available in the rural markets and their production is at a relatively
reasonable level, supplying more than 170 calories per person per day. They are also affordable.
Therefore, legumes and nuts have a high potential for improving dietary diversity in SNNP.
7.2. Dairy products While dairy products are consumed by more than half of the children, their consumption is not
common among adult women. Their production is relatively low, supplying only about 70
calories per day per person. Furthermore, their market availability and affordability is poor.
While dairy is an important source of many nutrients and highly beneficial input for child growth
(Headey, Hirvonen, & Hoddinott, 2018), their commercial value chains are extremely complex
requiring refrigeration or industrial processing (e.g. powder or ultra-high temperature processing)
to maintain food safety. Given all this, increasing dairy consumption further in SNNP, especially
in rural areas, would require considerable investments.
7.3. Flesh foods Few children and adult women consume meat products in SNNP. Their production is relatively
low, supplying only about five calories per day per person. Furthermore, while their market
availability is relatively good, meat products are not affordable for most households. All things
considered, improving the availability and affordability of meat products is challenging in the
SNNP region and will require innovative solutions. Dried shredded or powdered meat products
hold promise as they simultaneously solve several issues regarding perishability, affordability
(can be sold in small portions), and acceptability among young children.
7.4. Eggs Egg consumption is not widespread in SNNP. Also their production levels are relatively low,
supplying only 2.5 calories per person per day. However, their market availability is good with
most rural markets stocking eggs. They are also relatively affordable, and have high nutritional
content and recent evidence suggests eggs have a high potential for reducing stunting rates in
32
poor countries (Headey et al., 2018; Iannotti, Lutter, Bunn, & Stewart, 2014; Iannotti et al.,
2017). Therefore, eggs could have a high potential for improving dietary diversity in SNNP.
7.5. Vitamin A-rich fruits and vegetables Vitamin A-rich fruits and vegetables are consumed by more than half of the children and adult
women. Their market availability is also good and they are affordable. Therefore, considering the
dietary gaps with respect to other food groups, Vitamin A-rich fruits and vegetables have a
limited potential for improving dietary diversity in SNNP.
7.6. Other fruits and vegetables The consumption of other types of fruits and vegetables is less widespread among children and
adult women. Meanwhile, their availability in the region is good with most markets stocking
onions, tomatoes, and bananas. They are also reasonably affordable, though perhaps out of reach
for the poorest households. Therefore, other fruits and vegetables may also have a potential for
improving dietary diversity in SNNP. However, high perishability and the seasonal availability
of these products should be taken into account.
7.7. Limitations This study has limitations. First, although we use geographically widespread surveys to assess
women's dietary diversity, in the absence of regionally representative data, we cannot be sure
whether the statistics reported here represent the region as a whole. Second, the same issue
applies for market availability. Third, SNNP is a large heterogeneous region covering multiple
agro-ecological zones. This heterogeneity is imperfectly captured in this report. Nutrition-
sensitive agriculture programs need to take this into account by tailoring the interventions to the
prevailing agro-ecological conditions in the program areas. Finally, our estimates on crop
production levels is limited to the production during the main rainy seasons. Significant crop
production outside the rainy seasons in the region (e.g. using irrigation) would mean that
production levels are under-estimated.

33
References
Abebe, Z., Haki, G. D., Schweigert, F. J., Henkel, I. M., & Baye, K. (2018). Low breastmilk vitamin A concentration is prevalent in rural Ethiopia. European Journal of Clinical Nutrition.
Alive & Thrive. (2010). IYCF practices, beliefs and influences in Tigray Region, Ethiopia., Addis Ababa, Ethiopia: Alive & Thrive.
Arimond, M., & Ruel, M. T. (2004). Dietary diversity is associated with child nutritional status: evidence from 11 demographic and health surveys. The Journal of Nutrition, 134(10), 2579-2585.
Bachewe, F., Hirvonen, K., Minten, B., & Yimer, F. (2017). The rising costs of nutritious diets in Ethiopia ESSP Research Note, 67, Addis Ababa: IFPRI.
Baye, K., Hirvonen, K., Dereje, M., & Remans, R. (2019). Energy and nutrient production in Ethiopia, 2011-2015: implications to supporting healthy diets and food systems. PloS one.
Bossuyt, A. (2017). Ethiopia Productive Safety Net Program, Phase Four: Detailed review of the progress on nutrition sensitive provisions (July 2015 to March 2017). A working paper presented to the PSNP nutrition task force (April 2017), Addis Ababa: UNICEF.
CSA. (2013). Population Projection of Ethiopia for All Regions at Wereda Level from 2014 – 2017, Addis Ababa, Ethiopia: Central Statistical Agency (CSA) of Ethiopia.
CSA. (2018a). The 2015/16 Ethiopian Household Consumption – Expenditure (HCE) Survey Results for Southern Nations, Nationalities, and Peoples' Region. Statistical Bulletin, 585-7, Addis Ababa: Central Statistical Agency (CSA).
CSA. (2018b). The 2015/16 Ethiopian Household Consumption – Expenditure (HCE) Survey: Country Level Statistical Report, Addis Ababa: Central Statistical Agency (CSA) of the Federal Democratic Republic of Ethiopia
CSA, & ICF. (2016). Ethiopia Demographic and Health Survey 2016, Addis Ababa, Ethiopia, and Rockville, Maryland, USA: Central Statistical Agency (CSA) of Ethiopia and ICF.
Daniels, M., Adair, L., Popkin, B., & Truong, Y. (2009). Dietary diversity scores can be improved through the use of portion requirements: an analysis in young Filipino children. European Journal of Clinical Nutrition, 63(2), 199-208.
Dehghan, M., Mente, A., Zhang, X., Swaminathan, S., Li, W., Mohan, V., . . . Rosengren, A. (2017). Associations of fats and carbohydrate intake with cardiovascular disease and mortality in 18 countries from five continents (PURE): a prospective cohort study. The Lancet, 390(10107), 2050-2062.
Demissie, T., Ali, A., Mekonen, Y., Haider, J., & Umeta, M. (2010). Magnitude and distribution of vitamin A deficiency in Ethiopia. Food and Nutrition Bulletin, 31(2), 234-241.
EPHI. (2016). Ethiopian National Micronutrient Survey Report, Addis Ababa: Ethiopian Public Health Institute (EPHI).

34
EPHI. (undated). Expanded Food Composition Table for Use in Ethiopia. Addis Ababa Ethiopian Public Health Institute (EPHI).
FAO. (1972). Technical conversion factors for agricultural commodities. Rome: Statistics Division of the Food and Agriculture Organization (FAO) of the United Nations
FAO. (2012). Guidelines for measuring household and individual dietary diversity FAO, & FHI 360. (2016). Minimum Dietary Diversity for Women: A Guide to Measurement.
Rome: Food and Agriculture Organization (FAO) of the United Nations and USAID’s Food and Nutrition Technical Assistance III Project (FANTA), managed by FHI 360.
Forouzanfar, M. H., Alexander, L., Anderson, H. R., Bachman, V. F., Biryukov, S., Brauer, M., . . . Murray, C. J. (2015). Global, regional, and national comparative risk assessment of 79 behavioural, environmental and occupational, and metabolic risks or clusters of risks in 188 countries, 1990-2013: a systematic analysis for the Global Burden of Disease Study 2013. The Lancet, 386(10010), 2287-2323.
Gebru, M., Remans, R., Brouwer, I., Baye, K., Melesse, M., Covic, N., . . . Hirvonen, K. (2018). Food systems for healthier diets in Ethiopia: Toward a research agenda.
GFDRE. (2016a). National Nutrition Programme 2016-2020. Addis Ababa: Government of the Federal Democratic Republic of Ethiopia (GFDRE).
GFDRE. (2016b). Seqota Declaration Implementation Plan (2016 – 2030): Summary Programme Approach Document, Addis Ababa: Government of the Federal Democratic Republic of Ethiopia (GFDRE).
Hadley, C., Lindstrom, D., Belachew, T., & Tessema, F. (2008). Ethiopian adolescents' attitudes and expectations deviate from current infant and young child feeding recommendations. Journal of Adolescent Health, 43(3), 253-259.
Hall, J. N., Moore, S., Harper, S. B., & Lynch, J. W. (2009). Global Variability in Fruit and Vegetable Consumption. American Journal of Preventive Medicine, 36(5), 402-409.e405. doi: https://doi.org/10.1016/j.amepre.2009.01.029
Hassen Worku, I., Dereje, M., Minten, B., & Hirvonen, K. (2017). Diet transformation in Africa: the case of Ethiopia. Agricultural Economics, 48(supplement), 73–86.
Headey, D., Nisrane, F. B., Worku, I., Dereje, M., & Taffesse, A. S. (2012). Urban wage behavior and food price inflation: The case of ethiopia. Ethiopia Strategy Support Programme II Working Paper, 41.
Headey, D. D., Hirvonen, K., & Hoddinott, J. F. (2018). Animal sourced foods and child stunting. American Journal of Agricultural Economics, 100(5), 1302–1319.
Hirvonen, K. (2016). Rural-urban differences in children's dietary diversity in Ethiopia: a Poisson decomposition analysis. Economics Letters, 147, 12-15.
Hirvonen, K., Headey, D., Golan, J., & Hoddinott, J. (2019). Changes in child undernutrition rates in Ethiopia 2000-2016. In C. Cramer, F. Cheru, & A. Oqubay (Eds.), The Oxford Handbook of the Ethiopian Economy. Oxford: Oxford University Press.
Hirvonen, K., Taffesse, A. S., & Worku, I. (2016). Seasonality and household diets in Ethiopia. Public Health Nutrition, 19(10), 1723-1730.

35
Hoddinott, J., Headey, D., & Dereje, M. (2015). Cows, missing milk markets and nutrition in rural Ethiopia. Journal of Development Studies, 51(8), 958–975.
Iannotti, L. L., Lutter, C. K., Bunn, D. A., & Stewart, C. P. (2014). Eggs: the uncracked potential for improving maternal and young child nutrition among the world's poor. Nutrition Reviews, 72(6), 355-368.
Iannotti, L. L., Lutter, C. K., Stewart, C. P., Riofrío, C. A. G., Malo, C., Reinhart, G., . . . Cox, K. (2017). Eggs in Early Complementary Feeding and Child Growth: A Randomized Controlled Trial. Pediatrics, e20163459.
Jones, A. D., Ickes, S. B., Smith, L. E., Mbuya, M. N., Chasekwa, B., Heidkamp, R. A., . . . Stoltzfus, R. J. (2014). World Health Organization infant and young child feeding indicators and their associations with child anthropometry: a synthesis of recent findings. Maternal & child nutrition, 10(1), 1-17.
Kennedy, G. L., Pedro, M. R., Seghieri, C., Nantel, G., & Brouwer, I. (2007). Dietary diversity score is a useful indicator of micronutrient intake in non-breast-feeding Filipino children. The Journal of Nutrition, 137(2), 472-477.
Menon, P., & Frongillo, E. A. (2018). Can integrated interventions create the conditions that support caregiving for better child growth? The Lancet Global Health, 6(3), e236-e237.
Misganaw, A., Haregu, T. N., Deribe, K., Tessema, G. A., Deribew, A., Melaku, Y. A., . . . Dessalegn, M. (2017). National mortality burden due to communicable, non-communicable, and other diseases in Ethiopia, 1990–2015: findings from the Global Burden of Disease Study 2015. Population health metrics, 15(1), 29.
Moursi, M. M., Arimond, M., Dewey, K. G., Trèche, S., Ruel, M. T., & Delpeuch, F. (2008). Dietary diversity is a good predictor of the micronutrient density of the diet of 6-to 23-month-old children in Madagascar. The Journal of Nutrition, 138(12), 2448-2453.
Ruel, M. T. (2003). Operationalizing dietary diversity: a review of measurement issues and research priorities. The Journal of Nutrition, 133(11), 3911S-3926S.
Ruel, M. T., Alderman, H., Maternal, & Group, C. N. S. (2013). Nutrition-sensitive interventions and programmes: how can they help to accelerate progress in improving maternal and child nutrition? The Lancet, 382(9891), 536-551.
Scott, P. (2017). Global panel on agriculture and food systems for nutrition: food systems and diets: facing the challenges of the 21st century. Food Security: The Science, Sociology and Economics of Food Production and Access to Food, 9(3), 653-654.
Sibhatu, K. T., & Qaim, M. (2017). Rural food security, subsistence agriculture, and seasonality. PloS one, 12(10), e0186406.
Steyn, N., Nel, J., Nantel, G., Kennedy, G., & Labadarios, D. (2006). Food variety and dietary diversity scores in children: are they good indicators of dietary adequacy? Public Health Nutrition, 9(05), 644-650.
Taffesse, A. S., Dorosh, P., & Gemessa, S. A. (2012). Crop Production in Ethiopia. In P. Dorosh & S. Rashid (Eds.), Food and Agriculture in Ethiopia. Philadelphia: University of Pennsylvania Press.
36
USAID. (2011). Integration of nutrition education into the Ethiopia Urban Gardens Program: Results of recipe trials and focus group discussions. Infant & Young Child Nutrition Project, Washington DC.: United States Agency for International Development (USAID).
WHO. (2008). Indicators for assessing infant and young child feeding practices: part 1: definitions: conclusions of a consensus meeting held 6-8 November 2007 in Washington DC, USA. Geneva: World Health Organization (WHO).
WHO. (2010). Monitoring the building blocks of health systems: a handbook of indicators and their measurement strategies. Geneva: World Health Organization (WHO).
Willett, W., Rockström, J., Loken, B., Springmann, M., Lang, T., Vermeulen, S., . . . Murray, C. J. L. (2019). Food in the Anthropocene: the EAT–Lancet Commission on healthy diets from sustainable food systems. The Lancet, Published Online January 16, 2019. http://dx.doi.org/10.1016/S0140-6736(18)31788-4, 1-47.
Zerfu, T. A., Pinto, E., & Baye, K. (2018). Consumption of dairy, fruits and dark green leafy vegetables is associated with lower risk of adverse pregnancy outcomes (APO): a prospective cohort study in rural Ethiopia. European Journal of Clinical Nutrition, 8(52).

37
Appendix A: Initiation of complementary feeding in PSNP areas of SNNP
Figure A1 shows a polynomial regression that regresses the likelihood that the child did not
consume from any of the seven-food groups against child's age in months. We see that most of
these 'zero DDS' children are young. More half of the children 6-8 months of age have zero
dietary diversity. The share declines as children grow older but even at 12 months, about 20
percent of the children are still not consuming from any of the seven food groups.
Figure A1: Relationship between the share of children with zero dietary diversity and child's age (in months), in PSNP areas of SNNP
Note: Local polynomial regression. N= 662 children (6-23 months of age) from SNNP (PSNP woredas). March-2017 survey round.

38
The BMGF-PSNP survey included a series of questions about the caregivers' nutrition
knowledge. One of the questions asked the age in which the child should start receiving foods in
addition to breastmilk. The responses to this questions are summarized in Figure A2. We see that
only 36 percent of the caregivers think that complementary feeding should begin when children
turn 6 months, in line with WHO recommendations. Meanwhile, more than 60 percent of the
caregivers think that this should happen later.
Figure A2: Caregiver knowledge: "At what age should a baby first start to receive foods (such as porridge) in addition to breastmilk?", in PSNP areas of SNNP
Note: N = 640 mothers from SNNP (PSNP woredas). March-2017 survey round.

39
Appendix B: Recalculating affordability considering the second cheapest food items in fruit
and vegetable categories
Table B1. Second Cheapest food item in each food group
Year Month Vitamin A-rich fruits and vegs
Other fruits and vegetables
Average Papaya Banana
2015
July Papaya Banana August Ethiopian Kale Lemon September Ethiopian Kale Banana October Ethiopian Kale Banana November Ethiopian Kale Mandarin December Ethiopian Kale Banana
2016
January Papaya Mandarin February Papaya Onion March Papaya Onion April Papaya Banana May Ethiopian Kale Banana June Papaya Banana