Acid Gas Removal Options for Minimizing Methane Emissions
22
Acid Gas Removal Options for Minimizing Methane Emissions Innovative Technologies for the Oil & Gas Industry: Product Capture, Process Optimization, and Pollution Prevention Targa Resources and the Gas Processors Association July 27, 2006 epa.gov/gasstar
Transcript of Acid Gas Removal Options for Minimizing Methane Emissions

Acid Gas Removal Options for Minimizing Methane Emissions
Innovative Technologies for the Oil & Gas Industry: Product Capture, Process
Optimization, and Pollution Prevention
Targa Resources and the Gas Processors Association
July 27, 2006
epa.gov/gasstar

2
Acid Gas Removal: AgendaMethane Losses
Methane Recovery
Is Recovery Profitable?
Industry Experience
Discussion

3
Methane Losses from Acid Gas Removal
There are 290 acid gas removal (AGR) units in gas processing plants1
Emit 644 MMcf annually1
6 Mcf/day emitted by average AGR unit1
Most AGR units use an amine process or SelexolTM
processSeveral new processes have recently been introduced to the gas processing industry
1Inventory of U.S. Greenhouse Gas Emissions and Sinks 1990 - 2004

4
What is the Problem?1/3 of U.S. gas reserves contain CO2 and/or N2
1
Wellhead natural gas may contain acid gasesH2S, CO2, are corrosive to gathering/boosting and transmission lines, compressors, pneumatic instruments and distribution equipment
Acid gas removal processes have traditionally used an amine to absorb acid gasAmine regeneration strips acid gas (and absorbed methane)
CO2 (with methane) is typically vented to the atmosphere, flared, or recovered for EORH2S is typically flared or sent to sulfur recovery
1www.engelhard.com/documents/GPApaper2002.pdf

5
Typical Amine Process
Filter
Reboiler
Exchanger
Booster Pump
Stripper (DEA) Condenser
H2S to sulfur plant or flare
Reflux Pump
Heating Medium
CO2 / CH4 to atmosphere/flare/thermal oxidizer
Rich Amine
Flash Tank
Sour Gas
Sweet Gas
Contactor (Absorber)
Lean Amine
Fuel/Recycle

6
Methane Recovery - New Acid Gas Removal Technologies
GTI & Uhde Morphysorb® Process
Engelhard Molecular Gate® Process
Kvaerner Membrane Process
Primary driver is process economics, not methane emissions savings
Reduce methane venting by 50 to 100%

7
Morphysorb® Process
Flash 4
Acid GasAbsorber
Feed GasFlash 1
Flash 2
Clean Gas
Flash 3
Compression
Pump
Compression

8
Morphysorb® ProcessMorphysorb® absorbs acid gas but also absorbs some methane
Methane absorbed is 66% to 75% lower than competing solvents1
Flash vessels 1 & 2 recycled to absorber inlet to minimize methane losses
Flash vessels 3 & 4 at lower pressure to remove acid gas and regenerate Morphysorb®
1Oil and Gas Journal, July 12, 2004, p 57

9
Is Recovery Profitable?Morphysorb® can process streams with high (>10%) acid gas composition30% to 40% Morphysorb® operating cost advantage over DEA or SelexolTM 2
66% to 75% less methane absorbed than DEA or SelexolTM
About 33% less THC absorbed2
Lower solvent circulation volumesAt least 25% capital cost advantage from smaller contactor and recycles2
Flash recycles 1 & 2 recover ~80% of methane that is absorbed1
1Oil and Gas Journal, July 12, 2004, p 57, Fig. 72GTI

10
Industry Experience - Duke EnergyKwoen plant does not produce pipeline-spec gas
Separates acid gas and reinjects it in reservoirFrees gathering and processing capacity further downstream
Morphysorb® used in process unit designed for other solvent
Morphysorb® chosen for acid gas selectivity over methane
Less recycle volumes; reduced compressor horsepower

11
Adsorbs acid gas contaminants in fixed bed
Molecular sieve application selectively adsorbs acid gas molecules of smaller diameter than methane
Bed regenerated by depressuring5% to 10% of feed methane lost in “tail gas” depressuringRoute tail gas to fuel
C3+ adsorbed on binder
Methane Recovery - Molecular Gate®
CO2 Removal
CH4
CO2

12
Molecular Gate® ApplicabilityLean gas
Gas wellsCoal bed methane
Associated gasTidelands Oil Production Co.
1 MMcf/d18% to 40% CO2Water saturated
Design options for C4+ in tail gas streamHeavy hydrocarbon recovery before Molecular Gate®
Recover heavies from tail gas in absorber bedUse as fuel for process equipment
www.engelhard.com

13
Molecular Gate® CO2 Removal10 psi pressure drop
Product95% of C190% of C250% of C3
5 psia
Tail Gas5% of C110% of C250% of C3C4+CO2H2SH2O
Enriched C1
30 psia
High Pressure Feed
C1C2C3C4+CO2
H2SH2O
Pressure Swing
Adsorption
VacuumCompressor
C4+ Recovery
Dehydration

14
Industry Experience - Tidelands Molecular Gate® Unit
First commercial unit started in May 2002Process up to 10 MMcf/dSeparate recycle compressor is requiredNo glycol system is requiredHeavy HC removed with CO2Tail gas used for fuel is a key optimization: No process venting18% to 40% CO2 removed to pipeline specifications (2%)

15
Is Recovery Profitable?Molecular Gate® costs are 20% less than amine process
9 to 35 ¢ / Mcf product depending on scaleFixed-bed tail gas vent can be used as supplemental fuel
Eliminates venting from acid gas removalOther Benefits
Allows wells with high acid gas content to produce (alternative is shut-in)Can dehydrate and remove acid gas to pipeline specs in one stepLess operator attention

16
Kvaerner Membrane ProcessMembrane separation of CO2 from feed gas
Cellulose acetate spiral wound membraneHigh CO2 permeate (effluent or waste stream) exiting the membrane is vented or blended into fuel gasLow CO2 product exiting the membrane exceeds pipeline spec and is blended with feed gas Fuel Gas Spec
Pipeline Spec
Adapted from “Trimming Residue CO2 with Membrane
Technology”, 2005
MEMBRANEUNIT
Aerosol Separators
Bypass for Fuel
High CO2 Permeate
Feed Gas
Bypass for Blending
(trace lube, glycol, etc. removal)

17
Kvaerner Membrane TechnologyCO2 (and some methane) diffuse axially through the membraneHigh-CO2 permeate exits from center of tube; enriched product exits from outer annular sectionOne application for fuel gas permeate
Methane/CO2 waste stream is added with fuel gas in a ratio to keep compressor emissions in compliance
Design RequirementsUpstream separators remove contaminants which may foul membraneLine heater may be necessary
Duke Energy Field Services
18
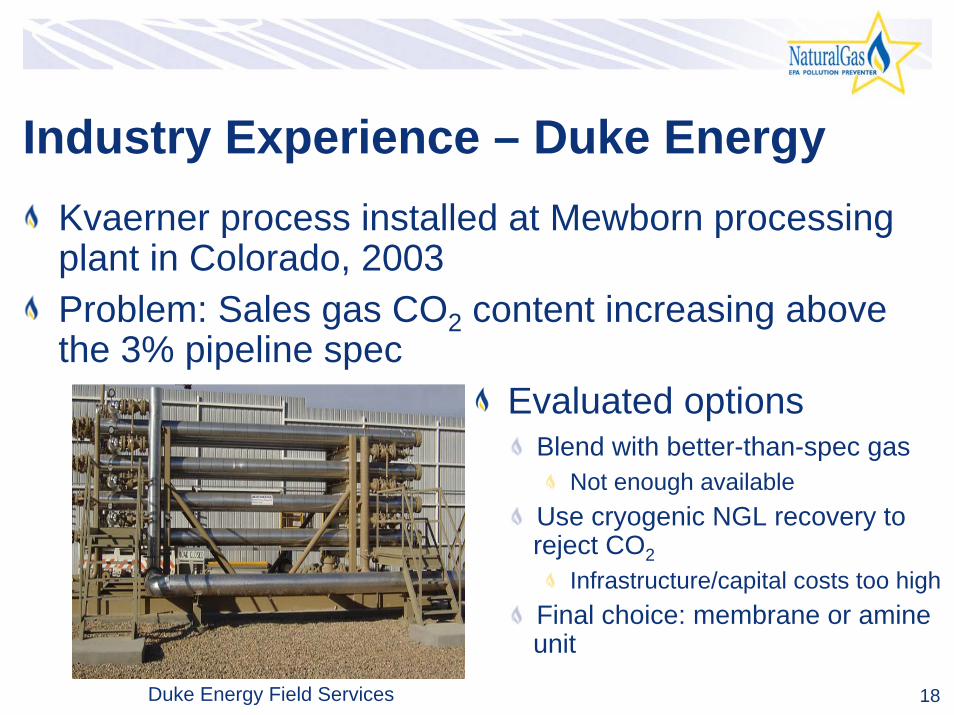
Industry Experience – Duke EnergyKvaerner process installed at Mewborn processing plant in Colorado, 2003Problem: Sales gas CO2 content increasing above the 3% pipeline spec
Evaluated optionsBlend with better-than-spec gas
Not enough availableUse cryogenic NGL recovery to reject CO2
Infrastructure/capital costs too highFinal choice: membrane or amine unit
Duke Energy Field Services

19
Industry ExperienceMembrane chosen for other advantages; zero emissions is added benefit
65% less capital cost than amine unit~10% operating cost (compared to amine)~10% operator man hours (compared to amine)1/3 footprint of amine unit
Typical Process conditionsFlow Into Membrane
Membrane Residue (Product)
Membrane Permeate
22.3 MMcf/d 2170 to 110
8352%
89%13% C2+ 9% 7%
~0%~0%
70 to 110 oF 70 to 1101.3
800 to 865 psia 553% CO2 16%84% C1 77%
~0% H2O ~0%~0% H2S ~0%
Less process upsetsLess noiseLess additional infrastructure construction

20
Is Recovery Profitable?Costs
Conventional DEA AGR would cost $4.5 to $5 million capital, $0.5million O&M per yearKvaerner Membrane process cost $1.5 to $1.7 million capital, $0.02 to $0.05 million O&M per year
Optimization of permeate streamPermeate mixed with fuel gas, $5/Mcf fuel creditOnly installed enough membranes to take feed from >3% to >2% CO2, and have an economic supplemental fuel supply for compressors
In operation for over 2 years
Offshore Middle East using NATCO membrane process on gas with 90% CO2, achieving pipeline spec quality

21
Comparison of AGR AlternativesAmine (or SelexolTM) Process
Morphysorb®Process
Molecular Gate® CO2
Kvaerner Membrane
Absorbent orAdsorbent
Water & Amine(SelexolTM)
Morpholine Derivatives
Titanium Silicate
Methane Savings 100% 66 to 75% 0% 0% or higher
Reduce Pressure to
VacuumElectricity
<100%
80%
Cellulose Acetate
Replace Membrane ~5 years
Nil
35%
<10%
RegenerationReduce
Pressure & Heat
Reduce Pressure
Primary Operating Costs
Amine (SelexolTM) &
Steam
Electricity
Capital Cost
Operating Cost
100%
100%
75%
60% to 70%

22
DiscussionIndustry experience applying these technologies and practices
Limitations on application of these technologies an practices
Actual costs and benefits