ACI 126.3R-99 Guide to Recommended Format for Concrete in Materials Property Database
ACI MATERIALS JOURNAL · TECHNICAL PAPER
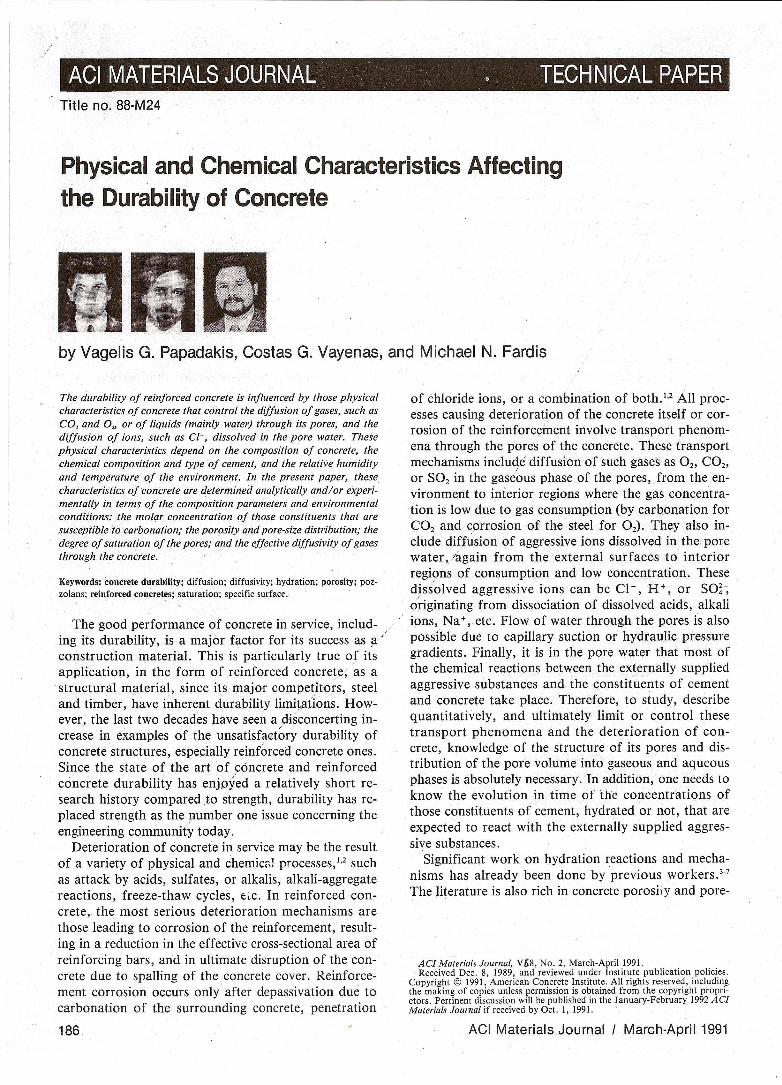
Physical,and Chemical Characteristics Affectingthe Durability of Concrete
The durability of reinforced concrete is influenced by those physicalcharacteristics of concrete that control the diffusion of gases, such asCO, and 0" or of liquids (mainly water) through its pores, and thediffusion of ions, such as Cl-, dissolved in the pore water. Thesephysical characteristics depend on the composition of concrete, thechemical composition and type of cement, and the relative humidityand temperature of the environment. In the present paper, thesecharacteristics of concrete are determined analytically and/or experi-mentally in terms of the composition parameters and environmentalconditions: the molar concentration of those constituents that aresusceptible to carbonation; the porosity and pore-size distribution; thedegree of saturation of the pores; and the effective diffusivity of gasesthrough the concrete. '
Keywords: concrete durability; diffusion; diffusivity; hydration; porosity; poz-zolans; reinforced concretes; saturation; specific surface.
The good performance of concrete in service, includ-ing its durability, is a major factor for its success as a /construction material. This is particularly true of itsapplication, in the form of reinforced concrete, as astructural material, since its major competitors, steeland timber, have inherent durability limitations. How-ever, the last two decades have seen a disconcerting in-crease in examples of the unsatisfactory durability ofconcrete structures, especially reinforced concrete ones.Since the state of the art of concrete and reinforcedconcrete durability has enjoYed a relatively short re-search history compared.to strength, durability has re-placed strength as the number one issue concerning theengineering community today.
Deterioration of concrete in service may be the resultof a variety of physical and chemicr"Iprocesses,I,2 suchas attack by acids, sulfates, or alkalis, alkali-aggregatereactions, freeze-thaw cycles, ti.c. In reinforced con-crete, the most serious deterioration mechanisms arethose leading to corrosion of the reinforcement, result-ing in a reduction in the effective cross-sectional area ofreinforcing bars, arid in ultimate disruption of the con-crete due to spalling of the concrete cover. Reinforce-ment corrosion occurs only after depassivation due tocarbonation of the surrounding concrete, penetration
186
of chloride ions, or a combination of both.I,2 All proc-esses causing deterioration of the concrete itself or cor~rosion of the reinforq:inent involve transport phenom-ena through the pores of the concrete. These transportmechanisms includ,ldiffusion of such gases as 02' CO2,or S02 in the gaseous phase of the pores, from the en~vironment to interior regions where the gas concentra-tion is low due to gas consumption (by carbonation forCO2 and cprrosion of the steel for O2), They also in-clude diffusion of aggressive ions dissolved in the porewater" /again from the external surfaces to interiorregi911sof consumption and low concentration. Thesedissolved aggressive ions can be CI-, H+, or SO~-;originating from dissocia.tion of dissolved acids, alkaliions, Na + " etc. Flow of water through the pores is alsopossible due to capillary suction or hydraulic pressuregradients. Finally, it is in the pore water that most ofthe chemical reactions between the externally suppliedaggressive substances and the constituents of cementand concrete take place. Therefore, to study, describequantitatively, and ultimately limit or control thesetransport phenomena and the deterioration of con-crete, knowledge of the structure of its pores and dis-tribution of the pore volume into gaseous and aqueousphases is absolutely necessary. In addition, one needs toknow the evolution in time of the concentrations ofthose constituents of cement, hydrated or not, that areexpected to react with the externally supplied aggres-sive substances.
Significant work on hydration reactions and mecha-nisms has already been done by previous workers. 3-7
The literature is also rich in concrete porosi' y and pore-
ACI Materials Journal, V1i8, No.2, March-April 1991.Received Dec. 8, 1989, and reviewed under Institute publication policies.
Copyright © 1991, American Concrete Institute. All rights reserved, includingthe making of copies unless permission is obtained from the copyright propri-etors. Pertinent discussion will be published in the January-February 1992ACIMaterials Journal if received by Oct. I, 1991.
Vagelis G. Papadakis is a graduate student in the Department 'of Chemical En-gineering of the University of Patras, Greece, and in the Institute of ChemicalEngineering and High Temperature Chemical Processes. He holds a Diplomain Chemical Engineering from the University of Patras and is working towarda PhD in the area of carbonation and durability of concrete.
Costas G. Vayenas is a Professor of Reaction Engineering and Catalysis in theChemical Engineering Department of the University of Patras and a researcherin the Institute of Chemical Engineering and High Temperature ChemicalProcesses. He holds a PhD in Chemical Engineering from the University ofRochester. Prior to joining the facu/ly at the University of Patras, he was As-sistant Professor at Yale and Associate Professor at M.I.T. He has authoredmany papers on catalysis, high-temperature Electrochemistry, and mathemati-cal modeling of chemical processes.
ACI member Michael N. Fardis is a Professor of Concrete Structures in theCivil Engineering Department of the University of Patras. He holds an M.Sc.and PhD in Civil Engineering from M./. T. Prior to joining the faculty at theUniversity of Patras, he was an Associate Professor at M./. T. He has authoredmany papers, mainly on analytical and numerical modeling of concrete andconcrete structures.
size distribution measurements,S.20studies of water be-havior in hardened cement,2,4,S,2I,22and measurements ofgas diffusion through the concrete pores.17,23-25What islacking, though, are quantitative predictive models forthese physical and chemical characteristics, in terms ofthe composition parameters and environmental condi-'tions.
, RESEARCH SIGNIFICANCEQuantitative prediction and control of the evolution
in time of physicochemical processes preceding corro-sion of reinforcing bars, such as the reduction in alka-linity due to carbonation of concrete or the diffusion ofCl- in the pore water, and processes that take place si-multaneously with· corrosion, such as diffusion of O2through the pores, require knowledge of some physical
'characteristics of concrete, such as porosity, pore-sizedistribution, degree of saturation of the pores, and gasdiffusivity, as well as the amount of carbonatable ma-terials in concrete, etc. Computed and measured valuesof these characteristics or parameters are presented inthis paper for portland cement in terms of the compo-sition parameters of concrete, chemical composition ofcement, and environmental parameters, such as ambi-ent relative humidity. In a separate paper, the effect ofpozzolans on these characteristics or parameters will bediscussed.
MOLAR CONCENTRATION OF CARBONATABLECONSTITUENTS OF HARDENED CEMENT
PASTEThe major constituents of hardened cement paste
, subject to carbonation in i.he presence of moisture areCa(oH)2and calciuTJlsilicate hydrate (CSH). Prior totheir hydration, calcium silicates C3S and C2S are alsosubject to carbonation. For the other hydrated or un-hydrated constituents of hardened cement paste, car-bonation seems to be limited to a surface zone, withoutaffecting the bulk of the crystallites.5 Therefore, it is themolar concentrations of Ca(oH)2, CSH, and the yetunhydrated amounts of C3Sand C2Sthat are of interestas far as carbonation is concerned. These constituents
of cement are produced or consumed by the chemicalreactions of hydration. Using the notation of cementtechnology, * the hydration reactions' of ordinary port-land cement (oPC) in the presence of gypsum are3-7
TH,C3S
2C3S + 6H - C3S2H3+ 3CH
TH,C2S
2C2S + 4H - C3S2H3+ CH
TH,C4AF
+ 18H - CsAFS2H24
TH,C3A
C3A + CSH2 + lOH - C4ASHI2
TH,C4AF
C4AF + 4CH + 22H - CsAFH26 ' (5)
TH,C3'A
C3A + CH + 12H - CAHl3 (6)
The previous hydration reactions take place at molarrates per unit concrete volume TH,; (i = C3S, C2S, C4AF,C3A) in mollm3 . sec. The presence of gypsum has onlya minor effect on the rates of hydration of C3A andC4AF, so that Reactions (3) and (4) can be taken tohave the same rate as Reactions (5) and (6), respec-tively,6 i.e., TH,C4AF and TH,C3A' Expressions for the .ratesTH,ican be obtained from measurements of the fractionF;(t) of compound i, which has been hydrated at time t(in sec) after mixing. Such measurements have beenpresented in the past by Brunauer and Copeland3 andmore recently by Taylor, 7 and point to expression of theform
in which [i] and [i]o are the current and initial (at t =
0) molar concentrations of compound i, respectively (inmollm3). Fitted values of the exponents ni and the co-efficients kH,i are listed in Table 1, and the resultingF;(t)-curves are compared in Fig. 1 to' measured values.Table I and Fig. 1 can be considered to apply to OPCof normal fineness, corresponding to Type I cement.
In the presence of gypsum, Reactions (3) and (4)dominate over Reactions (5) and (E),s·(. so Reactions (5)and (6) take place only after all the gypsum has beenconsumed. This happens at a time t*, which can be de-termined from the condition
'Cement technology notation: C:CaO, S:SiO" A:Al,O" F:Fe,O" H:H,O,'S:SO" <;:CO" and therefore: C,S:3CaO-2SiO" CH:Ca(OH)" C,S,H, (or CSH):3CaO-2SiO,-3H,O, C'SH,: CaSO,-2H,O, etc.

O. 8ClWf-<!0::: 0.6Cl>-I
Z0H O. 4f-U<!0:::l.L..
0.2
POWER-LAWAPPROXIMATIONEXPER. POINTS(!) C3S t:" C2S~ C3A ¢ C4AF
0.0O. 1 10 100
TIME (doy 5)
Fig. I-Speed of hydration of the four major constitu-ents of OPC, filled points by Brunauer and Copeland3;
open points by Taylor7
Table 1-Parameters of major constituents ofordinary portland cement
Compound C,S C,S C,AF C,A CSH,Exponent n" Eq. (8) 2.65 3.10 3.81 2.41 -
.Coefficient kH, (20 C) x 10' 1.17 0.16 1.00 2.46 -(s-'), Eq. (8)' .
Molar weight MW, x 10', 228.30 172.22 485;96 270.18 172.17kglIp.ol
Hydration reaction
!:>.Vx 10', m'/mol
(6)
149.82
The value of t* can be found numerically, from an ex-ponential in t*equation, which results from substitu-tion of FC3A(t*) and FC.jAF(t*) from Eq. (8) in terms oft*. The second term inEq. (9a) can be considered neg-ligible, because SO~- ions react preferentially with C3Arather than with C4AF,6so the value of t* can be com-puted in approximation
The molar concentrations of the carbonatable con-stituents at time t after mixing are, therefore, equal to
3 1= 2[C3S]oFc3S+ 2 [CzS]o Fczs
- 2[C4AF]oFc4AF, 0 ::;; t ::;;t* (lOa)Q
~2. 0 0.4n
E ope wlc=0.65'-~ 1. 5
>-O. 3 I-
HV1
n 0'0 a::
0
x 1. 0 O. 2 n.z w0 I-
H Wa::I- u<i
a:: 0.5 0.16I- uZwUz8 0.0 0.0
O. 1 10 100 1000TIME (days)
Fig. 2-Evolution with age of the molar concentrationof the carbonatable constituents and porosity of OPC.
3 1[Ca(OH)z] = 2[C3S]oFc3S+ 2 [CzS]oFczs
- 4[C4AF]oFc4AF- [C3A]0FC3A+ [CSHz]o, t ~ t*(lOb)
The initial molar concentrations of compound i (i =
C3S, CzS, C4AF, C3A) and of gypsum, denoted by [/10and [CSHz]o, respectively, in OPC concrete can becomputed from: a) the weight fraction of clinker andgypsum in OPC, denoted by mc/ and mgy = 1-mc/, re-spectively; b) the weight fraction of compound i in theclinker mi which can be calculated from oxide analy-sis;4 c) the mix proportions of concrete, i.e., the water-cement ratio wle, the aggregate-cement ratio ale, andthe volume fraction of concrete in entrapped or en-trained air Eair
mimc/Pc (l - Eair)[110 = ----------
(w Pc a Pc)MW; 1 +--+~-c Pw c Pa
[CSHz]o =
(w Pc a Pc)MW 1 +--+--
gy C Pw C Pa
in which Pc' Pw, and Pa (in kg/m3) are the densities ofcement, water, and aggregates, respectively, and MWi,
MWgy are the molar weights of compound i and CSH2,
respectively, given in Table 1 in kg/mol.Fig. 2 shows the evolution in time of the molar con-
centrations of the carbonatable constituents of con-
ACI Materials,Journal I March-April 1991
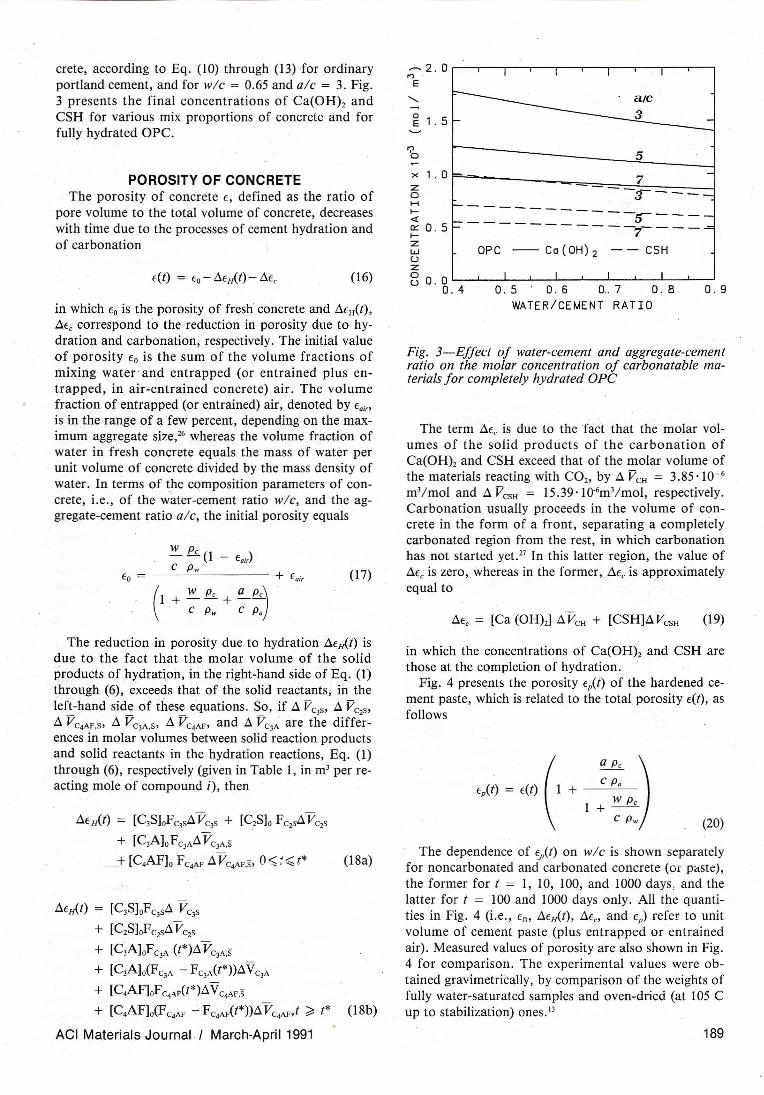
crete, according to Eq. (10) through (13) for ordinaryportland cement, and for wle = 0.65 and a/c = 3. Fig.3 presents the final concentrations of Ca(OH)2 andCSH for various mix proportions of concrete and forfully hydrated OPC.
POROSITY OF CONCRETEThe porosity of concrete E, defined as the ratio of
pore volume to the total volume of concrete, decreaseswith time due to the processes of cement hydration andof carbonation
in which Eois the porosity of fresh concrete and .:lEH(t),.:lEccorrespond to the reduction in porosity due to hy-dration and carbonation, respectively. The initial valueof porosity Eois the sum of the volume fractions ofmixing water and entrapped (or entrained plus en-trapped, in air-entrained concrete) air. The volumefraction of entrapped (or entrained) air, denoted by EOir>
is in the range of a few percent, depending on the max-imum aggregate size,26whereas the volume fraction ofwater in fresh concrete equals the mass of water perunit volume of concrete divided by the mass density ofwater. In terms of the composition parameters of con-crete, i.e., of the ~ater-cement ratio wle, and the ag-gregate~cement ratio ale, the initial porosity equals
w Pc )- ~(1 - EoirC Pw
(w Pc a, Pc)1 +-- +-:--c Pw c Po
The reduction in porosity due to hydration .:lEIAt) isdue to the fact that the molar volume of the solidproducts of hydration, in the right-hand side of Eq. (1)through (6), exceeds that of the solid reactants, in thefeft-hand side of these equations. So, if '.:lVC3S, .:lVC2S,.:l VC4AF,S, .:l VC3A,S, .:lVC4AF, and .:lVC3A are the differ-ences in molar volumes between solid reaction productsand solid reactants in the hydration reactions, Eq. (1)through (6), respectively (given in Table 1, in m3per re-acting mole of compound i), then
.:lEIAt) = [C3S]oFc3S.:lVC3S + [C2S]0FC2S.:lVC2S
+ [C3A]oFc3A.:lVC3A,S
.+ [C4AF]oFc4AFLiVC4AF,S, O,.:;;::(t* (18a)
.:lEIAt) = [C3S]oFc3S.:lVC3S+ [C2S]oFc2S.:lVC2S
+ [C3A]oFc3A(t*).:lVC3A,S
+ [C3A]0(FC3A- FC3A(t*».:lVC3A+ [C4AF]oFC4AF(t*).:lVC4AF,S
+ [C4AF]0(FC4AF-FC4AF(t*».:lVC4AF,t ~ t* (18h)
ACI Materials Journal / March.April 1991
~ 2. 0,.,E
" ale3
x 1.0zoH~<l:0::0.5~zW(J
z8 0.0
0.4
5
7--- -3------- ------0----
---------7----OPC --' Co (OH) 2 - - CSH
O. 5 ' O. 6 0.. 7 O. 8
WATER/CEMENT RATIO
Fig. 3-Effect of water-cemel1:tand aggregate-cementratio on the molar concentratIOn of carbonatable ma-terials for completely hydrated ope
The term .:lEeis due to the fact that the molar vol-umes of the solid products of the carbonation ofCa(OH)2 and CSH exceed that of the ~olar volume ofthe materials reacting with CO2, by .:lVCH = 3.85 '10-6m3/mol and .:lVCSH = 15.39·lQ'6m3/mol, respectively.Carbonation usually proceeds in the volume of Con-crete in the form of a front, separating a completelycarbonated region from the rest, in which carbonationhas not started yet.27In this latter region, the value of.:lEcis zero, whereas in the former, .:lEeis approximatelyequal to
in which the concentrations of Ca(OH)2 and CSH arethose at the completion of hydration.
Fig. 4 presents the porosity Eit) of the hardened ce-ment paste, which is related to the total porosity E(t), asfollows
( ~), c PEp(t) = E(t) 1 + a
W Pc, 1 +--c Pw (20)
The dependence of ~(t) on wle is shown separatelyfor noncarbonated and carbonated concrete (Of paste),the former for t = 1, 10, 100, and 1000 days, and thelatter for t = 100 and 1000 days only. All the quanti- 'ties in Fig. 4 (i.e., Eo, .:lEIAt), .:lEe>and Ep) refer to unitvolume of cement paste (plus entrapped or entrainedair). Measured values of porosity are also shown in Fig.4 for comparison. The experimental values were ob-tained gravimetrically, by comparison of the weights offully water-saturated samples and oven-dried (at 105 Cup to stabilization) ones.I3

>-~ 0.6eno0:::oa.. 0.5wf-en4:a..f- 0.4zw::EwU
---(m)NON-CAR80N.---(.)CAR80NATED
0.5 0.6 0.7 0.8WATER/CEMENT RATIO
Fig. 4-Dependence of cement paste porosity on ageand water-cement ratio and comparison with measure-ments at t = 100 days
OPC NON-CARBON. o/c-3A2.0
-- w/c-O. 501.5 -----. w/c-O. 65."- ....... w/c-O. 801.0
0.5 (a)'"
0.001 O. 01 0.1 10 100
OPC w/c-0.502.0
-- o/c-3A NON-CARB.1.5 -----. o/c-O NON-CARB.."- ....... o/c-O CARBON.1.0
0.5 (b)
0.001 0.01 0.1 1 10 100PORE DIAMETER (~m)
Fig. 5-Pore-size distribution in fully hydrated hard-ened cement paste or mortar; (a) Effect ofw/c; (b) Ef-fect of carbonation and aggregates
PORE·SIZE DISTRIBUTION AND SPECIFICSURFACE AREA OF PORES
. The pore-size distribution (PSD) of concrete orhardened cement paste affect~ its effective diffusivityand controls the degree of saturation of the pores (forgiven relative humidity) and their specific surface area.Two methods mainly used today in research and by in-dustry for the determination of the pore-size distribu-tion of porous solids are: mercury porosimetry andnitrogen desorption according to the BET theory. Al-though some cement chemists11,14maintain that one ofthese methods is applicable to hardened cement poaste190
Table 2-Composition and physical properties ofportland cement-Gradation and physicalproperties of aggregates
CaO
65.28OPC: 94.9 percent clinker, 5.1 percent gypsum
Specific gravity: 3.16; fineness, according to Blaine test, 300m'/kg
Particle size l-Yz in. Yz-Ys in. Ys in.-4 4-8 8-16 16-30 30-50 50-
Aggregate A - - - - 20.5 40.4 19.0 20.1
Aggregate B 28.5 7.5 18.0 13.0 10.5 7.5 6.0 9.0
for the entire spectrum of pore sizes, it is generally ac-.cepted today that for hardened cement paste, mercuryporosimetry is not reliable for diameters below 60 to100 A, whereas nitrogen desorption is applicable forpore diameters only up to 300 to 500 A. Moreover, thetotal surface area and the total pore volume of hard-ened cement paste, measured by either mercury porosi-metry or nitrogen desorption, are lower than the onesmeasured gravimetrically on dried samples for porevolume or by X-ray scattering for surface area. 10,19Thisresult, which has been verified by the porosimetrymeasurements of the present study, has been inter-preted as a strong indication that the pores of hardenedcement paste with size below 10 to 15 A are not acces-sible, not only to mercury but to nitrogen as well. Thisis not very surprising, since a similar behavior has beenreported in the literature for coal, where pores below 10to 15 A have been found to be accessible to CO2 but notto nitrogen.
The PSD of concrete has been determined herein bya combination of nitrogen desorption for small porediameters with mercury porosimetry for large ones. Themeasurements from these two techniques were com-bined so that the same PSD was obtained on the aver-age over their common range of application, i.e., be-tween - 60 and - 500 A.
Some measured pore-size distributions are presentedherein in the form of the probability density function fdof the volume of pores with diameter equal to d (inj1.m), which is defined so that the fraction of the totalporosity of concrete, due to pores with the logarithm ofd ranging from logd to logd + d(logd) , is equal to fd(logd) . d(logd). Pore-size distributions shown in Fig. 5refer to essentially fully hydrated cement. The chemicalcomposition and physical properties of c,;;ment are pre-sented in Table 2. The aggregate used was a gradedsand of Type A gradation (given in Tabk 2). Fig. 5(a)describes the effect of the water-cement ratio on thePSD of noncarbonated OPC mortar, with an aggre-gate-cement ratio equal to 3, whereas Fig. 5(b) showsthe effect of carbonation on the PSD of hardened OPCpaste with a water-cement ratio equal to 0.50. As is wellknown from previous studies,II,14,18the effect of reduc-
ACI Materials Journal I March-April 1991
ing the wlc is to shift the PSD to the left. As shown inFig. 5(a), the shifting refers only to the macropores. Onthe contrary, the effect of carbonation is to shift thePSD to the left, over the entire range of pore diame-ters. Fig. 5(b) shows also the effect of the presence ofaggregates.
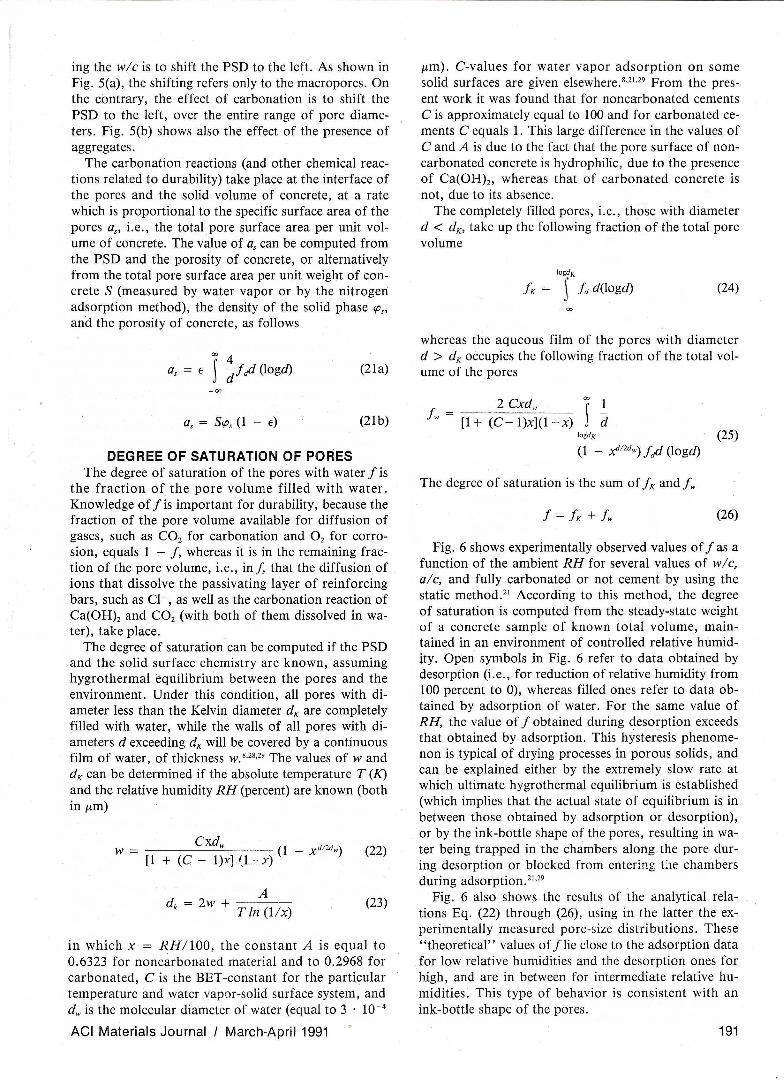
The carbonation reactions (and other chemical reac-tions related to durability) take place at the interface ofthe pores and the solid volume of concrete, at a ratewhich is proportional to the specific surface area of thepores as> i.e., the total pore ·surface area per unit voleume of concrete. The value of as can be computed fromthe PSD and the porosity of concrete, or alternativelyfrom the total pore surface area per unit weight of con-crete S (measured by water vapor or by the nitrogenadsorption method), the density of the solid phase ips>
and the porosity of concrete, as follows
DEGREE OF SATURATION OF PORESThe degree of saturation of the pores with water f is
the fraction of the pore volume filled with water.Knowledge of fis important for durability, because thefraction of the pore volume available for diffusion ofgases, such as CO2 for carbonation and O2 for corro-sion, equals 1 - f, whereas it is in the remaining frac-tion of the pore volume, i.e., in 1, that the diffusion ofions that dissolve the passivating layer of reinforcingbars, such as Cl-, as well as the carbonation reaction ofCa(OH)2 and CO2 (with both of them dissolved in wa-ter), take place.
The degree of saturation can be computed if the PSDand the solid surface chemistry are known, assuminghygrothermal equilibrium between the pores and theenvironment. Under this condition, all pores with di-ameter less than the Kelvin diameter dK are completelyfilled with water, while the walls of all pores with di-ameters d exceeding dK will be covered by a continuousfilm of water, of thickness W.8,28,29 The values of wanddK can be determined if the absolute temperature T (K)and the relative humidity RH (percent) are known (bothin ~m)
Cxdw . (1 _ Xdl2dw)
[1 + (C - .1)\"] (I·· Y)
Adk = 2w +
Tin (l/x)
in which x = RH 1100, the constant A is equal to0.6323 for noncarbonated material and to 0.2968 forcarbonated, C is the BET-constant for the particulartemperature and water vapor-solid surface system, anddw is the molecular diameter of water (equal to 3 . 10-4
ACI Materials Journal I March-April 1991
~m). C-values for water vapor adsorption on somesolid surfaces are given elsewhere.8,21,29 From the pres-ent work it was found that for noncarbonated cementsC is approximately equal to 100 and for carbonated ce-ments C equals 1. This large difference in the values ofC and A is due to the fact that the pore surface of non-carbonated concrete is hydrophilic, due to the presenceof Ca(OH)2, whereas that of carbonated concrete isnot, due to its absence. .
The completely filled pores, i.e., those with diameterd < dK, take up the following fraction of the total porevolume
logdK
fK = i fd d(logd)
whereas the aqueous film of the pores with diameterd > dK occupies the following fraction of the total vol-ume of the pores
1, -_ 2 Cxdw r 1w [1+ (C~I)xl(1-x) J d
Fig. 6 shows experimentally observed values of f as afunction of the ambient RH for several values of wle,ale, and fully carbonated or not cement by using thestatic method.21 According to this method, the degreeof saturation is computed from the steady-state weightof a concrete sample of known total volume, main-tained in an environment of controlled relative humid-ity. Open symbols in Fig. 6 refer to data obtained bydesorption (i.e., for reduction of relative humidity from100 percent to 0), whereas filled ones refer to data ob-tained by adsorption of water. For the same value ofRH, the value of f obtained during desorption exceedsthat obtained by adsorption. This hysteresis phenome-non is typical of drying processes in porous solids, andcan be explained either by the extremely slow rate atwhich ultimate hygrothermal equilibrium is established(which implies that the actual state of equilibrium is inbetween those obtained by adsorption or desorption),or by the ink-bottle shape of the pores, resulting in wa-ter being trapped in the chambers along the pore dur-ing desorption or blocked from entering tile chambersduring adsorption.21,29
Fig. 6 also shows the results of the analytical rela-tions Eq. (22) through (26), using in the latter the ex-perimentally measured pore-size distributions. These"theoretical" values of flie close to the adsorption datafor low relative humidities and the desorption ones forhigh, and are in between for intermediate relative hu-midities. This type of behavior is consistent with anink-bottle shape of the pores.

zoHI- .<{tr:;:)O. 6l-e:(tIl
tIl
~ 0.4oa..l1..oILlILltr:t:lILlo o. a
20
zoHI-<{tr:;:) 0.6l-e:(tIl
tIl
~ 0.4oa..l1..oILlILltr:t:lILlo o. a
20
" ," ," I¢ I
I I
" I" /" 1.1I I,'/rg' / 4...,/ /~
/1/1 /
/ / l!JI'/.1 /'1~ I!l,?~ A
I!l ,,/'/.,f6
I!lI!l A ••..~ •A ~ ••••;::.;s.--
zot-tI-<{tr:;:) 0.6I-<{tIl
tIl
~ 0.4oa..l1..oILlILltr:t:lILl
o 0.020
zot-tI-<{tr:;:) 0.6l-e:(tIl
tIl
~ 0.4oa..l1..oILlILltr:t:lILlo o. a
20
0.503A3A
3A
C ~C I!lC A
0.50 JA N ~0.50 0 N I!l0.65
0.80
40 60 80 100RELATIVE HUMIDITY (70)
0.65 JA0.65 J80.65 580.65 78
N ~N I!lN A
N 0
40 60 80RELATIVE HUMIDITY (70)
40 60 80RELATIVE HUMIDITY (70)
0.65 JA0.65 JA
N ~C I!l
40 60 80RELAT IVE HUMIDI TY (70)
Fig. 6-Effect of relative humidity on degree of saturation of the pores: (a) effect of w/c; (b) effect of alc and ag-gregates gradation; (c) effect of aggregates' presence; (d) effect of carbonation (C = carbonated, N = noncarbon-ated)
The dependence of f on the water-cement ratio isshown in Fig. 6(a). For the same value of RH, f de-creases as the water-cement ratio increases, due to thereduction of the proportion of small-diameter pores inthe PSD. Pig seJ) and (c) show that the aggregate-ce-ment ratio and the aggregate gradation have a negligi-ble effect on f (as shown in Table 2, aggregate A was agraded sand, and Aggregate B a mixture of sand andgravel). "i'his is due to the fact that the presence andgradation of aggregates affect very little the proportionand the sizes of small-diameter pores. No theoreticallyobtained values of f are shown in Fig. 6(b) for aggre-gate-cement ratios greater than 3.0 because, for suchratios, reliable measurements of the PSD by mercury
porosimetry and by the BET technique were difficult toobtain. In the same figure, the contributions of fK andfw to the total value of f are separated. Finally, Fig. 6(d)shows that, although carbonation increases the relativeproportion of small-diar.let~r pores, it causes a reduc-tion in the value of f. This reduction is due to thechemistry of· the pOi'e surface, which corresponds tolower values of A and C in Eq. (23) and (25) and,hence, to less water in the pores of concrete after car-bonation.
EFFECTIVE GAS DIFFUSIVITY OF CONCRETEThe molecules of a gas A, such as CO2, O2 or water
vapor, move within a medium such as air from regions
ACI Materials Journal/March-April 1991
where the concentration (and hence the partial pres-sure) of gas A is high to those where it is low. Thistransport mechanism of gases, called diffusion, followsFick's first law
d[A]-D-
A dx
in which NA is the rate of transfer of gas A (in moles ofA per sec, per m2 of the medium normal to the direc-tion of the flux), d[A]/dx is the concentration gradientof A (in moles of A per m, per m3 of the medium), andDA is the diffusion coefficient or diffusivity of A withinthe medium in question (in m2/sec). In porous media,like concrete, diffusion of gases essentially takes placeonly within the gaseous phase of the pores. Neverthe-less, .it is more convenient to use in Eq. (27) "effec-tive" values of NA and DA, which refer to the totalcross-sectional area of the porous medium normal tothe direction of the flux and not just to that of the gas-eous phase of the pores. The subscript e is used to de-note these effective values, so the effective diffusivity ofgas A is denoted by De.A-
Diffusivity should not be confused with permeabil-ity, which is the coeficient KA in Darcy's law consid-ered to govern the convective flow of a fluid (gas orliquid) A through a porous medium, due to a gradientin total pressure dP / dx and not in partial pressure, thelatter being proportional to d[A]/dx in Eq. (27). Withthe exception of concrete structures containing liquidsor gases under pressure, total pressure gradients arevery uncommon in concrete structures, so the flow ofgases or water through the pores of concrete is not themost important transport mechanism for the sub-stances affecting durability (capillary flow due to cap-illary suction, which may serve as a transport mecha-nism for ions or others substances, is not consideredherein, as it is a transient phenomenon, contributing tothe establishment of the hygrothermal equilibrium inthe pores assumed in this work). The dominant trans-port mechanism is diffusion of molecules or ions in thegas~ous or aqueous phase of the pores, according toEq. (27).
From the point of view of durability of reinforcedconcrete, we are interested in the diffusion of CO2 andO2 through the gas phase of the pores, as it is the for-mer that carbonates the Ca(OH)2 of the hardened ce-ment paste, therefore reducing the alkalinity of con-crete, and ii is the latter that oxidizes the already de-passiv::lted (because ofthe drop in alkalinity or chloridepenetration or both) reinforcing bars. The effectivediffusivity of a gas A, De•A is inversely proportional tothe square root of its molar weight MWA since, in con-crete Knudsen diffusion controls,30 as the mean freepath A of gases is of the same order as the pore diame-ter. So, the effective diffusivity of a gas B, De•B can beobtained from that of A by multiplying it by (MWA/
MWB) v, . This concept can be applied to find the effec-tive diffusivity of CO2, De,co2 from that of N2, which is
THERMAL
CONDUCTIVITY
DE TECTOR
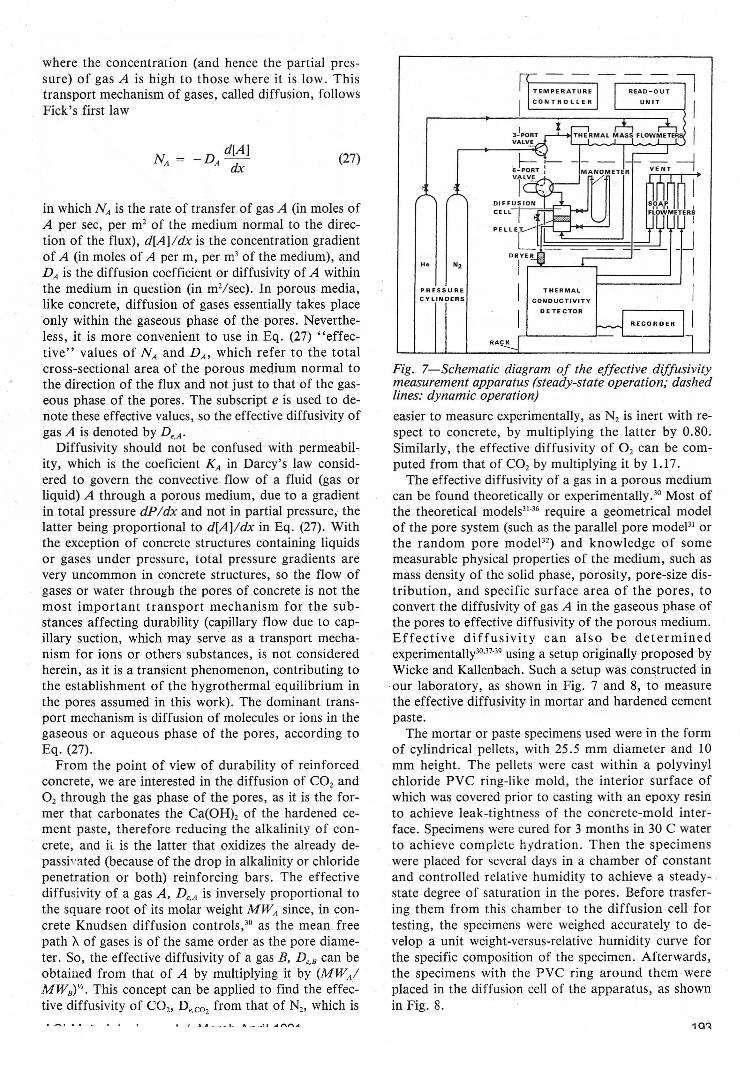
Fig. 7-Schematic diagram of the effective diffusivitymeasurement apparatus (steady-state operation; dashedlines: dynamic operation)easier to measure experimentally, as N2 is inert with re-spect to concrete, by multiplying the latter by 0.80.Similarly, the effective diffusivity of O2 can be com-puted from that of CO2 by multiplying it by 1.17.
The effective diffusivity of a gas in a porous mediumcan be found theoretically or experimentally. 30Most ofthe theoretical models31.36require a geometrical modelof the pore system (such as the parallel pore modePI orthe random pore modeP2) and knowledge of somemeasurable physical properties of the medium, such asmass density of the solid phase, porosity, pore-size dis-tribution, and specific surface area of the pores, toconvert the diffusivity of gas A in the gaseous phase ofthe pores to effective diffusivity of the porous medium.Effective diffusivity can also be determinedexperimentallyJ°,37.39 using a setup originally proposed byWicke and Kallenbach. Such a setup was con~tructed inour laboratory, as shown in Fig. 7 and 8, to measurethe effective diffusivity in mortar and hardened cementpaste.
The mortar or paste specimens used were in the formof cylindrical pellets, with 25.5 mm diameter and 10mm height. The pellets were cast within a polyvinylchloride PVC ring-like mold, the interior surface ofwhich was covered prior to casting with an epoxy resinto achieve leak-tightness of the concrete-mold inter-face. Specimens were cured for 3 months in 30 C waterto achieve complete hydration. Then the specimenswere placed for <;everal days in a chamber of constantand controlled relative humidity to achieve a steady-state degree of saturation in the pores. Before trasfer-ing them from this chamber to the diffusion cell fortesting, the specimens were weighed accurately to de-velop a unit weight-versus-relative humidity curve forthe specific composition of the specimen. Afterwards,the specimens with the PVC ring around them wereplaced in the diffusion cell of the apparatus, as shownin Fig. 8.

As shown in Fig. 7 and 8, N2 and He gases flowthrough· the upper and lower chamber of the cell, re-spectively. The flow rates are held constant during thetest by means of thermal mass flowmeter controllers.To eliminate convective tra~sport through the pellet,the pressure is maintained the same in both chambersby means of a needle valve in the upper chamber outletand a manometer interposed between the two cham-
UPPER ~FLOW INLET
TO-MANOMETER
TOMANOMETER
OWER FLOWI~LET2 6 ----..j ,I
344678
bers. After steady-state is achieved, the molar fractionYN2 of N2 in the helium stream is measured by means ofa thermal conductivity detector. Then the effective dif-fusivity of the N2 that diffuses from the upper streamto the lower can be computed from the relation
in which F1 is the flow rate of helium through the lowerchamber (m]/sec), s is the cross-sectional area of thepellet (m2), and 1 is its length (m). After removal fromthe cell, the specimen was weighed again, and its weightwas compared to that before testing, to detect anychange in its water content. If such a change wasfound, the unit weight-versus-relative humidity curvedeveloped from the weighing operation prior to testingfor this particular specimen composition was used todetermine the ambient relative humidity correspondingto the average degree of saturation of the specimenduring testing.
Effective CO2 diffusivity values, computed from theones measured for N2, are shown as data points in Fig.9 as a function of relative humidity and concrete com-position parameters. Fig. 9(a) shows that an increase inthe value of water-cement ratio increases drastically thevalue of diffusivity, as it increases porosity and themean pore diameter. Fig. 9(b) presents the effect of theabsence of aggregates (open circles) and carbonation(open squares) on the value of the diffusivity coeffi-cient. The data presented, as well as experimental re-sults by others,17,25show that there is essentially no dif-ference in diffusivity between concrete (filled circles)
\ w/e ale €p Exp, Eq.(29a) w/e ale €p Exp. Eq.(29a)r" \ .
0.50 3A C .23 ---G'I \ • G'I 0.50 0 C .23 (!)...•..•.. 10 \...•..•.. 10
N \ 0.65 3A C .35 • N 0.50 3A C .23 •E \ • E\ \
110 0.80 3A C .44 • 110 \ 0.65 3A C .35 •0 \ 0 't!:J\8 • \ 8 • 0.65 3A N .39 l!lx x \>- , \ >- , ,,, , ,f- , f-
,, ,I-t ,, ,
I-t,, ,
> ,, , > ,, ,1-1 6 ,, .' 1-1 6 ,, ,Vl , , Vl ,, , ,~ ,, , ~ ,,u.. , u.. , ,, ,
(!) , ,u.. , u.. ,, , , ,I-t ,, , 1-1 ,,0 • -, 0 • ,
4 • , 4 • (!k ,w '~,
,.w 'EJ ,> , I, > , ,,
I-t ,, 1-1, ,, , ,
f- . ,, f-,,
t" '"',I!J,u
(a)u ' ,
(b)w 2 w 211I'- ..•..•......
u.. " , u..'{I' "u.. •..",~ "~ u.. 11", _
w w ' ::-,~-i.,OPC ", ..' OPC""", ...•..
a a40 50 60 70 80 90 40 50 60 70 80 90RELATIVE HUMIDITY ( 70) RELATIVE HUMIDITY ( 70)
Fig. 9-Dependence of effective diffusivity of CO2)n concrete on relative humidity, water-cement ratio, presence ofaggregates and carbonation (C = carbonated, N = noncarbonated)
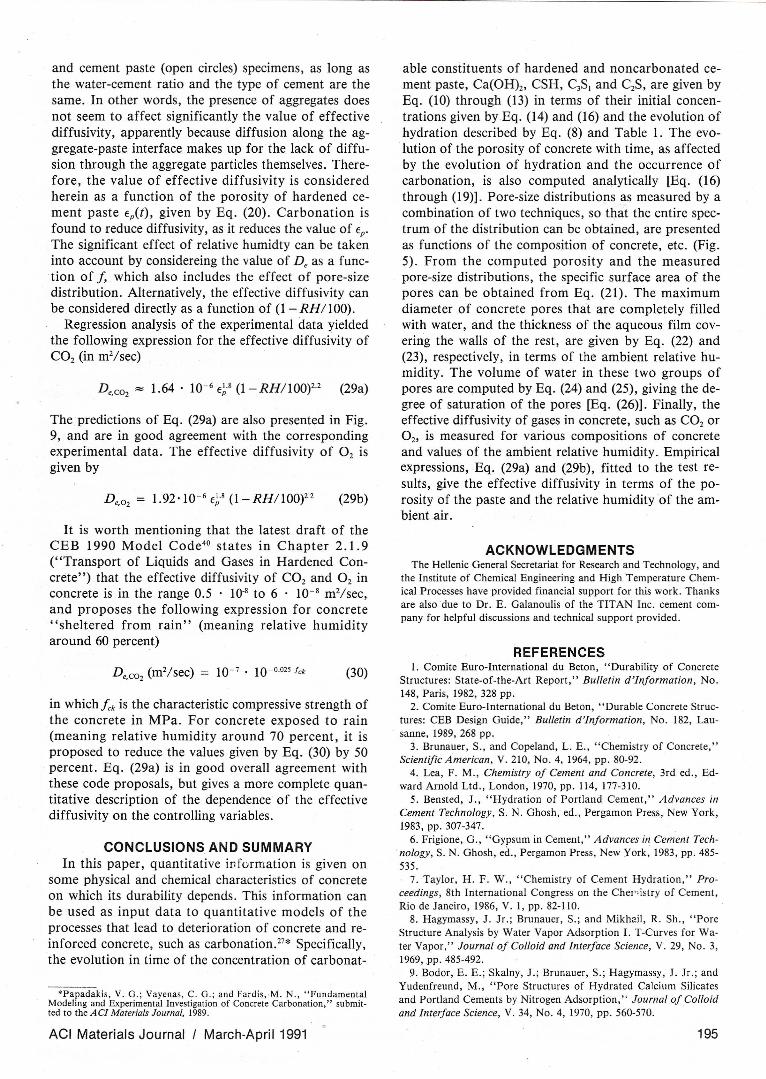
and cement paste (open circles) specimens, as long asthe water-cement ratio and the type of cement are thesame. In other words, the presence of aggregates doesnot seem to affect significantly the value of effectivediffusivity, apparently because diffusion along the ag-gregate-paste interface makes up for the lack of diffu-sion through the aggregate particles themselves. There-fore, the value of effective diffusivity is consideredherein as a function of the porosity of hardened ce-ment paste €p(t), given by Eq. (20). Carbonation isfound to reduce diffusivity, as it reduces the value of €p.
The significant effect of relative humidty can be takeninto account by considereing the value of De as a func-tion of f, which also includes the effect of pore-sizedistribution. Alternatively, the effective diffusivity canbe considered directly as a function of (1 - RH /100).
Regression analysis of the experimental data yieldedthe following expression for the effective diffusivity ofCO2 (in m2/sec)
The predictions of Eq. (29a) are also presented in Fig.9, and are in good agreement with the correspondingexperimental data. The effective diffusivity of O2 isgiven by
It is worth mentioning that the latest draft of theCEB 1990 Model Code40 states in Chapter 2.1.9("Transport of Liquids and Gases in Hardened Con-crete") that the effective diffusivity of CO2 and O2 inconcrete is in the range 0.5 . 10-8 to 6 . 10-8 m2/sec,and proposes the following expression for concrete"sheltered from rain" (meaning relative humidityaround 60 percent)
in which lek is the characteristic compressive strength ofthe concrete in MPa. For concrete exposed to rain(meaning relative humidity around 70 percent, it isproposed to reduce the values given by Eq. (30) by 50percent. Eq. (29a) is in good overall agreement withthese code proposals, but gives a more complete quan-titative description of the dependence of the effectivediffusivity on the controlling variables.
CONCLUSIONS AND SUMMARYIn this paper, quantitative information is given on
some physical and chemical characteristics of concreteon which its durability depends. This information canbe used as input data to quantitative models of theprocesses that lead to deterioration of concrete and re-inforced concrete, such as carbonation.27* Specifically,the evolution in time of the concentration of carbonat-
'Papadakis, V. G.; Vayenas, t. G.; and Fardis,M. N., "FundamentalModeling and Experimental Investigation of Concrete Carbonation," submit-ted to the ACI Materials Journal, 1989.
able constituents of hardened and noncarbonated ce-ment paste, Ca(OH)2, CSH, C3S1 and C2S, are given byEq. (10) through (13) in terms of their initial concen-trations given byEq. (14) and (16) and the evolution ofhydration described by Eq. (8) and Table 1. The evo-lution of the porosity of concrete with time, as affectedby the evolution of hydration and the occurrence ofcarbonation, is also computed analytically [Eq. (16)through (19)]. Pore-size distributions as measured by acombination of two techniques, so that the entire spec-trum of the distribution can be obtained, are presentedas functions of the composition of concrete, etc. (Fig.5). From the computed porosity and the measuredpore-size distributions, the specific surface area of thepores can be obtained from Eq. (21). The maximumdiameter of concrete pores that are completely filledwith water, and the thickness of the aqueous film cov-ering the walls of the rest, are given by Eq. (22) and(23), respectively, in terms of the ambient relative hu-midity. The volume of water in these two groups ofpores are computed by Eq. (24) and (25), giving the de-gree of saturation of the pores [Eq. (26)]. Finally, theeffective diffusivity of gases in concrete, such as CO2orO2, is measured for various compositions of concreteand values of the ambient relative humidity. Empiricalexpressions, Eq. (29a) and (29b), fitted to the test re-sults, give the effective diffusivity in terms of the po-rosity of the paste and the relative humidity of the am-bientair.
ACKNOWLEDGMENTSThe Hellenic General Secretariat for Research and Technology, and
the Institute of Chemical Engineering and High 'Temperature Chem-ical Processes have provided financial support for this work. Thanksare also due to Dr. E. Galanoulis of the TITAN Inc. cement com-pany for helpful discussions and technical support provided.
REFERENCESI. Comite Euro-International du Beton, "Durability of Concrete
Structures: State-of-the-Art Report," Bulletin d'Information, No.148, Paris, 1982, 328 pp.
2. Comite Euro-International du Beton, "Durable Concrete Struc-tures: CEB Design Guide," Bulletin d'Information, No. 182, Lau-sanne, 1989, 268 pp.
3. Brunauer, S., and Copeland, L. E., "Chemistry of Concrete,"Scientific American, V. 210, No.4, 1964, pp. 80-92.
4. Lea, F. M., Chemistry of Cement and Concrete, 3rd ed., Ed-ward Arnold Ltd., London, 1970, pp. 114, 177-310.
5. Bensted, 1., "Hydration of Portland Cement," Advances inCement Technology, S. N. Ghosh, ed., Pergamon Press, New York,1983, pp. 307-347.
6. Frigione, G., "Gypsum in Cement," Advances in Cement Tech-nology, S. N. Ghosh, ed., Pergamon Press, New York, 1983, pp. 485-535.
7. Taylor, H. F. W., "Chemistry of Cement Hydration," Pro-ceedings, 8th International Congress on the Chel',istry of Cement,Rio de Janeiro, 1986, V. I, pp. 82-110.
8. Hagymassy, J. Jr.; Brunauer, S.; and Mikhail, R. Sh., "PoreStructure Analysis by Water Vapor Adsorption I. T-Curves for Wa-ter Vapor," Journal of Colloid and Interface Science, V. 29, No.3,1969,pp.485-492.
9. Bodor, E. E.; Skalny, J.; Brunauer, S.; Hagymassy, J. Jr.; andYudenfreund, M., "Pore Structures of Hydrated Calcium Silicatesand Portland Cements by Nitrogen Adsorption," JournalolColloidand Interface Science, V. 34, No.4, 1970, pp. 560-570.

10. Mikhail, Raouf Sh.; Turk, Danica H.; and Brunauer, Stephen,"Dimensions of the Average Pore, the Number of Pores, and theSurface Area of Hardened Portland Cement Paste," Cement andConcrete Research, V. 5, No.5, 1975, pp. 433-442.
II. Manmohan, D., and Mehta, P. K., "Influence of PozzolanicSlag, and Chemical Admixtures on Pore Size Distribution and Per-meability of Hardened Cement Pastes," Cement, Concrete and Ag-gregates, V. 3, No. I, 1981, pp. 63-67.
12. Feldman, R. F., "Significance of Porosity Measurements onBlended Cement Performance," Fly Ash, Silica Fume, Slag andOther Mineral By-Products in Concrete-Proceedings, ist Interna-tional Conference, SP-79, V. I, American Concrete Institute, De-troit, 1983, pp. 415-433.
13. Hansen, Torben c., "Physical Structure of Hardened CementPaste. A Classical Approach," Materials and Structures, Researchand Testing (RILEM, Paris), V~ 19, No. 114, pp. 423-436.
14. Odler, I., and Koster, H., "Investigations on the Structure ofFully Hydrated Portland Cement and Tricalcium Silicate Pastes. II.Total Porosity and Pore Size Distribution," Cement and ConcreteResearch, V. 16, No.6, Nov. 1986, pp. 893-901.
15. Litvan, G. G., and Meyer, A., "Carbonation of GranulatedBlast Furnace Slag Cement Concrete During Twenty Years of FieldExposure," Fly Ash, Silica Fume, Slag and Natural Pozzolans inConcrete-Proceedings, 2nd International Conference, SP-91, V. 2,American Concrete Institute, Detroit, 1986, pp. 1445-1462.
16. Gunter, M.; Bier, Th.; and Hilsdorf, H., "Effect of Curing andType of Cement on. the Resistance of Concrete to Freezing in DeicingSalt Solutions," Concrete Durability-Katharine and Bryant Matherinternational Conference, SP-100, V. I, American Concrete Insti-tute, Detroit, 1987, pp. 877-899.
17. Schiessl, P., "Influence of the Composition of Concrete on theCorrosion Protection of the Reinforcement," Concrete Durability-Katharine and Bryant Mather International Conference, SP-100, V.2, American Concrete Institute, Detroit, 1987, pp. 1633-1650.
18. Ying-yu, L., and Qui-dong, W., "Mechanism of Carbonationof Mortar and the Dependence of Carbonation on Pore Structure,"Concrete Durability-Katharine and Bryant Mather InternationalConference, SP-100, V. 2, American Concrete Institute, 1987, pp.1915-1943.
19. Day, Robert L., and Marsh, Bryan K., "Measurement of Po-rosity in Blended Cement Pastes," Cement and Concrete Research,V. 18, No. I, Jan. 1988, pp. 63-73.
20. Young, J. F., "Review of Pore Structure of Cement Paste andConcrete and Its Influence on Permeability," Permeability of Con-crete, SP-I08, American Concrete Institute, Detroit, 1988, pp. 1-8.
21. Keey, R. B., Drying, Principles and Practice, Pergamon Press,Oxford, 1972, pp. 19-49.
22. Bazant, Z. P., and Najjar, L. J., "Drying of Concrete as aNonlinear Diffusion Problem," Cement and Concrete Research, V.I, No.5, 1971, pp. 461-473.
23. Lawrence, C. D., "Transport of Oxygen through Concrete,"Proceedings, British Ceramic Society Meeting on Chemistry and
Chemically-Related Properties of Cement, London, 1984, pp. 277-·293.
24. Tuutti, Kyosti, "Corrosion of Steel in Concrete," CBI Forskn-ing Research, Swedish Cement and Concrete Research Institute,Stockholm, 1982, pp. 24-57.
25. Hurling, H., "Oxygen Permeability of Concrete," Proceed-ings, RILEM Seminar on the Durability of Concrete Structures un-der Normal Outdoor Exposure, RILEM, Hannover, 1984, pp. 91-101.
26. ACI Committee 2Il, "Recommended Practice for SelectingProportions for Normal and Heavyweight Concrete (ACI 211.1-77),"Manual of Concrete Practice, Part I, American Concrete Institute,Detroit, 1979, 20 pp.
27. Papadakis, V. G.; Vayenas, C. G.; and Fardis, M. N., "Reac-tion Engineering Approach to the Problem of Concrete Carbona-tion," Journal of the American Institute of Chemical Engineers(AIChE Journal), V. 35, No. 10, 1989, pp. 1639-1650.
28. Gregg, S. J., and Sing, K. S. W., Adsorption, Surface Areaand Porosity, 2nd ed., Academic Press, London, 1982, pp. 248-282.
29. Mikhail, R. Sh., Microstructure and Thermal Analysis of SolidSurfaces, John Wiley & Sons, New York, 1983, pp. 22-72.
30. Smith, J. M., Chemical Engineering Kinetics, 3rd ed., Mc-Graw-Hill, New York, 1981, pp. 450-473.
31. Wheeler, A., in Emmett, P. H., ed., Catalysis, V. II, Ch. 2,Reinhold Publishing Corporation, New York, 1955, p. 105.
32. Wakao, N., and Smith, J. M., "Diffusion in Catalyst Pellets,"Chemical Engineering Science, V. 17, 1962, pp. 825c834.
33. Johnson, M. F. L., and Stewart, W. E., "Pore Structure andGaseous Diffusion in Solid Catalysts," Journal of Catalysis, V. 4,1965, pp. 248-252.
34. Feng, C., and Stewart, W. E., "Practical Models for Isother-mal Diffusion and Flow of Gases in Porous Solids," Industrial andEngineering Chemistry Fundamentals, V. 12, No.2, 1973, pp. 143-147.
35; Carniglia, S. c., "Construction of Tortuosity Factor from Po-rosimetry," Journal of Catalysis, V. 102, 1986, pp. 401-418.
36. Burgimos, V. N., and Sotirchos, S. V., "Diffusion in PoreNetworks: Effective Medium Theory and Smooth Field Approxima-tion," Journal of the American Institute of Chemical Engineers(AIChE Journal), V. 33, No. 10, 1987, pp. 1678-1689.
37. Dogu, G., and Smith, J. M., "Dynamic Method for CatalystDiffusivities," Journal of the American Institute of Chemical Engi-neers (AIChE Journal), V. 21,No. 1, 1975, pp. 58-61.
38. Burghardt, A., and Smith, 1. M., "Dynamic Response of aSingle Catalyst Pellet," Chemical Engineering Science, V. 34, 1979,pp. 267-273.
39. Dogu, T.; Keskin, A.; Dogu, G.; and Smith, J. M., "Single-Pellet, Moment Method for Analysis of Gas-Solid Reactions," Jour-nal of the American Institute of Chemical Engineers (AIChE Jour-nal), V. 32, No.5, 1986, pp. 743-750. .
40. Comite Euro-International du Beton, "CEB-FIP Model Code1990," Bulletin d'Information, No. 195, 196, Lausanne, 1990.