SME Breakfast Seminar - Achieving Successful Reporting Projects

1
Achieving strategic benefits from business IT projects: The critical
importance of using the business case across the entire project lifetime
Frank Einhorn a
Carl Marnewick b *
Jack Meredith c
a Department of Applied Information Systems, College of Business and Economics,
University of Johannesburg, PO Box 524, Auckland Park, 2006, Johannesburg, South Africa
b Department of Applied Information Systems, College of Business and Economics,
University of Johannesburg, PO Box 524, Auckland Park, 2006, Johannesburg, South Africa
c Broyhill Distinguished Scholar and Chair in Operations, Emeritus, School of Business,
Wake Forest University, 515 Robert Ct., Hillsborough, NC 27278, USA
* Corresponding author. E-mail address: [email protected] Tel: +27-11-559-1316
2
Abstract
Business projects with an information technology component are referred to here as
‘business IT’ projects. Their success rate is found to be unsatisfactory, resulting in wasteful
expenditure running to billions of dollars annually. Literature indicates that sound business
cases, used effectively throughout the project lifetime, underpin governance and have a major
positive impact on the project success rate. However, it also suggests that business case
processes are seldom used properly.
The goal of this study is to determine the extent to which business case processes are
used in practice, and to understand the implications of the pattern that emerges.
The data analysis from a survey reveals that business case usage diminishes
significantly after approval is given to proceed, with potentially serious negative
consequences. The findings give valuable insights to management as to the required
processes and how to avoid the prevailing pitfalls and achieve the intended strategic project
benefits.
Keywords:
Project governance, business case, process group, information technology, project lifetime.

3
1 Introduction
Literature continues to indicate that the success rate of business projects with
information technology content, referred to here as ‘business IT’ projects, remains
unsatisfactory. It is known that 60 percent of such projects are either challenged or fail
outright, resulting in the wasteful expenditure of billions of dollars annually (Standish,
2014a).
Literature also indicates that the success rate can be improved through sound
governance, underpinned by a robust business case which spells out the justification for
proceeding with the project. To be effective, such governance needs to prevail throughout the
project’s ‘lifetime’, whose duration is from when the project is first considered until all
planned benefits are, or continue to be, realised. That is, the business case still needs to be
actively used, and updated, during project planning, project execution, and user
implementation. Indeed, according to Musawir, Serra, Zwikael, and Ali (2017), disciplined
governance, applied consistently across the project’s lifetime, has a major positive effect on
project and investment success.
Using a ‘process theory’ lens (Niederman, Muller, & March, 2018), it emerges that
many processes are required for effective use of the business case. From literature it is
apparent that, although senior managers recognise the need, many of the processes are
seldom followed. However, the extent of this situation is unknown, and this paper is unique
in that it is the first measurement of the use of business case processes in practice. Therefore,
the goal of the study is to contribute to project management knowledge concerning the use of
the business case by organizations and thereby improve the success rate of business IT
projects. We address this goal through research that first, determines the current usage of
business case processes, second, assesses the likely consequences of the pattern that emerges,
and third, gives insights into the changes needed to organisational practice.

4
Business IT projects, which are further explained in the literature review, differ from
other types of projects in a number of ways. They typically experience more rapid change,
which requires updates to the business case. For example, updates may be generated by
senior management, whose goals for the project often change as it progresses due to a
multitude of reasons such as: competitors’ actions, new regulations, changes in strategy, or
events regarding the progress of the project, like cost increases, technical issues, or delays.
Another issue is that the professionals who produce the project outputs, such as new software
for the organisation, are not the ones who will be using the output to produce the desired
business benefits. But these two groups tend not to communicate well, having different
backgrounds, terminology, and even cultures.
This paper reveals, through a survey, the extent to which these business case
processes are used in practice. Inferences are then made which show how, by changing some
widely-used practices, the likelihood of incurring wasteful expenditure can be reduced via
ongoing decisions informed by the business case. It also notes the need for further research
on the organisational facilitators which support the continual use of the business case
throughout the duration of the project.
The paper is structured as follows: It begins with a literature review of the business
case and its special importance in the field of IT. It explains the process theory employed in
the study and outlines the processes required. It illustrates where new and updated
information is needed to support the processes, and shows how there is a two-way flow of
information whereby processes require, but also generate, information on which to base
decisions. The literature review concludes with two research questions. This is followed by
an explanation of the research method, the survey questionnaire and the data analysis. Next,
results are presented, followed by discussion of their findings, and finally conclusions.
5
2 Literature review
2.1 Governance of business IT projects
Business IT projects are those where business benefits are achieved through the use of
IT deliverables. The following background offers perspective on their unique aspects and
success rate. Particularly in the case of business IT, the deliverables alone are insufficient and
concomitant business changes are needed to take advantage of them in order to produce the
business benefits (Coombs, 2015; Peppard, Ward, & Daniel, 2007). Therefore, from here, the
term ‘IT project’ implies a business IT project. Moreover, IT projects have two parts:
developing the IT products, and then using them to create value (Coombs, 2015; Ward,
Daniel, & Peppard, 2008). The two parts are done by IT and business staff respectively, who
often have different backgrounds and use different terminology. Nevertheless,
communication between them is essential as neither group knows all aspects of the complete
project (Sauer & Reich, 2009; Zwikael & Smyrk, 2012). IT projects are known to be
particularly difficult and surveys show that up to 20% of IT projects fail outright, with a
further 40% being challenged, resulting in considerable wasteful expenditure (Joseph,
Erasmus, & Marnewick, 2014; Standish, 2014a).
However, effective project governance, espoused by several practice guides (APM,
2006; OGC, 2009; PMI, 2016), can mitigate many of the causes of project failure. For
example, the problem of overambitious objectives mentioned by both Standish (2014b) and
Al-Ahmad et al. (2009) is addressed by several governance aspects, such as clear authority
with appropriate information for decision-making, independent review, and stakeholder
involvement (APM, 2006; PMI, 2016). Hence, sound project governance makes an important
contribution to achieving project success. Moreover, because several governance aspects
require a business case, such as including business case reviews in project plans, it is clear
that the business case underpins sound project governance (APM, 2006; OGC, 2009; PMI,

6
2016). The above conclusions are endorsed by Musawir et al. (2017) who stated that, of all
their measurement items on project governance, a business case supported by relevant and
realistic information on which to base decisions has the greatest overall effect on project
success.
2.2 The business case and the need to use it throughout the project lifetime
The purpose of a business case is to set out the rationale for a project investment,
justify it, and obtain management’s commitment and authorisation to proceed (APM, 2006;
Maes, Van Grembergen, & De Haes, 2014; PMI, 2017). It is not necessarily a formal
document and may not even be called a ‘business case’. It summarises the anticipated
benefits, both tangible and intangible, for all the stakeholders while considering alternative
options and recommending a preferred solution (APM, 2006; Krell & Matook, 2009).
Responsibility for achieving the benefits is assigned to a person termed the ‘project owner’
(Olsson, 2018; Zwikael & Meredith, 2018), indicating how each benefit will be measured
(Zwikael, Chih, & Meredith, 2018) and what process and organisational changes may be
expected. The business case also provides an overview of the scope of work, the costs, the
time frame and the risks (OGC, 2009). Last, it should offer a projection on what can be
expected for the organisation should the project not be approved or successfully executed
(OGC, 2009).
This is not the end of the use of the business case however, since it is subject to
review and ongoing viability testing throughout the project’s lifetime (Cooke-Davies, 2005;
Franken, Edwards, & Lambert, 2009; OGC, 2009; PMI, 2017). The business case not only
supports project governance from inception, through delivery and eventually to benefits
realisation, but it also supports the governance of related projects (e.g., a program or
portfolio) in all or part of an organisation where project selection and prioritisation are
needed (Kopmann, Kock, Killen, & Gemunden, 2015; Müller, Pemsel, & Shao, 2014). Thus,

7
in summary, the business case should contribute to project success and minimise the risk and
impact of failure in the following ways (Einhorn & Marnewick, 2016; Ward et al., 2008;
Zwikael et al., 2018):
o The business case contains the ongoing justification for the project. By creating and
tracking it, stakeholders get a better understanding of the benefits, costs and risks of
the project, leading to informed decisions.
o The benefits are made measurable and quantifiable, with responsibility assigned,
increasing the commitment to realising them.
o Business case reviews allow on-going optimisation of the project in response to
business and other changes, inside or outside the organisation.
o Finally, after the deliverables are live, the business case allows results to be compared
with expected benefits, thus ensuring that none are overlooked.
Research by Ward et al. (2008) shows a strong link between use of the business case
in the aforementioned ways and the achievement of project success in terms of business
value. Thus, such use of the business case can be considered ‘effective’. Use of the business
case is even effective where it leads to the project being terminated, due to the justification to
proceed no longer being valid (Royer, 2003). Projects other than IT projects may likely also
benefit from ongoing review of the business case, but are beyond the scope of this paper.
In recent years, much has been written on how to develop a compelling business case
(Keen, 2011; Messner, 2013; Ward et al., 2008). However, the incidence of failed and
challenged IT projects has diminished little over a similar period (Standish, 2014a). A
possible reason is that, while there is ample literature on how to develop a business case and
win approval, there is little guidance on how to use the business case to review the ongoing
justification for the project and to ensure that the intended benefits are in fact realised. The
latter possibility is borne out by literature which suggests that the business case is seldom
8
used to full effect. Eckartz, Daneva, Wieringa, and Van Hillegersberg (2009) find that the
business case is rarely used to manage execution of the project and the realisation of its
benefits, while Marnewick (2016) finds that project results are seldom checked against the
business case. Maes, De Haes, and Van Grembergen (2014) provide a possible explanation
for inadequate use of the business case. They find that, while most business case processes
are considered important (above 70 on a scale of 0 – 100), they are also difficult to do (ease
of execution is below 25 on a similar scale).
2.3 Process theory as used in this study
The research is based on process theory (Koskinen, 2012; Langley, 1999; Niederman
et al., 2018; Pentland, 1999). To be useful, the theory needs to guide what actions related to
the business case need to be taken to produce positive project outcomes (Niederman et al.,
2018). Two possible bases for such theory are variance theory and process theory (Langley,
1999). The former uses covariation of dependent and independent variables; the latter is
concerned with sequences of activities that lead to certain outcomes after starting at an initial
position (Langley, Smallman, Tsoukas, & Van de Ven, 2013). Process theory gives the more
suitable framework to describe the use of the business case (Soh & Markus, 1995).
Although process theory has broad application across disciplines (Bizzi & Langley,
2012; Langley et al., 2013), Niederman et al. (2018) have specialised its use to build
knowledge in the project management sphere to which the business case belongs. It supports
business case use being broken into discrete processes and analysed as such. Process theory
refers to antecedents, describing the initial position, and consequents describing the outcomes
of the processes (Niederman et al., 2018; Pentland, 1999). The antecedents may be the output
of a prior processes, while the consequents would feed into subsequent processes. In the
context of the business case, the consequents are often information on which to base
decisions, or the decisions themselves, as reflected in the next subsection. Because projects

9
are value creation processes (Laursen & Svejvig, 2016), it is useful to identify the critical
processes that may be insufficiently used (Soh & Markus, 1995).
Niederman et al. (2018) categorise processes to facilitate their description and
analysis. For example, there are different process categories depending on: (i) whether one or
multiple outputs are expected, (ii) the variability of actions, and their sequence within the
process, (iii) intermediate states being identified, or found to be essential, and (iv) whether
the process would behave similarly across many business domains. Due to the contextual
nature of projects, some of the processes require several of the categories to describe them.
Here, the business case processes are considered at two levels. The upper level,
described in the next subsection, is comprised of eight process groups. At the lower level,
each process group is broken down into individual processes.
2.4 The business case processes and information
The 37 business case processes identified in Einhorn and Marnewick (2016) are
divided into ‘process groups’ (PGs), which are described in the paragraphs that follow. The
processes making up each PG are given later in Table 1. Figure 1 illustrates (i) the numbered
PGs and (ii) their alphabetized interaction with the categories of information, where each
information category consists of many information types (Marnewick & Einhorn, 2019). It
should be noted that some of the business case PGs overlap with project management process
groups as described in PMI (2017).

10
Figure 1. The business case process and information model
The diamonds ‘D’ associated with the PGs denote typical decision points. While they
are shown in broad chronological sequence, it is accepted that what happens in practice is
situational. PGs 1 to 3, which create the business case, are generally done pre-approval. In
PG4, approved projects are prioritised and resourced, while PGs 5 to 8 are done after project
initiation. If a project happens to be initiated without a business case, then PGs 2 and 3
should be done early in the immediately-following project planning stage.
2.4.1 Process group (PG) descriptions
PG1 covers preparation for the business case (Maes, De Haes, et al., 2014; Ward et
al., 2008). A high-level project proposal stating the business drivers is submitted to
whichever person or body is responsible for receiving proposals such as the Project
Management Office (PMO) or the portfolio manager for projects in the organisation. The
proposal is then screened along with others. If it is selected, the project owner is confirmed
and authorisation given to expand the proposal into a business case; if not, the proposal is
archived (Keen, 2011).
PG2 covers the groundwork for the business case. It might involve considerable
investigation, especially involving the main stakeholders whose requirements and decision

11
criteria need to be thoroughly understood. The main implementation alternatives are
considered and the preferred one noted (Samset & Volden, 2015). The initial scope definition
is then detailed for the preferred alternative, which includes not only the business process
changes but also any organisational changes required to enable the benefits. As noted
previously, the expected costs and completion dates for the project are estimated and the
expected business benefits are detailed with their estimated value over time (Messner, 2013).
An initial risk assessment is also conducted, with an estimate of a risk contingency amount.
The project owner, who is responsible for achieving the benefits, is informed as to how each
benefit will be measured, and also the impact of not completing the project.
PG3 covers assembly, review and presentation of the business case. Based on the
groundwork during PG2, explanations and estimation methods are documented with relevant
evidence, while the underlying assumptions, dependencies and constraints are set out. Where
appropriate, the overall financial benefit is calculated, and recommendations are stated,
emphasising the key themes. Quality assurance is done to ensure that content is sound,
relevant and clear, preferably involving an independent reviewer for major initiatives (Keen,
2011). Finally, the business case is presented to key stakeholders, leading to either a final
decision or a request for further investigation (Maes, De Haes, et al., 2014).
PG4 covers prioritisation of projects which have been approved in principle
(Kopmann et al., 2015). This could involve several steps, depending on the organisation. The
outcome is a decision whether and when the project will be initiated, based on resource
availability and project urgency.
PG5 starts immediately after the project is initiated. It involves developing the project
plan and integrating information from the business case into the plan. It may also lead to an
update of the benefits management plan (PMI, 2017). At the end of planning it is important to
12
ensure that the business case still aligns to the project plan and remains viable (OGC, 2009).
Future reviews involving the business case should be included in the plan.
PGs 6 and 7 should be done iteratively and in parallel throughout project execution
and into benefits realisation. PG6 covers regular monitoring and reporting of project scope,
schedule, costs and risks (Maes, De Haes, et al., 2014). When ad-hoc or planned reviews are
done, in PG7, the business case should be updated and checked for ongoing viability (OGC,
2009).
PG8, the last group, involves measurement and assessment of outcomes. Realised
benefits are compared with those in the business case and action taken where there is a
significant shortfall (Marnewick, 2016). After the final assessment, lessons-learned are
documented to inform future projects.
The PGs, which cover the project’s lifetime, should ideally be followed in the
sequence given, but in practice there is usually iteration. For example, assumptions may be
revisited during later project stages, and constant reprioritisation is done. Processes within the
groups are often omitted, sometimes justifiably and sometimes to the detriment of the project.
2.4.2 Information categories
Figure 1 also shows the linkages between the business case PGs and the business case
information categories (Marnewick & Einhorn, 2019). Indeed, it is the information, or lack
thereof, that often constitutes the antecedent and consequent states referred to in process
theory. As can be seen, much of the information required during tracking is different from
information that is available when the business case is first presented (Brandon, 1998; OGC,
2009; Samset & Volden, 2015). Additional information is generated during planning, and still
more during execution and benefits realisation, underlining the need for ongoing business
case review. As it is essential to understand what information to seek at different times in the

13
project’s lifetime, such information is categorised into the blocks in Figure 1. Their
interactions with the business case PGs are as follows:
Information to create BC (business case, unshaded) serves as input to the first four PGs,
as shown by the arrows ‘a, b, c, d’. The information ‘a’ needed for the first group would
be at a high level and might lack detail. Arrow ‘c’ is double-ended, as the analysis and
quality assurance processes, both use information and generate further information.
Information ‘e’ from the approved business case is a major input to project planning
(Cooke-Davies, 2005), which also generates further information.
BC information from planning (light shading) is used in several ways. First, it may
update the business case ‘f’, as more detail emerges (IPMA, 2009; ISACA, 2012; Nelson
& Morris, 2014; OGC, 2009; PMI, 2017; Thamhain, 2013). But it also creates
information ‘g’, like planned values, that enable the project to be tracked during
execution (Brandon, 1998). Here, ‘tracking’ covers both monitoring of progress and
business case review.
Information for review of BC (dark shading) is gathered as the project is executed, like
progress and actual costs (Brandon, 1998; Herman & Siegelaub, 2009; OGC, 2009; PMI,
2017; Thamhain, 2013). Such information is compared to what was planned and related
back to the business case (flows ‘h’ and ‘i’). The comparisons should indicate whether
the project, or benefits realisation, is proceeding according to plan or whether an ad-hoc
review is needed. Whether scheduled or ad-hoc, reviews could lead to governance
decisions, i.e., the diamonds (Larson & Gray, 2014).
As indicated by the double-ended arrows, all business case PGs, after project start,
both use and generate information. Also, because the business case is updated regularly, the
‘to create’ and ‘from-planning’ information is effectively used in all subsequent processes.
2.5 Research questions arising from the literature

14
This literature review confirms that the business case underpins sound project
governance, which should in turn greatly improve the probability of IT project success.
However, the business case’s potential may not be fully met because of the PGs outlined
above being only partially followed due to their difficulty, rendering business case
information incomplete. Where this is true, business case support for the governance of
business IT projects would be inadequate, thus undermining their success rate. This
convergence of the literature raises the following research questions:
1. To what extent is each business case process used in practice?
2. What can be inferred from literature regarding the consequences
of the business case process usage patterns?
Both questions require a broad understanding of the business case processes and the
information that they require and generate. Question 2, besides using the findings from
question 1, may be answered by seeking from literature the merits of following business case
processes and inferring the likely consequences if such processes are not followed. Literature
also indicates pitfalls in business case use, caused by processes being omitted or inadequately
followed.
3 Research method
3.1 Research design and survey population
To answer research question 1, a quantitative research design was selected, as it
needed input from a broader group than is possible with individual interviews. A cross-
sectional approach, as opposed to longitudinal research, was taken using a survey covering a
limited geographical area. The scope of the survey was organisations based in South Africa
that implement IT projects.
However, because it is difficult to engage with organisations as a whole, the survey
was done at the level of the people in organisations who play a variety of roles that relate to
15
the business case. Therefore, people were the units of analysis that make up the survey
population. More specifically, they were individuals involved in the use of business cases
(having responsibility, providing input, collating input, or managing any aspects of the
process). Therefore, the following roles, amongst others, were covered: executives, project
owners, business managers, business specialists, programme or project managers, portfolio
staff, PMO staff, senior IT people, reviewers of projects, and senior service providers or
consultants.
With about 10 million people in formal employment in South Africa, the following
order of magnitude estimates are given for the survey population: The survey population
could be about 100 000 people associated with about 20 000 organisations of varying sizes
that do business IT work in project mode. The organisations were broadly classified into 10
industry sectors: government, utilities, non-government organisations, financial services,
other services, IT / communications, wholesale / retail, mining / manufacturing, health, and
education. It is estimated that the survey sample of 151 people covered about 120 different
organisations. Thus, the survey sample was small compared with the estimated population.
3.2 The survey questionnaire and sampling approach
The first section of the survey covered demographic data about the respondents: role
in the organisation, years of business experience, industry sector, and size of the organisation.
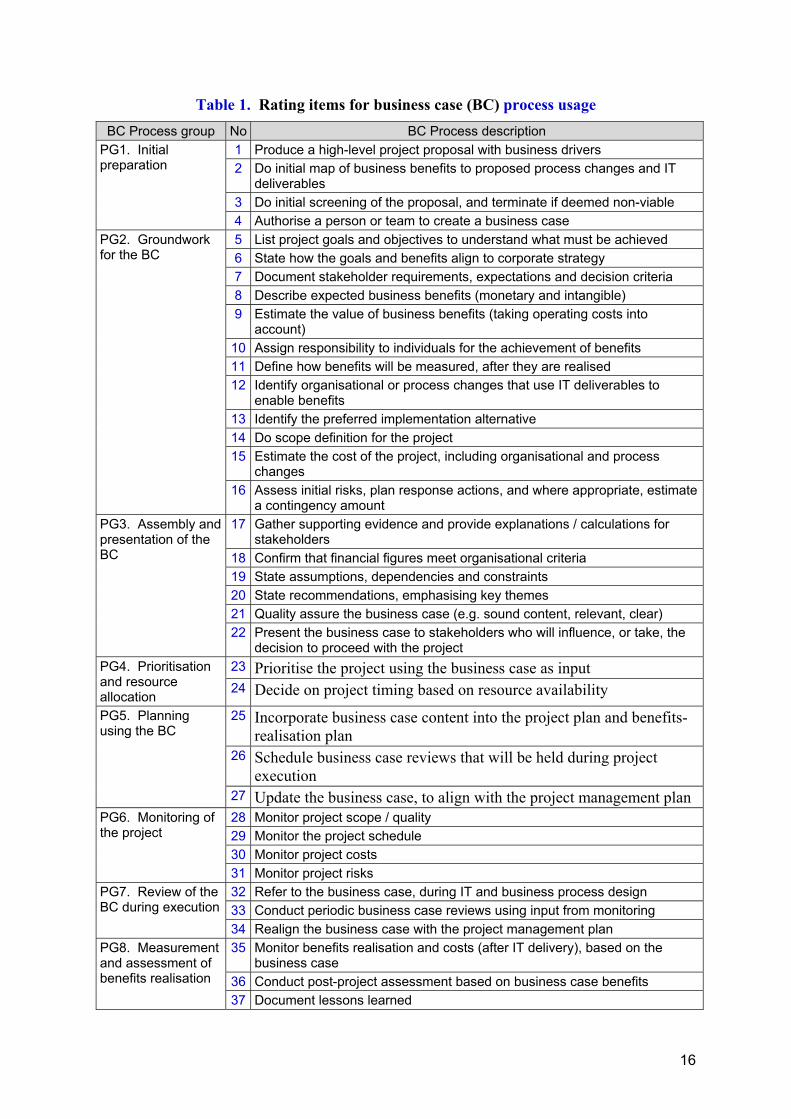
In subsequent sections, the 37 business case processes were presented as shown in
Table 1, divided into the eight PGs from Figure 1. Respondents were asked to rate the degree
to which each process is used (practiced) in their organisations. Rating were done on a five-
point Likert scale: 1: never used, 2: seldom used, 3: sometimes used, 4: often used, 5: very
often used.
16
Table 1. Rating items for business case (BC) process usage
BC Process group No BC Process description
PG1. Initial preparation
1 Produce a high-level project proposal with business drivers
2 Do initial map of business benefits to proposed process changes and IT deliverables
3 Do initial screening of the proposal, and terminate if deemed non-viable
4 Authorise a person or team to create a business case
PG2. Groundwork for the BC
5 List project goals and objectives to understand what must be achieved
6 State how the goals and benefits align to corporate strategy
7 Document stakeholder requirements, expectations and decision criteria
8 Describe expected business benefits (monetary and intangible)
9 Estimate the value of business benefits (taking operating costs into account)
10 Assign responsibility to individuals for the achievement of benefits
11 Define how benefits will be measured, after they are realised
12 Identify organisational or process changes that use IT deliverables to enable benefits
13 Identify the preferred implementation alternative
14 Do scope definition for the project
15 Estimate the cost of the project, including organisational and process changes
16 Assess initial risks, plan response actions, and where appropriate, estimate a contingency amount
PG3. Assembly and presentation of the BC
17 Gather supporting evidence and provide explanations / calculations for stakeholders
18 Confirm that financial figures meet organisational criteria
19 State assumptions, dependencies and constraints
20 State recommendations, emphasising key themes
21 Quality assure the business case (e.g. sound content, relevant, clear)
22 Present the business case to stakeholders who will influence, or take, the decision to proceed with the project
PG4. Prioritisation and resource allocation
23 Prioritise the project using the business case as input 24 Decide on project timing based on resource availability
PG5. Planning using the BC
25 Incorporate business case content into the project plan and benefits-realisation plan
26 Schedule business case reviews that will be held during project execution
27 Update the business case, to align with the project management plan
PG6. Monitoring of the project
28 Monitor project scope / quality
29 Monitor the project schedule
30 Monitor project costs
31 Monitor project risks
PG7. Review of the BC during execution
32 Refer to the business case, during IT and business process design
33 Conduct periodic business case reviews using input from monitoring
34 Realign the business case with the project management plan
PG8. Measurement and assessment of benefits realisation
35 Monitor benefits realisation and costs (after IT delivery), based on the business case
36 Conduct post-project assessment based on business case benefits
37 Document lessons learned

17
The questionnaire went through two review processes. First, the questions were
reviewed by an experienced statistician to check that the wording was suitable and
unambiguous (Fox & Bayat, 2007). Second, the questionnaire was sent to a selected pilot
group of 12 experienced people covering a variety of the above-mentioned roles. The
corrected survey was then entered into an automated survey tool. The link to the automated
survey was sent by email with guidance to ensure that respondents fully understood the
purpose and context of the survey.
No list exists of all the suitable respondents, precluding the use of probability
sampling. The aim of the non-probability sampling approach was to get a representative
sample. Accordingly, the following were the main approaches: Convenience sampling was
used by having the survey circulated by three different professional bodies. Judgment
sampling was used by selecting from published lists of organisations and making telephone
contact before emailing the survey. Snowball sampling was also used by inviting respondents
to forward the survey link to further eligible people (Walliman, 2001). The principle of self-
selection was effective throughout, whereby recipients of the email and link went no further
if they did not relate to the survey (Fox & Bayat, 2007). Responses were received from 209
people, of which 58 incomplete responses were discarded, leaving 151 responses to be used
in the analysis.
3.3 Demographic analysis of the survey population
This subsection analyses the demographic information supplied by survey respondents
whose data is included in the analysis. The purposes are: (i) to understand the survey sample
and their organisations, (ii) to show that they are representative, and (iii) to give context to
the results. The survey was only distributed in South Africa, and care was taken to make it
clear that the survey was about business IT projects, as distinct from, for example,
construction projects. This limitation was explained within the survey itself and also in the
18
invitation letters sent out. However, no organisation was prevented from responding, as
construction companies also make extensive use of IT, for supply chain, HR, and other
purposes.
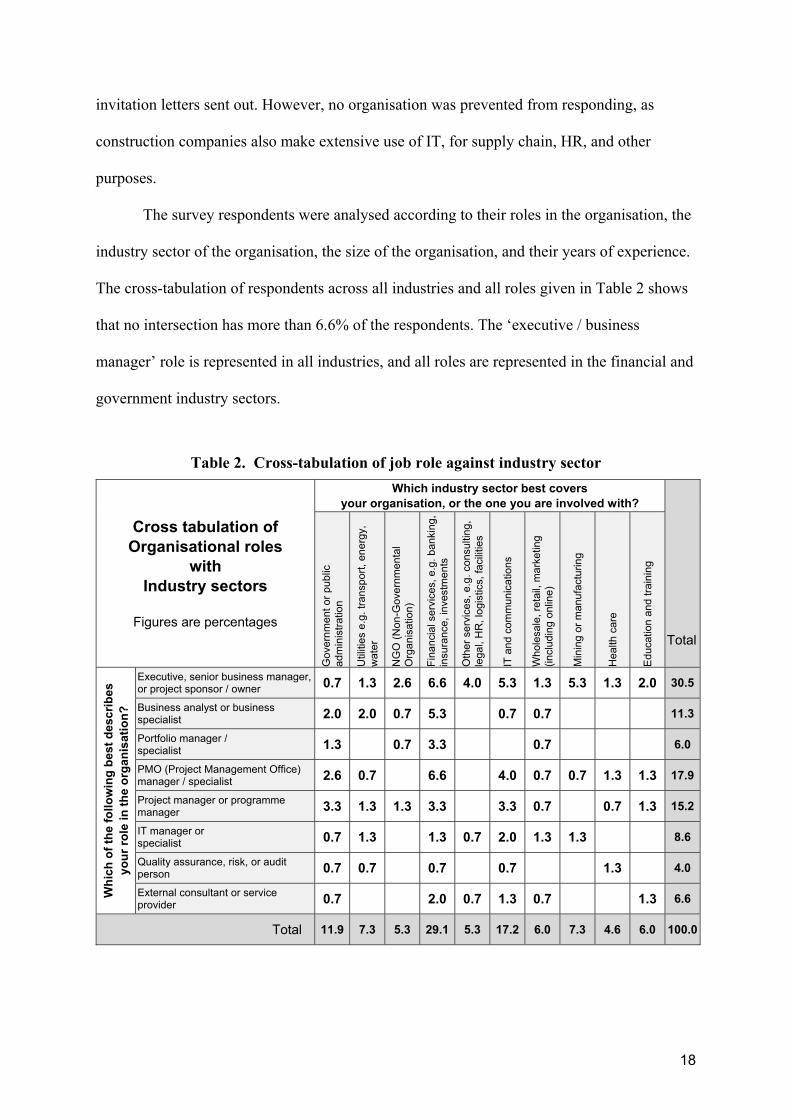
The survey respondents were analysed according to their roles in the organisation, the
industry sector of the organisation, the size of the organisation, and their years of experience.
The cross-tabulation of respondents across all industries and all roles given in Table 2 shows
that no intersection has more than 6.6% of the respondents. The ‘executive / business
manager’ role is represented in all industries, and all roles are represented in the financial and
government industry sectors.
Table 2. Cross-tabulation of job role against industry sector
Cross tabulation of Organisational roles
with Industry sectors
Figures are percentages
Which industry sector best covers your organisation, or the one you are involved with?
Total G
over
nme
nt o
r p
ublic
ad
min
istr
atio
n
Util
ities
e.g
. tra
nspo
rt, e
nerg
y,
wat
er
NG
O (
Non
-Gov
ern
men
tal
Org
ani
satio
n)
Fin
anci
al s
ervi
ces,
e.g
. ba
nkin
g,
insu
ranc
e, in
vest
men
ts
Oth
er s
erv
ices
, e.
g. c
onsu
lting
, le
gal,
HR
, lo
gist
ics,
fac
ilitie
s
IT a
nd c
omm
unic
atio
ns
Who
lesa
le,
reta
il, m
arke
ting
(incl
udin
g on
line)
Min
ing
or m
anuf
actu
ring
Hea
lth c
are
Edu
catio
n an
d tr
aini
ng
Wh
ich
of
the
follo
win
g b
est
des
crib
es
you
r ro
le in
th
e o
rgan
isat
ion
?
Executive, senior business manager, or project sponsor / owner 0.7 1.3 2.6 6.6 4.0 5.3 1.3 5.3 1.3 2.0 30.5
Business analyst or business specialist 2.0 2.0 0.7 5.3 0.7 0.7 11.3
Portfolio manager / specialist 1.3 0.7 3.3 0.7 6.0
PMO (Project Management Office) manager / specialist 2.6 0.7 6.6 4.0 0.7 0.7 1.3 1.3 17.9
Project manager or programme manager 3.3 1.3 1.3 3.3 3.3 0.7 0.7 1.3 15.2
IT manager or specialist 0.7 1.3 1.3 0.7 2.0 1.3 1.3 8.6
Quality assurance, risk, or audit person 0.7 0.7 0.7 0.7 1.3 4.0
External consultant or service provider 0.7 2.0 0.7 1.3 0.7 1.3 6.6
Total 11.9 7.3 5.3 29.1 5.3 17.2 6.0 7.3 4.6 6.0 100.0

19
In terms of experience, 38% of the respondents had less than 15 years of business IT
experience but there was a skew towards the higher levels of experience with 26% having
between 15 and 20 years, and 36% having more than 20 years of business IT experience - not
surprising due to the level of skill and experience required in all aspects of business case use.
Just over half the respondents were from organisations with over 1000 employees, 21% were
from organisations with 100-1000 employees and 28% were from organisations with below
100 employees.
3.4 Overview of the analysis for research question 1
Descriptive statistical analysis was done to determine the usage in practice of the
business case processes. The results were considered in two ways. First, for each PG, the
mean process usage was calculated. Second, the 37 individual processes were analysed by
refining the results into low, medium, and high usage. High usage combined the item 4
(often) and 5 (very often) scale responses to give a perspective of which processes are used
more than others. These results were then summarised at the PG level, which became input to
research question 2. Further analysis was done to determine whether there are significant PG
usage differences across the 10 industry sectors and the three organisation size categories.
3.5 Validity and reliability checks
Data collection is relatively automatic as the survey tool allows data to be extracted
into SPSS (IBM’s Statistical Package for the Social Sciences). Data could then be exported to
Excel to produce certain charts. There are two criteria that data must meet for credible results
to be produced: data must be both valid and reliable (Field, 2013). A further distinction can
be made between internal validity and external validity (generalizability).
There are several ways of assessing internal validity. Logical validity is based on
subjective judgment that the measurement items relate to the stated research questions. This
is addressed via the statistician and pilot group reviews. Content validity relates to the
20
domains being measured, and whether the scale items measure those domains (Pallant, 2010).
For this research, all business case processes are drawn from the published literature and are
believed to be valid. Process validity relates to the way in which data is gathered. In this
research, the demographic spread of responses was continuously monitored during the survey
period, allowing adjustments to be made to ensure a representative spread.
From an external validity point of view, the data is believed to be generalizable within
South Africa. However, because the rating items arise mainly from ‘Western world’
literature, it is believed that the findings should therefore also apply to IT projects in such
countries. However, the findings might not be generalizable outside of IT projects, or to
countries where a different decision-making culture prevails.
There are a number of criteria for data reliability. The data must be consistent, with
the same method being used to gather it, and must exhibit independence among the
respondents. It must be stable, meaning that gathering more data would produce similar
results, and reproducible, meaning that if the research were repeated, it would also produce
similar results (Exeter, 2017). A commonly accepted way of measuring reliability is by using
Cronbach’s alpha test, where an alpha of 0.7 or above is considered satisfactory (Pett,
Lackey, & Sullivan, 2003). The results are that the Cronbach’s alphas for the PGs range from
0.703 to 0.914, with an arithmetic average of 0.834, indicating that the data is adequately
reliable.
An assessment is made of the independence of the 151 responses, meaning that the
respondents do not influence one another. Independence is a requirement for parametric tests
like correlations and desirable for most others (Pallant, 2010). In this survey, lack of
independence could result from multiple respondents belonging to the same organisation,
where they might communicate about the survey answers. Analysis of the data indicates that
21
no more than 5 respondents (less than 4%) belong to any individual organisation, supporting
the view that the responses are largely independent.
Another requirement for many types of statistical data analysis is that the data for
each rating item are normally distributed. Normality is measured by skewness and kurtosis,
which are calculated for each of the rated items. The parameters skewness / standard error of
skewness, and kurtosis / standard error of kurtosis are used. Ratios above 2.58 indicate that
the data may not be normal (Rose, Spinks, & Canhoto, 2015). Based on this ratio, and
inspection, ratings for the business case items are normally distributed. Having done
reasonable checks on the data, the conclusion is that the data can be used for analysis.
4 Results
4.1 Analysis of business case process usage in practice
The finding from the literature review that some business case processes are difficult
to conduct, especially during project execution, suggests that some processes may not be
practiced regularly. This section assesses the degree to which each of the business case PGs
and processes within the groups are followed in practice for IT projects in South Africa.
Table 3 shows, for each of the PGs, the mean for the group. It also shows the minimum and
maximum values of the means and standard deviations, among all of the processes in each
group. The five-point Likert scale was: 1 never used; 2 seldom used; 3 sometimes used;
4 often used; 5 very often used.

22
Table 3. Business case process usage means and standard deviations
Process Group Number of processes
In PG
Mean usage for
PG
Minimum process mean
Maximum process mean
Minimum process
Std. Dev.
Maximum process
Std. Dev.
PG1: Do initial preparation 4 3.78 3.51 3.98 0.98 1.11
PG2: Do groundwork for BC 12 3.69 3.19 4.20 0.87 1.26
PG3: Assemble BC and present 6 3.73 3.48 4.10 1.01 1.18
PG4: Prioritise using BC 2 3.43 3.38 3.48 1.19 1.22
PG5: Plan using BC and update BC 3 2.86 2.64 3.19 1.19 1.31 PG6: Monitor project 4 4.11 3.96 4.26 0.90 1.02
PG7: Review BC 3 2.90 2.74 3.17 1.09 1.28
PG8: Measure, assess using BC 3 3.08 2.86 3.49 1.14 1.29
Table 3 shows that there is a substantial spread in the PG means. This is confirmed by
Table 4 which shows the results of paired samples t-tests to compare the PG means. The only
comparisons where the means are not significantly different at a 95% confidence level
(2-tailed) are shaded. For all the unshaded t-statistics the differences are significant, most
with a significance of 0.000. Thus, there are no significant differences in usage between
PGs 1, 2, and 3. However, after the decision to proceed has been taken (in PG 3), there are
significant differences, except for PG5 (plan using the business case) and PG7 (review the
business case) where there is no significant difference in usage.
Table 4. Mean difference t-statistics for business case PG usage means
Process Group PG1 PG2 PG3 PG4 PG5 PG6 PG7 PG8
PG1: Do initial preparation 1.06 0.97 4.57 11.57 4.66 9.86 8.46
PG2: Do groundwork for BC 0.98 3.69 12.61 6.90 10.32 9.99
PG3: Assemble BC and present 4.14 11.81 5.92 10.14 8.71
PG4: Prioritise using BC 7.77 8.02 6.08 4.27
PG5: Plan using BC and update BC 13.73 0.79 3.26
PG6: Monitor project 13.40 13.73
PG7: Review BC 2.54
PG8: Measure, assess using BC
This finding is corroborated by considering the minimum and maximum means of the
processes within each PG in Table 3. The bolded process means range from 2.64 (between
‘seldom’ and ‘sometimes’) to 4.26 (between ‘often’ and ‘very often’), indicating that certain
23
processes are used far more consistently than others. The bolded process standard deviations
range from 0.87 to 1.31, indicating that there is a spread of ratings, supporting the view that
the practices vary widely across organisations. It is of interest that the process means
generally decrease as the project proceeds, indicating that the business case is used less and
less after approval. Particular values in the table are also insightful. For example, the lowest
mean, indicating that it was the least often conducted, was for a process in PG5 (using and
updating the business case when constructing the project plan). On the other hand, the
highest mean was for a process in PG6 (monitoring the project), a PG that is invariably
conducted whether or not a business case exists. Similarly, the smallest standard deviation,
indicating a well-known and prescribed process, was for a process in PG2 (doing the
groundwork for the business case), while the highest, indicating the least-prescribed process,
was again for a process in PG5.
While the item means are useful for gathering some general insights about practice,
the percentages of respondents’ ratings, by item, allows more detailed understanding of these
trends and answers research question 1. Figure 2 shows the percentages graphically. The
processes are given vertically in their PGs, indicated by the tabs on the right-hand side. To
simplify the diagram, the ‘never’ and ‘seldom’ responses and the ‘often’ and ‘very often’
responses are combined as shown in the key. The rounded percentages are given in the bars.

24
Process usage key: Never / seldom Sometimes Often / very often
Figure 2. The usage in practice of business case processes
The first three PGs are reasonably well used, indicated by longer dark-shaded bars,
with PG1 at 67%, PG2 at 61% and PG3 at 61%. It is interesting that even among the
relatively well used processes in PG1, the lowest at 54% is mapping the business benefits to
proposed organisational process changes. Two items in PG2 that are notably lower than
average are: defining benefits measurement (42%) and identifying organisational process

25
changes to enable benefits (43%). Another weak item is that responsibility for obtaining the
benefits is not always assigned (51%). These lower percentages indicate that even if the
business case is created and approved, there will be potential difficulties later with the
tracking of benefits realisation. Perhaps the organisation assumes that it will not use the
business case to support any changes that will affect people or processes.
The two items of PG4, at 50% and 54% respectively, show that prioritisation uses the
business case to a fair extent. However, the three processes in PG5, show that use of the
business case reduces considerably after project initiation. In particular, scheduling of
reviews (29%) and checking / updating the business case (28%) have very low usage. These
large differences support the view that the business case is mainly used to get initial funding,
and is hardly used thereafter (Eckartz et al., 2009). The 28% for updating the business case to
align with the plan also shows that a mandatory part of OGC (2009) methodology, requiring
such an update, is seldom followed.
A dichotomy appears during execution, with PG6 and PG7 showing stark contrasts.
PG6, which involves routine project monitoring, enjoys a 77% average. While these
processes provide essential information to track the business case, they do not use the
business case directly. However, the three processes of PG7, which do use the business case,
only average 34%, and notably the two business case review processes stand at 31% and 30%
respectively. PG8, averaging 38%, includes use of the business case during benefits
realisation and benefits assessment, which also have low usage at 31% and 30% respectively.
Only lessons-learned is higher at 52%, but this could be because lessons-learned sessions can
be conducted without comparing achievements against what was proposed in the business
case.
26
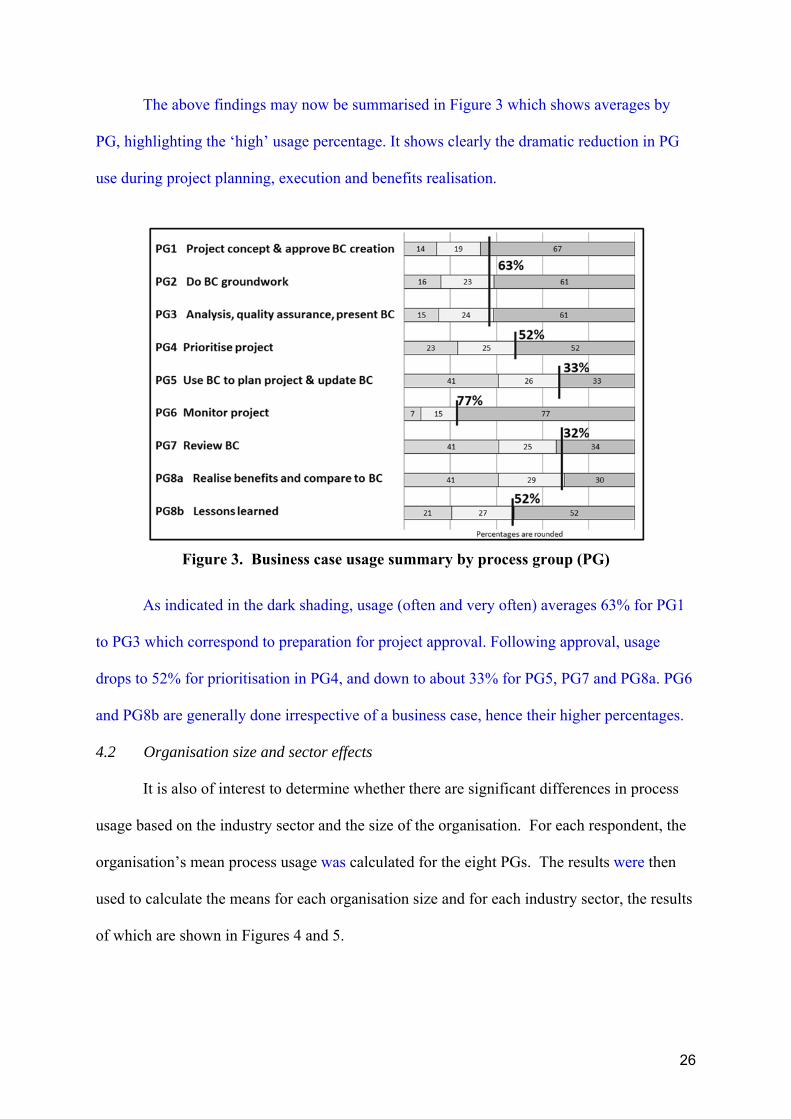
The above findings may now be summarised in Figure 3 which shows averages by
PG, highlighting the ‘high’ usage percentage. It shows clearly the dramatic reduction in PG
use during project planning, execution and benefits realisation.
Figure 3. Business case usage summary by process group (PG)
As indicated in the dark shading, usage (often and very often) averages 63% for PG1
to PG3 which correspond to preparation for project approval. Following approval, usage
drops to 52% for prioritisation in PG4, and down to about 33% for PG5, PG7 and PG8a. PG6
and PG8b are generally done irrespective of a business case, hence their higher percentages.
4.2 Organisation size and sector effects
It is also of interest to determine whether there are significant differences in process
usage based on the industry sector and the size of the organisation. For each respondent, the
organisation’s mean process usage was calculated for the eight PGs. The results were then
used to calculate the means for each organisation size and for each industry sector, the results
of which are shown in Figures 4 and 5.

27
Figure 4. Mean business case process usage by organisation size
Figure 5. Mean business case process usage by industry sector
Examining the figures, it appears that there isn’t much difference due to size of the
organisation, but that there might be by industry sector, especially the top rows compared to
the bottom rows. To understand the significance of such differences, independent samples
t-tests were done to compare their means. The results show that for organisation sizes, there
are no significant differences of means at a 95% confidence level. However, the industry
sectors do show a few significant differences in terms of business case process usage,
highlighted in Table 5.

28
Table 5. Industry sector mean difference t-statistics for business case process use Industries are ordered from greatest to least usage of processes;
t-scores are rounded, and if bolded with * denote: significance < 0.05)
Industry Description
N
Sample size
Mean
Util
ities
Hea
lth c
are
Min
ing,
m
anuf
actu
ring
Oth
er s
ervi
ces
Who
lesa
le,
reta
il
IT a
nd c
omm
s.
Gov
ernm
ent
Fin
anci
al
serv
ices
Edu
catio
n
NG
O
Utilities 11 3.96 0.24 0.80 0.65 0.75 1.81 1.68 1.94 2.53* 2.72*Health care 7 3.88 0.45 0.36 0.45 1.26 1.19 1.34 2.01 2.16
Mining, manufacturing 11 3.77 0.05 0.16 1.11 1.08 1.19 2.27* 2.53*Other services 8 3.76 0.09 0.85 0.82 0.94 1.72 1.95
Wholesale, retail 9 3.73 0.76 0.74 0.86 1.65 1.92
IT and comms. 26 3.53 0.09 0.14 1.48 2.01
Government 18 3.52 0.03 1.25 1.71
Financial services 44 3.51 1.43 2.02*
Education 9 3.14 0.47
NGO 8 2.93
As might be expected, the most significant differences occur for NGO and Education
sectors when compared with the Utilities and Mining, manufacturing sectors. One possible
explanation may be that the industry sectors higher in the table are more mature in terms of
projects than those lower down and hence tend to follow established standards for how to
manage projects. Comparisons between the other industry sectors do not produce any
significant differences. As a result, when examining projects in the education and NGO
sectors, we need to be aware that they will be less sophisticated in the use of business cases
than those in the utilities and mining/manufacturing industries.
The analyses were done for the mean of all 37 processes. Table 6 now considers the
means for each PG to determine whether there are differences across industry sectors. The
shaded blocks indicate sector means that are above the overall mean usage for each PG.
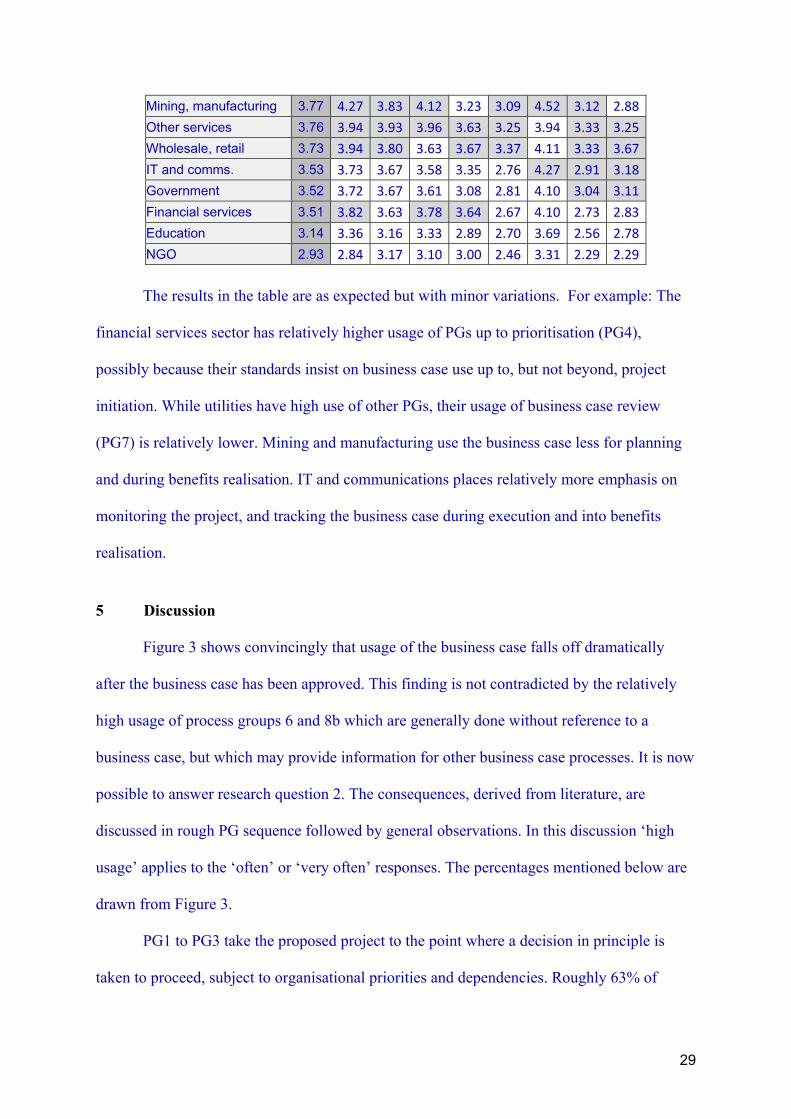
Table 6. Means for industry sectors by process group (PG)
Industry Description Sector Mean PG1 PG2 PG3 PG4 PG5 PG6 PG7 PG8
PG mean 3.78 3.69 3.73 3.43 2.86 4.11 2.90 3.08
Utilities 3.96 4.07 4.24 4.11 3.82 3.03 4.48 2.88 3.82
Health care 3.88 3.93 3.95 4.17 3.79 3.43 4.14 3.29 3.76
29
Mining, manufacturing 3.77 4.27 3.83 4.12 3.23 3.09 4.52 3.12 2.88
Other services 3.76 3.94 3.93 3.96 3.63 3.25 3.94 3.33 3.25
Wholesale, retail 3.73 3.94 3.80 3.63 3.67 3.37 4.11 3.33 3.67
IT and comms. 3.53 3.73 3.67 3.58 3.35 2.76 4.27 2.91 3.18
Government 3.52 3.72 3.67 3.61 3.08 2.81 4.10 3.04 3.11
Financial services 3.51 3.82 3.63 3.78 3.64 2.67 4.10 2.73 2.83
Education 3.14 3.36 3.16 3.33 2.89 2.70 3.69 2.56 2.78
NGO 2.93 2.84 3.17 3.10 3.00 2.46 3.31 2.29 2.29
The results in the table are as expected but with minor variations. For example: The
financial services sector has relatively higher usage of PGs up to prioritisation (PG4),
possibly because their standards insist on business case use up to, but not beyond, project
initiation. While utilities have high use of other PGs, their usage of business case review
(PG7) is relatively lower. Mining and manufacturing use the business case less for planning
and during benefits realisation. IT and communications places relatively more emphasis on
monitoring the project, and tracking the business case during execution and into benefits
realisation.
5 Discussion
Figure 3 shows convincingly that usage of the business case falls off dramatically
after the business case has been approved. This finding is not contradicted by the relatively
high usage of process groups 6 and 8b which are generally done without reference to a
business case, but which may provide information for other business case processes. It is now
possible to answer research question 2. The consequences, derived from literature, are
discussed in rough PG sequence followed by general observations. In this discussion ‘high
usage’ applies to the ‘often’ or ‘very often’ responses. The percentages mentioned below are
drawn from Figure 3.
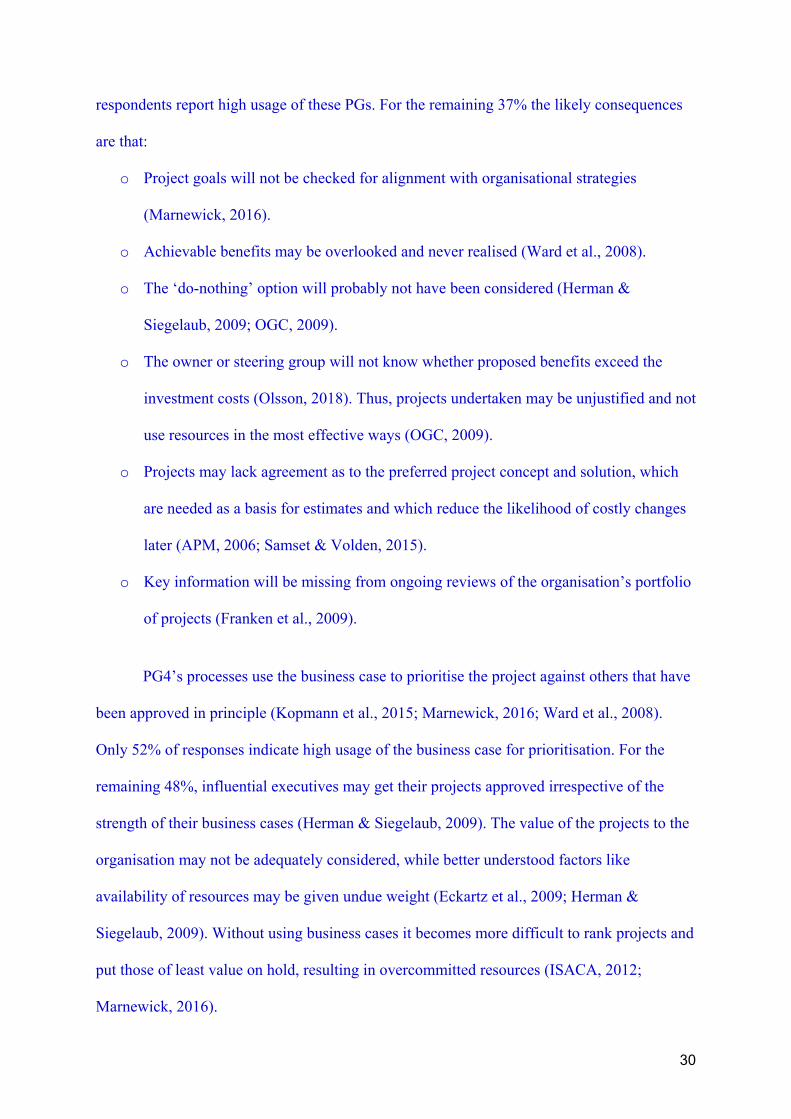
PG1 to PG3 take the proposed project to the point where a decision in principle is
taken to proceed, subject to organisational priorities and dependencies. Roughly 63% of
30
respondents report high usage of these PGs. For the remaining 37% the likely consequences
are that:
o Project goals will not be checked for alignment with organisational strategies
(Marnewick, 2016).
o Achievable benefits may be overlooked and never realised (Ward et al., 2008).
o The ‘do-nothing’ option will probably not have been considered (Herman &
Siegelaub, 2009; OGC, 2009).
o The owner or steering group will not know whether proposed benefits exceed the
investment costs (Olsson, 2018). Thus, projects undertaken may be unjustified and not
use resources in the most effective ways (OGC, 2009).
o Projects may lack agreement as to the preferred project concept and solution, which
are needed as a basis for estimates and which reduce the likelihood of costly changes
later (APM, 2006; Samset & Volden, 2015).
o Key information will be missing from ongoing reviews of the organisation’s portfolio
of projects (Franken et al., 2009).
PG4’s processes use the business case to prioritise the project against others that have
been approved in principle (Kopmann et al., 2015; Marnewick, 2016; Ward et al., 2008).
Only 52% of responses indicate high usage of the business case for prioritisation. For the
remaining 48%, influential executives may get their projects approved irrespective of the
strength of their business cases (Herman & Siegelaub, 2009). The value of the projects to the
organisation may not be adequately considered, while better understood factors like
availability of resources may be given undue weight (Eckartz et al., 2009; Herman &
Siegelaub, 2009). Without using business cases it becomes more difficult to rank projects and
put those of least value on hold, resulting in overcommitted resources (ISACA, 2012;
Marnewick, 2016).

31
PG5’s processes use the business case to develop the project and benefits realisation
plans, as well as to update the business case and align it to the plan. Only 33% of respondents
report high usage of PG5, which might have the following consequences for the remainder:
o The scope and other plans may not align to what is needed to produce the benefits
(Cooke-Davies, 2005).
o The project manager may not fully understand the business case and be incapable of
conveying the business goals to stakeholders (APM, 2006; Herman & Siegelaub,
2009).
o Even where knowledgeable stakeholders cooperated during business case creation,
much may have changed by the end of planning - especially if there is a delay
between approval and project initiation. Assumptions may need revision as more
information becomes available, requiring rethinking of the business case or any aspect
of the project (OGC, 2009; Samset & Volden, 2015) -
o A more detailed business case, required by OGC (2009) and ISACA (2012), will not
be produced, making it unlikely that any future gate reviews will be based on the
business case (APM, 2006).
PG6’s processes are used extensively with 77% of respondents reporting high usage,
indicating that these project monitoring processes are standards in most organisations. While
their output is needed for tracking the business case, they do not depend on a business case.
Although PG7’s business case review processes may be done at any time after
approval, they should be prevalent during execution, which is often the longest and most
resource-consuming part of the project’s lifetime (PMI, 2017). Only 34% of respondents
report high usage of PG7 with the following consequences where processes are not used:
o Focus on the expected benefits may be lost, with the project manager not using
benefits for guidance when considering technical or other options (Coombs, 2015;

32
Herman & Siegelaub, 2009; ISACA, 2012; Sauer & Reich, 2009). Thus,
implementation is likely to drift away from what was envisaged in the business case
(Maes, De Haes, et al., 2014; Musawir et al., 2017). Indeed, according to Kopmann et
al. (2015), the project manager should take some accountability for business benefits.
o Changes in the organisation’s internal and external environment that affect the
business case may go unrecognised (Marnewick, 2016; Musawir et al., 2017; Olsson,
2018).
o There is unlikely to be independent review of the project which, if done, might point
out overlooked issues or opportunities (Kopmann et al., 2015).
o Ongoing re-prioritisation against other projects becomes more difficult (Franken et
al., 2009), and where the justification for the project disappears, the project is unlikely
to be changed or stopped (APM, 2006; Eckartz et al., 2009; Herman & Siegelaub,
2009).
The two PG8a processes, to monitor and assess benefits realisation, are typically done
after the delivered IT products have been incorporated into business processes. Only 30% of
respondents report high usage with the following likely consequences for the remainder:
o There will be less focus on realising the planned benefits (Cooke-Davies, 2005).
Some benefits may be overlooked entirely because there is no check that each benefit
is realised, and solvable problems may not be attended to (ISACA, 2012; Marnewick,
2016). Stakeholders may even be unaware of what might have been achieved.
o Measurements of benefits, especially non-financial, will not be done, nor will the cost
of realising the benefits be understood (Eckartz et al., 2009).
o Success is unlikely to be assessed objectively as it is difficult for business owners to
measure success without referring to the business case (Maes, De Haes, et al., 2014;

33
Musawir et al., 2017; Peppard et al., 2007; Zwikael et al., 2018; Zwikael & Smyrk,
2012).
The PG8b process, documenting lessons learned, has 52% of respondents reporting
high usage; the remaining 48% are at risk of repeating mistakes in subsequent projects.
Nevertheless, if lessons-learned are discussed without using the business case a valuable
input will be missing and deviations from envisaged benefits are unlikely to be explained
(Franken et al., 2009; Ward et al., 2008).
Even for the 63% of responses reporting high usage of PG1-3, where the business
case is not used beyond approval, negative consequences are likely. There is a greater risk of
poor business case quality and unjustified projects being approved. The business case may be
misleading in any of the following ways:
o Promoters of projects, knowing that they can only be held to account if benefits are
tracked, may give overly-optimistic estimates (Kopmann et al., 2015). Benefits may
be imprecisely formulated, overstated or unachievable leading to unrealistic
expectations with risks being ignored (Eckartz et al., 2009; Ward et al., 2008). Worse
still, deliberate ‘strategic misrepresentation’ is possible (Flyvbjerg, 2014).
o The cost of process changes and organisational change management may be
overlooked or underestimated (Eckartz et al., 2009; Ward et al., 2008).
o Assumptions used in the justification may be unrealistic and are unlikely to be
revisited (APM, 2006; Kopmann et al., 2015).
o People may not be made accountable for benefits, with stated measurements and
baseline data captured for later comparison (Franken et al., 2009; OGC, 2009;
Zwikael et al., 2018). Interestingly, the process with the lowest usage in any of the
PGs leading to approval is ‘defining how benefits will be measured’.

34
A question might then become: “what is the purpose of a business case?” If it is
merely to obtain approval to proceed with the project, then the abovementioned shortcomings
are likely to prevail. If, on the other hand, the purpose is to ensure that projects are only
undertaken if they have a high probability of delivering net business and strategic value to the
organisation, then the emphasis would be entirely different. Developers of the business case
would be recognised for responsible work, rather than for getting a favourable decision,
(which might appear less favourable as the project unfolds).
Governance, at both project and portfolio levels, creates accountabilities and depends
on effective use of the business case (Franken et al., 2009; Marnewick, 2016; Musawir et al.,
2017). Therefore, for organisations where the business case is not used throughout the
project’s lifetime, governance is unlikely to be effective, to the detriment of the success rate
(Musawir et al., 2017; Ward et al., 2008). In addition, the business case will not be used to
guide the project through critical thinking and good communication, nor will it be used for
decision making at authorisation points or gate reviews (APM, 2006; Eckartz et al., 2009;
Franken et al., 2009).
Benefits, a focus area in recent literature, need to be stated and updated where
necessary to achieve success. Such ongoing ‘economic governance’ is particularly important
in the agile environment, where requirements evolve as the project progresses (Brown,
Ambler, & Royce, 2013). So, unless the business case is periodically reviewed, an agile
project may be unable to adapt to changes or new information; nor is it likely that the project
will be terminated if it is no longer justified.
Thus, it is more cost effective to revisit the business case regularly than to strive for
perfection up-front. This is compounded by the accelerating rate of change, both inside and
outside the organisation, which often affects strategic requirements and the needed benefits
(Sauer & Reich, 2009). Such changes can even affect the ownership of benefits and their

35
measurement. Additionally, if the business case were to be versioned, with changes from the
previous version highlighted, then business case history could provide valuable learning to
augment the lessons-learned activity. It would also be essential input to the project’s final
report upon completion.
6 Conclusions
To date no comprehensive theory relating to the business case for projects has been
found. Recently, Niederman et al. (2018) have shown how process theory can become a
valuable framework for the accumulation of project management knowledge. Accordingly,
the business case processes, their required information categories and conclusions on their
use serve as early building blocks of business case theory based on the Niederman
framework. Further, it is noted that business case theory has application beyond projects. It is
also relevant for initiatives such as strategy implementation, innovation or organisational
transformation, which might be undertaken over a longer period.
From literature it was concluded that, for business IT projects, lack of effective use of
the business case leads to poor governance, which in turn leads to an unsatisfactory success
rate. Because effective use of the business case requires it to be used throughout the lifetime
of the project, it appeared likely that lack of business case process usage is a root cause of
project failure. As no earlier research was found, this is the first time that conclusions can be
drawn based on actual measurements of business case process usage for business IT projects
and other similar projects such as innovation and Agile that operate in dynamic
environments.
6.1 Conclusions drawn from the findings
Measurements were done through a survey, which after being reviewed and piloted,
produced 151 valid, reliable responses. The constructs surveyed are business case processes
which, together with business case information, provide a basis for effective business case
36
usage. The findings may be summarised as follows: 63% of respondents reported high usage
of the business case up to approval being given to proceed. This drops to 52% for
prioritisation of the project against other projects, and further to 34% or less for processes
that use the business case to plan, review the project, and to support benefits realisation.
Further findings are that the practices in organisations vary widely and that, while size-of-
organisation does not appear to be an important factor, there are differences between industry
sectors, with some being more mature than others in terms of business case usage.
Besides offering an explanation for the unsatisfactory success rate of business IT
projects, the findings point to practical remedies which can be put in place at affordable cost.
What emerges should be educational for managers at all levels involved with projects and
their justification. It should allow them to evaluate their current practices related to the
business case and to determine where improvements might be made or standards enhanced.
In particular, they would understand that only using the business case to get approval to
proceed can lead to disappointing results. Ongoing business case review, in support of sound
governance, throughout execution and benefits realisation has far greater value.
Indeed, the purpose of the business case needs to shift from getting approval to
proceed, to adding significant business and strategic value via the project. Reviews using the
business case do not need to be time-consuming; an hour spent with key stakeholders,
reviewing expected benefits, costs, schedules and risks, may be all that is required for most
projects. Any such review is preferable to the prevalent norm of not revisiting the business
case at all.
6.2 Looking to the future
There is much scope for future research: First, the basic business case theory
mentioned above can be elaborated on by going into more detail on the processes and the
information categories that interact with them using the same Niederman framework. Second,

37
it appears from literature that effective use of the business case depends on the presence of
organisational facilitating factors, which are a natural extension of this study and highly
appropriate for in-depth research and theory development. The model given in Figure 1 could
then be expanded to show the influence of these facilitating factors on the business case
processes and benefits realisation. It should also be determined whether the presence of such
facilitators leads to higher usage of the business case in practice, especially after project
initiation.
Also, this study has only been done on a limited subset of projects (business IT) in a
limited geography (South Africa). Similar research could be done in other geographies to
determine similarities and differences. Research could also be conducted for a broader range
of projects, with possible modification to some of the survey rating items. It would be of
additional value to identify a measure of business case ‘effectiveness’. Although none is
known yet, it can be argued that any such measure might relate to use of the business case
processes identified in this paper.
7 Funding and conflicts of interest
This research did not receive any specific grant from funding agencies in the public,
commercial, or not-for-profit sectors. There are no conflicts of interest.
38
References
Al-Ahmad, W., Al-Fagih, K., Khanfar, K., Alsamara, K., Abuleil, S., & Abu-Salem, H. (2009). A taxonomy of an IT project failure: Root causes. International Management Review, 5(1).
APM. (2006). APM Body of Knowledge 5th edition. Buckinghamshire, UK.: Association for Project Management.
Bizzi, L., & Langley, A. (2012). Studying processes in and around networks. Industrial Marketing Management, 41, 224-234. doi:10.1016/j.indmarman.2012.01.007
Brandon, D. M. (1998). Implementing Earned Value Easily and Effectively. Project Management Journal, June 1998.
Brown, A., Ambler, S., & Royce, W. (2013). Agility at scale: Economic governance, measured improvement, and disciplined delivery. Paper presented at the Proceedings of the 2013 International Conference on Software Engineering, San Francisco, CA, USA.
Cooke-Davies, T. (2005). The Executive Sponsor--The Hinge Upon Which Organisational Project Management Maturity Turns? Paper presented at the PMI Global Congress Proceedings, Edinburgh, Scotland.
Coombs, C. R. (2015). When planned IS/IT project benefits are not realized: a study of inhibitors and facilitators to benefits realization. International Journal of Project Management, 33(2), 363-379. doi:http://dx.doi.org/10.1016/j.ijproman.2014.06.012
Eckartz, S., Daneva, M., Wieringa, R., & Van Hillegersberg, J. (2009). Cross-organizational ERP management: how to create a successful business case? Paper presented at the ACM symposium on Applied Computing, Honolulu, Hawaii.
Einhorn, F., & Marnewick, C. (2016). A Practical Model for the effective use of the Business Case in IT Projects. Paper presented at the PMSA Conference 2016, Johannesburg.
Exeter. (2017). Validity, Generalisability & Reliability. Retrieved from education.exeter.ac.uk/download.php?id=5346
Field, A. (2013). Discovering Statistics using IBM SPSS Statistics (4th Edition ed.). California: SAGE Publications Ltd.
Flyvbjerg, B. (2014). What You Should Know About Megaprojects, and Why: An Overview. Project Management Journal, 45(2 April-May). doi:10.1002/pmj.21409
Fox, W., & Bayat, M. S. (2007). A Guide to Managing Research. Landsdowne, Cape Town: Juta.
Franken, A., Edwards, C., & Lambert, R. (2009). Executing Strategic Change: Understanding the Critical Management Elements that Lead to Success. California Management Review, 51(3)(Spring 2009).
Herman, B., & Siegelaub, J. (2009). Is This Really Worth The Effort? The Need For A Business Case. Paper presented at the PMI Global Congress, Orlando, Florida.
IPMA. (2009). PM Baseline Version 3.0. Austria: IPMA - Projekt Management Austria. ISACA. (2012). COBIT 5 : Enabling Processes. Illinois. Joseph, N., Erasmus, W., & Marnewick, C. (2014). The Idle State of Information and
Communication Technology Project Management. Journal of African Business, 15(3), 184-196. doi:10.1080/15228916.2014.956641
Keen, J. M. (2011). Making Technology Investments Profitable: ROI Road Map from Business Case to Value Realization. Hoboken, N.J: Wiley.

39
Kopmann, J., Kock, A., Killen, C. P., & Gemunden, H. G. (2015). Business Case Control in Project Portfolios - An Empirical Investigation of Performance Consequences and Moderating Effects. IEEE Transactions on Engineering Management, 62(4), 529-543. doi:10.1109/TEM.2015.2454437
Koskinen, K. U. (2012). Organizational learning in project-based companies: A process thinking approach. Project Management Journal, 43(3), 40-49. doi:10.1002/pmj.21266
Krell, K., & Matook, S. (2009). Competitive advantage from mandatory investments: An empirical study of Australian firms. Journal of Strategic Information Systems, 18, 31-45. doi:10.1016/j.jsis.2008.12.001
Langley, A. (1999). Strategies for theorizing from process data. Academy of Management Review, 24(4), 691-710.
Langley, A., Smallman, C., Tsoukas, H., & Van de Ven, A. H. (2013). Process studies of change in organization and management: Unveiling temporality, activity, and flow. Academy of Management Journal, 56(1), 1-13.
Larson, E. W., & Gray, C. F. (2014). Project management: The managerial process. International edition. 6th edition. . New York: McGraw-Hill Education.
Laursen, M., & Svejvig, P. (2016). Taking stock of project value creation: A structured literature review with future directions for research and practice. International Journal of Project Management, 34(4), 736-747. doi:https://doi.org/10.1016/j.ijproman.2015.06.007
Maes, K., De Haes, S., & Van Grembergen, W. (2014). The Business Case as an Operational Management Instrument—A Process View. ISACA journal, 4.
Maes, K., Van Grembergen, W., & De Haes, S. (2014). Identifying Multiple Dimensions of a Business Case: A Systematic Literature Review. Electronic Journal of Information Systems Evaluation, 17(1), 47-59.
Marnewick, C. (2016). Benefits of information system projects: The tale of two countries. International Journal of Project Management, 34(4), 748-760. doi:http://dx.doi.org/10.1016/j.ijproman.2015.03.016
Marnewick, C., & Einhorn, F. (2019). The business case thrives on relevant information. South African Journal of Information Management, 21(1), 11. doi:https://doi.org/10.4102/sajim.v21i1.978
Messner, W. (2013). Making the Compelling Business Case: Palgrave Macmillan. Müller, R., Pemsel, S., & Shao, J. (2014). Organizational enablers for governance and
governmentality of projects: A literature review. International Journal of Project Management, 32(8), 1309-1320. doi:http://dx.doi.org/10.1016/j.ijproman.2014.03.007
Musawir, A. u., Serra, C. E. M., Zwikael, O., & Ali, I. (2017). Project governance, benefit management, and project success: Towards a framework for supporting organizational strategy implementation. International Journal of Project Management, 35(8), 1658-1672. doi:https://doi.org/10.1016/j.ijproman.2017.07.007
Nelson, R. R., & Morris, M. (2014). IT Project Estimation: Contemporary Practices and Management Guidelines. MIS Quarterly Executive, March 2014 (13:1), 15-31.
Niederman, F., Muller, B., & March, S. T. (2018). Using Process Theory for Accumulating Project Management Knowledge: A Seven-Category Model. Project Management Journal, 49(1), 6.
OGC. (2009). Managing Successful Projects with PRINCE2, 5th edition. In A. Murray (Ed.). Norwich: TSO (The Stationery Office) on behalf of Office of Government Commerce.

40
Olsson, N. O. E. (2018). Elaborations on the role of project owner: introducing project owners type 1 and 2. International Journal of Managing Projects in Business, 11(3), 827-844. doi:10.1108/IJMPB-08-2017-0102
Pallant, J. (2010). SPSS Survival Manual (4th edition ed.). Berkshire, England: McGraw Hill. Pentland, B., T. (1999). Building process theory with narrative: From description to
explanation. Academy of Management Review, 24(4), 14. Peppard, J., Ward, J., & Daniel, E. (2007). Managing the realization of business benefits from
IT investments. MIS Quarterly Executive, 6(1), 1-11. Pett, M., Lackey, N., & Sullivan, J. (2003). Making Sense of Factor Analysis. California:
SAGE. PMI. (2016). Governance of Portfolios, Programs, and Projects: A Practice Guide.
Pennsylvania, USA. PMI. (2017). PMBOK - Guide to the Project Management Body of Knowledge, 6th edition:
Pennsylvania, USA. Rose, S., Spinks, N., & Canhoto, A. (2015). Management Research: Applying the Principles,
Chapter 15. London: Routledge. Royer, I. (2003). Why Bad Projects Are So Hard to Kill. Harvard Business Review, 81(2),
48-56. Samset, K., & Volden, G. H. (2015). Front-end definition of projects: Ten paradoxes and
some reflections regarding project management and project governance. International Journal of Project Management. doi:http://dx.doi.org/10.1016/j.ijproman.2015.01.014
Sauer, C., & Reich, B. H. (2009). Rethinking IT project management: Evidence of a new mindset and its implications. International Journal of Project Management, 27(2), 182-193. doi:http://dx.doi.org/10.1016/j.ijproman.2008.08.003
Soh, C., & Markus, M. L. (1995). How IT creates business value: A process theory synthesis. Paper presented at the International Conference on Information Systems (ICIS), Amsterdam.
Standish. (2014a). Chaos Report. Retrieved from https://www.projectsmart.co.uk/white-papers/chaos-report.pdf
Standish. (2014b). Law of the Five Deadly Sins. Retrieved from http://cdn.infoq.com/statics_s1_20160217-0123/resource/articles/standish-chaos-2015/en/resources/5Deadly%20sins_2014-5.pdf
Thamhain, H. (2013). Managing Risks in Complex Projects. Project Management Journal, 44(2), 20-35. doi:10.1002/pmj.21325
Walliman, N. (2001). Your research project, a step-by-step guide for the first-time researcher. California: Sage.
Ward, J., Daniel, E., & Peppard, J. (2008). Building better business cases for IT investments. MIS Quarterly Executive, 7(1), 1-15.
Zwikael, Chih, Y.-Y., & Meredith, J. (2018). Project benefit management: Setting effective target benefits. International Journal of Project Management, 36, 650-658. doi:https://doi.org/10.1016/j.ijproman.2018.01.002
Zwikael, & Meredith, J. R. (2018). Who’s who in the project zoo? The ten core project roles. International Journal of Operations and Production Management, 38(2), 474-492. doi:10.1108/IJOPM-05-2017-0274
Zwikael, & Smyrk, J. (2012). A General Framework for Gauging the Performance of Initiatives to Enhance Organizational Value. British Journal of Management, 23, S6-S22. doi:10.1111/j.1467-8551.2012.00823.x

41