Achieving Environmental Sustainability · Achieving Environmental Sustainability 07 Table 7.1 Goal...
48
07 Achieving Environmental Sustainability The Nile River and its delta taken on July 17 2009 from the Earth-orbiting Space Shuttle Endeavour. © NASA
Transcript of Achieving Environmental Sustainability · Achieving Environmental Sustainability 07 Table 7.1 Goal...
07
Achieving Environmental
Sustainability
The Nile River and its delta taken on July 17 2009 from theEarth-orbiting Space Shuttle Endeavour. © NASA

222
Science and Innovation for Development
The entire suite of development goals, including economic growth, improved education, genderequity and the reduction of disease and hunger, will be difficult to achieve without reversingthe current degradation of the environment. An estimated 24% of global disease burden isassociated with environmental factors, and 25% of all deaths in developing countries are linked toenvironmental risks, compared to 17% in the developed world.1
While it is tempting to think of MDG 7 – with its broad environmental sweep – as somewhat moreremoved than agriculture and health from the immediate needs of the world’s poor, this is actuallynot the case. Recent studies of global environmental change conclude that the poor suffer most asa consequence of environmental decline.2 Research has demonstrated that poor people are mostlikely to be affected by disasters brought about, or exacerbated by, environmental degradation,such as landslides and flooding.34
The main reason for the close relationship between environmental sustainability and povertyreduction is that poor communities in developing countries are much more dependent onenvironmental services, particularly renewable natural resources, than those in developed countries.Over 1.3 billion people rely on forests, fisheries and agriculture for their livelihoods, accounting fornearly half of all jobs worldwide. Natural resources are also essential sources of food, energy, shelterand medicine. In Africa, more than seven out of every ten poor people live in rural areas, where theirlivelihoods are renewable resource-dependent.5
Besides supplying basic human necessities, natural resources in developing countries – such asexport crops and minerals – underpin national economic growth and incomes. Natural capital –including land, minerals and forests – constitutes 5% of the world’s wealth but more than 40% ofthe wealth of developing countries.1
1. Millennium Development Goal 7
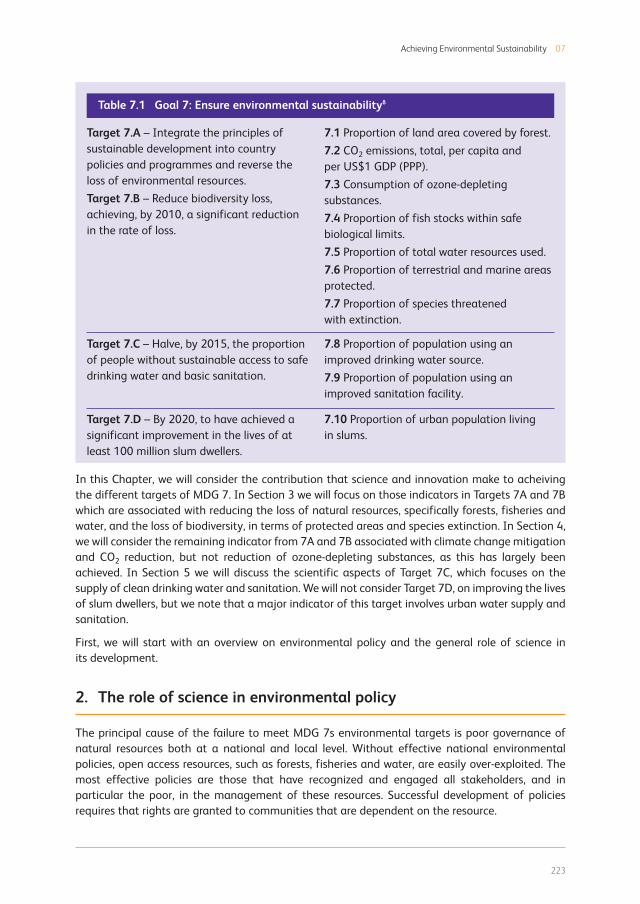
A quick glance at the targets of MDG 7 reveals significant variation in the breadth and depth oftargets and indicators (see Table 7.1). The diverse focus of these targets has been influenced by therecent history of international efforts to integrate environmental and development issues.Governments at the UN Conference on Environment and Development (UNCED) in Rio de Janeiroin 1992 adopted Agenda 21, the Rio Declaration on Environment and Development, and theStatement of Principles for the Sustainable Management of Forests.6 This generated newinitiatives on climate change, forestry and biodiversity, and established “sustainable development”as a shared, international objective, integrating economic growth, equity and environmentalprotection. Then in 2002, the World Summit on Sustainable Development in Johannesburgreaffirmed the principles of sustainable development and placed particular emphasis (linking tothe Millennium Declaration), on water and sanitation, biodiversity conservation, climate changeand energy.7
All of these different environmental initiatives became separate targets and indicators of MDG 7.Target 7C and 7D, dealing with water and sanitation, and urban slums respectively, were quiteprecise. Targets 7A and 7B in contrast, had a complex set of overlapping indicators (Table 7.1).†
† Indeed, depending on what international agency’s website you consult, you will find that the five or seven indicators of Targets 7A and 7B are distributed
across both targets in quite different ways. Here we use the UNSTATS interpretation, which identifies seven indicators across Targets 7A and 7B. This list
of MDG indicators is available at: millenniumindicators.un.org/unsd/mdg/Host.aspx?Content=Indicators/OfficialList.htm [Accessed 16 Nov 2009].
223
Achieving Environmental Sustainability 07
Table 7.1 Goal 7: Ensure environmental sustainability8
Target 7.A – Integrate the principles ofsustainable development into countrypolicies and programmes and reverse theloss of environmental resources.
Target 7.B – Reduce biodiversity loss,achieving, by 2010, a significant reductionin the rate of loss.
7.1 Proportion of land area covered by forest.
7.2 CO2 emissions, total, per capita andper US$1 GDP (PPP).
7.3 Consumption of ozone-depletingsubstances.
7.4 Proportion of fish stocks within safebiological limits.
7.5 Proportion of total water resources used.
7.6 Proportion of terrestrial and marine areasprotected.
7.7 Proportion of species threatenedwith extinction.
Target 7.C – Halve, by 2015, the proportionof people without sustainable access to safedrinking water and basic sanitation.
7.8 Proportion of population using animproved drinking water source.
7.9 Proportion of population using animproved sanitation facility.
Target 7.D – By 2020, to have achieved asignificant improvement in the lives of atleast 100 million slum dwellers.
7.10 Proportion of urban population livingin slums.
In this Chapter, we will consider the contribution that science and innovation make to acheivingthe different targets of MDG 7. In Section 3 we will focus on those indicators in Targets 7A and 7Bwhich are associated with reducing the loss of natural resources, specifically forests, fisheries andwater, and the loss of biodiversity, in terms of protected areas and species extinction. In Section 4,we will consider the remaining indicator from 7A and 7B associated with climate change mitigationand CO2 reduction, but not reduction of ozone-depleting substances, as this has largely beenachieved. In Section 5 we will discuss the scientific aspects of Target 7C, which focuses on thesupply of clean drinking water and sanitation. We will not consider Target 7D, on improving the livesof slum dwellers, but we note that a major indicator of this target involves urban water supply andsanitation.
First, we will start with an overview on environmental policy and the general role of science inits development.
2. The role of science in environmental policy
The principal cause of the failure to meet MDG 7s environmental targets is poor governance ofnatural resources both at a national and local level. Without effective national environmentalpolicies, open access resources, such as forests, fisheries and water, are easily over-exploited. Themost effective policies are those that have recognized and engaged all stakeholders, and inparticular the poor, in the management of these resources. Successful development of policiesrequires that rights are granted to communities that are dependent on the resource.
224
Science and Innovation for Development
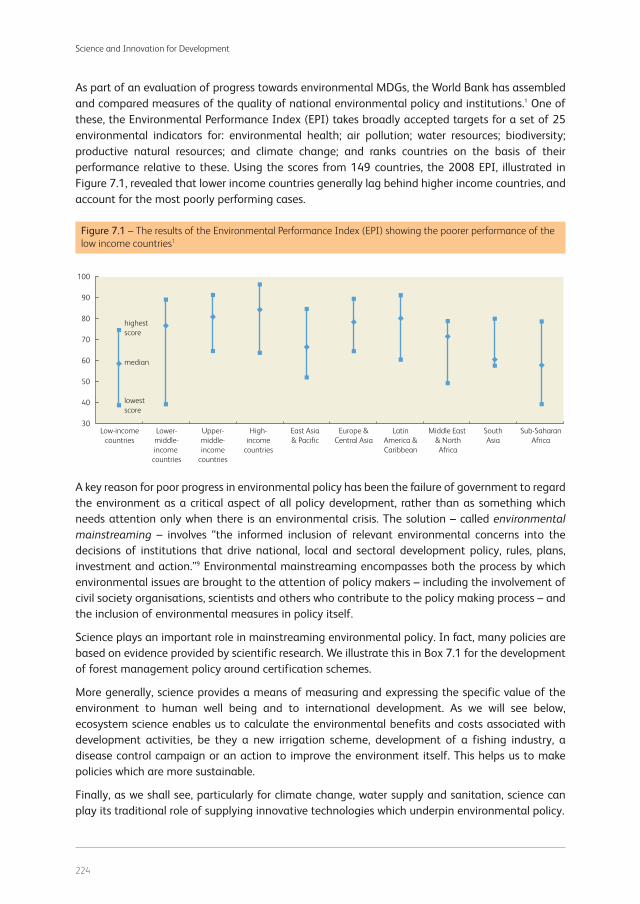
As part of an evaluation of progress towards environmental MDGs, the World Bank has assembledand compared measures of the quality of national environmental policy and institutions.1 One ofthese, the Environmental Performance Index (EPI) takes broadly accepted targets for a set of 25environmental indicators for: environmental health; air pollution; water resources; biodiversity;productive natural resources; and climate change; and ranks countries on the basis of theirperformance relative to these. Using the scores from 149 countries, the 2008 EPI, illustrated inFigure 7.1, revealed that lower income countries generally lag behind higher income countries, andaccount for the most poorly performing cases.
Figure 7.1 – The results of the Environmental Performance Index (EPI) showing the poorer performance of the
low income countries1
90
80
70
60
50
40
30
100
Latin
America &
Caribbean
Middle East
& North
Africa
South
Asia
Europe &
Central Asia
East Asia
& Pacific
High-
income
countries
Upper-
middle-
income
countries
Lower-
middle-
income
countries
Low-income
countries
Sub-Saharan
Africa
highest
score
median
lowest
score
A key reason for poor progress in environmental policy has been the failure of government to regardthe environment as a critical aspect of all policy development, rather than as something whichneeds attention only when there is an environmental crisis. The solution – called environmentalmainstreaming – involves “the informed inclusion of relevant environmental concerns into thedecisions of institutions that drive national, local and sectoral development policy, rules, plans,investment and action.”9 Environmental mainstreaming encompasses both the process by whichenvironmental issues are brought to the attention of policy makers – including the involvement ofcivil society organisations, scientists and others who contribute to the policy making process – andthe inclusion of environmental measures in policy itself.
Science plays an important role in mainstreaming environmental policy. In fact, many policies arebased on evidence provided by scientific research. We illustrate this in Box 7.1 for the developmentof forest management policy around certification schemes.
More generally, science provides a means of measuring and expressing the specific value of theenvironment to human well being and to international development. As we will see below,ecosystem science enables us to calculate the environmental benefits and costs associated withdevelopment activities, be they a new irrigation scheme, development of a fishing industry, adisease control campaign or an action to improve the environment itself. This helps us to makepolicies which are more sustainable.
Finally, as we shall see, particularly for climate change, water supply and sanitation, science canplay its traditional role of supplying innovative technologies which underpin environmental policy.
225
Achieving Environmental Sustainability 07
The specific role that science plays inenvironmental policy is illustrated in thewidespread development and adoption ofcertification schemes for sustainable forestmanagement. Governments use theseschemes to regulate the practices of forestusers and to report on the status of theirforests to international processes and fora. Indeveloping countries, certification schemesrecognize that the poor who live in, andaround, the forests have a critical role to playin forest conservation. Poor people can alsobenefit substantially from commerciallyviable, sustainable forest management.Indeed, if not engaged in and benefiting frommanaging forests, they may contribute tounsustainable harvesting of forest resources. Over 47million hectares of forest are underschemes endorsed by the Forest Stewardship Council (FSC), 18% of which are in Asia, Africaand Latin America. While this proportion is relatively small, growth of certification schemes inmore wealthy countries will affect timber markets and public opinion which should acceleratecertification in poorer countries.
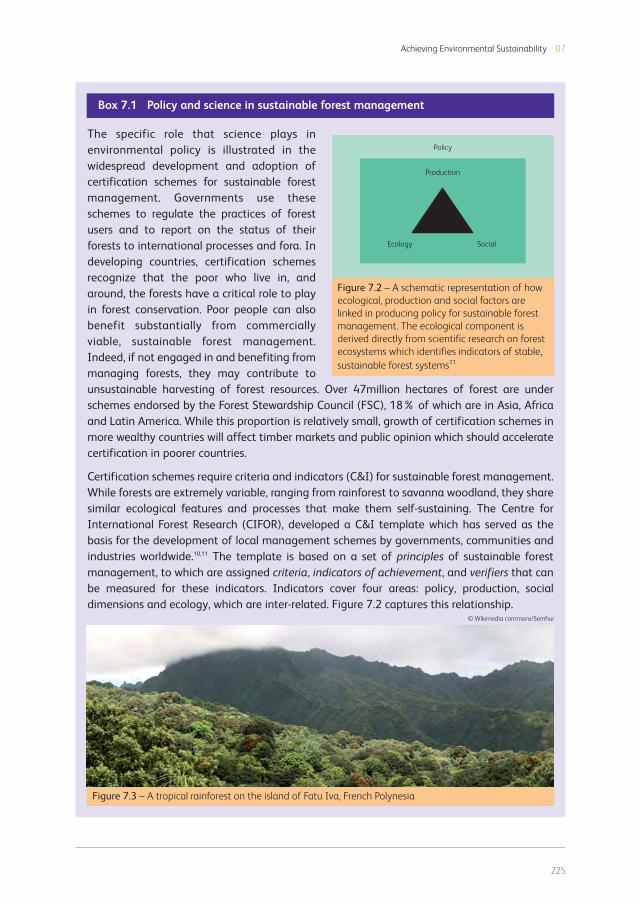
Certification schemes require criteria and indicators (C&I) for sustainable forest management.While forests are extremely variable, ranging from rainforest to savanna woodland, they sharesimilar ecological features and processes that make them self-sustaining. The Centre forInternational Forest Research (CIFOR), developed a C&I template which has served as thebasis for the development of local management schemes by governments, communities andindustries worldwide.10,11 The template is based on a set of principles of sustainable forestmanagement, to which are assigned criteria, indicators of achievement, and verifiers that canbe measured for these indicators. Indicators cover four areas: policy, production, socialdimensions and ecology, which are inter-related. Figure 7.2 captures this relationship.
Box 7.1 Policy and science in sustainable forest management
© Wikimedia commons/Semhur
Policy
Production
Ecology Social
Figure 7.2 – A schematic representation of how
ecological, production and social factors are
linked in producing policy for sustainable forest
management. The ecological component is
derived directly from scientific research on forest
ecosystems which identifies indicators of stable,
sustainable forest systems11
Figure 7.3 – A tropical rainforest on the island of Fatu Iva, French Polynesia
226
Science and Innovation for Development
Ecological indicators are built on scientific knowledge and measurement, for example:
• Landscape pattern is maintained;
• Change of habitat diversity, as a result of human interventions, is maintained within criticallimits, as defined by natural variation and/or regional conservation objectives;
• Community guild† structures do not show significant changes in the representation ofespecially sensitive guilds, pollinator and disperser guilds.
For a particular ecological indicator, there will be a number of verifiers that involve scientificmeasurement of plant and animal diversity and abundance. For instance, with respect to thecommunity guild structure, a few verifiers are:
• The abundance of selected avian guilds is maintained within natural variation;
• The abundance of nests of social bees is maintained within natural variation;
• The abundance of seed in key plant species does not show significant change compared toundisturbed forest.
3. Reversing the loss of natural resources
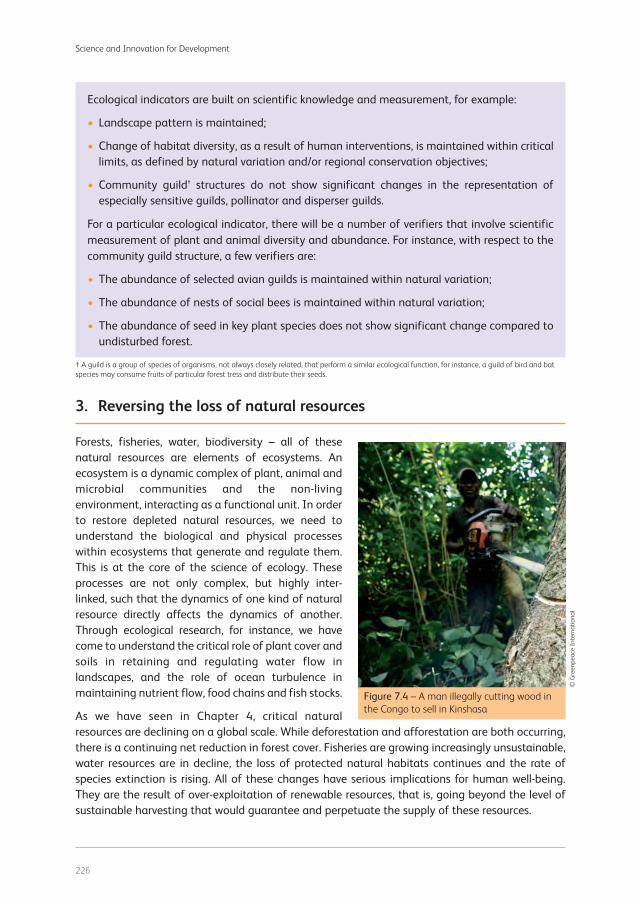
Forests, fisheries, water, biodiversity – all of thesenatural resources are elements of ecosystems. Anecosystem is a dynamic complex of plant, animal andmicrobial communities and the non-livingenvironment, interacting as a functional unit. In orderto restore depleted natural resources, we need tounderstand the biological and physical processeswithin ecosystems that generate and regulate them.This is at the core of the science of ecology. Theseprocesses are not only complex, but highly inter-linked, such that the dynamics of one kind of naturalresource directly affects the dynamics of another.Through ecological research, for instance, we havecome to understand the critical role of plant cover andsoils in retaining and regulating water flow inlandscapes, and the role of ocean turbulence inmaintaining nutrient flow, food chains and fish stocks.
As we have seen in Chapter 4, critical naturalresources are declining on a global scale. While deforestation and afforestation are both occurring,there is a continuing net reduction in forest cover. Fisheries are growing increasingly unsustainable,water resources are in decline, the loss of protected natural habitats continues and the rate ofspecies extinction is rising. All of these changes have serious implications for human well-being.They are the result of over-exploitation of renewable resources, that is, going beyond the level ofsustainable harvesting that would guarantee and perpetuate the supply of these resources.
© G
ree
np
ea
ce I
nte
rna
tio
na
l
Figure 7.4 – A man illegally cutting wood in
the Congo to sell in Kinshasa
† A guild is a group of species of organisms, not always closely related, that perform a similar ecological function, for instance, a guild of bird and bat
species may consume fruits of particular forest tress and distribute their seeds.
227
Achieving Environmental Sustainability 07
The Millennium Ecosystem Assessment (MA)
The same UN initiative that set in motion the development of the MDGs (see Chapter 4) led to thedevelopment of the Millennium Ecosystem Assessment (MA). The outputs of the MA in 2005 cametoo late to shape the design of MDG 7, but the MA findings remain critical for achieving its targets.The MA was run under the auspices of the United Nations (UN) to “assess the consequences ofecosystem change for human well-being and to establish the scientific basis for actions needed toenhance the conservation and sustainable use of ecosystems and their contributions to humanwell-being”. It was intended to address issues arising from other international initiatives, notablythe inter-governmental Convention on Biological Diversity.
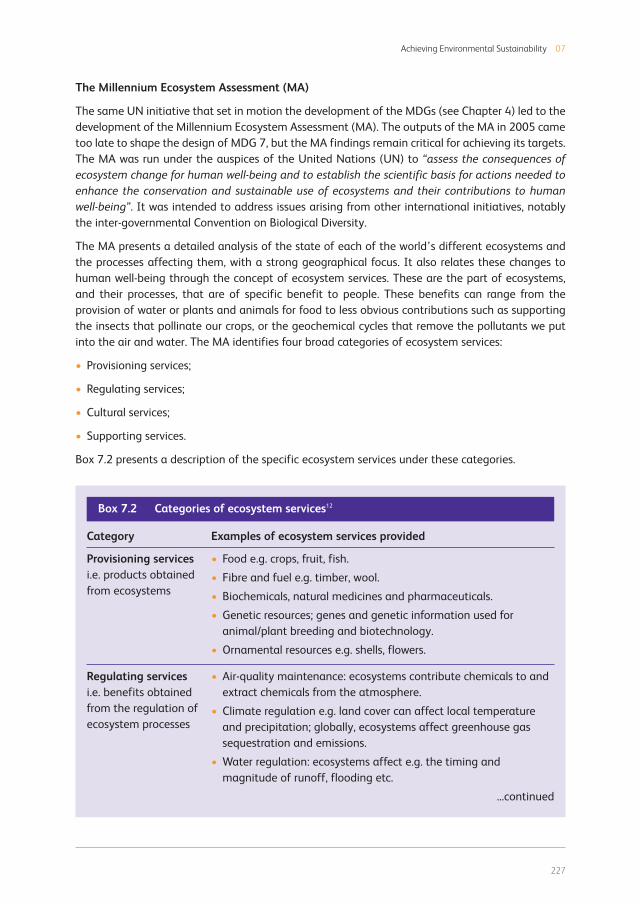
The MA presents a detailed analysis of the state of each of the world’s different ecosystems andthe processes affecting them, with a strong geographical focus. It also relates these changes tohuman well-being through the concept of ecosystem services. These are the part of ecosystems,and their processes, that are of specific benefit to people. These benefits can range from theprovision of water or plants and animals for food to less obvious contributions such as supportingthe insects that pollinate our crops, or the geochemical cycles that remove the pollutants we putinto the air and water. The MA identifies four broad categories of ecosystem services:
• Provisioning services;
• Regulating services;
• Cultural services;
• Supporting services.
Box 7.2 presents a description of the specific ecosystem services under these categories.
Box 7.2 Categories of ecosystem services12
Provisioning servicesi.e. products obtainedfrom ecosystems
• Food e.g. crops, fruit, fish.
• Fibre and fuel e.g. timber, wool.
• Biochemicals, natural medicines and pharmaceuticals.
• Genetic resources; genes and genetic information used foranimal/plant breeding and biotechnology.
• Ornamental resources e.g. shells, flowers.
Category Examples of ecosystem services provided
Regulating servicesi.e. benefits obtainedfrom the regulation ofecosystem processes
• Air-quality maintenance: ecosystems contribute chemicals to andextract chemicals from the atmosphere.
• Climate regulation e.g. land cover can affect local temperatureand precipitation; globally, ecosystems affect greenhouse gassequestration and emissions.
• Water regulation: ecosystems affect e.g. the timing andmagnitude of runoff, flooding etc.
...continued
228
Science and Innovation for Development
Regulating servicescontinued
• Erosion control: vegetative cover plays an important role in soilretention/prevention of land/asset erosion.
• Water purification/detoxification: ecosystems can be a source ofwater impurities but can also help to filter out/decompose organicwaste.
• Natural hazard protection e.g. storms, floods, landslides.
• Bioremediation of waste i.e. removal of pollutants throughstorage, dilution, transformation and burial.
Category Examples of ecosystem services provided
Cultural servicesi.e. non-materialbenefits that peopleobtain throughspiritual enrichment,cognitivedevelopment,recreation etc
• Spiritual and religious value: many religions attach spiritual andreligious values to ecosystems.
• Inspiration for art, folklore, architecture etc.
• Social relations: ecosystems affect the types of social relationsthat are established e.g. fishing societies.
• Aesthetic values; many people find beauty in various aspects ofecosystems.
• Cultural heritage values: many societies place high value on themaintenance of important landscapes or species.
• Recreation and ecotourism.
Supporting services,necessary for theproduction of all otherecosystem services
• Soil formation and retention.
• Nutrient cycling.
• Primary production.
• Water cycling.
• Production of atmospheric oxygen.
• Provision of habitat.
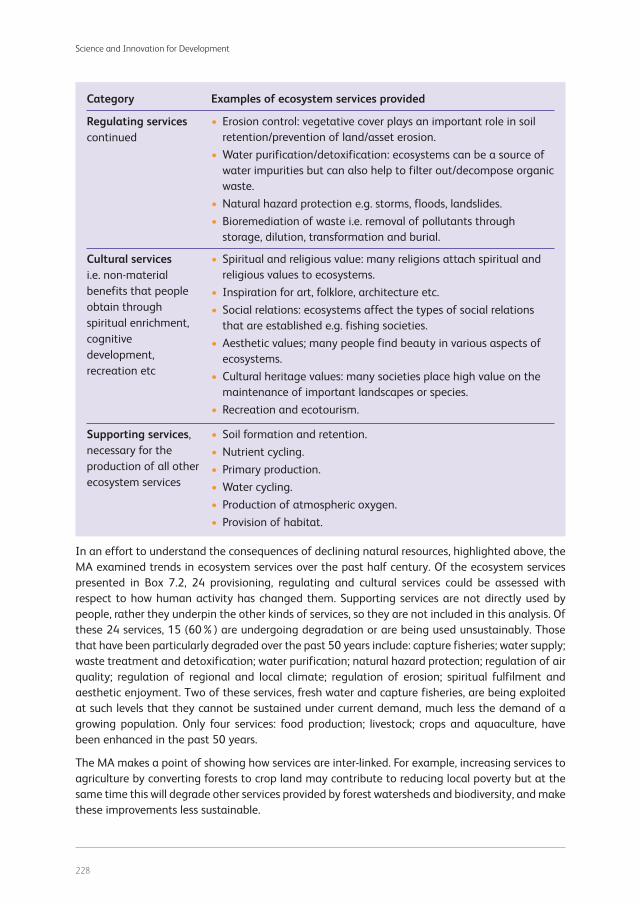
In an effort to understand the consequences of declining natural resources, highlighted above, theMA examined trends in ecosystem services over the past half century. Of the ecosystem servicespresented in Box 7.2, 24 provisioning, regulating and cultural services could be assessed withrespect to how human activity has changed them. Supporting services are not directly used bypeople, rather they underpin the other kinds of services, so they are not included in this analysis. Ofthese 24 services, 15 (60%) are undergoing degradation or are being used unsustainably. Thosethat have been particularly degraded over the past 50 years include: capture fisheries; water supply;waste treatment and detoxification; water purification; natural hazard protection; regulation of airquality; regulation of regional and local climate; regulation of erosion; spiritual fulfilment andaesthetic enjoyment. Two of these services, fresh water and capture fisheries, are being exploitedat such levels that they cannot be sustained under current demand, much less the demand of agrowing population. Only four services: food production; livestock; crops and aquaculture, havebeen enhanced in the past 50 years.
The MA makes a point of showing how services are inter-linked. For example, increasing services toagriculture by converting forests to crop land may contribute to reducing local poverty but at thesame time this will degrade other services provided by forest watersheds and biodiversity, and makethese improvements less sustainable.
229
Achieving Environmental Sustainability 07
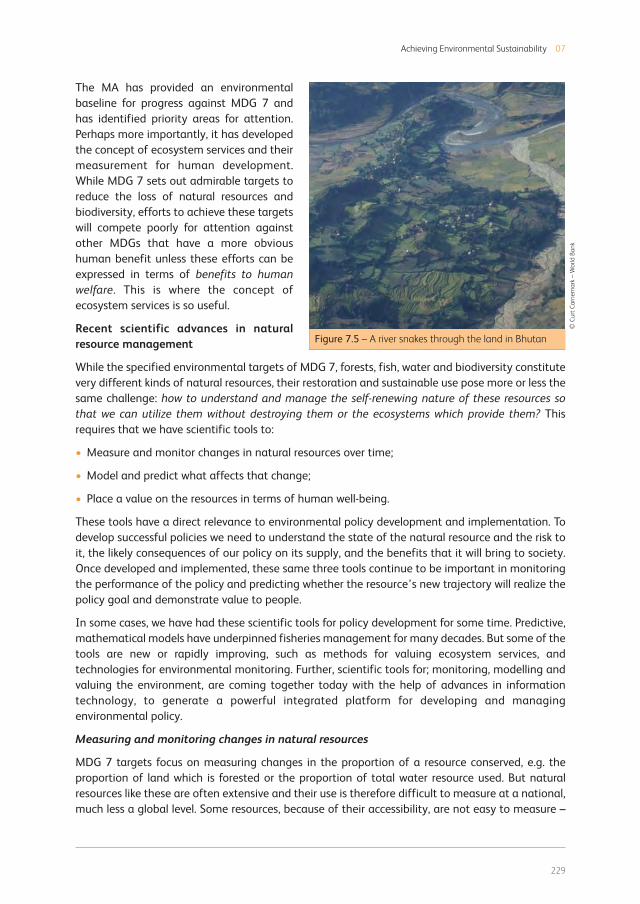
The MA has provided an environmentalbaseline for progress against MDG 7 andhas identified priority areas for attention.Perhaps more importantly, it has developedthe concept of ecosystem services and theirmeasurement for human development.While MDG 7 sets out admirable targets toreduce the loss of natural resources andbiodiversity, efforts to achieve these targetswill compete poorly for attention againstother MDGs that have a more obvioushuman benefit unless these efforts can beexpressed in terms of benefits to humanwelfare. This is where the concept ofecosystem services is so useful.
Recent scientific advances in naturalresource management
While the specified environmental targets of MDG 7, forests, fish, water and biodiversity constitutevery different kinds of natural resources, their restoration and sustainable use pose more or less thesame challenge: how to understand and manage the self-renewing nature of these resources sothat we can utilize them without destroying them or the ecosystems which provide them? Thisrequires that we have scientific tools to:
• Measure and monitor changes in natural resources over time;
• Model and predict what affects that change;
• Place a value on the resources in terms of human well-being.
These tools have a direct relevance to environmental policy development and implementation. Todevelop successful policies we need to understand the state of the natural resource and the risk toit, the likely consequences of our policy on its supply, and the benefits that it will bring to society.Once developed and implemented, these same three tools continue to be important in monitoringthe performance of the policy and predicting whether the resource’s new trajectory will realize thepolicy goal and demonstrate value to people.
In some cases, we have had these scientific tools for policy development for some time. Predictive,mathematical models have underpinned fisheries management for many decades. But some of thetools are new or rapidly improving, such as methods for valuing ecosystem services, andtechnologies for environmental monitoring. Further, scientific tools for; monitoring, modelling andvaluing the environment, are coming together today with the help of advances in informationtechnology, to generate a powerful integrated platform for developing and managingenvironmental policy.
Measuring and monitoring changes in natural resources
MDG 7 targets focus on measuring changes in the proportion of a resource conserved, e.g. theproportion of land which is forested or the proportion of total water resource used. But naturalresources like these are often extensive and their use is therefore difficult to measure at a national,much less a global level. Some resources, because of their accessibility, are not easy to measure –
© C
urt
Ca
rne
ma
rk –
Wo
rld
Ba
nk
Figure 7.5 – A river snakes through the land in Bhutan

230
Science and Innovation for Development
much of the water on which we rely lies below the surface of the earth, out of easy measurement.Finally, the complexity of ecological processes may make it difficult to find simple indicators thatgive us a measure of how complex ecosystems are changing.
A major advance in the way we measure and monitor natural resources is underway throughprogress in earth observation and remote sensing.13 Satellite imagery has long provided a means ofobserving changes in land cover and land use. Since 1972 land cover has been routinely monitoredby Landsat and similar satellites, and with higher temporal but poorer spatial resolution by sensorsmounted on weather satellites. These generally measure solar reflectance at a set of narrow visibleand near infrared wavebands. Reflectances can be used to distinguish vegetation types, such asagricultural and forested land. Countries such as Brazil and India have been using satellite imagerysince the 1990s to measure the changes in forest cover, and these now provide a baseline formeasuring change.
However, broad patterns of forest cover maynot be a good indicator of forest health anddegradation, as significant changes canoccur underneath a forest canopy.Gathering more information from remotesensing requires greater image resolution.This can then reveal forest gaps caused bytree-felling, and evidence of logging or otheractivities in forested areas. The widely usedSPOT and Landsat imagery has a resolutionof 10-60m. Newer systems like IKONOS andQuickBird can now resolve images down toless than 5m, but are still very expensive.
Imaging radars mounted on airplanes havebeen used to supplement optical sensors,and have the potential to measure foreststructure below the canopy. One advantageof radar is that there is no interference fromclouds or smoke, and thus it is useful formapping tropical forests where there ispersistent cloud cover. Another emergingremote sensing technology is Lidar(Box 7.3).
© N
AS
A –
Vis
ab
le E
art
h
Lidar is an optical remote sensing technology that measures properties of scattered light tofind a distant target. It relies on laser pulses and therefore uses shorter wavelengths of theelectromagnetic spectrum than radar and most optical methods, making it possible todistinguish smaller objects on a landscape. Because Lidar is highly sensitive to aerosols andcloud particles it has particular environmental value in monitoring changes in atmosphericchemistry and pollution.
Box 7.3 The LIDAR – Light Detection and Ranging System
Figure 7.6 – A Landsat image taken of the Zambezi
river in April 2003, after flooding turned the normal thin
blue line into a vast swamp of standing water. Tens of
thousands of people were displaced

231
Achieving Environmental Sustainability 07
Figure 7.7 illustrates how Lidar,mounted in an airplane, scans alandscape. A laser scanner on theaircraft sends up to 100,000 pulsesof light per second to the ground andmeasures how long it takes eachpulse to reflect back to the unit.These times are used to compute thedistance each pulse travelled fromscanner to ground. The GlobalPositioning System (GPS) and InertiaMonitoring Unit (IMU) determinethe precise location and attitude ofthe laser scanner as the pulses areemitted, and an exact coordinate iscalculated for each point. Largeareas are surveyed with a series ofparallel flight lines.
Operating in this way, Lidar can be used to assess canopy height, biomass and leaf area, or todetect the land surface beneath a forest. In disaster situations it can detect earth movementsor other landscape changes, relative to baseline scans.
OPS
ZY
X
PITCHIMU
ROLL
YAW
GPS
ZY
X
Figure 7.7 – A Lidar system scans a landscape14
Earth observation is an extremely valuable tool in monitoring, not only forest exploitation, but alsothe pattern and change of exploitation of other natural resources. In most cases, satellite imagesare “ground truthed”, that is, matched to observations made on the ground, to ensure that theparticular spectral image is consistently indicative of a particular ecosystem feature. This allows thecalibration of spectral reflectances with the objects or activities to be measured, e.g. a certain kindof logging activity, water pollution or land degradation.
Earth observation is also of potential value in monitoring of natural disasters.15,16 Satellites fittedwith sensors, which operate over a range of wavelengths, can be used to detect recent and ongoingdisasters like fire (infrared), flooding (near infrared, microwave), earthquakes (microwave),typhoons (visible, microwave).
Under the geographical knowledge provided by earth observation, we can overlay otherinformation on this to generate an understanding of the environmental change observed and itscauses. We can use successive images to provide a time series of images and identify “hot spots”where change is most rapid. To illustrate this we present two recent studies which have used earthobservation to monitor changes: in the use of water resources for irrigation worldwide, and thedegradation of land in Africa.
Many parts of the world, particularly arid regions, face water shortages, and it is likely that climatechange will exacerbate this (see Chapter 9). Irrigation accounts for about 70% of the water thatwe currently use. This enables us to produce about 40% of the world’s food from 17% of thecultivated area. Given our need to increase food production, there will be future pressures toincrease levels of irrigation, but can we afford to do this?
© R
ob
ert
J. M
cGa
ug
he
y –
US
DA
Fo
rest
Se
rvic
e
232
Science and Innovation for Development
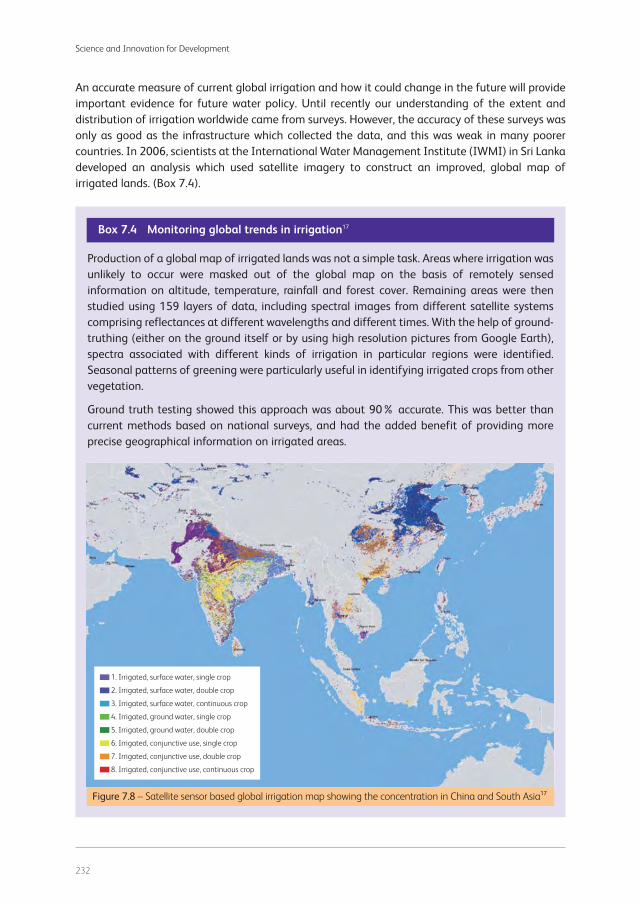
Production of a global map of irrigated lands was not a simple task. Areas where irrigation wasunlikely to occur were masked out of the global map on the basis of remotely sensedinformation on altitude, temperature, rainfall and forest cover. Remaining areas were thenstudied using 159 layers of data, including spectral images from different satellite systemscomprising reflectances at different wavelengths and different times. With the help of ground-truthing (either on the ground itself or by using high resolution pictures from Google Earth),spectra associated with different kinds of irrigation in particular regions were identified.Seasonal patterns of greening were particularly useful in identifying irrigated crops from othervegetation.
Ground truth testing showed this approach was about 90% accurate. This was better thancurrent methods based on national surveys, and had the added benefit of providing moreprecise geographical information on irrigated areas.
Box 7.4 Monitoring global trends in irrigation17
Figure 7.8 – Satellite sensor based global irrigation map showing the concentration in China and South Asia17
An accurate measure of current global irrigation and how it could change in the future will provideimportant evidence for future water policy. Until recently our understanding of the extent anddistribution of irrigation worldwide came from surveys. However, the accuracy of these surveys wasonly as good as the infrastructure which collected the data, and this was weak in many poorercountries. In 2006, scientists at the International Water Management Institute (IWMI) in Sri Lankadeveloped an analysis which used satellite imagery to construct an improved, global map ofirrigated lands. (Box 7.4).
1. Irrigated, surface water, single crop
2. Irrigated, surface water, double crop
3. Irrigated, surface water, continuous crop
4. Irrigated, ground water, single crop
5. Irrigated, ground water, double crop
6. Irrigated, conjunctive use, single crop
7. Irrigated, conjunctive use, double crop
8. Irrigated, conjunctive use, continuous crop

A project to map landdegradation in Africa beganwith the assembly of a timeseries of satellite images andthe application of these toderive the NormalizedDifferenced VegetationIndex (NDVI) – an algorithmfor correlating spectralreflectance with vegetationcover. Annual observationsover 20 years were used toidentify sites in Africa wherethe vegetation index hadchanged. Then, usingseparate data on patterns ofrainfall over that period, thestudy removed sites wherechanges in vegetation werestrongly correlated withchanges in rainfall. Theseincluded, for instance, largeareas of the Sahel, whichhave recently been “greening” due to increased precipitation. In the areas that remained,vegetation cover had declined independent of changing rainfall implicating human activity asa cause. The distribution was then compared to another satellite-generated map of land coverand land use in Africa. This identified regions that were under agriculture, grassland, different
Box 7.5 Mapping land degradation in Africa18
233
Achieving Environmental Sustainability 07
The final map revealed the global distribution of irrigation. It is composed of images of veryhigh resolution, in some cases down to 500m. It reveals that the total annualized irrigatedareas of the world cover 480 million ha (“annualised” takes into consideration irrigated areasduring different seasons). Of this irrigated land 75% occurs in Asia, indeed 60% occurs in justtwo countries, China and India, where it supports largely double cropped agriculture.
There is considerable local evidence that land degradation is a serious problem in Africa.Deforestation, overgrazing, inappropriate agriculture (particularly on poor soils) and desertificationall appear to be contributing to this process. Degradation is eroding Africa’s capacity to increase itsfood production to meet the demands of a rapidly growing population. Understanding where andwhy this degradation is occurring, and its extent and rate, is extremely difficult, particularly inremote areas. Yet, it is precisely this information that is needed to develop strategies and policiesfor land restoration. Box 7.5 illustrates how such mapping has been done using a combination ofsatellite-based remote sensing data and ground-based weather data.
Figure 7.9 – Major land cover classes in 2000 extracted from
GLC2000 data18
Land cover 2000
1. Dense forest
2. Mosaic forest/savanna
3. Mosaic forest/cropland
4. Woodland/shrubland
5. Grassland
6. Agriculture (>50%)
7. Unsuitable surfaces
8. Others (water, cities, etc)
No data

234
Science and Innovation for Development
kinds of forest and desert asseen in Figure 7.9. Figure 7.10shows areas of decliningvegetation index, presumed tobe degraded. Matching theseareas to the vegetation map(Figure 7.9), we can identifydifferent kinds of degradation.These are colour coded inFigure 7.10 as follows:
• Yellow indicates areas whichare suitable for agricultureand cultivated, about0.3 million km2, wheredegradation of agriculturalland is probably occurringdue to poor management;
• Blue indicates a decline inagriculturally suitable areasnot in cultivation, about1.46 million km2, which are likely to include drier grasslands being degraded by over-grazing,woodland and grassland mixtures and dense forests being degraded by deforestation;
• Red indicates regions that are considered unsuitable for agriculture but are, in fact, beingcultivated and degraded. Totalling about 0.1 million km2, these areas are found, for instance,on the eastern borders of Sierra Leone and Liberia as well as in Uganda.
Figure 7.10 – Areas with biomass decline as function of soil/terrain
constraints and their agricultural use18
This study is a first attempt at characterizing and mapping African land degradation, and furtherresearch needs to be done in order to make this more accurate. However it does show howtechnologies based on satellite-based, remote sensing systems, Geographical Information System(GIS) and Information and Communication Technologies (ICT) can be integrated to generate abetter understanding of the distribution of environmental problems and how they are likely tochange over time. This will be important in measuring the impact of efforts that are being madeon behalf of the MDGs and other initiatives.
Future demand for improved remote sensing technology in environmental monitoring is likely to bedriven by a need to monitor policy implementation and agreements. For instance, delegates at theUN Climate Change Conference in Bali in 2007 agreed to explore voluntary schemes for ReducingEmissions from Deforestation and Forest Degradation (REDD), which could involve a market-basedapproach whereby developing countries received carbon credits for reducing or reversingdeforestation. A monitoring system would need to be established for REDD that could measure, onan annual basis, the national change in carbon stocks associated with forest management. Whileit was agreed that, in principle, the basic technology exists for such an accounting system, at leastin developed countries, REDD raises a number of scientific challenges. For instance, forest cover isnot a precise measure of forest carbon. The carbon content of forests is a function of the size of
Biomass decline vs. terrain/soil
constraint and agriculture
Decrease – Suitable terrain/soil
Non-cultivated
Decrease – Suitable terrain/soil
Cultivated
Decrease – Unsuitable terrain/soil
Non-cultivated
Decrease – Unsuitable terrain/soil
Cultivated
No data

235
Achieving Environmental Sustainability 07
trees and other vegetation which can be difficult to measure remotely. One possibility would be tobuild carbon maps using a combination of remote sensing tools and field measurements tocalibrate satellite images with biomass on the ground and with indicators of its change.
Earth observation by a wide range of scientific methods, from satellites to land-based surveys,provides new opportunities to constantly monitor the state of the earth and its resources. Theglobal potential for such a system was captured in 2005 by the establishment of a plan for a GlobalEarth Observation System of Systems (GEOSS) to link existing earth observation systems across awide range of regions and resources, in order to, “increase understanding of dynamic Earthprocesses, to enhance prediction of the Earth system, and to further implement our internationalenvironmental treaty obligations”. Creating GEOSS was the aim of the Group for Earth Observation(GEO),19 a voluntary partnership of 79 governments and various international organisations. GEO isactively bringing together different earth observation systems around common formats to buildthis global capability.
Modelling natural resources dynamics
Because we harvest renewable resources, we arefaced with the question – how much can we take andstill have the resource there to use in the future?Efforts to answer this question began in the earlypart of the last century, when biologists began tostudy, in a quantitative manner, the dynamics ofplant and animal populations. Many were motivatedby the paradox that, while the many millions ofspecies on earth each experience high rates of birthand death, their abundance and numbers seemstrikingly constant. To understand this dynamicequilibrium, biologists turned to mathematics tounderstand what might regulate the numbers ofsingle species.20 Mathematical models of populationscombined variables for birth, death, immigrationand emigration to reveal, and subsequently validate,the processes which cause such systems to bestable. These single species population models, inturn, informed applied research on harvestedpopulations and allowed prediction of the inter-generational consequences of removing individualsat different rates.
The key role that such modelling has played in natural resource management, and its value torealizing MDG 7, is perhaps most clearly seen with fisheries. Fish play an important part in the dietsof people in developing countries, who produce and consume more fish per capita than people indeveloped countries. Not only do they offer a great source of protein but they also provideimportant micronutrients. They constitute two distinct natural resources, wild fish stocks which areharvested, and cultivated fish stocks which are farmed.
MDG 7 focuses on restoring wild fish stocks that have been overexploited. At least one quarter ofimportant commercial fish stocks are currently over-harvested. The management of commercialfisheries needs a good scientific understanding of the dynamics of fish populations.
© C
urt
Ca
rne
ma
rk –
Wo
rld
Ba
nk
Figure 7.11 – One fisherman’s daily catch in
Indonesia
236
Science and Innovation for Development
Population models developed for single fish species populations over 50 years ago still underpinsustainable harvesting schemes around the world. Harvesting represents an additional mortalityacting on a wild fish population which, above a certain rate, will cause the population to declineuntil no fish can be harvested. Modelling allows prediction of the maximum sustainable yield – therate at which fish can be harvested while keeping the number of available fish constant. In practicalterms, fisheries models help to identify, for any fishery, the levels of fish abundance (from therecord of catches) which correspond to this optimal harvesting rate. Typically, managementinvolves establishing levels of fish abundance which indicate sustainable supply and those lowerlevels which indicate that the fish population will not replace itself and will go into decline. With thehelp of monitoring from fish catch data, harvesting is done to approach the first level and avoidthe second.
Modelling of this kind has underpinned longstanding investment by DFID to support sustainablefisheries in developing countries. From a policy perspective, models help to show that a growingnumber of fishers, each acting to maximize their individual catch, will drive fish populations belowthe optimal harvesting rate, and may cause the fishery to collapse. The solution is to regulatefishing, for instance around a total allowable catch per season. Such regulation may be achieved byshutting the fishery once this catch is realized, or moderating the catches by imposing restrictionson the number of fishers or the duration of the fishing season. Recently, the use of “individualtransferable annual catch quotas” has shown advantages over traditional regulatory approachesbecause it allows fishers to trade quotas, reducing the number of fishers and ensuring that thoseremaining have a catch sufficient to maintain their livelihood.21 Optimal regulatory strategiesdepend on understanding how fishing communities respond to restrictions and incentives, as wellas on the modelled dynamics of fish populations. Hence, successful, sustainable fisheries dependcritically on understanding the behaviour of both fish and human populations, and a scientificapproach requires both natural and social science elements.22
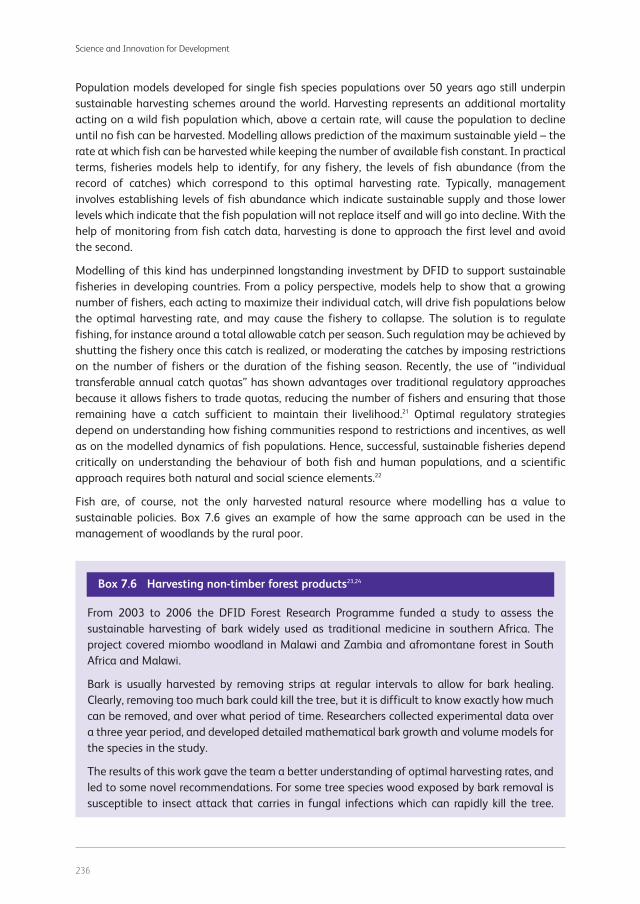
Fish are, of course, not the only harvested natural resource where modelling has a value tosustainable policies. Box 7.6 gives an example of how the same approach can be used in themanagement of woodlands by the rural poor.
From 2003 to 2006 the DFID Forest Research Programme funded a study to assess thesustainable harvesting of bark widely used as traditional medicine in southern Africa. Theproject covered miombo woodland in Malawi and Zambia and afromontane forest in SouthAfrica and Malawi.
Bark is usually harvested by removing strips at regular intervals to allow for bark healing.Clearly, removing too much bark could kill the tree, but it is difficult to know exactly how muchcan be removed, and over what period of time. Researchers collected experimental data overa three year period, and developed detailed mathematical bark growth and volume models forthe species in the study.
The results of this work gave the team a better understanding of optimal harvesting rates, andled to some novel recommendations. For some tree species wood exposed by bark removal issusceptible to insect attack that carries in fungal infections which can rapidly kill the tree.
Box 7.6 Harvesting non-timber forest products23,24

It was found that for these speciesstrip harvesting is unsustainable atany rate and a better method is tofell the tree and harvest all the barkat once and achieve sustainabilityby growing a new tree.
In order to clearly present results topolicy makers in the region, themodels were incorporated intodecision-support structures like theone in Table 7.2. This table allowsusers to examine any species beingconsidered for harvesting, andbased on observed wound closureand pest attack, choose anappropriate harvesting method.
237
Achieving Environmental Sustainability 07
Table 7.2 – Harvest method recommendations for tree species with different characteristics
Fungal and/or insect attack
1 Major 2 Minor 3 None or neglible
Wou
nd c
losu
re
None
1 Poor
2 Fair
3 Good
Full tree harvestingFull tree harvestingFull tree harvesting
Marginal scope forstrip harvesting23Full tree harvestingFull tree harvesting
Strip harvestingMarginal scope forstrip harvesting23Full tree harvesting
Strip harvestingStrip harvestingMarginal scope forstrip harvesting23
Table 7.3 – Strip harvesting recommendations for various tree conditions
1 Major 2 Minor 3 None or neglible
Wou
nd c
losu
re 1 Poor
2 Fair
3 Good
5cm strip 33%of population
5-10cm strip 50%of population
5cm strip 33%of population
10 cm strip 66%of population
5-10cm strip 50%of population
5cm strip 33%of population
Figure 7.12 – A roadside seller of herbal medicines outside
a clinic in Zomba, Malawi. Most of the medicines are derived
from miombo trees
© Jenny Wong
Scientifically driven guidelines like these are now being used by the governments and NGOs inMalawi, Zambia and South Africa.
Bark growth models were also used to make recommendations for the specific size andfrequency of strip harvesting to use on species where this was determined sustainable(Table 7.3).
Fungal and/or insect attack

238
Science and Innovation for Development
Modelling individual species, as is done for most natural resource models, is a relatively crudeapproach. We know that there are important interactions between species in ecosystems which arenot captured in single species models. But modelling multi-species ecosystems is enormouslycomplex. Recent advances in capturing and processing large amounts of environmental data willmake this possible in the future. Scientific modellers also predict that improved modelling andcomputing technologies will allow us to add a more detailed, spatial dimension to modelling, andto model in “real time”: measuring very recent environmental changes, feeding these data intomodels and generating predictions that allow us to take corrective measures immediately.
Finally, tomorrow’s models will better integrate biological with economic elements, to providepowerful bio-economic tools for policy making, and to link the dynamics of resources with theeconomic value of the ecosystem services they deliver.
Putting a value on natural resources
A key contribution of the MA was to promote the concept of ecosystem services as a basis forputting a value on the sustainable management of natural resources. Valuing ecosystem servicesrequires an integration of natural science and economics, and usually generates economic returnson different natural resource management options, from which the most appropriate policy can bederived. An example of this is shown in Box 7.7, for a tropical ecosystem in the Philippines.
On the Philippine island of Palawan in the 1980s, local communities of Bacuit Bay generatedincome from fishing and also tourism – as the Bay’s coral reefs were popular with scuba divers.But increased erosion, and the flow of sediment into the bay from commercial logging in thesurrounding highlands threatened fisheries and tourism income. Suspended sediment in thebay’s water had a negative effect on the fish populations and on the survival of coral reefs. Ineffect, the processes which generated different ecosystem services to the community wereclosely inter-linked.
As shown in Figure 7.13, an economic analysis of the value of the three ecosystem services:forestry, fisheries and tourism, estimated that the ten-year value of forestry was actually lessthan that of the other services combined, and that the value of fisheries and tourism without
Box 7.7 Valuing ecosystem services for forestry and fisheries25
40
30
20
10
0
-10
50
With logging Without logging Net benefit of foregoing logging
Logging
Fisheries
Tourism
US
$ m
illio
n
Figure 7.13 – Gross revenues over 10 years showing the benefits of foregoing logging in El Nido, Philippines25
239
Achieving Environmental Sustainability 07
logging would be even greater. Hence the net benefits of foregoing logging (third column)outweighed the benefits of logging. This analysis led the government to ban logging in thearea and to declare Bacuit Bay a marine nature reserve.
It is unlikely this decision to conserve the biodiversity of Bacuit Bay would have been madewithout an economic analysis of ecosystem services. Fisheries recovered, but ironically theirrapid growth led to over-fishing and a decline in coral reef fish, which impacted on the tourismindustry. So the need to understand the ecological interactions in this ecosystem and tomeasure the economic value of its services has continued.
Synthesis – new platforms for policy development
The last decade has seen a dramatic increase in research on ecosystem services and thedevelopment of a range of practical tools. It has involved a convergence and synthesis of scientificapproaches. The use of remote sensing has enabled geographical representations of naturalresources and their monitoring in real time. This information has been incorporated into asophisticated GIS, which can also incorporate spatial information on human populations andeconomic processes. As a result natural resources and their dynamics can now be mapped ontodemand for the services they provide. Hot spots can be identified, where demand for ecosystemservices is exceeding supply, requiring policies that reduce resource use and restore sustainable,self-renewing supply. Modelling methods can be applied to these spatially detailed data sets topredict the consequences of policies into the future for sustainable development and well-being.
So far, efforts to take this synthetic, geographical approach have been restricted largely todeveloped countries. One developing country example relates to an important ecosystem in EasternAfrica, comprising an arc of mountains stretching from Kenya across Tanzania, described inBox 7.8. Natural Capital Project is mapping the ecosystem services provided by these mountainecosystems, estimating their value, and using the information to inform and finance investmentsin conservation and restoration of natural resources. This new approach seeks to answer previouslyintractable questions such as: which parts of a watershed should be preserved to provide thegreatest collective benefit to carbon sequestration, biodiversity, and tourism? or where wouldreforestation or protection achieve the greatest downstream water quality benefits? Geographicsystems for evaluating ecosystem services have policy value to both developed and developingcountries. However, the need for their use is more urgent in developing countries where resourceloss is most rapid and where populations are more dependent on ecosystem services for theirlivelihoods.
One part of the Natural Capital Project focuses on valuing ecosystem services for the EasternArc Mountains in Tanzania. These mountains have an unique biology; resulting from millionsof years of isolation from other African mountain systems, as well as a global conservationvalue. But they also constitute a development challenge. After decades of steady logging,fires and farmland conversion, the forested area on these mountains has been reduced byalmost 70%. Forests are now fragmented across 13 mountain blocks. The forests support local
Box 7.8 “Valuing the Arc” – ecosystem service management in Tanzania26-28

240
Science and Innovation for Development
© Ron Dunnington – Flickr
Tanzania
Udzungwo
Rubeho
Mahenge
MalundweUluguru
Ukaguru
NguruNguu
East UsambaraWest Usambara
South Pare
North Pare
Taita Hills
Kilimanjaro
Meru
Rungwe
Livingstone
KenyaKey
Eastern Arc Mountains
Other Mountain Blocks
Figure 7.15 – The Eastern Arc Mountains stretch
from Kenya to Western Tanzania26
Reducing biodiversity loss – a development issue?
It is relatively easy to put a value on ecosystem services that directly support human well-being bysupplying essential resources like water, fuel and food, or generate income, like forestry or farming.But what about that parts of ecosystems, where there are literally millions of species that have noapparent direct benefit to human well-being? Does their conservation – by reducing biodiversityloss and species extinction – serve a development purpose or only an environmental one? Does“saving the tiger” really help to reduce poverty, hunger and disease?
MDG 7 includes reducing biodiversity loss, with specific indicators relating to increasing protectedterrestrial and marine areas and reducing extinction rates, for two good reasons.
Firstly, the provision of valuable ecosystem services is closely linked to the activity of animals, plantsand microbes in the ecosystem. This does not mean that every plant or bird or insect species isimportant to human livelihoods. The past few decades of ecological research have helped us tounderstand that most ecosystems contain some degree of redundancy, or overlap, between thefunctions of species in ecosystems that would allow a species to drop out without affecting
villagers, supplying firewood, medicinal plants, lumber and meat, but they also serve as thewatershed for half a dozen rivers flowing into populated regions of Tanzania. Not only do theymaintain a fresh-water supply for more than three million people but they also provide morethan 50% of Tanzania’s electricity through hydroelectric power.
The research project concentrates on mapping and providing economic values for a range ofecosystem services across the mountains, including: hydrological services; carbonsequestration; timber products; non-timber forest productions; ecotourism; pollinationservices; governance and biodiversity. Integrated in a GIS format, it will be possible todetermine how future decisions, such as the creation of roads or changes in forest or watermanagement, will affect all ecosystem services and the economic benefits to local livelihoodsand other stakeholders.
Figure 7.14 – African violets, Saintpaulia spp,
one of the most popular house plants in the world,
are restricted in nature to the Eastern Usumbara
Mountains of Tanzania where, like many other
unique species, they are threatened by
deforestation
241
Achieving Environmental Sustainability 07
ecosystem processes and, hence, services. But among the many thousands of species in anyecosystem, there will be some which are particularly important, often called ‘keystone species’,whose disappearance will change ecosystem function and services.
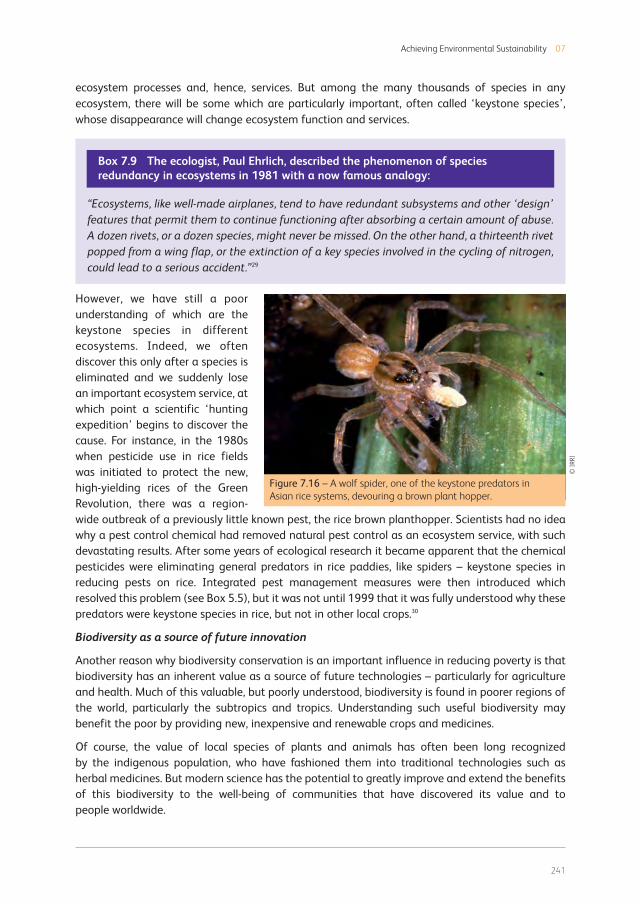
However, we have still a poorunderstanding of which are thekeystone species in differentecosystems. Indeed, we oftendiscover this only after a species iseliminated and we suddenly losean important ecosystem service, atwhich point a scientific ‘huntingexpedition’ begins to discover thecause. For instance, in the 1980swhen pesticide use in rice fieldswas initiated to protect the new,high-yielding rices of the GreenRevolution, there was a region-wide outbreak of a previously little known pest, the rice brown planthopper. Scientists had no ideawhy a pest control chemical had removed natural pest control as an ecosystem service, with suchdevastating results. After some years of ecological research it became apparent that the chemicalpesticides were eliminating general predators in rice paddies, like spiders – keystone species inreducing pests on rice. Integrated pest management measures were then introduced whichresolved this problem (see Box 5.5), but it was not until 1999 that it was fully understood why thesepredators were keystone species in rice, but not in other local crops.30
Biodiversity as a source of future innovation
Another reason why biodiversity conservation is an important influence in reducing poverty is thatbiodiversity has an inherent value as a source of future technologies – particularly for agricultureand health. Much of this valuable, but poorly understood, biodiversity is found in poorer regions ofthe world, particularly the subtropics and tropics. Understanding such useful biodiversity maybenefit the poor by providing new, inexpensive and renewable crops and medicines.
Of course, the value of local species of plants and animals has often been long recognizedby the indigenous population, who have fashioned them into traditional technologies such asherbal medicines. But modern science has the potential to greatly improve and extend the benefitsof this biodiversity to the well-being of communities that have discovered its value and topeople worldwide.
“Ecosystems, like well-made airplanes, tend to have redundant subsystems and other ‘design’features that permit them to continue functioning after absorbing a certain amount of abuse.A dozen rivets, or a dozen species, might never be missed. On the other hand, a thirteenth rivetpopped from a wing flap, or the extinction of a key species involved in the cycling of nitrogen,could lead to a serious accident.”29
Box 7.9 The ecologist, Paul Ehrlich, described the phenomenon of speciesredundancy in ecosystems in 1981 with a now famous analogy:
© I
RR
I
Figure 7.16 – A wolf spider, one of the keystone predators in
Asian rice systems, devouring a brown plant hopper.

242
Science and Innovation for Development
The Svalbard Global Seed Vault is a landmark undertaking in preserving future crop diversity.However, specialists agree that it is also crucial that crops, and their close relatives, which may carrybeneficial traits for future breeding, are preserved in situ, that is, in the natural and agriculturalhabitats in which they have evolved and developed. The wild relatives of crops are often grown inareas that are particularly threatened by human activity. It has recently been estimated that 6%of wild relatives of cereal crops (wheat, maize, rice, sorghum etc.) are under threat of extinction, asare 18% of legume species (the wild relatives of beans, peas and lentils) and 13% of species withinthe plant family that includes potato, tomato, eggplant, and pepper.34
All of our crop plants and domestic animals are derived from wild species. Local races, or relatedwild relatives, still contain genes which have potential value to agricultural production in the future.But this biodiversity is at risk. As agricultural production intensifies, production systems select andrely on fewer and fewer species and varieties. This results in a loss of important genetic diversitythat could be used to improve the nutritional value of food crops, protect them from unexpectednew pests or help them adapt to changing environmental conditions.
For instance in 2007, there were a reported 7,616 breeds of livestock. Of these 20% were classifiedas at risk of extinction, and since 2001, 640 breeds have become extinct.31 For plants, we have seenover 90% reduction in the number of different varieties of some crop species in the past century.32
Protecting agricultural biodiversity in order to give us a variety of resources to address yet-unknownfuture needs is a most urgent priority. Box 7.10 illustrates an important recent response: establishingand maintaining a living collection of the world’s key crop plants and their genetic diversity.
In response to the disturbing trendof crop variety loss, the Global CropDiversity Trust was established in2004, “to ensure the conservationand availability of crop diversity forfood security worldwide.”33 It supportsgermplasm collections around the worldand established, in 2008, the SvalbardGlobal Seed Vault, which provides apermanent storage facility for cropbiodiversity below the permafrost onSpitzbergen, an island in the Norwegianterritory of Svalbard, in the ArcticOcean. The seed collections areduplicates of national collections whichcan be replaced if lost.
It is encouraging that between the 1996 and 2009 editions of the State of the World’s PlantGenetic Resources reports, ex situ collections (e.g. those preserved as seeds in storage ratherthan as in situ living plants in the field) have increased by 20% worldwide to reach 7.4 millionaccessions.
Box 7.10 The Global Crop Biodiversity Trust
© Gordon Conway
Figure 7.17 – The Svalbard Global Seed Vault
243
Achieving Environmental Sustainability 07
What has just been said about the value of conserving natural biodiversity for future agriculturaldevelopment applies equally to future improvements in health. Many wild plants contain chemicalsof medicinal value. In many cases, their value is known locally, but is under-developed compared totheir global potential for health improvement. For instance, Artemisia annua, a relative of the daisyfound worldwide, has been used in China for over 2,000 years as a traditional herbal treatment formalaria. It was only in the 1970s that one of its chemical constituents, artemisinin, was developedas a modern drug and is now a key element of Artemisinin-based Combination Therapies (ACT)which underpin a new campaign for malaria control worldwide (see Chapter 6).
As with wild relatives of crop plants, much of this wild biodiversity of medical value is nowthreatened. Catharanthus roseus is a species of periwinkle, native to Madagascar, where habitatdestruction has driven it to near extinction. Fortunately, it has been widely cultivated in othercountries as an ornamental, and it is also used by some local communities for the treatment ofdiabetes. Some decades ago, the pharmaceutical company, Eli Lilly – while researching itsmedicinal properties – discovered the value of the periwinkle’s constituent alkaloids, vincristine andvinblastine, in treating childhood leukemia and Hodgkin’s Lymphoma. Today these are important,globally available cancer drugs.
The study of wild biodiversity and its potential global value to agriculture and medicine hasinvolved many public and private sector organisations. Much of this work has been undertaken indeveloping countries, with their rich biodiversity. All too often, exploitation of this biodiversity hasproceeded without benefit to the local communities where that biodiversity was found andconserved – communities which have often done much to recognise and develop its value throughtraditional technologies, such as herbal medicine. Exploitation of biodiversity in this way, withoutfair and equitable benefit sharing, is often called biopiracy. The inter-governmental Convention onBiological Diversity (CBD) came into force in 1993 with the aim of allowing developing countries tobenefit from their biodiversity resources and traditional knowledge, by giving them more controlover access to their local biodiversity and establishing agreed procedures for sharing benefits of itsdevelopment, e.g. into new wonder drugs or super crops. However, the CBD and its membergovernments have made slow progress towards this goal, and “biopiracy” is still a concern.
Threats to biodiversity
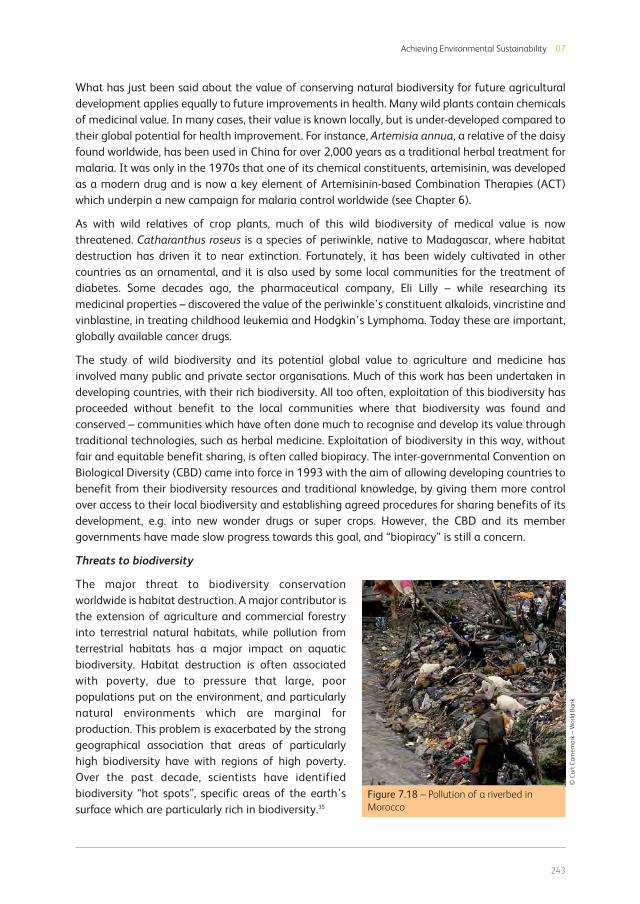
The major threat to biodiversity conservationworldwide is habitat destruction. A major contributor isthe extension of agriculture and commercial forestryinto terrestrial natural habitats, while pollution fromterrestrial habitats has a major impact on aquaticbiodiversity. Habitat destruction is often associatedwith poverty, due to pressure that large, poorpopulations put on the environment, and particularlynatural environments which are marginal forproduction. This problem is exacerbated by the stronggeographical association that areas of particularlyhigh biodiversity have with regions of high poverty.Over the past decade, scientists have identifiedbiodiversity “hot spots”, specific areas of the earth’ssurface which are particularly rich in biodiversity.35
© C
urt
Ca
rne
ma
rk –
Wo
rld
Ba
nk
Figure 7.18 – Pollution of a riverbed in
Morocco

244
Science and Innovation for Development
The majority of the earth’s terrestrial biodiversity is found in 34 biodiversity hot spots, comprisingless than 2% of the earth’s land surface. The complete protection of these hot spots would preserveabout 44% of all plant species and about 35% of vertebrate animal species. Figure 7.19 mapsthese global biodiversity hotspots. Each one is shaded according to its overlap with areas of highpoverty. Darker shading means more hectares within the hotspot have high levels ofundernourishment, economic poverty, poor access to clean water and high population pressure.36,37
From this it is clear that many biodiversity hotspots are also areas of high poverty, whereconservation of their rich biodiversity may bring local and global benefits.
The second greatest threat to biodiversity loss, particularly in developing countries, arises paradoxically
from the addition of species, not their removal. Alien plant and animal species, introduced by human
activity into local ecosystems from ecosystems on other continents, will sometimes become invasive,
dominating ecosystems and affecting biodiversity and ecosystem services.38 In the Cape region of
South Africa, for instance, a number of tree species, introduced for forestry, have invaded the highly
sensitive native shrub vegetation, the fynbos. This highly localised flora comprises one of the world’s six
floristic kingdoms, comprising over 9,000 plant species, 6,400 of which are found nowhere else. In
addition to threatening this unique biodiversity, invasive alien trees are drawing up water, reducing
water supply for rural communities and threatening the water catchment area supplying Cape Town.
Managing alien species requires an understanding of their ecology, in order to find the best way of
eliminating or containing their populations. Substantial success has been achieved, with benefits for
both biodiversity conservation and poverty reduction. In South Africa, for instance, the Working for
Water project has, since 1995, cleared more than one million hectares of invasive alien plants whilst at
the same time providing jobs and training to approximately 20,000 people annually, from among the
most marginalized sectors of society, of whom over 50% are women.39 Control of alien plants restores
Figure 7.19 – The 34 world biodiversity hot spots identified by Conservation International, shaded according to
the area of these hotspots characterized as being under socio-economic poverty37
17. Madrean Pine-Oak
Woodlands
28. California
Floristic
Province
24. Caribbean
Islands
11. Mesoamerica
30. Polynesia-Micronesia
16. Tumbes-
Choco-Magdalena
2. Tropical Andes
18. Chilean Winter Rainfall
and Valdivian Forests
8. Atlantic
Forest
5. Cerrado
10. Guinean
Forests of
West Africa
13. Mediterranean
Basin
21. Irano-Anatolian
25. Caucasus
9. Mountains of
Central Asia
1. Horn of Africa
3. Indo-Burma
14. Himalaya
29. Mountains of
Southwest China
31. Japan
15. Phillippines
22. East
Melanasian
Islands
32. New
Caledonia
33. New Zealand
34. Southwest
Australia
20. Wallacea
7. Sundaland
23. Western
Ghats
6. Madagascar
19. Maputaland
-Pondoland
-Albany
4. Eastern
Afromontane
12. Coastal
Forests of
Eastern Africa
26. Succulent
Karoo
27. Cape Floristic
Region
0 44,887,606 - 70,781,255 178,205,429 - 413,931,746283,616 - 44,887,605 70,781,256 - 178,205,428
Hotspots ranked by hectares

245
Achieving Environmental Sustainability 07
watersheds for these rural populations and nearby urban communities. Control methods range fromtraditional physical and chemical technologies, to innovative biological control methods that usespecific natural enemies, parasites and pathogens of these plants to reduce their growth and spread.
4. Climate change mitigation
Perhaps the greatest contribution of science to the future of contemporary society has been thediscovery and elucidation of the process of anthropogenic (human induced) climate change. Thescientific method has been essential in establishing the convincing evidence base, without which,policy initiatives like the Kyoto Protocol would not have made progress. The scientific toolkitsmentioned above for environmental measurement, monitoring, modelling and valuation, havebeen precisely those required to understand the problem of climate change and to evaluatemeasures to reduce its impact.
When the MDGs were created this scientific and policy process was only just underway. As a resultclimate change figures in only a handful of indicators under one target of MDG 7. Because of itsimportance, and particularly its relevance for international development, the next two chapters aredevoted to the scientific evidence for climate change, its impacts on the poor and how developingcountries can adapt.
In MDG 7 the indicator for climate change is carbon dioxide (CO2) emissions – total, per capita, andper US$1GDP.
Over the past hundred years the bulk of emissions have been produced as a result ofindustrialisation and urbanisation. The developed countries have been mostly responsible for thisalong with, in recent decades, a growing contribution from newly emerging countries such as Chinaand India who are undergoing rapidindustrialisation. The less developedcountries, on a country by country basis,have contributed relatively small amountsof GHGs to total global emissions.However, collectively they are a significantcontributor, for instance through theprocesses of forest clearance andagricultural development.
It could be argued that mitigationmeasures, therefore, should be principallythe responsibility of wealthy countries.Indeed, most initiatives on climate changeand international development havefocused on assisting less wealthy countrieswith adaptation to, rather than mitigationof, climate change as this is the significantchallenge for poverty reduction.
© T
ran
Th
i Ho
a –
Wo
rld
Ba
nk
Figure 7.20 – Traffic in Ho Chi Minh City

246
Science and Innovation for Development
However, mitigation will increasingly become an issue for developing countries as they industrialize.Figure 7.21 compares the per capita production of GHGs for different countries and relates this totheir population size. In this figure a country’s contribution is the size of its box. Therefore countrieswith low per capita production and large populations, such as China and India, make substantialcontributions compared to highly industrialized countries with lower populations and high percapita consumption.
Figure 7.21 – Per capita production of greenhouse gases40
0543210 6
Population (billions)
Gre
en
ho
use
ga
s p
ollu
tio
n (
ton
s C
O2
e/y
pe
r p
ers
on
)
20
15
10
5
25 Uni
ted
Stat
es o
f Am
eric
a
Aus
tral
ia
Cana
da
Irel
and
Net
herla
nds
5 GtCO2e/y
Russ
ian
Fede
ratio
n
Ger
man
y
Saud
i Ara
bia
Qatar, United Arab Emirates
Kuwait
Trinidad & Tobago
TurkmenistanSingapore
Uni
ted
King
dom
Ital
yFr
ance
Iran
Vene
zuel
a
Turk
eyEg
ypt
Sout
hKo
rea
Braz
ilM
exic
o
Japa
n
Taiw
an
Uzb
ekis
tan
Thai
land
Chi
naIn
done
sia
Paki
stan
Sout
h A
fric
a
Indi
aPh
ilipp
ines
Vie
tnam
Bang
lade
shN
iger
iaD
RC
Emerging economies, such as China and India, are now responding rapidly to the challenge ofclimate change. The Chinese government announced in 2007 the ‘Middle and Long-termDevelopment Plan of Renewable Energies’, promising to derive 10% of national energy supplyfrom renewables by 2010, and 15% by 2020. While this is a large goal, they are on track to do so.For example, by doubling wind power capacity for the fifth year in a row in 2008, they havesurpassed the 12GW wind target for 2010 two years early.41
India is also looking to increase its renewable energy capacity, under its national action plan onclimate change. In August 2009 the government announced plans to boost solar energyproduction from the current 51 MW to 20,000 MW by 2020.42 In both of these rapidly emergingnations, investment in this area not only helps to mitigate future environmental and climatedamages, but also offers uniquely practical and efficient ways to supply electricity both to agrowing number of businesses and urban consumers, and to the millions of households in remoterural areas.

247
Achieving Environmental Sustainability 07
For the billions of people in developing countries with no, or expensive and unreliable, electric gridconnections, advances in renewable energy technologies can provide appropriate and flexiblealternatives to conventional energy supplies. Scientific advances have the potential to, not onlycontribute to mitigating climate change and reducing fossil fuel dependence and pollution, but alsoto bring economic, health and broader development benefits.
Here, we look at examples of work being done on low-carbon energy production in the private,public and partnership realms, both in highly industrialized countries such as the US, Germany andJapan, as well as in China and India. We focus on science innovations which have the dual benefitof addressing greenhouse gas mitigation and potentially delivering cost effective energyalternatives to the poor. We draw on examples from solar and wind energy production, wherescientists are looking at ways to harness more energy from these natural sources, and on energyproduction from biomass products such as wood, agricultural residues and plants where thechallenge is to use the resource more effectively.
Harnessing the sun’s energy
The sun is the most sustainable, plentiful and fundamental of all our energy sources. It makes senseto utilise it as an alternative to oil-based power and as a way for developing countries to ‘leapfrog’existing energy options. Solar energy can be a cleaner, healthier, more flexible and cheapertechnology.
Energy from the sun can be harnessed in two ways. The first is to concentrate the sun’s energyusing lenses or mirrors, heat up a liquid, and use the heat source to power an engine. The second,and more widely known method, is to use photovoltaic cells which directly convert solar energy toelectricity. Both these applications have the potential to become important components in theglobal energy supply mix and new efforts to combine these two technologies are yielding evenmore efficient systems. Solar energy technology is now at the point where wind energy was adecade ago – poised to make big improvements.43
Concentrating solar thermal systems
Energy from the sun was first used to power a steam engine as early as 1866. Since then a widevariety of ‘concentrating solar thermal’ (CST) methods have been developed to capture andconcentrate the sun’s rays and use the resulting heat source to power irrigation, refrigeration,locomotion or even conventional power plants. The basic components of CST systems include: areceiving device, such as parabolic trough, dish or chimney, a tracking system to follow the sun, anda power generation system. Advances in all three areas are continually making these systems moreefficient and practical (Box 7.11).
At the Sandia National Laboratories in New Mexico, more than a decade of steadyimprovements have yielded a highly productive receiver-engine configuration. Eighty twomirrors on 38 foot wide parabolic Stirling dish ‘suncatchers’ concentrate light onto a receiverat the dish’s focal point, heating liquid which is used by a simple Stirling engine to generatepower. The suncatchers produce a heat at the foci equivalent to 13,000 suns. Engineers arenow looking at new ways to store the energy, incorporating thermal storage tanks to keepengines running after the sun has set.44
Box 7.11 New ways of concentrating the sun’s energy
248
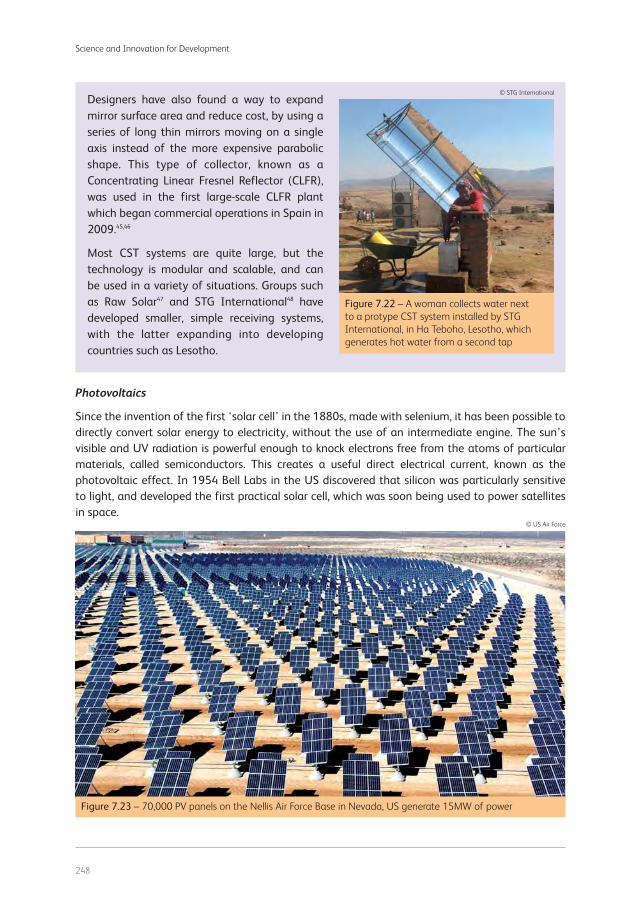
Science and Innovation for Development
Designers have also found a way to expandmirror surface area and reduce cost, by using aseries of long thin mirrors moving on a singleaxis instead of the more expensive parabolicshape. This type of collector, known as aConcentrating Linear Fresnel Reflector (CLFR),was used in the first large-scale CLFR plantwhich began commercial operations in Spain in2009.45,46
Most CST systems are quite large, but thetechnology is modular and scalable, and canbe used in a variety of situations. Groups suchas Raw Solar47 and STG International48 havedeveloped smaller, simple receiving systems,with the latter expanding into developingcountries such as Lesotho.
© STG International
Figure 7.22 – A woman collects water next
to a protype CST system installed by STG
International, in Ha Teboho, Lesotho, which
generates hot water from a second tap
Photovoltaics
Since the invention of the first ‘solar cell’ in the 1880s, made with selenium, it has been possible todirectly convert solar energy to electricity, without the use of an intermediate engine. The sun’svisible and UV radiation is powerful enough to knock electrons free from the atoms of particularmaterials, called semiconductors. This creates a useful direct electrical current, known as thephotovoltaic effect. In 1954 Bell Labs in the US discovered that silicon was particularly sensitiveto light, and developed the first practical solar cell, which was soon being used to power satellitesin space.
© US Air Force
Figure 7.23 – 70,000 PV panels on the Nellis Air Force Base in Nevada, US generate 15MW of power
249
Achieving Environmental Sustainability 07
Photovoltaics (PV) are currently the fastest growing source of renewable energy, with capacityincreasing at around 50% per year.43 The first solar cells were able to convert about 6% of thesun’s energy; new crystalline silicon cells now average around 18% efficiency. The price ofproducing energy with PV has fallen but, until recently, was still a long way off from the target of 5cents/kWh needed to compete with coal. With advances in established silicon technology, as wellas the development of ‘thin film’ cells which use new materials, PV is set to become a viablecompetitor.49 As stated in a 2008 issue of Nature, ‘In the future, new manufacturing methods thatuse alternative materials should make the capture of sunlight at least an order of magnitudecheaper than it is now.’50
Solar cells made from purified crystalline silicon have been the mainstay of PV technology since the1950s, and while expensive, partly due to the competition from the high-value silicon-chip market,they have become highly efficient through years of development. SunPower in California, forexample, has introduced a number of small innovations to make their single-crystal silicon cells themost efficient on the market, at about 22%.51 New entrants into the purified silicon productionmarket, such as China, could also bring the price down considerably, making this establishedtechnology more competitive.52
Recently, a new type of photovoltaic technology has emerged in the form of thin-film solar cells(Box 7.12).
Rather than using solid wafers which are generally around two tenths of a millimetre across,thin-film cells are only nanometres to a few micrometers thick, and are produced using cheaper,more flexible, although less efficient and shorter-lasting materials.
The first thin-film cells were produced by depositing vaporized silicon directly onto a glass orstainless steel substrate. New, slightly more efficient cells are now coming onto the marketusing materials such as cadmium telluride (CdTe), and combinations such as copper indiumgallium diselenide (CIGS). New dye-sensitized and organic solar cells are also being researched,which could allow for even greater breakthroughs in customization, flexibility and cost. FirstSolar, currently the largest producer of thin-film cells in the US, is already producing CdTe cellson a large-scale, and there appear to be great opportunities for the new thin-film CIGS.49
Box 7.12 Thin-film solar cells
Finally, promising work is being done in combining CST receivers with PV cells – using magnifiers toconcentrate the sun’s energy and focus it directly onto high-efficiency solar cells, in order to furtherenhance efficiency. The company SUNGRI, also based in California, has produced ‘ExtremeConcentrated Photovoltaic’ (XCPV) units. These systems can magnify the sun’s rays 2,000 times,which when focused on a solar cell, achieve 37% efficiency, and lower production costs to aroundthe 5 cents/kWh target. In order to deal with the extremely high temperatures generated by thefocused light, SUNGRI has incorporated a new cooling system to keep the panels operating safely.Although still in the early stages of development, advances like these are likely to succeed asresearch and development increase to keep up with demand.43
All of these new developments are making solar technologies an increasingly practical solution toproviding energy to consumers in developing countries. The use of solar technologies, particularly

250
Science and Innovation for Development
PV panels, has risen dramatically in the last few years, with production and use in China, forexample, expanding rapidly. Many businesses and households across Africa are beginning to buyand sell PV panels and other small solar products. A number of non-profit groups are also workingin this area, with the aim of fighting poverty and climate change simultaneously. The Solar ElectricLight Fund (SELF)53 began in 1990 in the US, the UK group SolarAid, was founded in 200654 andLighting Africa, a joint International Finance Corporation and World Bank programme, works tosupport the private sector in developing off-grid lighting technologies tailored for Africanconsumers.55 Box 7.13 below looks at some of the projects being pursued by SolarAid.
When the UK Solar Energy company Solarcenturywas founded in 1998, the owner decided todonate 5% of its net profits to help thepoorest communities access solar energy. WhenSolarcentury eventually netted profits in 2006, thecharity SolarAid was formed.
SolarAid works by helping developing countries by-pass dirty and expensive fossil-fuelled energyoptions, and benefit from specially tailored solarpowered technologies. The group brings theprofessional commercial sector knowledge fromSolarcentury, emphasizing entrepreneurialism andinnovation, to both its ‘micro’ and ‘macro’ solarapproaches.
First, at the micro-level, SolarAid works with individuals to train them as entrepreneurs,teaching them about technical and business skills so that they can sell and repair productssuch as solar LED lights and solar chargers for radios and mobile phones. The technologies aresimple – the light bulbs and chargers are powered through monocrystalline PV panels – andthe products are mass produced cheaply and efficiently in China for the African market.The merchants make money, and the consumers save money which they would have spent onkerosene, disposable batteries, and travelling to access phone charging stations.
SolarAid also works at the more traditional macro-scale, working with communities to installPV panels on schools, health clinics, and community centres. By bringing electricity to thesebuildings many new opportunities emerge, including teaching at night and running televisionsand computers, safe storage of vaccines and medicines in refrigerators, and the option forcommunities to run adult training classes, or just get-together in the evenings.
Box 7.13 Bringing the solar business to the poor54,56
© Andy Bodycombe
Figure 7.24 – ‘Sunnymoney’ franchisee
Moses Owiti demonstrates the panel he is
selling in Kenya which can power a radio
or LED light or charge a mobile phone
Energy from the wind
Humans have been harnessing the energy from wind for over 2,000 years, constructing simplewindmills to grind grain and pump water. The first wind turbines built to directly convert the wind’skinetic energy into electricity were constructed as early as the late 1880’s. These were used tocharge batteries and run electric generators, mainly on farms and in other areas without access to
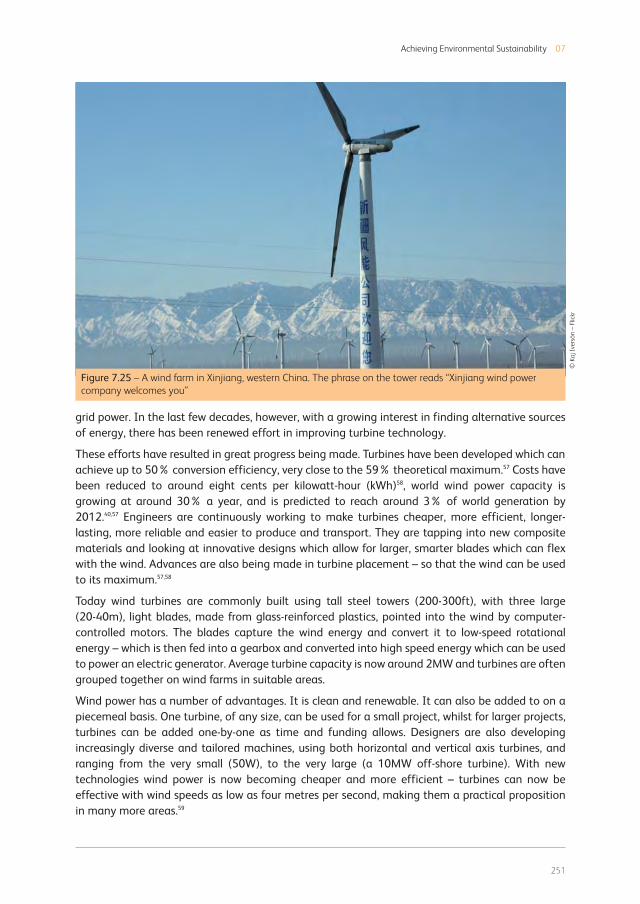
251
Achieving Environmental Sustainability 07
grid power. In the last few decades, however, with a growing interest in finding alternative sourcesof energy, there has been renewed effort in improving turbine technology.
These efforts have resulted in great progress being made. Turbines have been developed which canachieve up to 50% conversion efficiency, very close to the 59% theoretical maximum.57 Costs havebeen reduced to around eight cents per kilowatt-hour (kWh)58, world wind power capacity isgrowing at around 30% a year, and is predicted to reach around 3% of world generation by2012.40,57 Engineers are continuously working to make turbines cheaper, more efficient, longer-lasting, more reliable and easier to produce and transport. They are tapping into new compositematerials and looking at innovative designs which allow for larger, smarter blades which can flexwith the wind. Advances are also being made in turbine placement – so that the wind can be usedto its maximum.57,58
Today wind turbines are commonly built using tall steel towers (200-300ft), with three large(20-40m), light blades, made from glass-reinforced plastics, pointed into the wind by computer-controlled motors. The blades capture the wind energy and convert it to low-speed rotationalenergy – which is then fed into a gearbox and converted into high speed energy which can be usedto power an electric generator. Average turbine capacity is now around 2MW and turbines are oftengrouped together on wind farms in suitable areas.
Wind power has a number of advantages. It is clean and renewable. It can also be added to on apiecemeal basis. One turbine, of any size, can be used for a small project, whilst for larger projects,turbines can be added one-by-one as time and funding allows. Designers are also developingincreasingly diverse and tailored machines, using both horizontal and vertical axis turbines, andranging from the very small (50W), to the very large (a 10MW off-shore turbine). With newtechnologies wind power is now becoming cheaper and more efficient – turbines can now beeffective with wind speeds as low as four metres per second, making them a practical propositionin many more areas.59
© K
aj
Ive
rsö
n –
Flic
kr
Figure 7.25 – A wind farm in Xinjiang, western China. The phrase on the tower reads “Xinjiang wind power
company welcomes you”
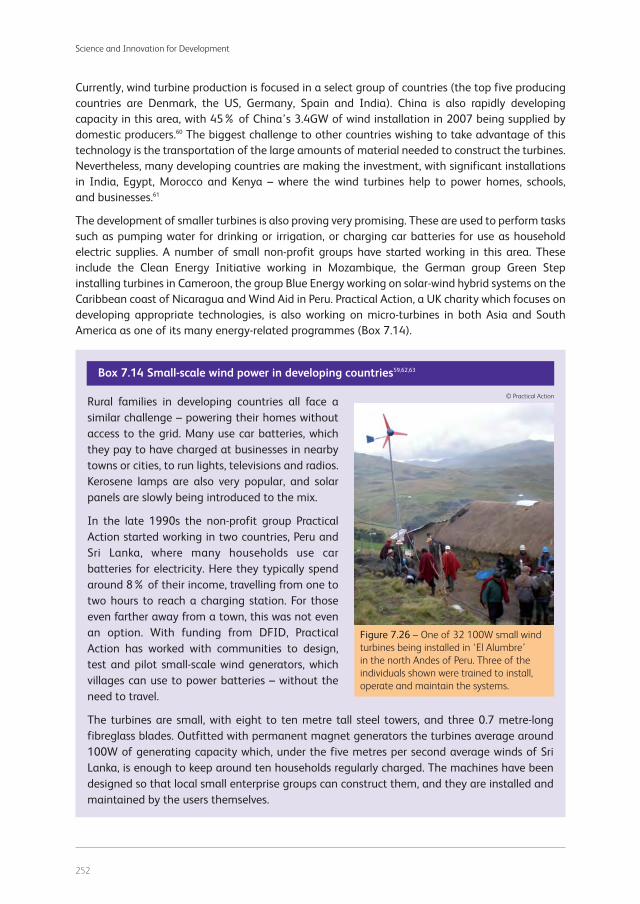
252
Science and Innovation for Development
Rural families in developing countries all face asimilar challenge – powering their homes withoutaccess to the grid. Many use car batteries, whichthey pay to have charged at businesses in nearbytowns or cities, to run lights, televisions and radios.Kerosene lamps are also very popular, and solarpanels are slowly being introduced to the mix.
In the late 1990s the non-profit group PracticalAction started working in two countries, Peru andSri Lanka, where many households use carbatteries for electricity. Here they typically spendaround 8% of their income, travelling from one totwo hours to reach a charging station. For thoseeven farther away from a town, this was not evenan option. With funding from DFID, PracticalAction has worked with communities to design,test and pilot small-scale wind generators, whichvillages can use to power batteries – without theneed to travel.
The turbines are small, with eight to ten metre tall steel towers, and three 0.7 metre-longfibreglass blades. Outfitted with permanent magnet generators the turbines average around100W of generating capacity which, under the five metres per second average winds of SriLanka, is enough to keep around ten households regularly charged. The machines have beendesigned so that local small enterprise groups can construct them, and they are installed andmaintained by the users themselves.
Box 7.14 Small-scale wind power in developing countries59,62,63
© Practical Action
Figure 7.26 – One of 32 100W small wind
turbines being installed in ‘El Alumbre’
in the north Andes of Peru. Three of the
individuals shown were trained to install,
operate and maintain the systems.
Currently, wind turbine production is focused in a select group of countries (the top five producingcountries are Denmark, the US, Germany, Spain and India). China is also rapidly developingcapacity in this area, with 45% of China’s 3.4GW of wind installation in 2007 being supplied bydomestic producers.60 The biggest challenge to other countries wishing to take advantage of thistechnology is the transportation of the large amounts of material needed to construct the turbines.Nevertheless, many developing countries are making the investment, with significant installationsin India, Egypt, Morocco and Kenya – where the wind turbines help to power homes, schools,and businesses.61
The development of smaller turbines is also proving very promising. These are used to perform taskssuch as pumping water for drinking or irrigation, or charging car batteries for use as householdelectric supplies. A number of small non-profit groups have started working in this area. Theseinclude the Clean Energy Initiative working in Mozambique, the German group Green Stepinstalling turbines in Cameroon, the group Blue Energy working on solar-wind hybrid systems on theCaribbean coast of Nicaragua and Wind Aid in Peru. Practical Action, a UK charity which focuses ondeveloping appropriate technologies, is also working on micro-turbines in both Asia and SouthAmerica as one of its many energy-related programmes (Box 7.14).

253
Achieving Environmental Sustainability 07
The machines currently cost around US$700, about one third of the cost of an equivalentmachine constructed in an industrialised country, and are estimated to last for about 20 years.They are competitive with other alternatives, with the cost per kWh being the same or cheaperthan diesel or solar. They also have the added benefits of saving time on travelling,encouraging local ownership and enterprise, and of course, acting as a clean and safe sourceof off-grid energy.
Over the years the technology has caught on, with over 100 units installed in different parts ofPeru, including 34 solar-wind hybrid systems installed by the government. The idea has alsospread to both Bolivia and Ecuador, and in Asia from Sri Lanka to Nepal.
Using biomass for fuel
Biomass, or any organicmaterial which can be usedfor energy production, wasthe first source of energy usedby humans, in the form ofwood for heat and cooking,and it remains an importantcomponent of global energyproduction today. Green plantmaterial is a valuable sourceof stored chemical energy,converted by the plants fromthe sun, through the processof photosynthesis.
Biomass fuels include: woodfuels such as wood, charcoal and forestry residues, which are the mostcommon, energy crops such as sugar and cereals, oil crops such as soya and jatropha, andagricultural and livestock by-products, such as stalks, straw and manure. These fuels may beproduced as solids (e.g, charcoal), liquids (e.g. alcohol, biodiesel) or gases (e.g. methane). Bioenergy,then, is defined as any energy produced directly from biomass, and is considered a renewableenergy source – as long as the materials are harvested sustainably, replaced, or grown for thespecific purpose of energy production.
Since the industrial revolution most developed countries have used less and less biomass for energyproduction. However in recent years, with an increasing move to lower carbon alternatives,bioenergy – especially the growing of crops for the production of fuel for transport – has gained inpopularity. Currently, bioenergy accounts for about 9% of global primary energy supply, althoughthere is a large variation between regions. As of 2001 developed countries obtained only about 5%of their energy from biomass, while developing countries averaged around 22%, with Asia at 19%and Sub-Saharan Africa at 60%.64 In rural areas of developing countries, the figure is often as highas 90% to 95%.65,66 This is the largest used source of renewable energy both globally and indeveloping countries, dwarfing the still growing hydroelectric (2.2% of global supply), wind(0.125%), solar and tide (0.075%), and other renewable industries (Figure 7.27).67
Using more biomass for energy holds potential for billions of people without access to electricity orimproved cooking fuels. The challenge, however, is to make energy production from biomass
Solid biomass/
charcoal 72.9%
Renewable
combustibles
and waste
77.3%
Wind (1.0%)
Hydro (17.7%)
Solar, tide
(0.6%)
Geothermal
(3.3%)
Liquid biomass 2.4%
Renewable
Municipal
Waste 0.9%
Gas from
biomass 1.1%
Figure 7.27 – Biomass dominates world renewable energy supply
© IEA 2009
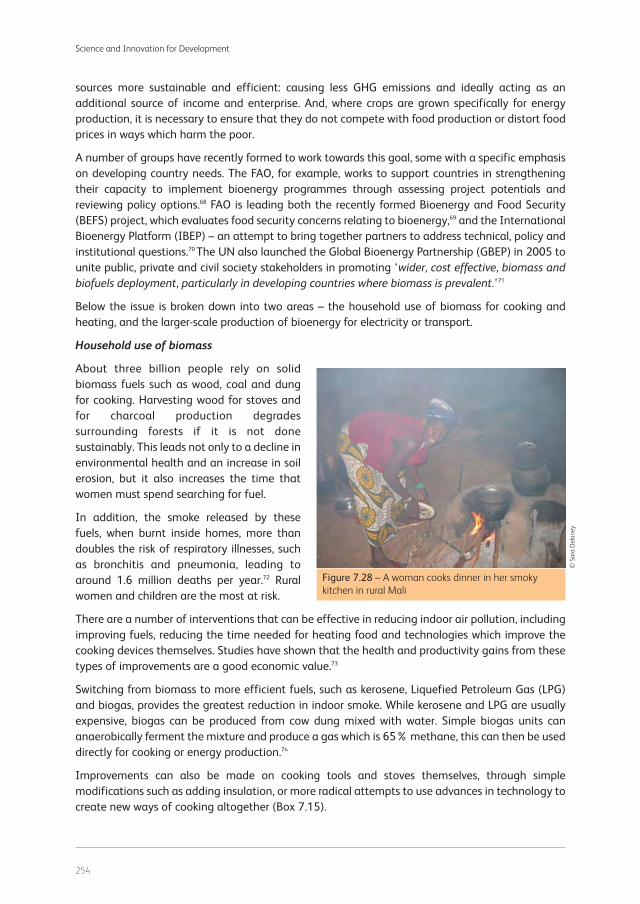
254
Science and Innovation for Development
sources more sustainable and efficient: causing less GHG emissions and ideally acting as anadditional source of income and enterprise. And, where crops are grown specifically for energyproduction, it is necessary to ensure that they do not compete with food production or distort foodprices in ways which harm the poor.
A number of groups have recently formed to work towards this goal, some with a specific emphasison developing country needs. The FAO, for example, works to support countries in strengtheningtheir capacity to implement bioenergy programmes through assessing project potentials andreviewing policy options.68 FAO is leading both the recently formed Bioenergy and Food Security(BEFS) project, which evaluates food security concerns relating to bioenergy,69 and the InternationalBioenergy Platform (IBEP) – an attempt to bring together partners to address technical, policy andinstitutional questions.70 The UN also launched the Global Bioenergy Partnership (GBEP) in 2005 tounite public, private and civil society stakeholders in promoting ‘wider, cost effective, biomass andbiofuels deployment, particularly in developing countries where biomass is prevalent.’71
Below the issue is broken down into two areas – the household use of biomass for cooking andheating, and the larger-scale production of bioenergy for electricity or transport.
Household use of biomass
About three billion people rely on solidbiomass fuels such as wood, coal and dungfor cooking. Harvesting wood for stoves andfor charcoal production degradessurrounding forests if it is not donesustainably. This leads not only to a decline inenvironmental health and an increase in soilerosion, but it also increases the time thatwomen must spend searching for fuel.
In addition, the smoke released by thesefuels, when burnt inside homes, more thandoubles the risk of respiratory illnesses, suchas bronchitis and pneumonia, leading toaround 1.6 million deaths per year.72 Ruralwomen and children are the most at risk.
There are a number of interventions that can be effective in reducing indoor air pollution, includingimproving fuels, reducing the time needed for heating food and technologies which improve thecooking devices themselves. Studies have shown that the health and productivity gains from thesetypes of improvements are a good economic value.73
Switching from biomass to more efficient fuels, such as kerosene, Liquefied Petroleum Gas (LPG)and biogas, provides the greatest reduction in indoor smoke. While kerosene and LPG are usuallyexpensive, biogas can be produced from cow dung mixed with water. Simple biogas units cananaerobically ferment the mixture and produce a gas which is 65% methane, this can then be useddirectly for cooking or energy production.74
Improvements can also be made on cooking tools and stoves themselves, through simplemodifications such as adding insulation, or more radical attempts to use advances in technology tocreate new ways of cooking altogether (Box 7.15).
© S
ara
De
lan
ey
Figure 7.28 – A woman cooks dinner in her smoky
kitchen in rural Mali
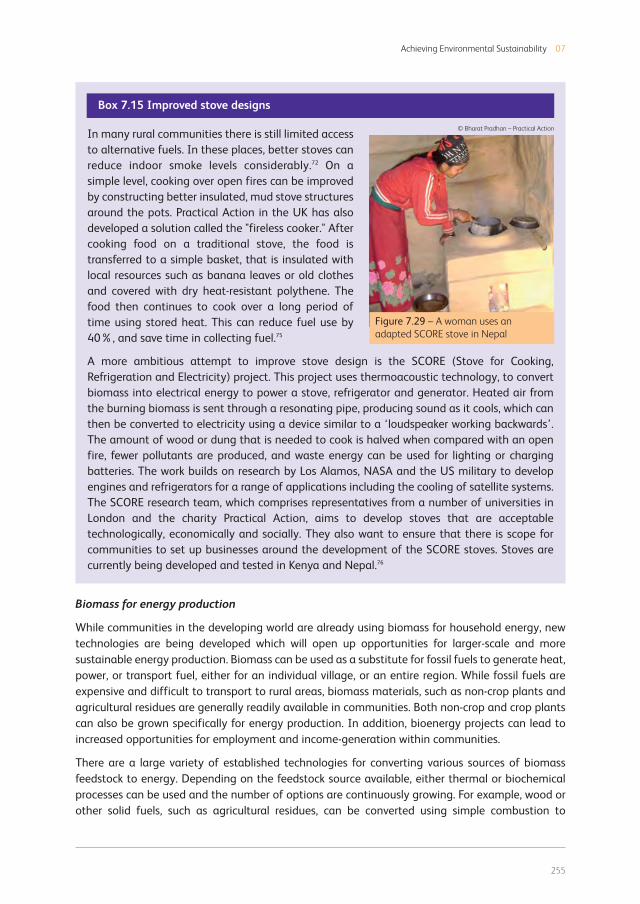
255
Achieving Environmental Sustainability 07
In many rural communities there is still limited accessto alternative fuels. In these places, better stoves canreduce indoor smoke levels considerably.72 On asimple level, cooking over open fires can be improvedby constructing better insulated, mud stove structuresaround the pots. Practical Action in the UK has alsodeveloped a solution called the "fireless cooker." Aftercooking food on a traditional stove, the food istransferred to a simple basket, that is insulated withlocal resources such as banana leaves or old clothesand covered with dry heat-resistant polythene. Thefood then continues to cook over a long period oftime using stored heat. This can reduce fuel use by40%, and save time in collecting fuel.75
A more ambitious attempt to improve stove design is the SCORE (Stove for Cooking,Refrigeration and Electricity) project. This project uses thermoacoustic technology, to convertbiomass into electrical energy to power a stove, refrigerator and generator. Heated air fromthe burning biomass is sent through a resonating pipe, producing sound as it cools, which canthen be converted to electricity using a device similar to a ‘loudspeaker working backwards’.The amount of wood or dung that is needed to cook is halved when compared with an openfire, fewer pollutants are produced, and waste energy can be used for lighting or chargingbatteries. The work builds on research by Los Alamos, NASA and the US military to developengines and refrigerators for a range of applications including the cooling of satellite systems.The SCORE research team, which comprises representatives from a number of universities inLondon and the charity Practical Action, aims to develop stoves that are acceptabletechnologically, economically and socially. They also want to ensure that there is scope forcommunities to set up businesses around the development of the SCORE stoves. Stoves arecurrently being developed and tested in Kenya and Nepal.76
Box 7.15 Improved stove designs
© Bharat Pradhan – Practical Action
Figure 7.29 – A woman uses an
adapted SCORE stove in Nepal
Biomass for energy production
While communities in the developing world are already using biomass for household energy, newtechnologies are being developed which will open up opportunities for larger-scale and moresustainable energy production. Biomass can be used as a substitute for fossil fuels to generate heat,power, or transport fuel, either for an individual village, or an entire region. While fossil fuels areexpensive and difficult to transport to rural areas, biomass materials, such as non-crop plants andagricultural residues are generally readily available in communities. Both non-crop and crop plantscan also be grown specifically for energy production. In addition, bioenergy projects can lead toincreased opportunities for employment and income-generation within communities.
There are a large variety of established technologies for converting various sources of biomassfeedstock to energy. Depending on the feedstock source available, either thermal or biochemicalprocesses can be used and the number of options are continuously growing. For example, wood orother solid fuels, such as agricultural residues, can be converted using simple combustion to

256
Science and Innovation for Development
produce heat which can be captured, or through gasification, where the fuel is partially burned ata high temperature to produce a synthetic gas. Manure and other animal or vegetable waste, canbe converted using the biochemical process of anaerobic digestion, where the organic materials arebroken down by microbial activity in the absence of air and at slightly elevated temperatures. Thisproduces biogas (60% methane and 40% CO2), which can be used for cooking or lighting, fuel orelectricity generation using modified gas engines or turbines.
Of growing popularity is the use of sugar and starch crops for the production of fuel calledbioethanol. Sugar crops, such as sugar cane, sugar beet and sweet sorghum, and starch crops, suchas maize and cassava can be grown and converted using fermentation methods. The feedstock isground, the sugar is dissolved out and then fed to yeast in a closed, anaerobic chamber. The yeastferments the sugar to produce ethanol which is then distilled to produce bioethanol. This can beused on its own in specialised combustion engines, or mixed with petrol. There are howeverdrawbacks to this method, including the competition it places on land which could otherwise beused to grow food-crops, and the inefficiency of the conversion process.
Finally, oils such as animal fats, waste cooking oil, or those derived from rapeseed, sunflower, soya,palm, or coconut can all be converted through a process called transesterification. The oil is reactedwith an alcohol and a base catalyst splits the oil into glycerine and methyl esters forming biodiesel.The biodiesel can then be used as fuel in a diesel engine. Engines can also be modified to run onless purified forms of oil, such as straight vegetable oil (SVO) or the oil from the seeds of plants suchas Jatropha curcas, described in Box 7.16 below.
In the Garalo commune in southern Mali, 33 villages have successfully united in a local energyproduction project. The area is using oil from the seeds of the shrub Jatropha curcas to powera hybrid power plant, which has the capacity to serve a 13km wide network of households.
Jatropha, known as bagani in Mali, is an inedible perennial shrub which grows widely acrossthe country, thriving in poor soils with little water. The small tree is often planted as a ‘naturalfence’ around crop fields, because its smell and taste repels grazing animals. The RoyalTropical Institute estimates that there are currently more than 22,000 linear kilometres of thebush in Mali.78 Jatropha is a long-term investment – while seed production starts within six tonine months, the plant does not reach maturity for five years, and will remain in constantproduction for up to 25 years, and can live for up to 50 years.79
The seeds of jatropha can be pressed to yield a high-quality oil, due to their 32% oil content,3kg of seed will yield about 1 litre of oil. The seeds are pressed using a locally manufacturedmachine, which itself is powered by jatropha oil – the energy used to press the nuts amountsto less than 10% of the oil obtained. The residues from the seeds are higher in nitrogen andphosphorous than cow dung, and so act as an excellent organic fertiliser that can be used onother food crops or sold.
Experimenters discovered in the early 1990s that jatropha oil could be used to power dieselengines, but at the time diesel prices were low, and switching over did not make economicsense. Now, with oil prices rising, and a commitment by the Malian government to increase
Box 7.16 Jatropha powered rural electrication in Mali77

257
Achieving Environmental Sustainability 07
renewable energy use, jatropha-powered energy production is gaining in popularity. The oil isbeing used to power small-scale generators for a wide-variety of uses, as shown in theEnergiebau example in Chapter 3. In Garalo, however, project leaders are scaling-up this ideaquite dramatically.
Initiated by the Mali Folke Centre (MFC)80 in 2006, the Garalo project in rural electrification isfunded by the FACT Foundation,81 a Dutch group that promotes the use of biofuels for localdevelopment, and Stichting het Groene Woudt (SHGW), another Dutch NGO. A government-supported grant from AMADER, a parastatal company in charge of rural electrification, is alsoused to reduce household tariffs.
The team has worked with the local community to increase jatropha production in the region.Farmers are intercropping jatropha with their normal crops and on land previously usedfor increasingly less profitable cotton production. As of 2008 they had 600 hectares underproduction, but they are eventually hoping to be working on up to 10,000 hectares.The jatropha nuts are harvested by the farmers, processed by the local cooperative using theoil press, and the oil is then sold to the local power company ACCESS at an agreed price.
ACCESS is running a 300kW capacity vegetable oil-dieselhybrid power plant. The group is starting with a 5%jatropha oil blend and plans to slowly scale-up to 100%by 2013 as jatropha production increases. The power isthen sold back to connected households in the area. Asof April 2009, 283 connections had been set up, whichputs the plant at about 23% capacity. Around ten newconnections are being added each month, with 90%recovery of bills reported.82 While the project is still in thebeginning stages, all of the necessary institutionalconnections and agreements are in place for a projectwhich will not only bring electricity, but will also generateincome for the community.
© Wikimedia commons/Immersia
Figure 7.30 – Jatropha curcas
© R. K. Henning – www.jatropha.org
Figure 7.31 – Extracting oil from
jatropha seeds using a press
258
Science and Innovation for Development
A number of challenges need to be addressed in order to move to successful and sustainable use ofbiomass for large-scale production. These include: competition with food production, the need forstable land ownership due to the long-term commitment needed, and technical and market supportfor the production process. Some of these needs are being addressed through new conversiontechnologies, including second-generation bioethanol and biodiesel which will enable synthesis ofpreviously unusable plant products. This will make processing cheaper and easier. Lessons are alsobeing learned and documented as current projects progress, which will help in the development ofmore appropriate institutional and policy support.
5. Water supply and sanitation
Despite its critical importance to international development, and its scarcity in many poorcountries, there is no headline MDG for water. In MDG 7, the subject is split between water resourceconservation, as one of a number of natural resources for conservation and restoration, and thespecific target of sustainable access to safe drinking water and basic sanitation. This divisionreflects a long-standing split of research in this area between ecologists and hydrologists, whoaddress the generation and distribution of water resources arising from catchments, and engineersand health specialists who have a specific interest in the supply of clean, safe water and sanitationto communities.
Needless to say, this historical division of effort on water issues is rather artificial. Watersheds mustbe managed to supply water sustainably to a wide range of stakeholders, not just households withtheir needs for safe water for drinking, washing and cooking, but to agriculture and industry as well.This challenge of sharing a limited resource across a range of societal needs cannot be achievedwithout good water governance, at the local, national and international level. As with otherelements of MDG 7, improvements in policy are key to making progress, and science innovationcan support this process by providing tools for monitoring, measuring and valuing, and in somecases by developing new enabling technologies. However, many of the technologies required foraddressing the water needs of the poor, from pumps to filters, are already available and onlyneed deployment.
Bearing in mind the overriding need for good water governance, the specific demand for cleanwater for drinking and sanitation enjoys a high profile because of its implications for human health.Water and sanitation are intimately linked. Poor sanitation, and particularly the spread of diseasefrom person to person by contact with excrement, is mediated by the availability and sources ofwater for drinking and washing in many communities. The available data suggests that 884 millionpeople currently lack access to safe water and 2.5 billion to basic sanitation.83 About 1.5 millionchildren die each year due to diarrhoea, primarily caused by unsafe drinking water and inadequatehygiene and sanitation. This is equivalent to 170 child deaths from diarrhoea per hour.84
Indeed, it will be virtually impossible to achieve the infant and maternal mortality targets of theMDGs without improving poor people’s access to safe water and sanitation facilities. In addition,the need to collect water, and the absence of toilet and sanitary towel disposal facilities havenegative impacts on girls’ attendance at school, thus hampering progress towards the universalprimary education and gender equality targets. Water supply and sanitation therefore represent animportant point of leverage for several of the MDGs.

259
Achieving Environmental Sustainability 07
In order to achieve the water and sanitation targets, as of 2005, about 175,000 people needed togain access to safe water and 350,000 people to basic sanitation every day until 2015.85 However,it is now clear that at current rates of progress, this water target will not be achieved in manycountries in Sub-Saharan Africa and the sanitation target will be missed in both Africa and Asia by700 million people.83
The reasons for this are diverse and many relate to governance and institutions. Water andsanitation are generally not given a high priority in government. Demand for sanitation is notalways clearly expressed and its implementation involves infrastructure and service, as well ashygiene promotion programmes. Responsibilities for different parts of the problem may lie indifferent ministries, which makes progress slow, while different donors and development agenciesfrequently take an individual approach within a given country.86
Donor assistance for water and sanitation has beensteadily increasing since 2001,87 as has political support forthe sector. The UN’s Water Supply and SanitationCollaborative Council (WSSCC) launched the Global WashCampaign in 2004,88 2008 was designated theInternational Year of Sanitation89 and the GlobalSanitation Fund was opened the same year. However, aidin this sector is often poorly targeted, with only about 24%going to Sub-Saharan Africa.90
Supply of clean water
Infrastructure is a key constraint to water supply,particularly in rural areas, where 70% of the people livewithout clean water and 70% have inadequate sanitation.Extensive research in recent decades has led to a range ofintermediate technologies which are relatively low cost,easy to maintain and appropriate to local, social, financialand geographical conditions in the developing world.
© D
FID
Figure 7.32 – A young woman pulls water from a well in Mali
© D
om
inic
Sa
nso
ni –
Wo
rld
Ba
nk
Figure 7.33 – Water from a community
tap in Sri Lanka

260
Science and Innovation for Development
Institutions like Water Aid promote a portfolio of technologies for water sourcing and provideguidance to help communities select and build the most appropriate technology for their needs,whilst encouraging and supporting the development of new technologies (Figure 7.34).91
Figure 7.34 – The wide range of proven technologies to increase the supply and quality of water for the rural
poor. They represent largely intermediate technologies, developed by integrating innovative science and an
understanding of local conditions and resources92
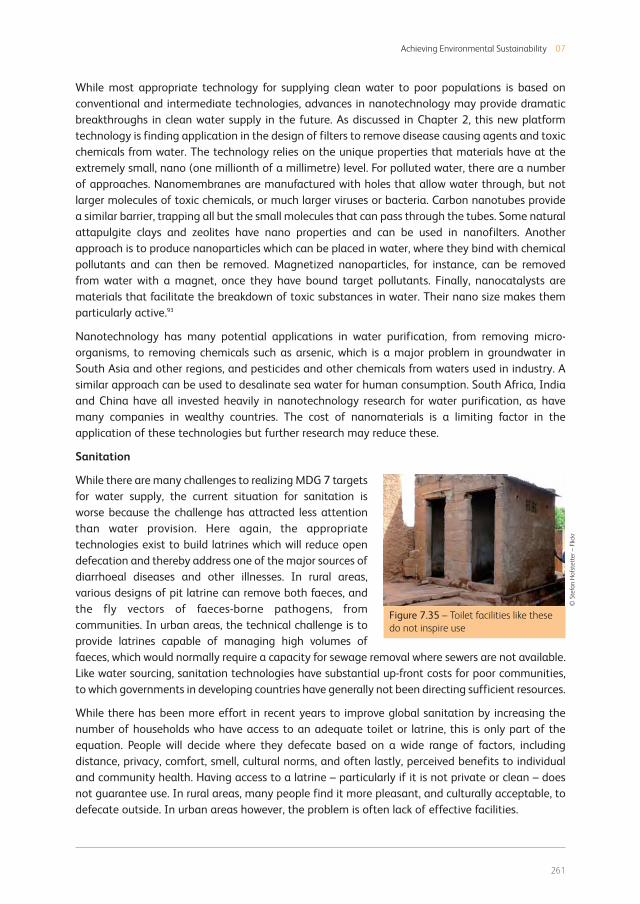
261
Achieving Environmental Sustainability 07
While most appropriate technology for supplying clean water to poor populations is based onconventional and intermediate technologies, advances in nanotechnology may provide dramaticbreakthroughs in clean water supply in the future. As discussed in Chapter 2, this new platformtechnology is finding application in the design of filters to remove disease causing agents and toxicchemicals from water. The technology relies on the unique properties that materials have at theextremely small, nano (one millionth of a millimetre) level. For polluted water, there are a numberof approaches. Nanomembranes are manufactured with holes that allow water through, but notlarger molecules of toxic chemicals, or much larger viruses or bacteria. Carbon nanotubes providea similar barrier, trapping all but the small molecules that can pass through the tubes. Some naturalattapulgite clays and zeolites have nano properties and can be used in nanofilters. Anotherapproach is to produce nanoparticles which can be placed in water, where they bind with chemicalpollutants and can then be removed. Magnetized nanoparticles, for instance, can be removedfrom water with a magnet, once they have bound target pollutants. Finally, nanocatalysts arematerials that facilitate the breakdown of toxic substances in water. Their nano size makes themparticularly active.93
Nanotechnology has many potential applications in water purification, from removing micro-organisms, to removing chemicals such as arsenic, which is a major problem in groundwater inSouth Asia and other regions, and pesticides and other chemicals from waters used in industry. Asimilar approach can be used to desalinate sea water for human consumption. South Africa, Indiaand China have all invested heavily in nanotechnology research for water purification, as havemany companies in wealthy countries. The cost of nanomaterials is a limiting factor in theapplication of these technologies but further research may reduce these.
Sanitation
While there are many challenges to realizing MDG 7 targetsfor water supply, the current situation for sanitation isworse because the challenge has attracted less attentionthan water provision. Here again, the appropriatetechnologies exist to build latrines which will reduce opendefecation and thereby address one of the major sources ofdiarrhoeal diseases and other illnesses. In rural areas,various designs of pit latrine can remove both faeces, andthe fly vectors of faeces-borne pathogens, fromcommunities. In urban areas, the technical challenge is toprovide latrines capable of managing high volumes offaeces, which would normally require a capacity for sewage removal where sewers are not available.Like water sourcing, sanitation technologies have substantial up-front costs for poor communities,to which governments in developing countries have generally not been directing sufficient resources.
While there has been more effort in recent years to improve global sanitation by increasing thenumber of households who have access to an adequate toilet or latrine, this is only part of theequation. People will decide where they defecate based on a wide range of factors, includingdistance, privacy, comfort, smell, cultural norms, and often lastly, perceived benefits to individualand community health. Having access to a latrine – particularly if it is not private or clean – doesnot guarantee use. In rural areas, many people find it more pleasant, and culturally acceptable, todefecate outside. In urban areas however, the problem is often lack of effective facilities.
© S
tefa
n H
ofs
tett
er
–Fl
ickr
Figure 7.35 – Toilet facilities like these
do not inspire use

262
Science and Innovation for Development
The challenges here are broad. Onthe technical side it is important toensure that facilities are beingdesigned which not only provide thenecessary health benefits, but alsorespond to the desires of consumers.
For millions of urban householdsworldwide one of the challenges ofusing a pit latrine which is notconnected to a sewer network, isemptying the latrine. For years,families in both rural and urbanareas have done this task manually –either doing it themselves or hiringothers – and usually dumping theexcreta in uninhabited areas orusing it as compost for fields. In thedeveloping world as a whole, around90% of sewage is discharged,untreated, into rivers, causingpollution, contaminating drinkingwater and harming aquatic life.94
Growing urbanisation is now confounding this problem, with millions migrating to cities, often inunplanned urban settlements, or slums, each year. They are all constructing houses and latrineswhich are not connected to any waste treatment facility. And, in such crowded areas, manualemptying becomes not only hygienically dangerous to those doing the job, but to all those around,and finding a place to dump the waste becomes increasingly difficult. As population densityincreases, it also becomes less feasible to cover a pit, dig a new one and construct a new structure,notwithstanding the cost of doing so. Urban inhabitants are therefore forced to either resort toopen defecation, or use increasingly crowded shared facilities.
All of this adds up to a huge environmental and health problem. While some work has gone intothe development of toilets, very little has been done to address the problems of pit emptying andwaste disposal. Conventional vacuum tankers, which are used for this purpose, cannot operate inthe narrow and crowded slum settlements, and thus attempts have been made to modify theirdesign. In 1988 the Dutch NGO, WASTE, piloted a miniaturized, manually operated version of atanker called MAPET in Dar es Salaam, Tanzania. However, it never really took-off because of thecost (£950) and a number of organisational problems. In 1995 an Irish engineer, Manus Coffey,working with UN-Habitat, developed a similar product powered by a gasoline engine, called theVacutug. This had some success in the slums of Kibera in Kenya. However, the tanker is expensive(~£4,500) to both construct and operate, and while it has been moderately successful, the team hasencountered problems with cost-recovery and manoeuvring the tanker in crowded areas.95,96
A researcher at the London School of Hygiene and Tropical Medicine (LSHTM), Steven Sugden, sawthe need for a simple technology to fill the gap between tankers (of any size) and manual diggers.Box 7.17 describes the inexpensive hand-pump he helped to develop and pilot in Dar es Salaam,and how this has spurred further innovation in the field.
© S
cott
Wa
llace
–W
orl
d B
an
k
Figure 7.36 – The slum area of ‘Favela’ on the outskirts of
Salvador de Bahia in Brazil

263
Achieving Environmental Sustainability 07
Looking to introduce a new technology into thelimited range of latrine-emptying machines, Sugdenapproached Steven Ogden, an agricultural engineer andfarmer in Yorkshire. They came up with the ‘Gulper,’ adirect action hand pump adapted from water pumpprinciples. The Gulper fits into the hole in the latrine slab,and with one or two operators it brings the sludge outthrough an outlet pipe and into a container. Importantly,the Gulper is relatively cheap (~£55 manufacturing pricein Dar es Salaam), durable, small, portable, and can beconstructed with local materials.
Trialling of the product began in Dar Es Salaam in 2007,a city with a population of 2.8 million, only 10% of whichis served by sewers. This causes wide-spread healthproblems. In 2006, 60 to 80% of the city’s hospital cases, and 97% of out-patients at healthcentres, were suffering from sanitation related diseases. In an attempt to reduce this hugeproblem, a group from WaterAid and LSHTM set up local, small-scale entrepreneurs withGulpers, which they can use to empty customer’s latrines, and then transport full containers,on the back of motorcycle based tractors, to the city’s waste treatment plant.
Results have been positive, with local people saying they like using the services of the Gulperoperators. And although the cost is still relatively high, (around £2 to remove 50 litres), it ischeaper than building a new latrine, and it is ‘quick and clean.’ The biggest limitation is theinability of the Gulper to cope with the denser, compacted sludge at the bottom of pits – asthis requires more power to lift. Thus, at the moment, the Gulpers are only dealing with the top70cm of waste.
Continued innovation is required, and Sugden and Ogden have recently developed a newmodel called the ‘Nimbler’. This is based on the rope and washer pulling method used in the‘Elephant’ water pumps.97 The pump is able to draw up thicker sludge and is also constructedentirely from locally available materials such as bicycle parts.
Sugden says that while neither the Gulper nor the Nimbler may be the final product neededto address the issues in Dar es Salaam, or other cities, he thinks that this work may have helpedto ‘catalyse’ work in an area which had been static for decades. International meetings on thesubject are beginning to take place, with UN-Habitat, OXFAM and other NGOs increasinglyrecognising the importance of addressing the full cycle of sanitation management andsupporting the development of the technology needed.
Box 7.17 The Gulper – filling a gap in urban sanitation95,96
The final target of MDG 7 is to reduce the number of people living in urban slums. We will notdiscuss this target in detail here, but would note that the four key challenges for improving the livesof slum dwellers are to improve water, sanitation, living space and building tenure and durability.So far, science innovation has found particular application with the first two, water and sanitation,as discussed above.
© Steven Sugden
Figure 7.37 – The Gulper in use in
Dar es Salaam

264
Science and Innovation for Development
6. Conclusion
The relationship between the environment and development has a complex and sometimesstrained history, particularly with respect to economic growth. Scientific and technologicaladvances in agricultural production, public health, and other areas, have often had negativeenvironmental consequences. The incorporation in the MDGs of environmental targets is thereforesignificant. While some targets of MDG 7 lack the clarity needed to focus effective action, theymake an important first step in integrating environmental targets into a framework fordevelopment.
For agriculture and health, as we have seen, recent scientific innovation has focused largely on thedevelopment of new technologies which will directly benefit the poor. For MDG 7, the contributionof science innovation is rather different. The importance of policy to environmental sustainability,and the need for environmental mainstreaming, has stimulated the development of scientific toolsfor policy making, specifically earth observation, modelling and GIS technologies. Perhaps mostimportantly, through the concept of ecosystem services, science has given policy making the toolsit needs to value the environment so that it can be explicitly incorporated in development goals andprogrammes.
The importance of science and innovation to policy is nowhere more clear than in theunderstanding it has given us of the environmental and societal consequences of climate change.Written today, MDG 7 would place much more emphasis on climate change and on adaptation asa major development challenge. We devote the next two chapters to this issue. As it was written,MDG 7 focused on mitigation of climate change. While the science of climate change mitigationhas its principle application in those developed and emerging economies which are contributingmost to greenhouse gas generation, it has been remarkable to see how the rapid development ofscience for low carbon energy production has generated appropriate technology for low cost energyproduction for the poor.
The opportunity to better link MDG 7 with targets in other MDGs emerges clearly in opportunitiesto improve health through improved cooking stoves and, particularly, improved water supply andsanitation. While many of the technological tools to achieve these aims exist already, there isenormous scope to enhance these intermediate technologies through engineering innovation inmaterials and processes, for instance in the application of nanotechnology to water filtrationsystems in poor communities. This link between environment and health illustrates the kind ofintegration of environmental thinking into development that needs to be developed in futureacross the MDG portfolio.

265
Achieving Environmental Sustainability 07
Chapter 7 references and further reading
1 World Bank. (2008) Global Monitoring Report 2008, MDGs & the Environment: Agenda for Inclusive andSustainable Development. World Bank, Washington, DC.
2 Millennium Ecosystem Assessment. (2005) Ecosystems and Human Well-being: Synthesis. Island Press,Washington, DC. Available at: www.millenniumassessment.org/documents/document.356.aspx.pdf[Accessed 30 Nov 2009].
3 UNEP. (2007) Chapter 7 – Vulnerability of People and the Environment: Challenges and Opportunities,Global Environment Outlook: environment for development (GEO-4). United Nations EnvironmentProgramme, Nairobi.
4 Practical Action. (2009) Climate change and poverty. Available at:practicalaction.org/climate-change/impact [Accessed 30 Nov 2009].
5 WRI. (2005) World Resources 2005 – The Wealth of the Poor: Managing Ecosystems to Fight Poverty.World Resources Institute, Washington DC.
6 UN. (2009) Agenda 21. Available at: www.un.org/esa/dsd/agenda21 [Accessed 30 Nov 2009].
7 World Summit on Sustainable Development 26 Aug to 4 Sept 2002. Available at:www.un.org/events/wssd/ [Accessed 30 Nov 2009].
8 UN Statistics Division. Official list of MDG indicators. Available at:millenniumindicators.un.org/unsd/mdg/Host.aspx?Content=Indicators/OfficialList.htm[Accessed 16 Nov 2009].
9 Dalal-Clayton, B. & Bass, S., (2009) The Challenges of Environmental Mainstreaming. Experience ofintegrating environment into development institutions and decisions. International Institute forEnvironment and Development. London. Available at: www.environmental-mainstreaming.org[Accessed 30 Nov 2009].
10 Prabhu, R. Colfer, C. & Dudley, R., (1999) Guidelines for Developing, Testing and Selecting Criteria andIndicators for Sustainable Forest Management. Center for International Forest Research (CIFOR),Jakarta, Indonesia.
11 CIFOR C&I team. (1999) The CIFOR Criteria and Indicators Generic Template. CIFOR, Jakarta, Indonesia.
12 Defra. (2007) An introductory guide to the valuing of ecosystem services. Department for Environment,Food and Rural Affairs, London.
13 DeFries, R. et al., (2007) Earth observations for estimating greenhouse gas emissions from deforestationin developing countries. Environmental Science & Policy, 10, 385-394.
14 USDA Forest Service. (nd) LIDAR overview. Available at:forsys.cfr.washington.edu/JFSP06/lidar_technology.htm [Accessed 30 Nov 2009].
15 Lewis, S., (2009) Spotlight on satellites for disaster management. SciDev.net, 11 November.Available at: www.scidev.net/en/editorials/spotlight-on-satellites-for-disaster-management-1.html[Accessed 30 Nov 2009].
16 Joyce, K. et al., (2009) A review of the status of satellite remote sensing and image processingtechniques for mapping natural hazards and disasters. Progress in Physical Geography, 33, 183–207.
17 Thenkabail, P. et al., (2006) An irrigated area map of the world (1999) derived from remote sensing.Research Report 105. Colombo, Sri Lanka, International Water Management Institute. Available at:www.iwmi.cgiar.org/Publications/IWMI_Research_Reports/PDF/pub105/RR105.pdf[Accessed 30 Nov 2009].
18 Vlek, P. Bao Le, Q. & Tamene, L., (2008) Land decline in Land-Rich Africa, A creeping disaster in themaking. CGIAR Science Council Secretariat, Rome. Available at: www.sciencecouncil.cgiar.org/fileadmin/user_upload/sciencecouncil/Reports/Land_degradation_complete.pdf [Accessed 30 Nov 2009].
19 Group on Earth Observations. Available at: www.earthobservations.org [Accessed 30 Nov 2009].
20 May, R. & McLean, A., (eds). (2007) Theoretical Ecology. Principles and Applications. Third Edition,Oxford University Press, Oxford.
266
Science and Innovation for Development
21 Beddington, J. Agnew, D. & Clark, C., (2007) Current problems in the management of marine fisheries.Science, 316, 1713-1716.
22 MRAG. (2005) Future Research Priorities for Common Pool Resource Fisheries Management in DevelopingCountries. DFID Fisheries Management Science Programme Key Sheet No 4.Available at: www.fmsp.org.uk/Documents/keylessons/keysheet4.pdf [Accessed 30 Nov 2009].
23 Wong, J., (2006) Developing biometric sampling systems and optimal harvesting methods for medicinaltree bark in southern Africa. Final Technical Report. DFID Forestry Research Programme R8305. DFID,London.
24 Shackleton, C. & Clarke, J., (2007) Research and Management of Miombo Woodlands for Products inSupport of Local Livelihoods. Genesis Analytics, Johannesburg. Available at:www.cifor.cgiar.org/miombo/docs/SilviculturalOptions_December2007-Genesis.pdf[Accessed 30 Nov 2009].
25 Pagiola, S. von Ritter, K. & Bishop, J., (2004). Assessing the Economic Value of Ecosystem Conservation.World Bank Environment Paper 101. World Bank, Washington DC. Available at:cmsdata.iucn.org/downloads/pagiolaritterbishoplong.pdf [Accessed 30 Nov 2009].
26 Valuing the Arc. Available at: valuingthearc.org [Accessed 30 Nov 2009].
27 Eastern Arc Mountains Information Source. Available at: www.easternarc.org [Accessed 30 Nov 2009].
28 Turner, R. and Daily, G., (2008) The Ecosystem Services Framework and Natural Capital Conservation.Environmental and Resource Economics, 39, 25-35.
29 Ehrlich, P. & Ehrlich, A., (1981) Extinction: The Causes and Consequences of the Disappearance ofSpecies. Random House, New York.
30 Settle, W. et al., (1996) Managing tropical rice pests through conservation of generalist natural enemiesand alternative prey. Ecology, 11, 1975-1988.
31 FAO. (2007) The State of the World’s Animal Genetic Resources for Food and Agriculture. Rome, Italy.
32 FAO. (1997) The State of the World’s Plant Genetic Resources for Food and Agriculture. Rome, Italy.
33 Global Crop Diversity Trust. Available at: www.croptrust.org [Accessed 30 Nov 2009].
34 FAO Commission on genetic resources for Food and Agriculture (2009) Draft Second Report on the Stateof the World’s Plant Genetic Resources for Food and Agriculture. Intergovernmental Technical WorkingGroup on Plant Genetic Resources for Food and Agriculture. Rome, Italy.
35 Myers, N. et al., (2000) Biodiversity hotspots for conservation priorities. Nature, 403 (6772), 853–858.
36 Sachs, J. et al., Biodiversity conservation and the Millennium Development Goals. Science, 325,1502-1503.
37 Fisher, B. & Christopher, T., (2007) Poverty and biodiversity: Measuring the overlap of human povertyand the biodiversity hotspots. Ecological Economics, 62, 93-101.
38 McNeely, J. et al., (2005) Invasive Alien Species. A New Synthesis. Island Press, Washington.
39 DWEA. (2009) Working for Water. Department of Water and Environmental Affairs. Republic of SouthAfrica. Available at: www.dwaf.gov.za/wfw/default.asp [Accessed 30 Nov 2009].
40 MacKay, D., (2008) Sustainable Energy – without the hot air. UIT, Cambridge.
41 Ren21. (2009) Renewables Global Status Report, 2009 Update. Renewable Energy Policy Network for the21st century Secretariat, Paris.
42 Sreelata, M., (2009) Doubts raised over India’s plans for solar power. Scidev.net, 14 August. Available at:www.scidev.net/en/news/doubts-raised-over-india-s-plans-for-solar-power-1.html.[Accessed 30 Nov 2009].
43 The Economist. (2008) Another silicon valley? In: A special report on the future of energy.The Economist. 21 June.
44 Hutchingson, A., (2008) Solar Thermal Power May Make Sun-Powered Grid a Reality. Popular Mechanics.November Issue. Available at: www.popularmechanics.com/science/research/4288743.html[Accessed 30 Nov 2009]
267
Achieving Environmental Sustainability 07
45 Winnie, J., (2007) Compact Linear Fresnel Reflector. Available at:jcwinnie.biz/wordpress/?p=2470[Accessed 30 Nov 2009].
46 Novatec-Biosol. (2009) World First in Solar Power Plant Technology. Available at:www.novatec-biosol.com/index.php?article_id=43&clang=1 [Accessed 30 Nov 2009].
47 RawSolar. Available at: raw-solar.com [Accessed 30 Nov 2009]
48 STG International. Available at: www.stginternational.org [Accessed 30 Nov 2009].
49 Nature. (2008) Special Report: Thin Films: ready for their close-up? Nature. 452. 558-559.
50 Nature. (2008) A task of terawatts. Nature. 442. 805.
51 Sunpower Corporation. Available at: us.sunpowercorp.com[Accessed 30 Nov 2009].
52 The Economist. (2008) Silicon rally. The Economist. 30 August 2008.
53 Solar Electric Light Fund. Available at: www.self.org [Accessed 30 Nov 2009].
54 SolarAid. Available at: solar-aid.org [Accessed 30 Nov 2009].
55 Lighting Africa. Available at: www.lightingafrica.org [Accessed 30 Nov 2009].
56 Katie Bliss, SolarAid, [Phone and Email] (Pers. Comm. 25 Nov 2009).
57 The Economist. (2008) Wind of change. The Economist Technology Quarterly. 6 December.
58 The Economist. (2008) Trade winds. In a special report on the future of energy. The Economist. 21 June.
59 Practical Action. (2008) Energy from the Wind. Practical Action Technical Brief. Available at:practicalaction.org/practicalanswers/product_info.php?cPath=21_61&products_id=371&osCsid=f60vvpkfsttct915604upbelv7&attrib=1 [Accessed 30 nov 2009].
60 Sauter, R. & Watson, J., (2008) Technology Leapfrogging: A Review of the Evidence. A report for DFID.Sussex Energy Group. SPRU, University of Sussex, Brighton.
61 Scidev.net. (2009) Harnessing wind power in Africa. 21 August. Available at:www.scidev.net/en/features/harnessing-wind-power-in-africa.html [Accessed 30 Nov 2009].
62 Practical Action. (2008) Small-scale wind power. Available at:practicalaction.org/energy/small_scale_wind_power [Accessed 30 Nov 2009].
63 Teodoro Sanchez from Practical Action. [Email] (Pers comm. 9 September 2009).
64 EarthTrends. (2005) Energy Consumption by Source 2005. International Energy Association.[earthtrends.wri.org/pdf_library/data_tables/ene2_2005.pdf]
65 Demirbas, A. & Demirbas, I., (2007) Importance of rural bioenergy for developing countries.Energy Conversion and Management. 48, 2386–2398.
66 Kammen, D., (2006) Bioenergy in Developing Countries: Experiences and Prospects. 2020 Vision for Food,Agriculture and the Environment. IFPRI Brief 10 of 12.
67 IEA. (2009) Renewables Information 2009. IEA Statistics, International Energy Agency. Paris.
68 FAO Bioenergy. Available at: www.fao.org/bioenergy [Accessed 1 Dec 2009].
69 FAO Bioenergy and Food Security Project. Available at: www.fao.org/bioenergy/foodsecurity/befs[Accessed 1 Dec 2009].
70 SDdimensions. (2006) Introducing the International Bioenergy Platform (IBEP). Available at:www.fao.org/sd/dim_en2/en2_060501_en.htm [Accessed 1 Dec 2009].
71 Global Bioenergy Partnership (GBEP). Available at: www.globalbioenergy.org [Accessed 1 Dec 2009].
72 WHO. (2006) Indoor air pollution – Fuel for life: household energy and health. Available at:www.who.int/indoorair/publications/fuelforlife/en/index.html [Accessed 1 Dec 2009].
73 WHO. (2009) Indoor air pollution – Cost-benefit analysis of interventions. Available at:www.who.int/indoorair/interventions/cost_benefit/en/index.html [Accessed 1 Dec 2009].
74 Practical Action. (2006) Biogas. Practical Action Technical Brief. Available at:practicalaction.org/practicalanswers/product_info.php?products_id=42 [Accessed 1 Dec 2009].
75 Practical Action. (2009) Fireless cooker. Available at: practicalaction.org/fireless-cooker[Accessed 1 Dec 2009].
268
Science and Innovation for Development
76 SCORE research. Available at: www.score.uk.com/research/default.aspx [Accessed 1 Dec 2009].
77 Practical Action Consulting. (2009) Small-Scale Bioenergy Initiatives: Brief description and preliminarylessons on livelihood impacts from case studies in Asia, Latin America and Africa. Prepared for PISCESand FAO by Practical Action Consulting.
78 Lars., (2007) African farmers in Mali discover Jatropha weed as biofuels crop. Practical Environmentalist.Available at: www.practicalenvironmentalist.com/gardening/african-farmers-in-mali-discover-jatropha-weed-as-biofuel-crop.htm [Accessed 1 Dec 2009].
79 Jatropha Shop. (2008) Jatropha curcas. Available at:www.jatrophashop.com/index.php?option=com_content&task=view&id=65&Itemid=69[Accessed 1 Dec 2009].
80 Mali Folke Center. Available at: www.malifolkecenter.org [Accessed 1 Dec 2009].
81 FACT Foundation. Available at: www.fact-foundation.com [Accessed 1 Dec 2009].
82 FACT Foundation. (2009) Mali Progress Report July 2009. Available at:www.fact-foundation.com/media_en/Progress_Report_Mali_July_2009 [Accessed 1 Dec 2009].
83 WHO/UNICEF Joint Monitoring Programme for water supply and sanitation. (2008) Progress on Drinkingwater and sanitation – Special Focus on Sanitation. UNICEF and WHO, New York.
84 UNICEF/WHO. (2009) Diarrhoea: why children are still dying and what can be done. UNICEF and WHO,New York.
85 WaterAid. (2005) Getting to the Boiling Point, Turning up the heat on water and sanitation.WaterAid, London.
86 Benn, H., (2007) Water for Life – the UK input. Speech for World Water Day 2005 at the RoyalGeographic Society, London. Available at: www.dfid.gov.uk/Documents/speeches/hilary-water-22mar05.pdf [Accessed 1 Dec 2009].
87 OECD. (2008) Aid activities in support of water supply and sanitation 2001-2006.
88 Water Supply and Sanitation Collaborative Council. Available at: www.wsscc.org [Accessed 1 Dec 2009].
89 International Year of Sanitation. Available at: esa.un.org/iys/ [Accessed 1 Dec 2009].
90 Federico Properzi from the UN-Water GLASS Project. [Email] (Pers Comm. 26 November 2009).
91 Water Aid. (2008) Technology Notes. Available at:www.wateraid.org/documents/plugin_documents/technology_notes_2008.pdf [Accessed 1 Dec 2009].
92 WaterAid. Water source options. Available at:www.wateraid.org/documents/water_source_options__a_comparison.pdf [Accessed 1 Dec 2009].
93 Grimshaw, D., (2009) Nanotechnology for clean water: Facts and figures. Scidev.net, 6 May. Available at:www.scidev.net/en/nanotechnology/nanotechnology-for-clean-water/features/nanotechnology-for-clean-water-facts-and-figures.html [Accessed 1 Dec 2009].
94 WaterAid America. Statistics. Available at: www.wateraidamerica.org/what_we_do/statistics.aspx[Accessed 1 Dec 2009].
95 Sugden, S., (2007) Excreta Management in Unplanned Areas. Presentation. Available at:siteresources.worldbank.org/EXTWAT/Resources/4602122-1213366294492/5106220-1213649450319/1.8.1_Excreta_Management_in_Unplanned_Areas.pdf [Accessed 1 Dec 2009].
96 Sugden, S., LSHTM. [Interview] (Pers. Comm. 2009).
97 PumpAid. The Elephant Pump. Available at: www.pumpaid.org/The-Elephant-Pump.shtml[Accessed 1 Dec 2009].