
Achieving Cost‐Effective Energy Efficiency For California …€¦ · · 2011-07-29CHAPTER 3:...
61
California Energy Commission DRAFT STAFF REPORT ACHIEVING COST‐ EFFECTIVE ENERGY EFFICIENCY FOR CALIFORNIA 2011–2020 CALIFORNIA ENERGY COMMISSION Edmund G. Brown Jr., Governor JULY 2011 CEC ‐ 200‐2011‐007‐SD
Transcript of Achieving Cost‐Effective Energy Efficiency For California …€¦ · · 2011-07-29CHAPTER 3:...
California Energy Commission
DRAFT STAFF REPORT
ACHIEVING COST‐EFFECTIVE ENERGY EFFICIENCY FOR CALIFORNIA 2011–2020
CALIFORNIA ENERGY COMMISSION
Edmund G. Brown Jr., Governor
JULY 2011
CEC ‐200‐2011‐007‐SD

CALIFORNIA ENERGY COMMISSION Kae Lewis Che McFarlin Cynthia Rogers Doug Kemmer Primary Authors Che McFarlin Project Manager Bill Junker Manager DEMAND ANALYSIS OFFICE Sylvia Bender Deputy Director ELECTRICITY SUPPLY ANALYSIS DIVISION Robert P. Oglesby Executive Director
DISCLAIMER
Staff members of the California Energy Commission prepared this report. As such, it does not necessarily represent the views of the Energy Commission, its employees, or the State of California. The Energy Commission, the State of California, its employees, contractors and subcontractors make no warrant, express or implied, and assume no legal liability for the information in this report; nor does any party represent that the uses of this information will not infringe upon privately owned rights. This report has not been approved or disapproved by the Energy Commission nor has the Commission passed upon the accuracy or adequacy of the information in this report.

i
ACKNOWLEDGEMENTS
Special thanks to the following for their assistance with this Achieving Cost‐Effective Energy Efficiency for California 2011–2020 report.
Energy Commission Staff: Andrea Gough Consultants to Energy Commission From KEMA: Betty Seto Karin Corfee Fred Coito Eric Swan Roger Wright Carrie Webber California Public Utilities Commission Staff: Carmen Best Utility Representatives: David Walden, Southern California Public Power Authority Scott Tomashefsky, Northern California Power Agency Rachel Radell, Northern California Power Agency Additional Parties: Lara Ettenson, Natural Resources Defense Council Sierra Martinez, Natural Resources Defense Council Gary Cullen, Navigant Consulting

ii
iii
ABSTRACT
Achieving Cost‐Effective Energy Efficiency for California 2011–2020 documents the progress of California utilities’ efforts to increase energy efficiency as mandated by Assembly Bill 2021 (Levine, Chapter 734, Statutes of 2006) and includes an evaluation of publicly owned utilities’ 2010 revised energy efficiency potential estimates and targets, excluding Los Angeles Department of Water and Power and Sacramento Municipal Utility District. The investor‐owned utilities report energy savings of 4,607 gigawatt hours and peak savings of 837 megawatts, figures that exceed their 2010 California Public Utilities Commission (CPUC)‐mandated goals. Natural gas savings of 46 million therms are just short of the CPUC’s 2010 goals. In 2010, the 39 reporting publicly owned utilities provided energy savings of 523 gigawatt hours, a 19 percent decrease from 2009. These utilities achieved 74 percent of their 2010 energy savings target set in 2007. The publicly owned utilities continued submitting evaluation reports through 2009 validating these reported savings. The decline is largely due to the completion of a major lighting program at Los Angeles Department of Water and Power in 2009.
Thirty‐six utilities updated efficiency potential estimates and derived new targets. The Energy Commission evaluated the method, potential estimates, and targets. While the 2010 technical and economic efficiency potentials differed from the levels developed in 2007, the targets derived by the utilities are very similar. Although some utilities project 10 percent of forecasted 2020 energy consumption savings over 10 years as mandated by AB 2021, the aggregated target is under 7 percent. Most publicly owned utilities could meet AB 2021’s consumption reduction target by increasing customer incentive levels.
Keywords: Energy efficiency, savings, demand, reduction, peak, electricity, consumption, potential, targets, evaluation, goals, measurement, verification, Assembly Bill 2021, Senate Bill 1037, investor‐owned utilities, publicly owned utilities Please use the following citation for this report: Lewis, Kae, Che McFarlin, Cynthia Rogers, Doug Kemmer. 2011. Achieving Cost‐Effective Energy Efficiency for California 2011–2020. California Energy Commission, Electricity Supply Analysis Division. CEC‐200‐2011‐007‐SD.
iv
TABLE OF CONTENTS
Page
ABSTRACT ........................................................................................................................................ iii
EXECUTIVE SUMMARY .................................................................................................................. 1
CHAPTER 1: Introduction and Background ................................................................................. 5
Triennial Statewide Estimate of Efficiency Potential and Targets: 2011 Status ...................... 8
Organization of This Report ...................................................................................................... 8
CHAPTER 2: Staff Assessment of Utilities’ Progress in 2010 .................................................. 10
Investor‐Owned Utilities’ Energy Efficiency Savings and Expenditures .............................. 10
Current and Future Program Portfolios (2010–2014) ........................................................... 10
Reported and Evaluated Efficiency Program Savings (2009–2010) .................................... 10
Publicly Owned Utilities’ Energy Efficiency Program Metrics ............................................... 11
Annual Expenditures on Energy Efficiency Programs ........................................................ 12
Energy Efficiency Program Expenditures .............................................................................. 13
Annual Energy and Peak Savings Relative to Adopted Targets ........................................ 14
Annual Energy Savings as a Percentage of Total Utility Sales ........................................... 17
Cost‐Effectiveness of Energy Efficiency Program Portfolios .............................................. 17
Staff Assessment of Publicly Owned Utilities’ Progress in 2010 ............................................ 18
Publicly Owned Utilities’ 2010 Reported Savings Relative to Targets .............................. 19
Summary and Conclusions .......................................................................................................... 20
CHAPTER 3: Evaluation and Verification of POU Efficiency Program Savings ................. 22
Status of POU Compliance and Energy Commission Activities ........................................ 22
Energy Commission Assessment of POU EM&V and Related Activities ......................... 24
Challenges of Implementing EM&V for POUs ......................................................................... 25
Energy Commission Approach to POU EM&V Going Forward ............................................ 26
CHAPTER 4: Status of Statewide Estimate of Energy Efficiency Potential and Targets for 2011–2020 ............................................................................................................................... 28
California POU Energy Efficiency and Resource Assessment Model ............................... 30

v
Technical and Economic Potential Estimates ........................................................................ 31
Market Potential Estimates ...................................................................................................... 33
Assessment of Annual Energy and Peak Savings Targets ....................................................... 34
Conclusions .................................................................................................................................... 37
Chapter 5: Recommendations ........................................................................................................ 39
Information Requested to Interpret Efficiency Progress .......................................................... 39
Staff Recommendations ............................................................................................................ 39
POU Efficiency Evaluation, Measurement, and Verification .................................................. 40
Staff Recommendations ............................................................................................................ 40
POU Potential Estimates and Target Process in 2010–2011 ..................................................... 41
Staff Recommendations ............................................................................................................ 41
GLOSSARY ....................................................................................................................................... 43
APPENDIX A: Publicly Owned Utilities’ Efficiency Targets 2011–2020 ............................. A‐1
APPENDIX B: Investor‐Owned Utilities’ Efficiency Targets, Reported and Evaluated Savings for 2006–2010 ................................................................. B‐1
ATTACHMENT A: KEMA’s Report on POU’s Revised Energy Efficiency Potential and Targets ............................................................................................................... C‐1
vi
LIST OF FIGURES
Page
Figure 1: Shares of Statewide Electricity Consumption 2009 ........................................................ 5 Figure 2: POUsʹ Annual Energy Efficiency Expenditures and Savings ..................................... 13 Figure 3: POUs’ Efficiency Expenditures as Percentage of Revenue (2009) .............................. 14 Figure 4: POUs’ Annual Energy Savings and Targets ................................................................. 15 Figure 5: POUs’ Annual Peak Demand Savings and Targets ..................................................... 16 Figure 6: POUs’ Energy Savings as a Percentage of Total Sales ................................................. 18 Figure 7: Largest 15 POUsʹ Cumulative Targets, Projected Savings, and Reported Efficiency Savings 2007‐2010 ............................................................................... 20
Figure 8: Cumulative Targets as Percent of 2020 Energy Use ..................................................... 37
LIST OF TABLES
Page
Table 1: IOUs’ and POUs’ 2009 and 2010 Savings and Expenditures .......................................... 2 Table 2: Estimated Potentials for Publicly Owned Utilities (Excluding SMUD and LADWP) ................................................................................................... 4
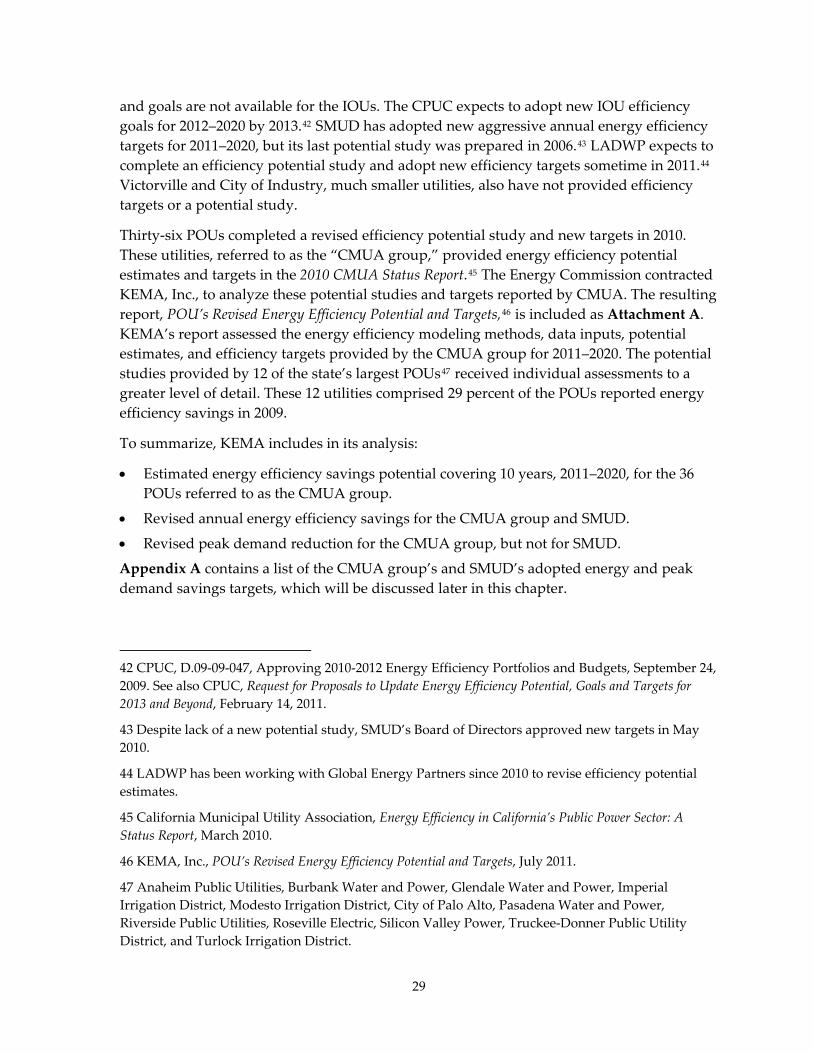
Table 3: IOUs’ 2010 Goals, Savings, Performance Against Goals, and Expenditures ............. 11 Table 4: EM&V Status of Publicly Owned Utilities as of April 2011 .......................................... 23 Table 5: Timeline for Model Updates and Target Adoption ....................................................... 31 Table 6: Estimated Potential for POUs (Excluding SMUD and LADWP) ................................. 32 Table 7: 2020 Market Potential by Sector........................................................................................ 34 Table 8: 2020 Energy Savings Targets ............................................................................................. 35 Table 9: 2020 Peak Demand Savings Targets ................................................................................. 35 Table A‐1: Publicly Owned Utilities Annual Energy Savings Targets 2011–2020 .................. A‐2 Table A‐2: Publicly Owned Utilities Peak Demand/Targets 2011–2020 .................................. A‐3 Table B‐1: IOU Goals, Savings, and Percent of Goals ................................................................. B‐2 Table B‐1: IOU Goals, Savings, and Percent of Goals (Continued) .......................................... B‐3
1
EXECUTIVE SUMMARY
Achieving Cost‐Effective Energy Efficiency for California 2011–2020 fulfills the following requirements of Assembly Bill 2021 (Levine, Chapter 734, Statutes of 2006):
• Develop statewide estimates of potentially achievable energy efficiency savings in consultation with the California Public Utilities Commission (CPUC) and the publicly owned utilities (POUs).
• Establish targets for statewide annual energy efficiency savings and demand reduction for the next 10‐year period.
• Compare publicly owned utility annual targets to their actual energy efficiency savings and demand reductions.
• Propose improvements in setting or meeting annual targets.
• Recommend to the POUs, the Legislature, and the Governor any improvements that could be made in the level of aggregate achievement by POUs or in the level of achievement by any individual POU.
In the interest of promoting increased energy efficiency and reduced energy consumption for all California utilities, Assembly Bill 2021 requires the California Energy Commission to evaluate and report annually on investor‐owned utilities (IOU) and POUs’ progress of their energy efficiency programs and independent evaluation of reported energy savings. In addition, every three years, in coordination with the CPUC (for the IOUs) and the POUs, the Energy Commission will develop statewide 10‐year energy efficiency potential estimates and savings targets for California’s utilities. The Energy Commission reports progress by utilities in implementing these requirements of Assembly Bill 2021 as part of its biennial Integrated Energy Policy Report (IEPR).
The IOUs administer efficiency programs under the CPUC’s Decision 09‐09‐047, which approved the investor‐owned utilities’ efficiency program portfolios for 2010–2012 with a total budget of $3.1 billion. The combined investor‐owned utilities reported 4,607 gigawatt hours (GWh) of annual energy savings, 837 megawatts (MW) of peak savings, and 46 million therms of natural gas savings in 2010, which exceeded their 2010 CPUC‐mandated goals. The 2010 natural gas savings fell just a bit short of the CPUC’s natural gas goals for 2010.
The 2010 IOU’s savings numbers are still ex ante savings, that is, self‐reported savings that have not been verified by third‐party evaluators. However, measurement and verification studies completed on 2006–2008 programs found that verified efficiency program savings were substantially less than reported. The IOUs reported achieving 151 percent of their energy savings goals during 2009; however, the evaluation report indicated that the utilities achieved 83 percent of their goals for that period.
In 2010, POUs spent a total of $123 million on energy efficiency programs, a 15 percent decrease from 2009 and the first drop in energy efficiency program spending since 2006

(Table 1). Likewise, both energy and peak savings declined collectively for the POUs for the first time since 2006. In 2010, the 39 reporting POUs provided 523 GWh of electric energy savings, a decrease of 19 percent from 2009. The POUs achieved 74 percent of their 2010 collective energy savings target set in 2007. In 2010, the POUs collectively provided 94 MW of peak savings, a 20 percent decrease from 2009. The reported peak savings achieved 65 percent of their 2010 collective target set in 2007. The decline in the 2010 numbers, however, is largely due to the completion of a large lighting program at Los Angeles Department of Water and Power (LADWP). Despite 2010’s lackluster economic conditions, mid‐sized and small utilities performed reasonably well in both efficiency spending and savings.
Table 1: IOUs’ and POUs’ 2009 and 2010 Savings and Expenditures
2009 2010 2009 2010GWh 7,387 4,607 644 523 MW 1,314 837 117 94 Therms 96 46 ‐ ‐ Expend itures ($ Millions ) $717 $755 $146 $123
IO Us POUs
Source: Data obtained from the IOUs’ Annual Reports for 2010, http://eega.cpuc.ca.gov/AnnualReports2010.aspx and CMUA, Energy Efficiency in California’s Public Power Sector: A Status Report, March 2008, March 2009, March 2010, March 2011.
This report contains metrics that measure the progress made by the POUs in their energy efficiency programs: trends in reported energy efficiency expenditures, energy efficiency spending as a percentage of revenue, energy savings relative to adopted targets, energy savings as a percentage of total utility sales, and the cost‐effectiveness of efficiency programs.
The POUs’ savings reported in this document have not been modified as a result of independent verification studies. Unlike the investor‐owned utilities for which the CPUC can report evaluated savings, most publicly owned utilities do not yet have consistent evaluation methods. Sixteen POUs filed with the Energy Commission at least one evaluation, measurement, and verification impact study for program years 2007–2009 with some larger utilities filing results for multiple program years. The Energy Commission’s contractor, KEMA, Inc., prepared an assessment using internationally established criteria to analyze these evaluation, measurement, and verification studies. In early 2011, the Energy Commission hosted two workshops for POUs to discuss the evaluation criteria and concerns with implementing practical and credible evaluation, measurement, and verification. The workshops identified specific problems and possible solutions for different types of utilities, with an emphasis on the difficulties of smaller utilities. The Energy Commission will work with the POUs through 2012 to develop concrete evaluation guidelines that will emphasize flexibility and efficiency in fulfilling the AB 2021 requirements for independent verification of efficiency program savings.
2

3
AB 2021 requires POUs to develop energy efficiency potential estimates and targets triennially. Circumstances forced the Energy Commission to comply with one requirement of AB 2021, setting statewide efficiency estimates for all utilities, differently than directed by the legislation. After the passage of AB 2021 in 2006, the Energy Commission first coordinated 10‐year savings targets in December 2007 for both the IOUs and POUs. In 2007, all of these utilities had a recent potential study and set of approved targets and goals from which to develop the statewide savings potential estimate. In 2010–2011, however, revised potential estimates and goals were not available for the IOUs, a revised potential study was not available from Sacramento Municipal Utility District, and neither revised savings potential nor targets were available from LADWP. As a result, the 2011–2020 statewide efficiency target includes 32 percent of all POU savings and 6 percent of all California’s utility savings.
This 2011 report includes an assessment of the efficiency savings targets adopted by the POUs in 2010 (revised from 2007), and the energy efficiency potential methods submitted by the publicly owned utilities to support these targets. Because the two largest utilities, LADWP and SMUD, pursued their potential and targets in another way, this report includes only the mid‐sized and small public utilities.
California Municipal Utilities Association coordinated 36 utilities that used the California Energy Efficiency Resource Assessment Model to develop technical, economic, and market‐ level savings potentials. The legislation requires targets to be cost‐effective, feasible, and reliable. Target criteria were developed for these attributes and used in this evaluation. Methodological criteria were developed and used in the evaluation of the models and inputs.
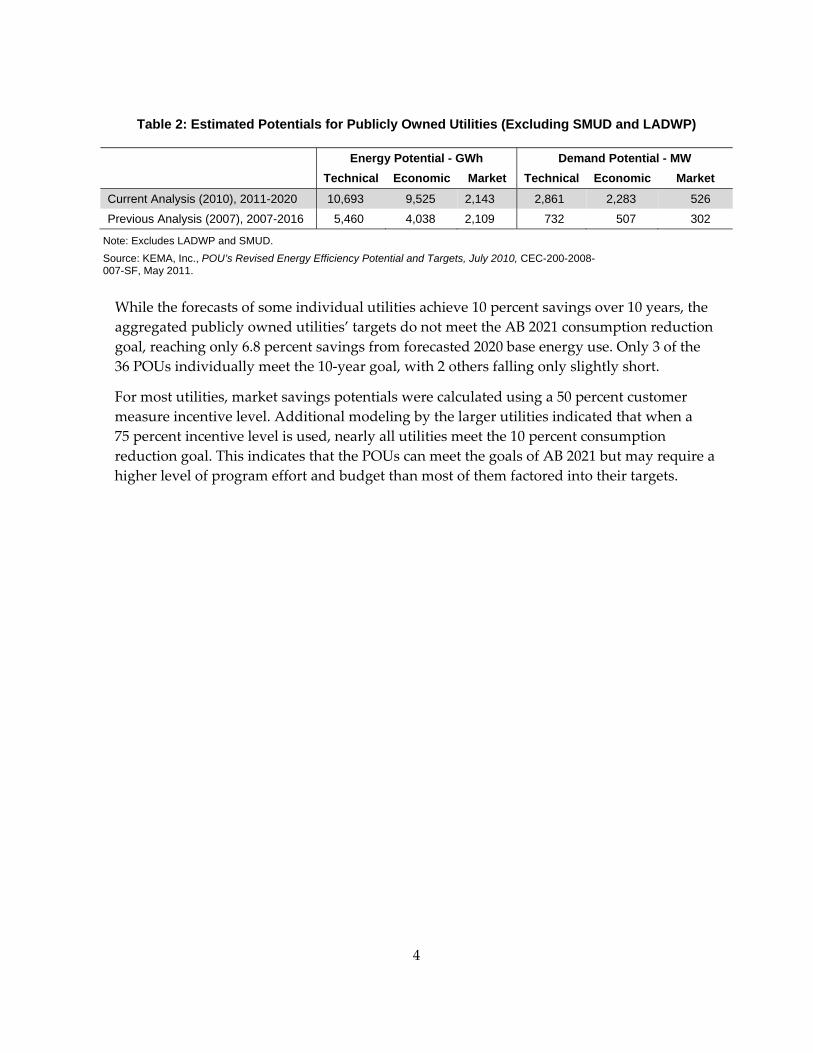
The estimate of technical energy savings potential is 10,693 GWh from 2011‐2020. This estimate represents 33 percent of base energy consumption in 2020 and is 96 percent higher than the 2007 estimate of technical potential estimated for the decade 2007‐2016 (Table 2). The economic energy savings potential estimated for the POUs in the 2010 study is 9,525 GWh for 2011–2020, or 29 percent of base energy consumption. This estimate of economic potential is 136 percent higher than the 2007 estimate of economic potential for the decade 2007–2016.
The most significant level of efficiency potential is market savings potential, which results when program designs, customer preferences, and market conditions are assessed. With a few exceptions, the POUs used the market potential as their revised targets for 2011–2020. For the 36 utilities, the market potential was 23 percent of their economic potential. In the initial target setting in 2007, these same utilities derived targets (that is, market potential) that were roughly 50 percent of their economic potential. In general, while the 2010 estimate of technical and economic potential differed greatly from the levels developed in 2007, the targets derived by the utilities, and approved by their governing boards, were very similar.
4
Table 2: Estimated Potentials for Publicly Owned Utilities (Excluding SMUD and LADWP)
Energy Potential - GWh Demand Potential - MW Technical Economic Market Technical Economic Market
Current Analysis (2010), 2011-2020 10,693 9,525 2,143 2,861 2,283 526
Previous Analysis (2007), 2007-2016 5,460 4,038 2,109 732 507 302
Note: Excludes LADWP and SMUD. Source: KEMA, Inc., POU’s Revised Energy Efficiency Potential and Targets, July 2010, CEC-200-2008-007-SF, May 2011.
While the forecasts of some individual utilities achieve 10 percent savings over 10 years, the aggregated publicly owned utilities’ targets do not meet the AB 2021 consumption reduction goal, reaching only 6.8 percent savings from forecasted 2020 base energy use. Only 3 of the 36 POUs individually meet the 10‐year goal, with 2 others falling only slightly short.
For most utilities, market savings potentials were calculated using a 50 percent customer measure incentive level. Additional modeling by the larger utilities indicated that when a 75 percent incentive level is used, nearly all utilities meet the 10 percent consumption reduction goal. This indicates that the POUs can meet the goals of AB 2021 but may require a higher level of program effort and budget than most of them factored into their targets.

CHAPTER 1: Introduction and Background Achieving Cost‐Effective Energy Efficiency for California 2011–2020 is the fifth annual staff report documenting California load‐serving utilities’ progress at reducing forecasted electrical consumption over the next 10 years through procuring all cost‐effective energy efficiency measures, which Assembly Bill 2021 (Levine, Chapter 734, Statutes of 2006) mandates. California’s investor‐owned utilities (IOUs) and publicly owned utilities (POUs) sponsor energy efficiency programs, substantially reducing the state’s annual electric and natural gas consumption1, together with building and appliance standards and other efficiency efforts. As Figure 1 shows, IOUs provide about 69 percent of California’s 2009 retail electricity consumption, POUs provide roughly 22 percent, and distributed generation and direct access providers supply the remainder.
Figure 1: Shares of Statewide Electricity Consumption 2009
Large POU12.4%
Medium POU8.1%
Small POU1.2%
IOU69.2%
Self Generation4.6%
Other4.5%
Source: California Energy Commission Quarterly Fuel and Energy Reports 2010.
California has a demonstrated 30‐year commitment to cost‐effective energy efficiency. In 2003, the first Energy Action Plan2 expanded the primary policy focus on energy efficiency as a resource. Senate Bill 1037 (Kehoe, Chapter 366, Statutes of 2005) requires electric utilities to meet their resource needs first with energy efficiency. For IOUs, SB 1037 requires the California Public Utilities Commission (CPUC) and the California Energy Commission to identify all potentially achievable cost‐effective electric and natural gas energy efficiency
5
1 California’s IOUs are Pacific Gas and Electric Company (PG&E), Southern California Edison Company (SCE), San Diego Gas & Electric Company (Sempra Utilities) (SDG&E), and Southern California Gas Company (Sempra Utilities) (SCG).
2 The three contributing agencies were the California Public Utilities Commission, California Energy Commission, and then‐existing California Power Authority.

6
savings and set goals for achieving this potential.3 The agencies are required to review the procurement plans to ensure the consideration of energy efficiency and other cost‐effective supply options.
In addition to these IOU requirements, SB 1037 requires all POUs, regardless of size, to report annually to their customers and to the Energy Commission investments in energy efficiency programs.
Climate change legislation further underscores the role of energy efficiency in California’s future. Assembly Bill 32 (Nứñez, Chapter 488, Statutes of 2006) requires greenhouse gas emissions be reduced to 1990 levels by 2020. Customer‐side energy efficiency is one of the primary approaches contributing to this goal. In 2006, AB 2021 added more specific legal directions stressing actions to increase California’s energy efficiency programs. AB 2021 directs POUs to “first acquire all available energy efficiency and demand reduction resources that are cost‐effective, reliable, and feasible.” POUs, as IOUs, are to treat efficiency as a procurement investment. Additionally, the legislation requires each POU to:
• Identify all potentially achievable cost‐effective electricity energy savings, beginning in 2007 and every three years thereafter.
• Establish annual targets for energy efficiency savings for the next 10‐year period.
• Report on program cost‐effectiveness and third‐party evaluation, measurement, and verification (EM&V) of program savings.
AB 2021 also directs the Energy Commission to:
• Include a summary of the POUs’ savings and EM&V in the Integrated Energy Policy Report (IEPR).
• Provide, in consultation with the CPUC as the regulator of IOU energy efficiency programs, a statewide estimate of energy efficiency potential and targets for a 10‐year period.
• Provide recommendations to POUs, Legislature, and the Governor of possible improvements by the POUs.
The first requirement of AB 2021 was met in December 2007 when the energy agencies and the utilities developed statewide targets and utility‐specific targets. 4 The Energy
3 The terms for energy efficiency “targets” and “goals” are used interchangeably. There is an established convention (at least since 2004) that the CPUC and IOUs use the term “goals.” POUs have adopted the term “targets” since that is the term used in AB 2021.
4 California Energy Commission, Achieving All Cost‐Effective Energy Efficiency for California, Final Staff Report, CEC‐200‐2007‐019‐SF, December 2007.

7
Commission’s 2007 IEPR presented an overall statewide goal equivalent to all cost‐effective efficiency economic potential.
More recent legislation, Senate Bill 488 (Pavley, Chapter 352, Statutes of 2009), requires the Energy Commission to evaluate the effectiveness of “comparative energy usage disclosure programs” in the POUs and include these savings potential in the triennial assessment of utility energy efficiency potential and targets.5 In 2010, POUs initiated an annual reporting of these customer information programs. As noted in last year’s 2010 AB 2021 Progress Report, only one POU, Sacramento Municipal Utility District (SMUD), performed a 2009 evaluation of a customer disclosure program.6 There were no additional studies on these programs in 2010.
In the 2008 IEPR Update process, the 2008 AB 2021 Progress Report documented the IOU and POU energy efficiency progress during 2007.7 The report discussed the energy efficiency accomplishments for the 2006–2008 IOU program cycle and plans for the 2009–2011 program cycle.
The 2009 IEPR included information from the 2009 AB 2021 Progress Report on the IOU and POU energy efficiency progress during 2008. It addressed the CPUC’s first interim Energy Efficiency 2006–2007 Verification Report summarizing the EM&V efforts of the program from 2006–2007.8 Several POUs first began providing EM&V plans and studies in 2009.
The 2010 IEPR Update contained an assessment of IOU and POU energy efficiency progress during 20099 and the verified accomplishments for the 2006–2008 IOU program cycle. The POUs reported energy efficiency program savings for 2006–2009, as well as an update on the EM&V efforts for the POU efficiency programs.
While this report includes energy efficiency savings for both the IOUs and the POUs, verified savings were available only for the IOUs’ 2006–2008 programs, as reported in the CPUC’s
5 These existing information‐based programs show customers how their energy use compares with a representative group of customers. The program logic predicts that this comparative knowledge will prompt customers to take energy efficiency actions. SMUD is the first POU to field a pilot program in 2008 under the title Home Electricity Reports. CPUC discusses savings estimation for comparative energy usage disclosure programs in D.10‐04‐029, Decision Determining Evaluation, Measurement and Verification Processes for 2010–2012 Energy Efficiency Portfolios, April 2010.
6 SMUD, The Impact of Home Electricity Report, Final Report, prepared by ADM Associates, September 2009.
7 California Energy Commission, Achieving Cost‐Effective Energy Efficiency for California: An AB 2021 Progress Report, CEC‐200‐2008‐007, December 2008.
8 California Energy Commission, Achieving Cost‐Effective Energy Efficiency for California: An AB 2021 Progress Report, CEC‐200‐2009‐008‐SF, December 2009.
9 California Energy Commission, 2009 AB 2021 Progress Report: Achieving Cost‐Effective Energy Efficiency for California, CEC‐200‐2010‐006, December 2010.

8
second interim 2006–2008 Energy Efficiency Evaluation Report (Evaluation Report).10 The POUs‘ self‐reported savings are used in this report. The POUs’ EM&V studies are too few and too recent to provide enough information for a comprehensive estimate of verified savings.
Triennial Statewide Estimate of Efficiency Potential and Targets: 2011 Status
Under the schedule of AB 2021, the staff’s 2010 AB 2021 Progress Report would have contained the second revision of IOU and POU efficiency potential and goals and targets. As noted in last year’s report, the revision of statewide efficiency potential and targets was rescheduled to 2011 because the CPUC had not yet proposed new goals for the IOUs’ efficiency programs. While the CPUC now has a schedule to revise the IOUs’ efficiency goals, they will not be approved until 2013.11
Achieving Cost‐Effective Energy Efficiency for California 2011–2020 includes an estimate of the efficiency potential for POUs’ efficiency savings and demand reduction targets for 2011–2020 with two major exceptions. The Energy Commission received the necessary data for assessment of most POUs’ revised potential and targets by September 2010.12 The two largest utilities, SMUD and LADWP, which did not participate in the California Municipal Utilities Association (CMUA) 2010 potential and target study, also did not submit to the Energy Commission the requisite level of data as mandated. SMUD submitted revised efficiency targets approved by its board in May 2010; however, it did not revise its efficiency potential estimates. LADWP has been revising efficiency potential and targets for over a year; however, revised information will not be available to the Energy Commission until, at best, late 2011. This report incorporates data from both SMUD and LADWP in the analysis where possible.
Organization of This Report Chapter 1 provides the basic background needed to understand the context of this report.
Chapter 2 summarizes the POUs’ and IOUs’ energy efficiency program savings.
Chapter 3 summarizes the POU’s EM&V studies efforts.
10 CPUC, 2006–2008 Energy Efficiency Evaluation Report, July 2010.
11 CPUC, Commissioner Assigned Ruling Soliciting Comments, November 17, 2010. For this discussion on IOUs’ efficiency goal revision, see: http//docs.cpuc.ca.gov/efile/RULINGS/126625.pdf.
12 CMUA, Energy Efficiency in California’s Public Power Sector: A Status Report, March 2010. This report provided the initial estimates of revised potential and targets; however, complete, accurate data was not filed until September 2010.
9
Chapter 4 assesses the ongoing effort to establish a statewide estimate of energy efficiency potential and goals for 2011–2020 for most of the publicly owned utilities.
Chapter 5 contains staff’s conclusions and recommendations.
Appendix A contains the POUs’ revised demand reduction and annual energy efficiency targets for 2011–2020. Appendix B contains the IOUs’ efficiency targets and reported and evaluated savings for 2006–2010.
Attachment A contains a report prepared by KEMA, Inc., analyzing the POUs’ revised energy efficiency potential and targets.
10
CHAPTER 2: Staff Assessment of Utilities’ Progress in 2010
Investor-Owned Utilities’ Energy Efficiency Savings and Expenditures
Current and Future Program Portfolios (2010–2014) In September 2009, the CPUC issued Decision 09‐09‐047 approving the IOUs’ 2010–2012 $3.1 billion efficiency program portfolios, a 42 percent increase in expenditures from the previous 2006–2008 program cycle. This decision changed the program cycle from 2009–2011 to 2010–2012 with 2009 designated as a bridge year. In December 2010, the CPUC issued a ruling13 extending the IOUs’ 2010–2012 program cycle by at least one year to update the adopted goals and to make changes to the energy efficiency policy framework before the IOUs plan their next portfolio. This ruling makes 2013 and possibly 2014 bridge years. The CPUC is seeking input from stakeholders on how the budgets for these years will be based, which energy efficiency programs will be extended during this period, if ex ante and cost‐effective values for programs should be updated for these bridge years, and how to address IOU contracts with local governments and third‐party administered programs.
Reported and Evaluated Efficiency Program Savings (2009–2010) For 2009, the IOUs reported total energy savings of 13,524 gigawatt hours (GWh). But, after evaluation studies were completed, the evaluated total energy savings were 7,387 GWh, 55 percent of the reported total energy savings. The reported peak savings were 2,328 megawatts (MW), while the evaluated peak savings were 1,314 MW, 56 percent of the reported peak savings. 14
13 CPUC R.09‐11‐014, Administrative Law Judge’s Ruling Regarding 2013 Bridge Funding and Mechanics of the Portfolio Extension, May 27, 2011. 14 In Appendix B, Table B‐1 shows the IOUs’ energy savings, peak savings, and natural gas savings for program years 2006‐2009. Also, included in this table are the evaluated savings that are based on field research of the installations that were reported during 2006‐2009 program cycle.
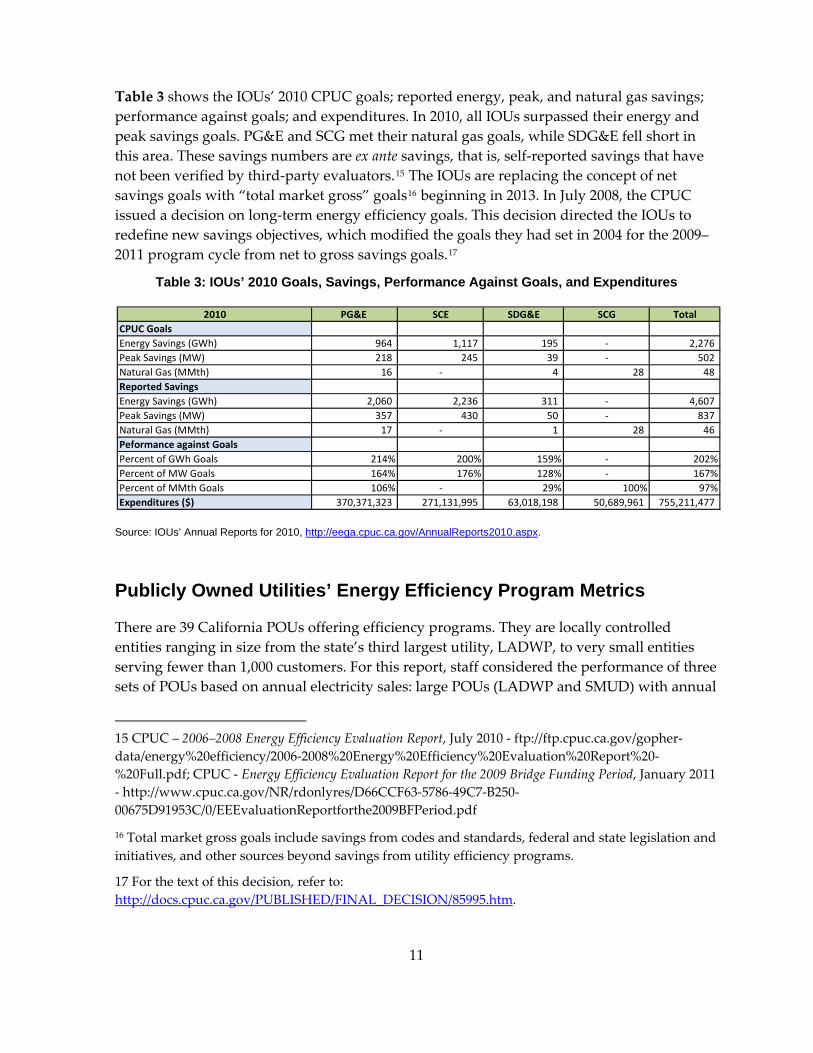
Table 3 shows the IOUs’ 2010 CPUC goals; reported energy, peak, and natural gas savings; performance against goals; and expenditures. In 2010, all IOUs surpassed their energy and peak savings goals. PG&E and SCG met their natural gas goals, while SDG&E fell short in this area. These savings numbers are ex ante savings, that is, self‐reported savings that have not been verified by third‐party evaluators.15 The IOUs are replacing the concept of net savings goals with “total market gross” goals16 beginning in 2013. In July 2008, the CPUC issued a decision on long‐term energy efficiency goals. This decision directed the IOUs to redefine new savings objectives, which modified the goals they had set in 2004 for the 2009–2011 program cycle from net to gross savings goals.17
Table 3: IOUs’ 2010 Goals, Savings, Performance Against Goals, and Expenditures
2010 PG&E SCE SDG&E SCG TotalCPUC Goals Energy Savings (GWh) 964 1,117 195 ‐ 2,276 Peak Savings (MW) 218 245 39 ‐ 502 Natural Gas (MMth) 16 ‐ 4 28 48 Reported Savings Energy Savings (GWh) 2,060 2,236 311 ‐ 4,607 Peak Savings (MW) 357 430 50 ‐ 837 Natural Gas (MMth) 17 ‐ 1 28 46 Peformance against GoalsPercent of GWh Goals 214% 200% 159% ‐ 202%Percent of MW Goals 164% 176% 128% ‐ 167%Percent of MMth Goals 106% ‐ 29% 100% 97%Expenditures ($) 370,371,323 271,131,995 63,018,198 50,689,961 755,211,477
Source: IOUs’ Annual Reports for 2010, http://eega.cpuc.ca.gov/AnnualReports2010.aspx.
Publicly Owned Utilities’ Energy Efficiency Program Metrics
There are 39 California POUs offering efficiency programs. They are locally controlled entities ranging in size from the state’s third largest utility, LADWP, to very small entities serving fewer than 1,000 customers. For this report, staff considered the performance of three sets of POUs based on annual electricity sales: large POUs (LADWP and SMUD) with annual
15 CPUC – 2006–2008 Energy Efficiency Evaluation Report, July 2010 ‐ ftp://ftp.cpuc.ca.gov/gopher‐data/energy%20efficiency/2006‐2008%20Energy%20Efficiency%20Evaluation%20Report%20‐%20Full.pdf; CPUC ‐ Energy Efficiency Evaluation Report for the 2009 Bridge Funding Period, January 2011 ‐ http://www.cpuc.ca.gov/NR/rdonlyres/D66CCF63‐5786‐49C7‐B250‐00675D91953C/0/EEEvaluationReportforthe2009BFPeriod.pdf
16 Total market gross goals include savings from codes and standards, federal and state legislation and initiatives, and other sources beyond savings from utility efficiency programs.
17 For the text of this decision, refer to: http://docs.cpuc.ca.gov/PUBLISHED/FINAL_DECISION/85995.htm.
11

12
sales of greater than 10,000,000 megawatt hours (MWh); medium POUs with annual sales between 500,000 and 10,000,000 MWh; and small POUs with annual sales less than 500,000 MWh. In 2009, the large POUs constituted roughly 58 percent of the retail sales, and the 15 utilities in the combined large and mid‐size groups served about 95 percent of the POUs’ load.18 The majority of data contained in this report regarding the POU’s accomplishments in 2010 were obtained from CMUA’s Energy Efficiency in California’s Public Power Sector: A Status Report, March 2011 (2011 CMUA Status Report).
This section contains the following performance measures, or metrics, illustrating the progression of the POUs’ energy efficiency programs:
• Annual expenditures on energy efficiency programs
• Energy efficiency program expenditures as a percentage of revenue
• Annual energy savings relative to adopted targets
• Peak energy savings relative to adopted targets
• Annual energy savings as a percentage of total utility sales
• Cost‐effectiveness of energy efficiency program portfolios
Annual Expenditures on Energy Efficiency Programs In 2010, POUs spent a total of $123 million on energy efficiency programs, compared to $146 million spent in 2009. As Figure 1 shows, this 15 percent decrease marks the first drop in energy efficiency program spending since 2006, when the first SB 1037 report was published. In 2010, the 15 largest POUs spent more than $117 million, 95 percent of the total reported expenditures for the POUs. In 2009, the same 15 utilities spent almost $142 million on energy efficiency programs, 97 percent of the total reported expenditures for 2009. This represents a decrease of 18 percent of spending on energy efficiency programs in 2010 compared to the funding spent in 2009. In 2010, LADWP spent $44 million, while in 2009 the utility spent $67 million. This difference represents a decrease of 34 percent between the 2010 and 2009 expenditures. In 2010, SMUD spent $27 million, while in 2009 the utility spent $33 million, a decrease of 18 percent. Combined, these two utilities accounted for more than 58 percent of the total POU efficiency expenditures in 2010.
As Figure 2 illustrates, while LADWP and SMUD have the largest decrease in spending between 2009 and 2010, the medium utilities increased spending on energy efficiency programs for these same years. In 2010, the medium utilities spent slightly more than
18 The largest POUs, or “big 15,” were Anaheim Public Utilities, Burbank Water and Power, Glendale Water and Power, Imperial Irrigation District, Los Angeles Department of Water and Power, Modesto Irrigation District, City of Palo Alto, Pasadena Water & Power, City of Redding, Riverside Public Utilities, Roseville Electric, Sacramento Municipal Utility District, Silicon Valley Power, Turlock Irrigation District, and City of Vernon. Staff concentrates on these utilities because they comprised 95 percent of the efficiency savings in 2010. Utilities in this category vary slightly from year to year.

$45 million while in 2009, they spent $41 million dollars, an increase of almost 11 percent between 2009 and 2010. The medium utilities show an increase in spending on energy efficiency programs every year since 2006. The small utilities increased spending between 2009 and 2010 by 33 percent. In 2010, these utilities spent almost $6 million on energy efficiency programs, representing almost 5 percent of the total POU expenditures for 2010.
Figure 2: POUs' Annual Energy Efficiency Expenditures and Savings
Source: Expenditure and data obtained from CMUA, Energy Efficiency in California’s Public Power Sector: A Status Report, March 2011.
Energy Efficiency Program Expenditures An important measurement of a utility’s commitment to energy efficiency is the amount of program expenditures relative to a utility’s total revenue.19 As Figure 3 shows, POUs spent an average of 1.36 percent of their total revenues on energy efficiency programs in 2009, the last year for which revenue data is available; this is an increase from 1.22 percent of total revenues in 2008. The most significant increases in this metric came from Pasadena and LADWP. In 2009, Pasadena more than quadrupled the percentage of money spent on energy efficiency programs to 3.51 percent of its revenue compared to 0.79 percent in 2008. Pasadena accomplished this by asking its City Council for a utility rate increase to ramp up solar and lighting programs in an effort to meet its AB 2021 targets.20 In 2009, LADWP spent 2.42
13
19 See http://www.aceee.org/energy/state/policies/utpolicy.htm for a discussion of this national efficiency metric.
20 John Hoffner, e‐mail to Che McFarlin, May 26, 2011.

percent of its revenue on energy efficiency programs, which is a significant increase over the 1.36 percent spent in 2008.
Figure 3: POUs’ Efficiency Expenditures as Percentage of Revenue (2009)
Sources: Expenditure data obtained from CMUA, Energy Efficiency in California’s Public Power Sector: A Status Report, March 2011. Revenue data obtained from DOE / U.S. Energy Information Administration, Form EIA-861- Annual Electric Power Industry Report. Note: Data was not available for Hercules, Industry, Island Energy, and Port of Oakland.
Annual Energy and Peak Savings Relative to Adopted Targets Before 2010, reported savings increased each year since energy efficiency targets were established in 2007.21 In 2010, the 39 reporting POUs provided 523 GWh of electric energy savings, a 19 percent decrease compared to the savings of 644 GWh in 2009.22 For 2010, the POUs reported achieving 74 percent of their 2010 collective target set in 2007. Figure 4 illustrates how the three groups of POUs’ reported savings compare with their targets for 2007 through 2010 (see also Table A‐1).23
In 2010, the 15 largest POUs provided 497 GWh of savings, 95 percent of the total POU annual energy savings. In 2009, the same 15 utilities provided 625 GWh of savings, a 20 percent decrease from 2009 to 2010. This decrease in energy savings is mainly attributable
14
21 Establishing Energy Efficiency Targets: A Public Power Response to AB 2021, October 2007.
22 POUs report electric savings only.
23 As noted in Chapter 1, these POU savings are self‐reported; they have not been adjusted as a result of evaluation, measurement, and verification studies.
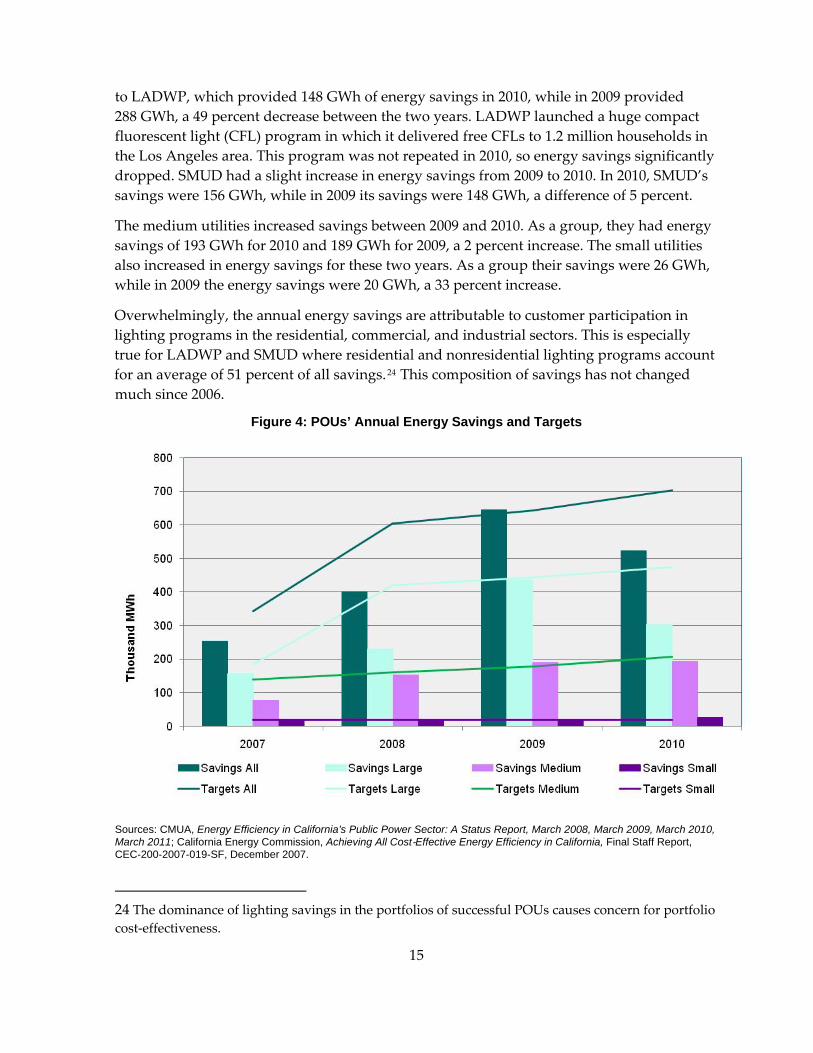
to LADWP, which provided 148 GWh of energy savings in 2010, while in 2009 provided 288 GWh, a 49 percent decrease between the two years. LADWP launched a huge compact fluorescent light (CFL) program in which it delivered free CFLs to 1.2 million households in the Los Angeles area. This program was not repeated in 2010, so energy savings significantly dropped. SMUD had a slight increase in energy savings from 2009 to 2010. In 2010, SMUD’s savings were 156 GWh, while in 2009 its savings were 148 GWh, a difference of 5 percent.
The medium utilities increased savings between 2009 and 2010. As a group, they had energy savings of 193 GWh for 2010 and 189 GWh for 2009, a 2 percent increase. The small utilities also increased in energy savings for these two years. As a group their savings were 26 GWh, while in 2009 the energy savings were 20 GWh, a 33 percent increase.
Overwhelmingly, the annual energy savings are attributable to customer participation in lighting programs in the residential, commercial, and industrial sectors. This is especially true for LADWP and SMUD where residential and nonresidential lighting programs account for an average of 51 percent of all savings.24 This composition of savings has not changed much since 2006.
Figure 4: POUs’ Annual Energy Savings and Targets
15
Sources: CMUA, Energy Efficiency in California’s Public Power Sector: A Status Report, March 2008, March 2009, March 2010, March 2011; California Energy Commission, Achieving All Cost‐Effective Energy Efficiency in California, Final Staff Report, CEC‐200‐2007‐019‐SF, December 2007.
24 The dominance of lighting savings in the portfolios of successful POUs causes concern for portfolio cost‐effectiveness.
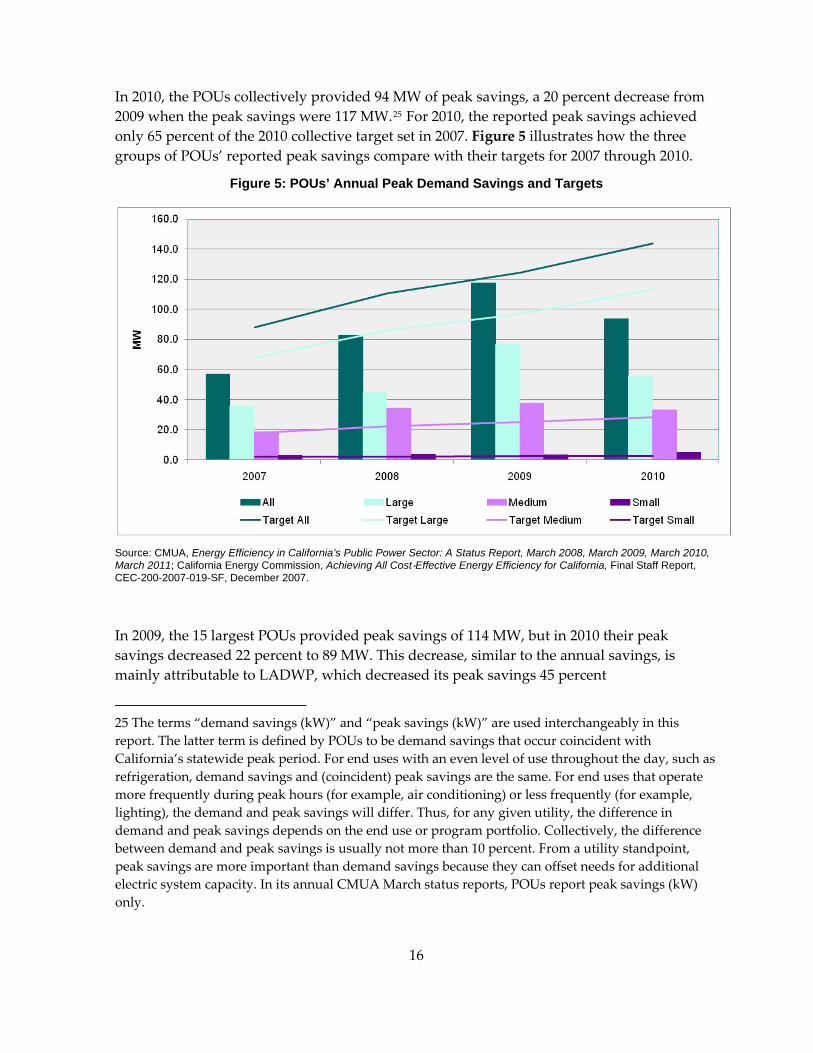
In 2010, the POUs collectively provided 94 MW of peak savings, a 20 percent decrease from 2009 when the peak savings were 117 MW.25 For 2010, the reported peak savings achieved only 65 percent of the 2010 collective target set in 2007. Figure 5 illustrates how the three groups of POUs’ reported peak savings compare with their targets for 2007 through 2010.
Figure 5: POUs’ Annual Peak Demand Savings and Targets
Source: CMUA, Energy Efficiency in California’s Public Power Sector: A Status Report, March 2008, March 2009, March 2010, March 2011; California Energy Commission, Achieving All Cost‐Effective Energy Efficiency for California, Final Staff Report, CEC‐200‐2007‐019‐SF, December 2007.
In 2009, the 15 largest POUs provided peak savings of 114 MW, but in 2010 their peak savings decreased 22 percent to 89 MW. This decrease, similar to the annual savings, is mainly attributable to LADWP, which decreased its peak savings 45 percent
16
25 The terms “demand savings (kW)” and “peak savings (kW)” are used interchangeably in this report. The latter term is defined by POUs to be demand savings that occur coincident with California’s statewide peak period. For end uses with an even level of use throughout the day, such as refrigeration, demand savings and (coincident) peak savings are the same. For end uses that operate more frequently during peak hours (for example, air conditioning) or less frequently (for example, lighting), the demand and peak savings will differ. Thus, for any given utility, the difference in demand and peak savings depends on the end use or program portfolio. Collectively, the difference between demand and peak savings is usually not more than 10 percent. From a utility standpoint, peak savings are more important than demand savings because they can offset needs for additional electric system capacity. In its annual CMUA March status reports, POUs report peak savings (kW) only.
17
(from 51 MW to 28 MW) between 2009 and 2010. SMUD had a slight increase in peak savings from 2009 to 2010. In 2010, SMUD’s peak savings were 28 MW while in 2009 its savings were 26 MW, an 8 percent increase.
The medium utilities had a decrease in peak savings between 2009 and 2010. As a group, they had peak savings of 33 MW for 2010 and 38 MW for 2009, a 13 percent decrease. As a group, the small utilities had a 47 percent increase in peak savings between 2009 and 2010 with 3 MW of savings in 2009 compared to 5 MW in 2010.
Annual Energy Savings as a Percentage of Total Utility Sales Annual energy savings as a percentage of total electric sales is a standard performance metric for efficiency programs.26
Figure 6 illustrates the evolution of the efficiency savings as a percentage of total electric sales over 2006–2009 for the POU groups and the IOUs.
The ratio for efficiency savings to electric sales for all 39 POUs has been increasing every year since 2006. In 2006, it was 0.28 percent; by 2009, it had increased to 1.06 percent.
In 2009, the two largest POUs improved their performance over the previous year. LADWP’s ratio was 1.21 percent in 2009, while in 2008 it was 0.47 percent. In 2009, SMUD’s ratio was 1.38 percent; in 2008 it was 1.05 percent.
Cost-Effectiveness of Energy Efficiency Program Portfolios The Total Resource Cost test is a common metric for evaluating California’s efficiency program cost‐effectiveness.27 In their 2011 CMUA Status Report, the POUs include the TRC for each utility’s portfolio. The 15 combined large and medium POUs had cost‐effective program portfolios in 2010, averaging a TRC of 3.09 with a range from 7.36 for Anaheim to 1.41 for Burbank.28 The average TRC for the efficiency portfolios of all 39 POUs was 3.15. POU program cost‐effectiveness continues to be heavily weighted by the TRCs for low‐cost
26 Depending on the source, an exemplary performance using this metric would indicate savings between 1 and 2.5 percent of total utility sales. See United States Environmental Protection Agency, National Action Plan for Energy Efficiency, July 2006; and, M. Kushler, York, D., and Witte, P., Meeting Aggressive New State Goals for Utility‐Sector Energy Efficiency: Examining Key Factors Associated with High Savings, American Council for an Energy Efficient Economy, Report Number U091, March 2009.
27 Total Resource Cost (TRC) includes the identified benefits of the program such as avoided generation costs divided by the net costs, which include both the utility and participant costs. When the TRC test ratio is greater than 1.0 for a utility program (or portfolio of programs), it is deemed to be cost‐effective; at TRC=1, the per kWh/kW cost of energy efficiency programs is equal to the avoided cost of a power plant. Avoided costs are the incremental savings associated with not having to produce additional units of power (operating and/or building a power plant) while meeting energy demand requirements.
28 Utilities, especially smaller ones, can show fluctuating TRCs from year‐to‐year if a relatively small pool of efficiency program participants determines a program’s success.

lighting measures. The availability of this measure option will begin to change in 2012 as federal and state lighting efficiency legislation takes effect.
Figure 6: POUs’ Energy Savings as a Percentage of Total Sales
Sources: CMUA, Energy Efficiency in California’s Public Power Sector: A Status Report, December 2006, March 2007, March 2008, March 2009, March 2010, March 2011; CPUC Energy Division, Energy Efficiency Groupware Application Database (EEGA), May 2011. U.S, Energy Information Administration, Form EIA-861- Annual Electric Power Industry Report. File 2 for 2009. Energy Information Administration (EIA) database is not yet available for 2010.
Staff Assessment of Publicly Owned Utilities’ Progress in 2010
AB 2021 directs the Energy Commission to provide a comparison of each POU’s targets and each utility’s actual annual energy savings and demand reductions.29 The Energy Commission is required to make recommendations to the POUs, the Legislature, and Governor if it determines improvements could be made in the level of aggregate achievement by the POUs or in the level of achievement by a specific POU.
18
29 AB 2021 (Levine, Chapter 734, Statutes of 2006), Section 3(f) of the legislation amends Section 9615 of the California Public Utilities Code.
19
Publicly Owned Utilities’ 2010 Reported Savings Relative to Targets As a group, the POUs fell short of meeting their 2010 energy savings target by 26 percent. LADWP and SMUD, which comprise the large group, collectively missed their 2010 target by 36 percent. LADWP had 148 GWh of energy savings while their 2010 target was 280 GWh, a 47 percent difference. SMUD had 156 GWh of energy savings while its target was 196 GWh, a 20 percent difference. The medium POUs had energy savings of 193 GWh while their target for 2010 was 207 GWh. The only group that achieved its target was the small POUs with energy savings of 26 GWh while their target for 2010 was 20 GWh, 30 percent over target.
Collectively, the POUs also did not meet their peak target for 2010. While in total the POUs saved 94 MW, their 2010 target was 144 MW, a 35 percent difference. The large utilities had the most trouble meeting their targets. LADWP’s 2010 peak savings was 28 MW while their target was 55 MW, a 49 percent difference. SMUD also had trouble meeting its target. For 2010, SMUD’s peak savings was 28 MW while its target was 58 MW, a 52 percent difference. Both the medium and small POU groups met and surpassed their 2010 targets. Medium POUs had peak savings of 32 MW, while their target was 28 MW, a 14 percent difference. Small POUs’ peak savings were 4.8 MW, while their target was 2.6 MW, an 85 percent difference.
Figure 7 shows cumulative targets, previous year’s projected savings, and reported savings over the period 2007–2010 for the 15 largest POUs. During these four years, 12 of these POUs had reported annual energy savings that exceeded their projected savings. Five POUs (Anaheim, Glendale, Palo Alto, Pasadena, and Silicon Valley Power) also had reported annual energy savings that exceeded their targets for these four years. Nine utilities did not meet their targets. SMUD came very close to meeting its target, missing the mark by less than 1 percent. Both Imperial and Riverside missed their targets by more than 45 percent.

Figure 7: Largest 15 POUs' Cumulative Targets, Projected Savings, and Reported Efficiency Savings 2007-2010
Source: CMUA, Energy Efficiency in California’s Public Power Sector: A Status Report, March 2008, March 2009, March 2010, and March 2011. Notes: Vernon did not provide targets. LADWP’s savings appear on the left vertical axis, because they are significantly greater than the savings of the other POUs.
Summary and Conclusions
The following are the most important conclusions from this year’s review of the 2010 energy efficiency accomplishments of the POUs:
• The 39 POUs collectively spent $123 million in 2010, a 126 percent increase over the $54 million spent in 2006. The 2010 expenditures, however, mark an end to the upward trend, largely because the two largest POUs, LADWP and SMUD, both decreased spending. LADWP had a 34 percent decrease, and SMUD had a 16 percent decrease. The POUs spent an average of 1.36 percent of their total revenues on energy efficiency programs in 2009, an increase from 1.22 percent in 2008. The medium and small POUs increased their spending in 2010. Individually, 21 POUs spent more money in 2010 compared to 2009.
• In 2010, the 39 POUs provided 523 GWh of electric energy savings, which was a 19 percent decrease from 2009. For 2010, the POUs reported achieving 74 percent of their 2010 collective energy savings target set in 2007. In 2010, the POUs collectively provided 94 MW of peak savings, a 20 percent decrease from 2009. For 2010, the reported peak savings achieved only 65 percent of their 2010 collective peak target set in 2007. The ratio for efficiency savings to electric sales for all 39 POUs has increased from 0.28 percent in 2006 to 1.06 percent in 2010.
20

21
• The savings attributable to lighting programs from both residential and nonresidential sectors comprised 44 percent of the collective savings in 2010, while lighting represented 40 percent or more of the savings for almost half of the individual POUs. As POUs phase out their large CFL programs, these percentages should decrease. For example, Glendale has already decided to phase out its CFL programs and devote more resources to other programs. The POUs had cost‐effective program portfolios in 2010, averaging a TRC of 3.09 across all 39 POUs.

22
CHAPTER 3: Evaluation and Verification of POU Efficiency Program Savings AB 2021 calls for POUs to report annually on “the results of an independent evaluation that measures and verifies the energy efficiency savings and reduction in energy demand achieved by its energy efficiency and demand reduction programs.”30 There are two primary purposes for conducting these third‐party evaluations: to document program impacts credibly, and to improve cost‐effectiveness of program designs and operations. Both objectives help to ensure that efficiency savings will be a reliable energy resource to utilities and valuable to their customers. The Energy Commission, which uses utility energy savings to develop its load forecast, seeks to work with the POUs to ensure that the EM&V methods are thorough and transparent.
Status of POU Compliance and Energy Commission Activities Since the passage of AB 2021 in 2006, 16 POUs have filed at least one EM&V impact study for program years 2007–2009.31 Table 4 shows those utilities with independent savings verification studies. Utilities that are planning to file an EM&V impact study with the Energy Commission for the first time in 2011 are Pasadena, Imperial, Glendale, Modesto, Anaheim, and Riverside. The 2011 CMUA Status Report presented more detailed EM&V plans for many utilities than in any previous report. The larger utilities all indicated plans to verify the results of their programs with the most savings within the next year or at scheduled annual intervals.
30 AB 2021 (Levine, Chapter 734, Statutes of 2006) adds Section 25310 to the Public Resources Code, and amends Section 9615 of the Public Utilities Code, relating to energy efficiency. 31 For completed POU EM&V reports, see: http://www.ncpa.com/energyefficiency‐m‐v‐reports.html.

23
Table 4: EM&V Status of Publicly Owned Utilities as of April 2011
Northern CA – Large POUs Northern CA – Small POUs Southern CA – Large POUs Southern CA – Small POUs
Program Years Evaluated Program Years Evaluated Program Years Evaluated Program Years Evaluated
Lodi 2008, 2009 Modesto ID in progress Palo Alto 2008, 2009 Redding 2008 Roseville 2008, 2009 Silicon Valley 2008, 2009 SMUD 2006, 2007, 2008, 2009 Truckee-Donner 2008, 2009 Turlock ID 2008, 2009
Alameda 2008 Biggs 2008 Gridley 2009 Healdsburg Hercules Lassen 2009 Lompoc 2008 Merced ID Pittsburgh-Island Plumas Sierra Port of Oakland 2008 Ukiah
Anaheim in progress Burbank 2009 Glendale in progress Imperial ID in progress LADWP 2007, 2008 Pasadena in progress Riverside in progress
Azusa Banning Colton Corona Moreno Valley Needles Rancho Cucamonga Vernon
24
Energy Commission Assessment of POU EM&V and Related Activities The Energy Commission, with the support of a consultant, assessed most of the POUs’ savings impact studies received in 2009.32 This report examined both the reported POU savings claimed in the SB 1037 annual reports to the Energy Commission, and utilities’ third‐party evaluations of these claimed (or ex ante) savings. To perform this assessment, the Energy Commission staff and its consultant developed a draft framework of evaluation criteria to analyze the EM&V studies. Internationally established EM&V protocols formed the basis of these criteria.33 The Energy Commission’s consultant, KEMA, provided a follow‐up assessment of the impact studies filed in 2010 using the draft framework of criteria developed in 2009.34 This assessment of the 2010 EM&V impact studies identified issues of concern that were similar to those in the 2009 studies. Last year’s report fully described these issues.
The consultant report provides specific recommendations to both the POUs and the Energy Commission to improve the evaluation reports. The utilities are encouraged to improve EM&V data collection, method, and documentation of study results. Recommendations for the Energy Commission include developing EM&V guidelines for POUs and clarifying the reporting requirements needed to improve impact studies. The Energy Commission and the POUs agreed that, pending action on these recommendations, it is premature to use the ex‐post savings numbers in the annual CMUA reports for the Energy Commission’s biennial IEPR demand forecast.35
The Energy Commission acted upon these recommendations by developing EM&V guidelines, which included how and when to apply the framework of evaluation criteria. In addition, the Energy Commission hosted two workshops for POUs to discuss application of
32 Lewis, Kae, et.al., 2010. 2009 AB 2021 Progress Report: Achieving Cost‐Effective Energy Efficiency for California. California Energy Commission, Electricity Supply Analysis Division. CEC‐200‐2010‐006. The following consultant report is attached to the main report: Seto, Betty, et.al. (KEMA, Inc.), 2010. Review of Energy Efficiency Program Savings Estimations in Annual Reports and Measurement and Evaluation Studies. California Energy Commission. Publication Number: CEC‐200‐2010‐008.
33 Efficiency Valuation Organization (EVO), International Protocol for Monitoring and Verifying Projects (IPMVP): http://www.raponline.org/docs/IPMVP_Vol_1__2007.pdf. National and California EM&V standards are based on these international protocols. For CPUC protocols, see California Energy Efficiency Evaluation Protocols: Technical, Methodological, and Reporting Requirements for Evaluation Professionals (“Evaluators’ Protocol”). Prepared for the California Public Utilities Commission. April 2006. http://www.calmac.org/events/EvaluatorsProtocols_Final_AdoptedviaRuling_06‐19‐2006.pdf.
34 The individual assessments of 2010 studies have not yet been completed. The evaluations that have been completed by KEMA have been returned to utility staff to help them develop evaluation procedures.
35 The CPUC is using the 2006–2009 ex post results for the first time in 2010.
25
the guidelines and their EM&V experiences.36 The workshops focused on key information needed for obtaining the greatest value from evaluation studies for both the POUs and Energy Commission.
Challenges of Implementing EM&V for POUs
The EM&V workshops for POUs provided an opportunity for Energy Commission staff to learn about POU capabilities and approaches for EM&V of their efficiency programs. A number of POU staff members related extensive and valuable experiences with EM&V, but the following barriers to EM&V for many utilities were identified:
• POUs are very diverse in size, customer types, and program delivery approaches, making it difficult to issue “one size fits all” prescriptive guidelines for EM&V activities.
• Many POUs are very small and have limited access to EM&V resources or staff time to pursue evaluation activities.
• POUs have substantial faith in their internal verification procedures, which they believe ensure their programs are on track and delivering expected savings. As a consequence, few perceive a need for comprehensive third‐party EM&V, especially the extra expense of net savings analysis to determine free ridership and spillover savings impacts.37
• POUs have no strong incentive to perform EM&V to prove that they did not inflate their savings claims. They do not have the shareholder reward mechanism that, at least partially, drives the EM&V process for the IOUs’ efficiency programs.
• Some POUs have had difficulties communicating their specific needs to EM&V contractors and reaching agreements about project scope and products.
For many POUs, EM&V appears to incur costs without equal benefits. Most POUs do not provide earmarked funding for EM&V in their budgets, so there is a direct tradeoff between EM&V and program expenditures; if the POU pays for a third‐party evaluation, it foregoes some program services. Some POUs, however, indicate benefits received from their EM&V studies. Acting on EM&V study recommendations, some POUs improved their data tracking
36 Workshops were held on January 11, 2011, in Sacramento and on January 18, 2011, in Burbank. Both workshops were well attended, with about 20 participants in Northern California and more than 30 participants in Southern California.
37 “Net” savings result from subtracting out the savings of “free riders” (those participants who may have taken the efficient action without the program). Many POUs believe that their program designs result in virtually no free riders. They feel that it is impractical to carry out the sort of free‐ridership study commonly done by an IOU, due to high cost and the small number of their participants. “Spillover” refers to reductions in energy consumption and/or demand in a utility’s service area caused by the presence of an efficiency program, beyond program related savings of participants.
26
systems, fixed glitches in program delivery, and made program changes in their efficiency portfolios.
In addition, POUs articulated needs that could be met with EM&V. These include verifying that the deemed values used in the E3 Tool for estimating savings are accurate for POUs38, and testing that new and revised programs are operating as expected.
Energy Commission Approach to POU EM&V Going Forward
The Energy Commission will continue assessments of the POUs’ efficiency programs because savings reliability is crucial to the Energy Commission’s load forecasts and because EM&V leads to better programs and more savings. The Energy Commission will place more value on flexibility and efficiency in fulfilling EM&V requirements. To do this, Energy Commission staff will tap POU staff knowledge and experience more consistently.
The Energy Commission will take these steps:
• Create opportunities to exchange information. The 2011 EM&V workshops were valuable forums to discuss strategies and implementation experiences. Energy Commission staff will continue to sponsor two EM&V workshops with POUs every January.
• Stratify the POUs into EM&V groups based on these criteria: magnitude of savings, capacity to perform and manage EM&V studies, and program need for evaluation information. Group 1 will be LADWP and SMUD; Group 2 will be remaining POUs with capacity greater than 200 MW; and Group 3 will be the smallest 25 POUs with capacity less than 200 MW. Thus, utilities with the most resources and largest and most diverse programs will have EM&V expectations that differ from those of small utilities that have few resources and few “tried and true” programs. Energy Commission staff is particularly interested in working with LADWP staff to develop expectations and technical support for savings verification given the magnitude of their savings relative to all other utilities.
• Develop different expectations of evaluation rigor, guidance criteria, and reporting requirements for the three groups during 2011–2012. With POU participation, revise EM&V guidance documents and develop tools and services appropriate for the three groups.
• Develop responses to significant EM&V questions that have been raised by POUs in 2011. These include:
38 The E3 Reporting Tool was developed for IOUs (by E3 consultants) and adapted for POUs in 2005–2006. It is a spreadsheet model which calculates reported savings for each POU based on specific assumptions. POUs disagree with some of these assumptions (That is, 20 percent reduction in gross savings for free‐ridership).
27
o What is the best way to assess the role of utilities’ internal evaluation procedures in future independent EM&V? How can these existing processes be leveraged to produce credible EM&V information with limited evaluation resources?
o What is the most valuable cost‐effective approach to targeting EM&V efforts over a multi‐year period; what customer sectors, program types, and uncertainties should be considered in planning evaluations of savings?
o When does a utility need (or not need) the information yielded by net savings analysis? What are the most efficient ways to develop “net savings” data without a comprehensive analysis? As stated in the 2011 CMUA Status Report (p. 10), should the POUs consider abandoning the use of net‐to‐gross ratios to adjust savings and use the total market gross goals concept developed by the California’s IOUs?
o How can POUs get what is really needed from an EM&V contractor relationship starting from the development of the request for proposal to the completed product? How can contractors be used to assess and augment internal evaluation procedures?
The Energy Commission and POUs will continue to work together on protocols and data collection for EM&V purposes. An important goal will be to establish evaluation protocols and reporting requirements that are not onerous for the Commission or the utilities. The goal will be to meet the savings forecast needs of the Energy Commission while providing valuable information for POU efficiency program and resource planning.
CHAPTER 4: Status of Statewide Estimate of Energy Efficiency Potential and Targets for 2011–2020 The ultimate objective of AB 2021’s mandates is to increase the efficiency resource in California. When passed in 2006, AB 2021 mandated that, beginning in 2007 and every three years thereafter, the POUs should identify all potentially achievable cost‐effective electricity energy savings, establish revised targets, and file these with the Energy Commission. Subsequent to this, the Energy Commission should provide, in consultation with the CPUC as the regulator of IOU energy efficiency programs, a statewide estimate of utility efficiency potential and targets for a 10‐year period. The energy agencies and the utilities met the first requirement of AB 2021 in December 2007, when they developed statewide targets and utility‐specific targets.39 The analysis used IOUs’ goals initially set in 2004.40 The Rocky Mountain Institute conducted the efficiency potential estimates and targets for many of the POUs. 41
The Energy Commission’s 2007 study evaluated IOU and POU estimates of efficiency potential, goals and targets, and the contribution of the latter to reducing future consumption. The IOUs’ 2007 energy goals were 21,000 GWh for 2007–2016, which represented 74 percent of their economic potential. The POUs’ energy targets were 6,600 GWh, which represented 62 percent of their economic potential. Analysts expected the IOUs’ savings to achieve 10 percent of their forecasted consumption in 2020, while they expected the POUs to achieve 9.3 percent of theirs.
Following AB 2021 dictates, staff analyzed the larger POUs’ proposed targets for 2007‐2016 for feasibility and reliability. Staff evaluated these criteria to determine the feasibility of the POUs’ target proposals, including the magnitude of the proposed savings relative to historical savings and the ramp‐up rate for the programs to produce the savings. Despite the conclusion in 2007 that many POUs estimated these too generously, many utilities were able to implement programs and generate savings at an impressive pace from 2007 through 2009.
According to the AB 2021 schedule, 2010 was to be the year for the next update of statewide efficiency potential and new IOU goals and POU targets. Delays in completing revised potential studies and goals and targets for the state’s largest utilities, however, preclude the Energy Commission’s ability to develop a meaningful estimate of statewide energy efficiency potential and targets for 2011–2020. Updated energy efficiency potential studies
39 California Energy Commission, Achieving All Cost‐Effective Energy Efficiency for California, Final Staff Report, CEC‐200‐2007‐019‐SF, December 2007.
40 CPUC, Decision 04‐09‐060, Interim Opinion on Energy Savings Goals for Program Year 2006 and Beyond, September 23, 2004.
41 CMUA, Establishing Energy Efficiency Targets: A Public Power Response to AB 2021, June 2007 (revised in October 2007). POUs that provided a separate potential study were City of Palo Alto, Los Angeles Department of Water and Power, Redding Electric Utility, and Sacramento Municipal Utility District.
28
and goals are not available for the IOUs. The CPUC expects to adopt new IOU efficiency goals for 2012–2020 by 2013.42 SMUD has adopted new aggressive annual energy efficiency targets for 2011–2020, but its last potential study was prepared in 2006.43 LADWP expects to complete an efficiency potential study and adopt new efficiency targets sometime in 2011.44 Victorville and City of Industry, much smaller utilities, also have not provided efficiency targets or a potential study.
Thirty‐six POUs completed a revised efficiency potential study and new targets in 2010. These utilities, referred to as the “CMUA group,” provided energy efficiency potential estimates and targets in the 2010 CMUA Status Report.45 The Energy Commission contracted KEMA, Inc., to analyze these potential studies and targets reported by CMUA. The resulting report, POU’s Revised Energy Efficiency Potential and Targets,46 is included as Attachment A. KEMA’s report assessed the energy efficiency modeling methods, data inputs, potential estimates, and efficiency targets provided by the CMUA group for 2011–2020. The potential studies provided by 12 of the state’s largest POUs47 received individual assessments to a greater level of detail. These 12 utilities comprised 29 percent of the POUs reported energy efficiency savings in 2009.
To summarize, KEMA includes in its analysis:
• Estimated energy efficiency savings potential covering 10 years, 2011–2020, for the 36 POUs referred to as the CMUA group.
• Revised annual energy efficiency savings for the CMUA group and SMUD.
• Revised peak demand reduction for the CMUA group, but not for SMUD.
Appendix A contains a list of the CMUA group’s and SMUD’s adopted energy and peak demand savings targets, which will be discussed later in this chapter.
42 CPUC, D.09‐09‐047, Approving 2010‐2012 Energy Efficiency Portfolios and Budgets, September 24, 2009. See also CPUC, Request for Proposals to Update Energy Efficiency Potential, Goals and Targets for 2013 and Beyond, February 14, 2011.
43 Despite lack of a new potential study, SMUD’s Board of Directors approved new targets in May 2010.
44 LADWP has been working with Global Energy Partners since 2010 to revise efficiency potential estimates.
45 California Municipal Utility Association, Energy Efficiency in California’s Public Power Sector: A Status Report, March 2010.
46 KEMA, Inc., POU’s Revised Energy Efficiency Potential and Targets, July 2011.
47 Anaheim Public Utilities, Burbank Water and Power, Glendale Water and Power, Imperial Irrigation District, Modesto Irrigation District, City of Palo Alto, Pasadena Water and Power, Riverside Public Utilities, Roseville Electric, Silicon Valley Power, Truckee‐Donner Public Utility District, and Turlock Irrigation District.
29

California POU Energy Efficiency and Resource Assessment Model Utilities have used efficiency potential studies as a tool to determine the magnitude of their efficiency resources and the characteristics of their savings opportunities. A potential study is a quantitative analysis that identifies what efficiency measures are technically feasible, cost‐effective, and likely to be adopted by customers over a given period. This information guides utilities’ efficiency policies, such as goal‐setting, and designs efficiency program portfolios. Potential studies can help to characterize efficiency as a utility system resource to determine the most cost‐effective options for meeting energy demands. The state’s IOUs have used potential studies to guide their program planning for the last 20 years. Although some of the larger POUs have developed efficiency potential estimates in the past, most POUs did not engage in efficiency potential modeling until Rocky Mountain Institute prepared the first AB 2021‐mandated potential estimates in 2007.
In 2010, the CMUA group used the new California POU Energy Efficiency and Resource Assessment Model (CalEERAM) developed by Navigant specifically for this purpose under contract to CMUA. CalEERAM estimates the technical, economic, and market potential for energy savings for the residential, commercial, and industrial sectors within each utility’s service area.
KEMA evaluated CalEERAM for Energy Commission staff using two frameworks. The first framework assessed the model’s overall approach, structure, and consistency with other studies. The second framework evaluated the 12 largest POUs’ specific model inputs, consistency with sales forecasts, adequacy of documentation, and model outputs. According to KEMA’s analysis, the CalEERAM approach and algorithms generally appear to be sound, and model data is drawn from reliable sources. However, KEMA’s analysis identified a number of data errors that initially hindered their analysis of the model inputs and outputs.
In July 2010, Energy Commission staff and KEMA received model data from the 12 largest utilities that contributed to generating results presented in the 2010 CMUA Status Report. During the analysis of the 12 utility models, KEMA observed that the potential estimates of five POUs differed from those published in the 2010 CMUA Status Report. 48 This indicated that the POUs were continuing to revise their models after they officially filed results. In August 2010, KEMA also identified a modeling error affecting some key CalEERAM inputs.49 (Table 5)
48 The changes to Anaheim and Imperial were particularly large; Anaheim’s cumulative market potential decreased by 43 percent, and Imperial’s increased by 43 percent. Glendale decreased of 19 percent, Roseville decreased 15 percent, and Pasadena increased about 3 percent.
49 The most important error that KEMA identified was the incorrect matching of building types and measures. Specific measures are usually unique to a building type; in this case, various building types across utilities were associated with the same measures.
30
Table 5: Timeline for Model Updates and Target Adoption
Time Period Event
Late 2009 - Early 2010 POUs and their consultant (Navigant) develop CalEERAM models.
March 2010 CMUA publishes technical, economic, and market potentials and savings targets for 36 POUs.
Spring 2010 Utilities’ targets are approved and adopted by their respective governing boards.
July 2010 KEMA receives CalEERAM models from 12 of the largest utilities in the CMUA group.
August 2010 KEMA identifies key data error affecting most of the utilities’ models.
October 2010 Utilities provide corrected CalEERAM models for 11 of the largest utilities.
October 2010 CEC and POUs agree that previously set targets will remain the official targets.
Source: KEMA, Inc., POU’s Revised Energy Efficiency Potential and Targets, July 2010, CEC-200-2008-007-SF, May 2011.
That error led to producing revised model runs for 11 of the 12 utilities. The utilities submitted these corrected model results in October 2010. At this juncture, there were three sets of potential results: those submitted in March, July, and October 2010. On average, October revisions based on the model error correction produced much smaller changes to potential estimates than the difference between the 2010 CMUA Status Report and the potential models provided in July 2010. All 11 POUs with revised models showed changes to market potential; of those, four had a change of less than 1 percent between the July and October versions.50 KEMA finalized their analysis using the POUs’ model results of October 2010; however, their report identifies the POUs that had data discrepancies throughout the analytical process.
Technical and Economic Potential Estimates Technical and economic potential for energy efficiency are theoretical constructs that provide a starting point for determining achievable levels of program potential. Technical potential is defined as the complete penetration of efficiency measures where they are technically feasible.
Table 6 shows the difference in potential levels between the two 10‐year periods analyzed in 2007 (2007‐2016) and in 2010 (2011‐2020) for the CMUA group of utilities. The estimate of technical energy savings potential is 10,693 GWh in 2020. This represents 33 percent of base energy consumption in 2020 and is 96 percent higher than the 2007 estimate of technical
50 The largest change was to Roseville, which had an 18 percent increase that almost exactly offset the decrease between the March report and the July version of the model. Turlock, Silicon Valley Market Power, Riverside, Imperial, Glendale, and Burbank had changes of between 1 percent and 6 percent.
31

potential estimated for 2016 for the same utilities. This estimate of technical potential is high compared with the technical potential for the California IOUs, which was estimated in the IOUs’ 2008 potential study51 to be 22 percent of base energy consumption. Technical potential for demand reductions is 2,861 MW in 2020, which is almost four times higher than the 2007 estimate for 2016. This marked increase in technical and economic potential levels for both energy and demand savings is likely the result of a more comprehensive and detailed modeling approach, rather than an actual change in potential.52
Economic potential narrows the savings potential to what is achievable if a utility installs measures in all feasible, cost‐effective applications.53 Two‐thirds of POUs had economic potential greater than 80 percent of technical potential. The economic energy savings potential estimated for the POUs in the 2010 study is 9,525 GWh in 2020, or 29 percent of base energy consumption. This estimate of economic potential is 136 percent higher than the 2007 estimate of economic potential in 2016 for the same utilities. It is also higher than the economic potential estimated for the IOUs, which was 19 percent of base energy consumption. The estimate of economic demand savings potential is 2,283 MW in 2020, which is more than four times higher than the 2007 estimate for 2016.
Some POUs deliberately excluded certain cost‐effective measures from their CalEERAM model runs, thus artificially lowering their economic potential. While there may be good reasons to exclude certain cost‐effective measures from an estimate of market potential or specific programs, utilities should include them when they estimate economic potential.
Table 6: Estimated Potential for POUs (Excluding SMUD and LADWP)
Energy Potential - GWh Demand Potential - MW Technical Economic Market Technical Economic Market
Current Analysis (2010), 2011-2020 10,693 9,525 2,143 2,861 2,283 526
Previous Analysis (2007), 2007-2016 5,460 4,038 2,109 732 507 302
Source: KEMA, Inc., POU’s Revised Energy Efficiency Potential and Targets, July 2010, CEC-200-2008-007-SF, May 2011.
51 Itron, 2008. California Energy Efficiency Potential Study, prepared for PG&E on behalf of California investor‐owned utilities.
52 Unfortunately, the POUs did not investigate the differences in levels of technical and economic potential between the 2007 and 2010 models. The scope of KEMA’s work focused on the POUs’ current potential model (by Navigant) and did not include an in‐depth analysis of their previous potential model (by Rocky Mountain Institute) used in 2007. The POUs should include an identification of these differences in their next (2013) efficiency potential study revision.
53 Cost‐effectiveness for each measure in the analysis uses the TRC test, which takes into account the value of savings evaluated at avoided generation costs, incremental measure costs, and program administrative costs.
32
Market Potential Estimates Market potential is the estimated energy or peak savings that would occur when customer acceptance and other market constraints are incorporated into the analysis. Market potential is the key focus of any efficiency potential assessment because it typically defines what a utility’s portfolio of programs can achieve with specific resources. With few exceptions, the CMUA group of POUs used market potential for its revised targets for 2011–2020. For these utilities, the estimate of market potential for energy savings through 2020 was 2,205 GWh, which is slightly higher than the 10‐year market potential estimated for the same utilities in 2007. The current market potential captures about 6.8 percent of electricity consumption and about 23 percent of the estimated economic potential over the 10‐year period. By comparison, the estimated 10‐year market potential for the IOUs ranged from 3 percent to 6 percent of electricity consumption and 15 percent to 33 percent of economic potential. 54 The current POU market potential, which reduces 0.7 percent of energy consumption per year, appears to reflect a moderate level of program effort in comparison with studies conducted across the United States in recent years.55 The estimate of market demand savings potential is 526 MW in 2020, which is 74 percent higher than the 2007 estimate for 2016.
Table 7 shows the CMUA group’s potentials by sector in 2020. The nonresidential sector dominates, accounting for 74 percent of technical potential, 78 percent of economic potential, and 79 percent of market potential. The POUs will need to focus significant program attention on their nonresidential customers to attain the higher levels of energy savings required to meet consumption reduction goals.
54 The POUs’ 2010 market potential calculations assumed one customer incentive scenario of 50 percent of incremental measure cost. The 2008 IOU study included three primary market potential scenarios: a base scenario that mirrored 2004‐2005 programs, a full incentive scenario that assumes incentives cover 100 percent of incremental measure costs, and a mid scenario with incentives set halfway between the base and full scenarios.
55 A comparison of recent potential studies and their scenarios shows that about half of the market potentials reflect annual savings between 0.4 percent and 1.0 percent of consumption, with the remainder showing annual savings greater than 1.0 percent of consumption. See Table B1 of KEMA’s report, which is Attachment A of this report.
33

Table 7: 2020 Market Potential by Sector
Energy Potential-GWh Peak Demand Potential-MW
Sector Technical Economic Market Technical Economic Market
Residential 2,811 2,119 454 1,044 590 142
Nonresidential 7,882 7,407 1,689 1,818 1,693 384
Total 10,693 9,526 2,143 2,862 2,283 526
Note: Excludes LADWP and SMUD
Source: KEMA, Inc., POU’s Revised Energy Efficiency Potential and Targets, July 2010, CEC-200-2008-007-SF, May 2011.
Assessment of Annual Energy and Peak Savings Targets
The technical, economic, and market potential estimates contribute to utility efficiency policies, in particular, target‐ or goal‐setting. As noted above, the POUs adopted their market potential estimates as their revised efficiency targets. AB 2021 directs the Energy Commission to assess these revised targets and, if necessary, suggest modifications. While KEMA’s analysis evaluates the aggregated CMUA group’s potential estimates and targets, KEMA carried out a more detailed assessment for the 12 largest POUs in the CMUA group using the four criteria mandated by AB 2021:56
• Cost‐effectiveness is determined by applying the TRC to each measure in a POU’s estimate of technical potential.
• Feasibility is determined by assessing the relative difference between a POU’s market potential and targets, the annual performance of its 2006–2009 efficiency programs, and the adequacy of its efficiency resources.
• Reliability is determined by assessing the POU’s ability to deliver its 2006–2009 projected savings consistently and its use of evaluation studies to verify reported savings.
• Reduction of energy consumption is determined by the ability of a POU’s savings targets to reduce energy consumption by at least 10 percent in the next 10 years.
The CMUA group and SMUD have adopted annual energy efficiency targets that amount to 4,004 GWh for 2011–2020 as Table 8 shows. Appendix A contains a list of these 37 POUs’ adopted annual energy efficiency targets.
56 These 12 utilities that provided updated CalEERAM efficiency potential results for detailed analysis account for 47 percent of the 37 POU’s cumulative efficiency target in 2020.
34
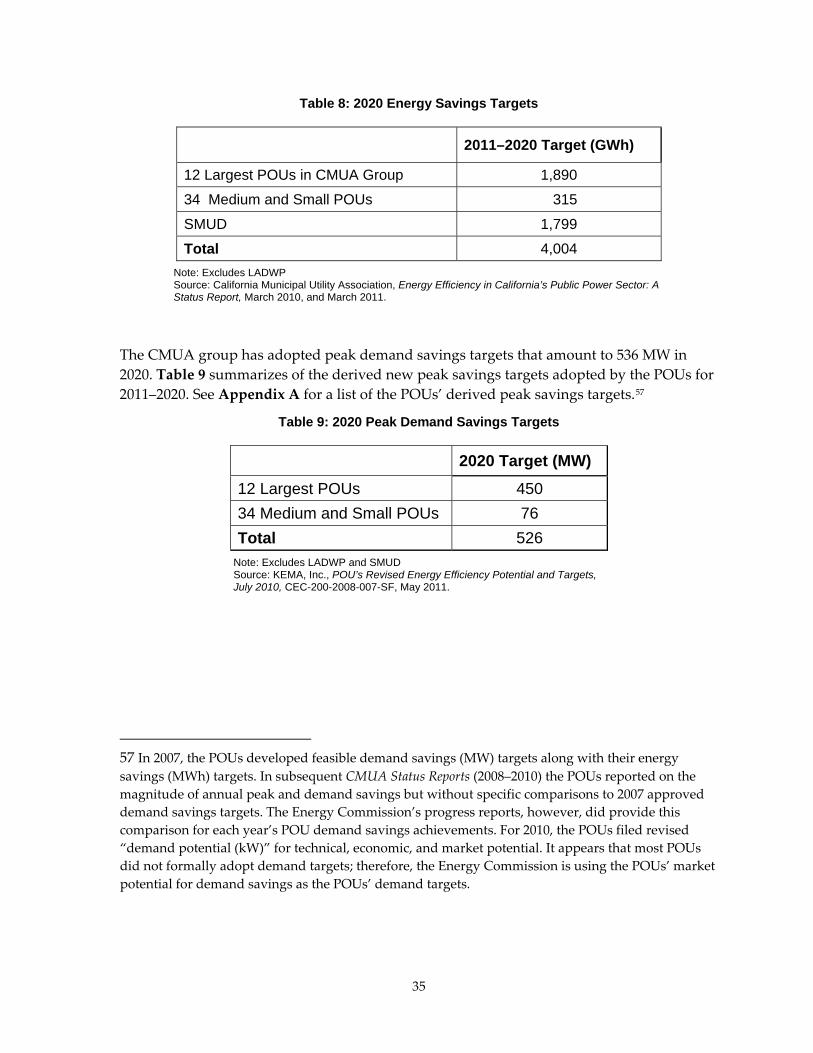
Table 8: 2020 Energy Savings Targets
2011–2020 Target (GWh)
12 Largest POUs in CMUA Group 1,890
34 Medium and Small POUs 315
SMUD 1,799
Total 4,004 Note: Excludes LADWP Source: California Municipal Utility Association, Energy Efficiency in California’s Public Power Sector: A Status Report, March 2010, and March 2011.
The CMUA group has adopted peak demand savings targets that amount to 536 MW in 2020. Table 9 summarizes of the derived new peak savings targets adopted by the POUs for 2011–2020. See Appendix A for a list of the POUs’ derived peak savings targets.57
Table 9: 2020 Peak Demand Savings Targets
2020 Target (MW)
12 Largest POUs 450 34 Medium and Small POUs 76 Total 526
Note: Excludes LADWP and SMUD Source: KEMA, Inc., POU’s Revised Energy Efficiency Potential and Targets, July 2010, CEC-200-2008-007-SF, May 2011.
57 In 2007, the POUs developed feasible demand savings (MW) targets along with their energy savings (MWh) targets. In subsequent CMUA Status Reports (2008–2010) the POUs reported on the magnitude of annual peak and demand savings but without specific comparisons to 2007 approved demand savings targets. The Energy Commission’s progress reports, however, did provide this comparison for each year’s POU demand savings achievements. For 2010, the POUs filed revised “demand potential (kW)” for technical, economic, and market potential. It appears that most POUs did not formally adopt demand targets; therefore, the Energy Commission is using the POUs’ market potential for demand savings as the POUs’ demand targets.
35
The state’s goal, established by AB 2021, is to reduce total forecasted electrical consumption by 10 percent over the next 10 years. Figure 8 shows the CMUA group’s 10‐year cumulative targets for 2011–2020 as a percentage of their forecasted base energy consumption. The ranking of utilities is by system load (smallest to largest). The average cumulative 10‐year annual energy efficiency target for the 12 largest utilities was 7.6 percent, while the average for the 12 smallest was only 2.9 percent. The mid‐sized utilities had a mix of high and low targets, averaging 5.4 percent. SMUD (which is not included in Figure 8) set its new targets at 14 percent of its forecasted load for 2011–2020.
SMUD, Pasadena, Anaheim, and Truckee‐Donner targets meet the AB 2021 10‐percent‐over‐10‐year goal. Glendale and Colton’s targets fall just short of the 10 percent goal, which could be due to a rounding in CalEERAM.58
Most of the 12 largest utilities whose potential models KEMA evaluated in detail calculated their market potential estimates and efficiency targets using incentives calculated as 50 percent of incremental measure cost. When KEMA ran the 12 models using a 75 percent incentive scenario, all but 1 of the 12 utilities’ market potential met the 10 percent goal. This indicates that many of the POUs may be able to meet the AB 2021 goals if they had access to additional resources beyond those factored into the market potential estimates.
58 However, the estimates may overstate their market potentials and resulting targets . Pasadena’s estimate may include overstated office floor space. Truckee’s savings potential for ground‐source heat pumps may be less than the model suggests.
36
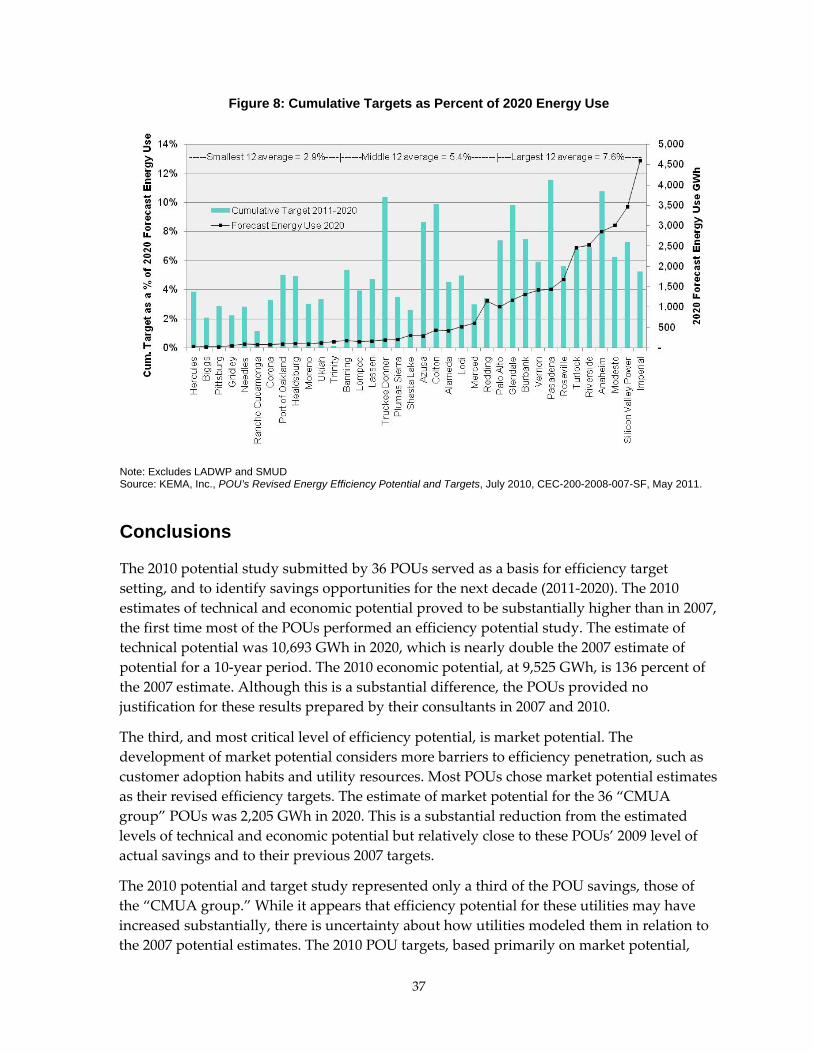
Figure 8: Cumulative Targets as Percent of 2020 Energy Use
Note: Excludes LADWP and SMUD Source: KEMA, Inc., POU’s Revised Energy Efficiency Potential and Targets, July 2010, CEC-200-2008-007-SF, May 2011.
Conclusions
The 2010 potential study submitted by 36 POUs served as a basis for efficiency target setting, and to identify savings opportunities for the next decade (2011‐2020). The 2010 estimates of technical and economic potential proved to be substantially higher than in 2007, the first time most of the POUs performed an efficiency potential study. The estimate of technical potential was 10,693 GWh in 2020, which is nearly double the 2007 estimate of potential for a 10‐year period. The 2010 economic potential, at 9,525 GWh, is 136 percent of the 2007 estimate. Although this is a substantial difference, the POUs provided no justification for these results prepared by their consultants in 2007 and 2010.
The third, and most critical level of efficiency potential, is market potential. The development of market potential considers more barriers to efficiency penetration, such as customer adoption habits and utility resources. Most POUs chose market potential estimates as their revised efficiency targets. The estimate of market potential for the 36 “CMUA group” POUs was 2,205 GWh in 2020. This is a substantial reduction from the estimated levels of technical and economic potential but relatively close to these POUs’ 2009 level of actual savings and to their previous 2007 targets.
The 2010 potential and target study represented only a third of the POU savings, those of the “CMUA group.” While it appears that efficiency potential for these utilities may have increased substantially, there is uncertainty about how utilities modeled them in relation to the 2007 potential estimates. The 2010 POU targets, based primarily on market potential,
37

have increased only slightly over the 2007 targets in the later years of the decade, and fall short of reducing energy consumption 10 percent over 10 years. While the targets in 2010 may be less aggressive than those adopted in 2007, they may be more feasible and, ultimately, more reliable. Many POUs lacked experience predicting future efficiency program activity in 2007. Over the last three years, the POUs have gained program experience to predict potential savings from their energy efficiency programs more accurately. In addition, the economic conditions since 2008 have led to more conservative estimates of customer participation in efficiency programs.
Are the POUs increasing their efficiency savings levels as AB 2021 envisioned? The answer is cautiously optimistic. The analysis of 2010 savings in Chapter 2 indicates that most POUs have seen substantial increases in POU efficiency expenditures and reported savings from 2006 through 2010. At this juncture, POUs’ third‐party verifications of savings, as noted in Chapter 3, are not uniformly reliable for use in the Energy Commission’s load forecast. However, a number of utilities have found both utility and customer value in evaluation, measurement, and verification (EM&V) projects.
38

Chapter 5: Recommendations In this chapter, staff makes recommendations in each of these areas:
• Information requested to interpret efficiency progress • POU efficiency evaluation, measurement, and verification • POU potential estimates and target process
Information Requested to Interpret Efficiency Progress
Energy Commission staff has requested information from POUs that would help to interpret data on efficiency progress. The POUs’ response to information requests has improved since 2008, but the Energy Commission is still not receiving some significant material. As staff learns the specific POU objections to data sharing, the Energy Commission and the POUs can develop resolutions.
Staff Recommendations • The most important data needed by staff to evaluate annual savings is the E3 Reporting
Tool, which calculates savings potential for each POU based on specific assumptions. In 2011, the POUs stated that the reason for withholding the data tool was to protect customer identities. The Energy Commission is not interested in individual customers and is willing to accommodate an aggregation or redaction adjustment of the E3 Tool. Energy Commission staff and its consultant, KEMA, are willing to work with POUs to develop such an adjustment so the E3 Reporting Tool can be conveyed to Energy Commission staff along with CMUA’s 2012 Status Report.
• The Energy Commission wishes to compare energy efficiency expenditures with other uses of public goods charge (PGC) funding: low‐income, research and development, and renewable energy projects. Although staff may be able to obtain the data by researching utility annual and financial reports, this method seems grossly inefficient. There is reason to believe that the data is readily available from POUs.59 Staff will continue to investigate why the data is not forthcoming.
• Staff requested that POUs provide information on the role of energy efficiency in integrated resource planning in 2009. Public Utilities Code Section 9615 mandates that POUs treat energy efficiency savings as a procurement investment and first acquire energy efficiency that is cost‐effective, reliable, and feasible to meet load before other supply options. The cost‐effectiveness of energy efficiency over most other supply
59 Southern California Public Power Authority, Comments on Draft Staff Report, letter to California Energy Commission, July 1, 2009.
39

sources is well documented, thereby justifying increased investment.60 The 2009 and 2010 CMUA Status Reports identified utilities that were allocating funds to efficiency programs beyond their PGC funding, but there is no indication that this allocation results from an integrated resource assessment. 61 While some POUs have performed recent integrated resource assessments, they usually treat efficiency as a load adjustment, not an equally comparable supply resource.62
POU Efficiency Evaluation, Measurement, and Verification
Since the passage of AB 2021 in 2006, nearly half of the POUs have filed at least one EM&V impact study for program years 2007–2009. A number of utilities plan to provide studies for their 2010 programs during 2011. While the POUs have made a start in EM&V, there is much work to accomplish for them to understand the value of EM&V studies and their practical execution. The Energy Commission developed EM&V guidelines in 2010 but learned in 2011 workshops that some POUs did not see the value of EM&V, and others had difficulty meeting the Energy Commission’s draft guidelines. POU diversity in size, resources, customer types, and program delivery approaches makes it difficult to issue “one size fits all” prescriptive guidelines for EM&V activities.
Staff Recommendations • POUs should continue with their current plans for 2011 EM&V studies, especially the
Southern California utilities that are working on their first EM&V studies since 2007. The POUs should submit the completed studies to the Energy Commission as soon as their governing councils approve them. The Energy Commission is especially interested in working through the impact study process with LADWP staff because of the magnitude of their savings.
• POUs should report their programs’ EM&V status in the 2012 CMUA Status Report using the table developed in the Energy Commission’s draft guidelines (January 2011).
• The Energy Commission will engage with POUs to develop versions of revised EM&V guidance documents, tools, and services appropriate for the three POU groups. These groups are stratified by these criteria: magnitude of savings, capacity to perform and manage EM&V studies, and program need for specific evaluation information. Staff will develop the guidelines by December 2011. The Energy Commission will sponsor two
60 A good discussion of efficiency’s role in integrated resource planning appears in Some Thoughts in Treating Energy Efficiency as a Resource, by Tom Eckman, available at http://www.electricitypolicy.com/.
61 CMUA report, March 2009, p. 19, and 2010, p. 33.
62 See public utility websites for their integrated resource plans; for example, LADWP’s is at http://www.ladwp.com/ladwp/cms/ladwp014239.pdf.
40
EM&V workshops each year to increase agency and POU understanding of practical EM&V; the next workshops will occur in January‐February 2012.
• The POUs have raised the possibility of abandoning the use of net‐to‐gross ratios in favor of total market gross goals as California’s IOUs may do. Since this would change the manner in which analysts measure savings toward utility targets, the POUs and the Energy Commission should explore the implications of this change. Also, staff members should identify any specific utility need for the information yielded by net savings analysis, so they can incorporate this information into new guidelines.
POU Potential Estimates and Target Process in 2010–2011
AB 2021 intended the triennial statewide estimate of energy efficiency potential to include the IOUs and the POUs. In 2007, all these utilities had recent potential studies and approved targets and goals from which to develop the statewide savings potential estimate. In 2010–2011, however, POUs had no revised potential estimates and goals, SMUD had no revised potential, and LADWP had neither revised savings potential nor targets. As a result, the 2011 statewide efficiency estimate included most of the POUs but did not represent the historically largest contributors to California’s utility energy savings.63
However, the potential and target work achieved in 2010–2011 were beneficial. All utility staff and others who participated learned a substantial amount about the methods and usefulness of efficiency potential and target analysis. Staff proposes the following recommendations for the POU’s efficiency potential and targets method, the reporting and documentation requirements, and the use of CalEERAM for energy efficiency program planning.
Staff Recommendations • While the Energy Commission works closely with the CPUC to coordinate analytical
products, it does not control the deadlines in their proceedings. At this juncture, IOU goals will not be revised or approved until 2012.64 The Energy Commission is coordinating with the CPUC post‐2013 potential and goals process. The goal of both agencies is to better align the efficiency planning process of the IOUs and POUs. The Energy Commission should identify these AB 2021 schedule issues, discuss them with the utilities and CPUC, and, if necessary, recommend an adjustment to the triennial deadline for statewide potential estimates and targets.
63 LADWP is working on a potential and target study with Global Energy Partners; its original due date was fall 2010. SMUD expects to renew its potential estimates in partnership with the IOUs; the IOUs revised their targets in May 2010.
64 Scope and schedule for the revised IOUs’ post‐2013 efficiency potential study and goals are available at http://www.iepec.org/CPUC%20RPF%20021511.pdf.
41

• While AB 2021 required all POUs to submit revised efficiency potential estimates and targets by June 1, 2010, neither SMUD nor LADWP were in full compliance by that date. In the future, revisions of potential and targets should anticipate AB 2021 deadlines.
• KEMA’s consultant report (Attachment A) presents detailed recommendations that will improve the integrity of CalEERAM and its results.
• The estimates of technical savings potential for the POUs in 2010 were substantially greater than those of 2007. The model used by the POUs’ consultant (Navigant) for estimating potential in 2010 was different from the model used by their 2007 consultant (Rocky Mountain Institute). Unfortunately, the POUs in the CMUA group did not initiate an investigation of these obvious differences in potential magnitudes. The Energy Commission’s consultant report discusses possible causes for the differences including model structures; however, there is no final resolution. This frustrates interpretation of the technical potential data, a situation that, in turn, discourages POU staff from using the data in program planning.
• There must be some continuity in method from one revision to the next to make sense of changes in potential estimates. POUs should consider using CalEERAM again for the next round of target setting. The next revision can redress the issues identified in the staff and consultant reports. Furthermore, the POUs and Energy Commission have invested significant resources in understanding and using the current model. If POUs do not use CalEERAM in the next potential study cycle, they must provide an accounting of method and data changes from one triennial revision to the next to maintain credibility in the process.
• The 2010–2011 revision of the statewide efficiency potential estimate and target (goals) required the Energy Commission to perform extensive additional data collection from the utilities. The initial data from the POUs in March 2010 contained errors that were costly for the Energy Commission to identify and rectify. In the future, the POUs must be more responsive to data quality expectations and remedy problems in a timelier manner. The Energy Commission requires more documentation from the POUs to understand the assumptions behind the potential estimates and energy efficiency targets adopted. Utilities should provide the Energy Commission with the version of the model that they used to calculate targets. POUs should document the ways in which they customized the model and the reasons for the customization.
• Despite issues with the method, the analysis of POU energy efficiency potential and adopted targets clearly showed that some POUs were more aggressively pursuing energy efficiency than others to meet their load. Market potential, upon which utilities typically calculated their annual efficiency targets, used customer incentives that were 50 percent of measure incremental cost. When KEMA ran the 12 POU models using a 75 percent incentive scenario, the market potential of all but 1 of the 12 utilities met the 10 percent goal. This suggests that POUs can better achieve the goals of AB 2021 by considering higher customer incentive levels for their energy efficiency programs.
42

GLOSSARY
Acronym Definition
AB 2021 Assembly Bill 2021
AB 32 Assembly Bill 32
ARRA American Recovery and Reinvestment Act
CalEERAM California Energy Efficiency and Resource Assessment Model
CFL Compact fluorescent light
CMUA California Municipal Utilities Association
CPUC California Public Utilities Commission
DEER Database of Energy Efficient Resources
EM&V Evaluation, measurement, and verification
GW/GWh Gigawatt/gigawatt hour
HVAC Heating, ventilation, and air conditioning
IEPR Integrated Energy Policy Report
IOU Investor-owned utility
LADWP Los Angeles Department of Water and Power
MMth Million therms
MW/MWh Megawatt/megawatt hour
PG&E Pacific Gas and Electric Company
PGC Public goods charge
POU Publicly owned utility
RRIM Risk Reward Incentive Mechanism
SB 1037 Senate Bill 1037
SB 488 Senate Bill 488
SCE Southern California Edison Company
SCG Southern California Gas Company
SDG&E San Diego Gas & Electric Company
SMUD Sacramento Municipal Utility District
Strategic Plan California’s Long-Term Energy Efficiency Strategic Plan
Therm Standard unit of measurement for the amount of gas used
TMG Total Market Gross
TRC Total Resource Cost
ZNE Zero Net Energy buildings meet their energy need through energy efficiency and self production of energy, often through a distributed renewable or “clean” (zero emissions) resources.
43

44
A‐1
APPENDIX A: Publicly Owned Utilities’ Efficiency Targets 2011–2020 Table A‐1 Publicly Owned Utilities’ Annual Energy Savings Targets 2011–2020
Table A‐2 Publicly Owned Utilities’ Peak Demand/Targets 2011–2020

A‐2
Table A-1: Publicly Owned Utilities Annual Energy Savings Targets 2011–2020
Utilities
Annual Targets (MWH) Annual Average Percent of Sales Forecast
2011 2012 2013 2014 2015 2016 2017 2018 2019 2020 10 yr Total
Alameda 1,574 1,675 1,771 1,833 1,887 1,935 1,964 1,982 1,996 2,014 18,631 0.46%
Anaheim 24,264 22,542 26,296 32,291 37,785 36,956 34,802 32,568 30,339 28,238 306,081 1.12%
Azusa 2,068 1,904 2,071 2,367 2,591 2,736 2,738 2,715 2,692 2,669 24,551 0.89%
Banning 962 706 782 894 944 975 979 970 945 918 9,076 0.59%
Biggs 44 33 35 38 42 45 42 39 35 32 385 0.21%
Burbank 8,768 7,549 8,301 9,523 10,553 11,125 10,894 10,524 10,225 9,928 97,391 0.77%
Colton 3,162 2,902 3,508 4,594 5,064 5,043 4,827 4,574 4,317 4,092 42,082 1.05%
Corona 166 167 190 227 256 288 312 335 358 381 2,678 0.34%
Glendale 11,060 11,520 11,280 11,320 11,380 11,430 11,490 11,550 11,620 11,680 114,330 1.00%
Gridley 75 75 75 87 98 107 111 114 117 120 979 0.23%
Healdsburg 420 420 420 515 557 603 614 617 617 614 5,396 0.52%
Hercules 75 74 86 102 113 122 130 137 145 153 1,137 0.52%
IID 19,743 16,480 18,381 21,281 24,147 26,614 27,674 28,234 28,576 28,910 240,041 0.56%
LADWP 255,000 252,000252,000 252,000 252,000 252,000 252,000 252,000 252,000252,000 2,523,000
Lassen 375 375 375 501 650 849 1,043 1,177 1,203 1,219 7,767 0.49%
Lodi 2,296 1,667 1,905 2,242 2,587 2,873 2,948 2,985 3,019 3,053 25,575 0.51%
Lompoc 517 336 395 459 544 630 708 760 776 785 5,911 0.40%
Merced 1,316 1,117 1,258 1,483 1,765 2,054 2,143 2,191 2,242 2,297 17,866 0.33%
Modesto 16,207 15,136 16,154 18,161 20,252 21,857 21,102 20,074 19,258 18,623 186,824 0.67%
Moreno Valley 274 219 234 260 288 304 292 276 261 247 2,655 0.30%
Needles 205 160 181 211 246 280 299 312 323 334 2,549 0.33%
Palo Alto 5,799 6,290 6,782 7,276 7,906 7,927 7,950 7,973 7,999 8,026 73,929 0.75%
Pasadena 14,500 14,500 14,500 17,500 17,500 17,500 17,500 17,500 17,500 17,500 166,000 1.23%Pittsburg Power 42 37 40 46 55 64 64 62 60 59 529 0.29%
Plumas Sierra 237 230 247 279 346 491 778 1,191 1,546 1,688 7,033 0.36%
Port of Oakland 406 420 424 430 437 488 523 529 533 541 4,731 0.53%Rancho Cucamonga 46 49 55 65 74 85 93 101 110 118 796 0.12%
Redding 2,523 2,496 3,076 3,776 4,457 4,655 4,649 4,518 4,402 4,350 38,903 0.38%
Riverside 14,017 12,526 13,705 16,071 18,159 19,617 19,994 20,037 20,082 20,169 174,378 0.75%
Roseville 8,390 8,360 8,604 8,639 9,054 10,032 10,903 10,470 9,874 9,387 93,713 0.62%
SMUD 166,000 169,000171,000 175,000 179,000 183,000 185,000 187,000 190,000194,000 1,798,000 1.50%
Shasta Lake 300 300 300 713 833 934 1,016 1,073 1,108 1,143 7,719 0.29%Silicon Valley Power 23,055 25,415 26,255 28,502 29,506 28,413 25,456 23,052 21,328 20,020 251,003 0.77%
Trinity 14 13 14 14 14 14 14 14 14 14 139 0.01%Truckee Donner 1,978 1,640 1,706 1,727 1,762 2,017 2,257 2,317 2,214 2,263 19,880 1.13%
TID 12,900 12,644 13,829 15,846 17,814 19,269 19,075 18,675 18,379 18,172 166,603 0.73%
Ukiah 250 250 310 341 375 413 454 499 549 604 4,045 0.33%
Vernon 8,020 7,863 7,992 8,655 9,766 10,716 9,468 8,073 6,962 6,087 83,601 0.63%
Total 607,049 599,089614,538 645,268 670,807 684,462 682,305 677,221 673,723672,444 6,525,905
Source: Majority of data is from California Municipal Utility Association, Energy Efficiency in California’s Public Power Sector: A Status Report, March 2010. The shaded utilities data was drawn from their October 2010 revised CalEERAM.
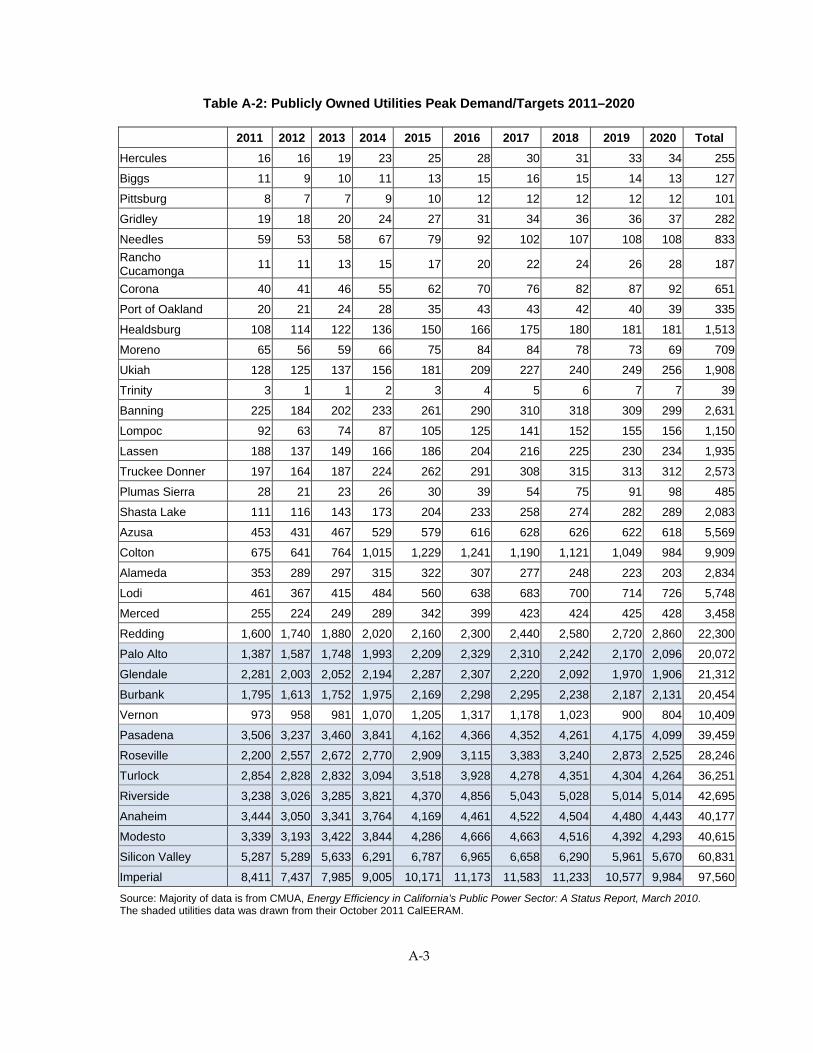
A‐3
Table A-2: Publicly Owned Utilities Peak Demand/Targets 2011–2020
2011 2012 2013 2014 2015 2016 2017 2018 2019 2020 Total Hercules 16 16 19 23 25 28 30 31 33 34 255
Biggs 11 9 10 11 13 15 16 15 14 13 127
Pittsburg 8 7 7 9 10 12 12 12 12 12 101
Gridley 19 18 20 24 27 31 34 36 36 37 282
Needles 59 53 58 67 79 92 102 107 108 108 833Rancho Cucamonga 11 11 13 15 17 20 22 24 26 28 187
Corona 40 41 46 55 62 70 76 82 87 92 651
Port of Oakland 20 21 24 28 35 43 43 42 40 39 335
Healdsburg 108 114 122 136 150 166 175 180 181 181 1,513
Moreno 65 56 59 66 75 84 84 78 73 69 709
Ukiah 128 125 137 156 181 209 227 240 249 256 1,908
Trinity 3 1 1 2 3 4 5 6 7 7 39
Banning 225 184 202 233 261 290 310 318 309 299 2,631
Lompoc 92 63 74 87 105 125 141 152 155 156 1,150
Lassen 188 137 149 166 186 204 216 225 230 234 1,935
Truckee Donner 197 164 187 224 262 291 308 315 313 312 2,573
Plumas Sierra 28 21 23 26 30 39 54 75 91 98 485
Shasta Lake 111 116 143 173 204 233 258 274 282 289 2,083
Azusa 453 431 467 529 579 616 628 626 622 618 5,569
Colton 675 641 764 1,015 1,229 1,241 1,190 1,121 1,049 984 9,909
Alameda 353 289 297 315 322 307 277 248 223 203 2,834
Lodi 461 367 415 484 560 638 683 700 714 726 5,748
Merced 255 224 249 289 342 399 423 424 425 428 3,458
Redding 1,600 1,740 1,880 2,020 2,160 2,300 2,440 2,580 2,720 2,860 22,300
Palo Alto 1,387 1,587 1,748 1,993 2,209 2,329 2,310 2,242 2,170 2,096 20,072
Glendale 2,281 2,003 2,052 2,194 2,287 2,307 2,220 2,092 1,970 1,906 21,312
Burbank 1,795 1,613 1,752 1,975 2,169 2,298 2,295 2,238 2,187 2,131 20,454
Vernon 973 958 981 1,070 1,205 1,317 1,178 1,023 900 804 10,409
Pasadena 3,506 3,237 3,460 3,841 4,162 4,366 4,352 4,261 4,175 4,099 39,459
Roseville 2,200 2,557 2,672 2,770 2,909 3,115 3,383 3,240 2,873 2,525 28,246
Turlock 2,854 2,828 2,832 3,094 3,518 3,928 4,278 4,351 4,304 4,264 36,251
Riverside 3,238 3,026 3,285 3,821 4,370 4,856 5,043 5,028 5,014 5,014 42,695
Anaheim 3,444 3,050 3,341 3,764 4,169 4,461 4,522 4,504 4,480 4,443 40,177
Modesto 3,339 3,193 3,422 3,844 4,286 4,666 4,663 4,516 4,392 4,293 40,615
Silicon Valley 5,287 5,289 5,633 6,291 6,787 6,965 6,658 6,290 5,961 5,670 60,831
Imperial 8,411 7,437 7,985 9,005 10,171 11,173 11,583 11,233 10,577 9,984 97,560
Source: Majority of data is from CMUA, Energy Efficiency in California’s Public Power Sector: A Status Report, March 2010. The shaded utilities data was drawn from their October 2011 CalEERAM.

A‐4

APPENDIX B: Investor-Owned Utilities’ Efficiency Targets, Reported and Evaluated Savings for 2006–2010 Table B‐1 shows the IOUs’ energy savings, peak savings, and natural gas savings for program years 2006–2010. Also, included in the table is the IOUs’ performance against these goals.
CPUC Goals ‐ Energy savings goals are established by the CPUC for the IOUs. The current goals are based on historical energy efficiency savings assumptions.
Reported Savings ‐ Energy savings are based on the utility records of installed technologies and the savings from those technologies based on pre‐evaluation assumptions.
Evaluated Savings ‐ Evaluated savings are based on field research of the installations that were reported during 2006‐2009 program cycle.
No evaluation studies have been completed for 2010 so only reported savings are available.
B‐1
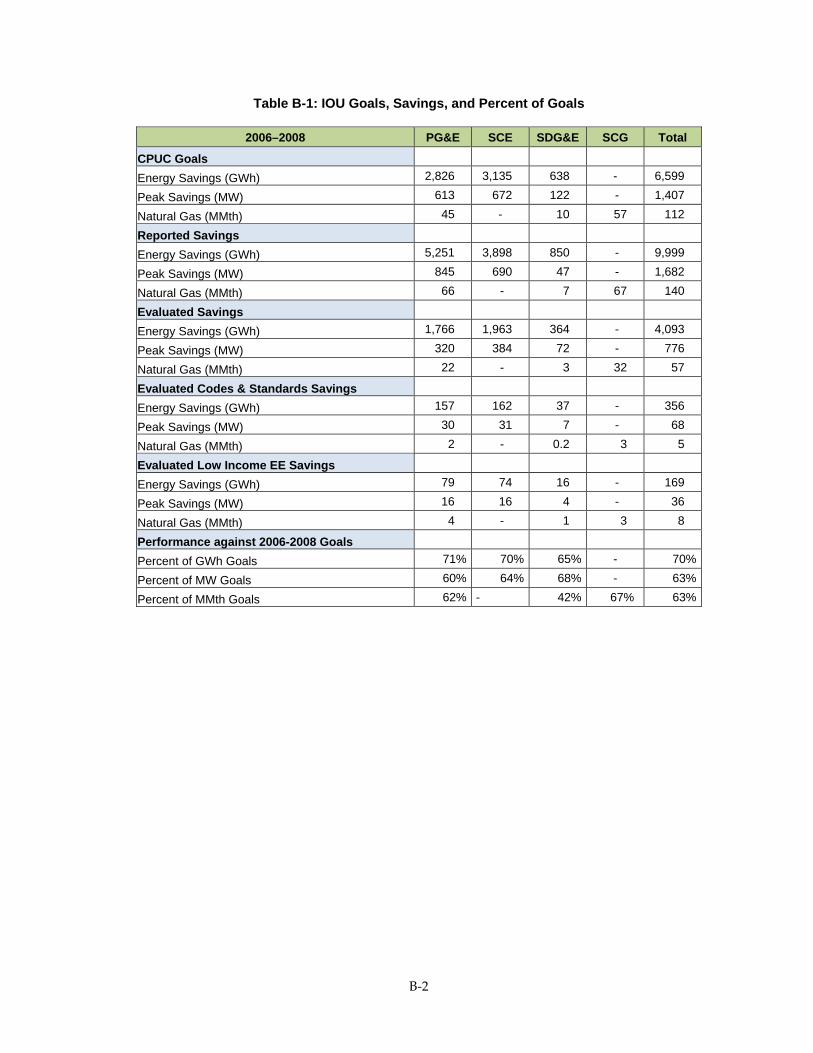
Table B-1: IOU Goals, Savings, and Percent of Goals
2006–2008 PG&E SCE SDG&E SCG Total
CPUC Goals
Energy Savings (GWh) 2,826 3,135 638 - 6,599
Peak Savings (MW) 613 672 122 - 1,407
Natural Gas (MMth) 45 - 10 57 112
Reported Savings
Energy Savings (GWh) 5,251 3,898 850 - 9,999
Peak Savings (MW) 845 690 47 - 1,682
Natural Gas (MMth) 66 - 7 67 140
Evaluated Savings
Energy Savings (GWh) 1,766 1,963 364 - 4,093
Peak Savings (MW) 320 384 72 - 776
Natural Gas (MMth) 22 - 3 32 57
Evaluated Codes & Standards Savings
Energy Savings (GWh) 157 162 37 - 356
Peak Savings (MW) 30 31 7 - 68
Natural Gas (MMth) 2 - 0.2 3 5
Evaluated Low Income EE Savings
Energy Savings (GWh) 79 74 16 - 169
Peak Savings (MW) 16 16 4 - 36
Natural Gas (MMth) 4 - 1 3 8
Performance against 2006-2008 Goals
Percent of GWh Goals 71% 70% 65% - 70%
Percent of MW Goals 60% 64% 68% - 63%
Percent of MMth Goals 62% - 42% 67% 63%
B‐2

Table B-1: IOU Goals, Savings, and Percent of Goals (Continued)
2009 PG&E SCE SDG&E SCG Total
CPUC Goals
Energy Savings (GWh) 3,840 4,265 839 - 8,944
Peak Savings (MW) 843 919 162 - 1,924
Natural Gas (MMth) 60 - 13 84 157
Reported Savings
Energy Savings (GWh) 6,730 5,470 1,324 - 13,524
Peak Savings (MW) 1,093 979 256 - 2,328
Natural Gas (MMth) 90 - 12 87 189
Evaluated Savings
Energy Savings (GWh) 3,363 3,246 778 - 7,387
Peak Savings (MW) 555 596 163 - 1,314
Natural Gas (MMth) 33 - 7 56 96
Evaluated Codes & Standards Savings
Energy Savings (GWh) 299 309 70 - 678
Peak Savings (MW) 55 56 13 - 124
Natural Gas (MMth) 3 - 0.3 5 8
Evaluated Low Income EE Savings
Energy Savings (GWh) 112 97 21 - 230
Peak Savings (MW) 22 23 5 - 50
Natural Gas (MMth) 5 - 1 1 7
Performance against 2009 Goals
Percent of GWh Goals 98% 86% 104% - 93%
Percent of MW Goals 75% 73% 112% - 77%
Percent of MMth Goals 68% - 64% 74% 71%2010 PG&E SCE SDG&E SCG Total
CPUC Goals
Energy Savings (GWh) 964 1,117 195 - 2,276
Peak Savings (MW) 218 245 39 - 502
Natural Gas (MMth) 16 - 4 28 48
Reported Savings
Energy Savings (GWh) 2,060 2,236 311 - 4,607
Peak Savings (MW) 357 430 50 - 837
Natural Gas (MMth) 17 - 1 28 46
Performance against 2010 Goals
Percent of GWh Goals 214% 200% 159% - 202%
Percent of MW Goals 164% 176% 128% - 167%
Percent of MMth Goals 106% - 29% 100% 97%
Source: CPUC – 2006–2008 Energy Efficiency Evaluation Report, July 2010 ftp://ftp.cpuc.ca.gov/gopher-data/energy%20efficiency/2006-2008%20Energy%20Efficiency%20Evaluation%20Report%20-%20Full.pdf; CPUC - Energy Efficiency Evaluation Report for the 2009 Bridge Funding Period, January 2011 http://www.cpuc.ca.gov/NR/rdonlyres/D66CCF63-5786-49C7-B250-00675D91953C/0/EEEvaluationReportforthe2009BFPeriod.pdf.
B‐3

B‐4
C‐1
ATTACHMENT A: KEMA’s Report on POU’s Revised Energy Efficiency Potential and Targets


![MITSUBISHI ELECTRIC Global website...I-Efficient Programming_fod005go tha 23.1 POU POU MELSOFT GX Works3 POU POU 5udnnffi51.Jtnm Comment [Vers on] ver. B [Last Change] 2017/02/17](https://static.fdocuments.in/doc/165x107/5f6133031420e27f9d6d2c7d/mitsubishi-electric-global-website-i-efficient-programmingfod005go-tha-231.jpg)


