ACFrOgC3ok7aSXkkrA7necJNdZydhVxyUlHHxOyJnMGA4nxJ7wFZMalKZr ... Case Round 2 - Butler... · Titan...
72
Transcript of ACFrOgC3ok7aSXkkrA7necJNdZydhVxyUlHHxOyJnMGA4nxJ7wFZMalKZr ... Case Round 2 - Butler... · Titan...


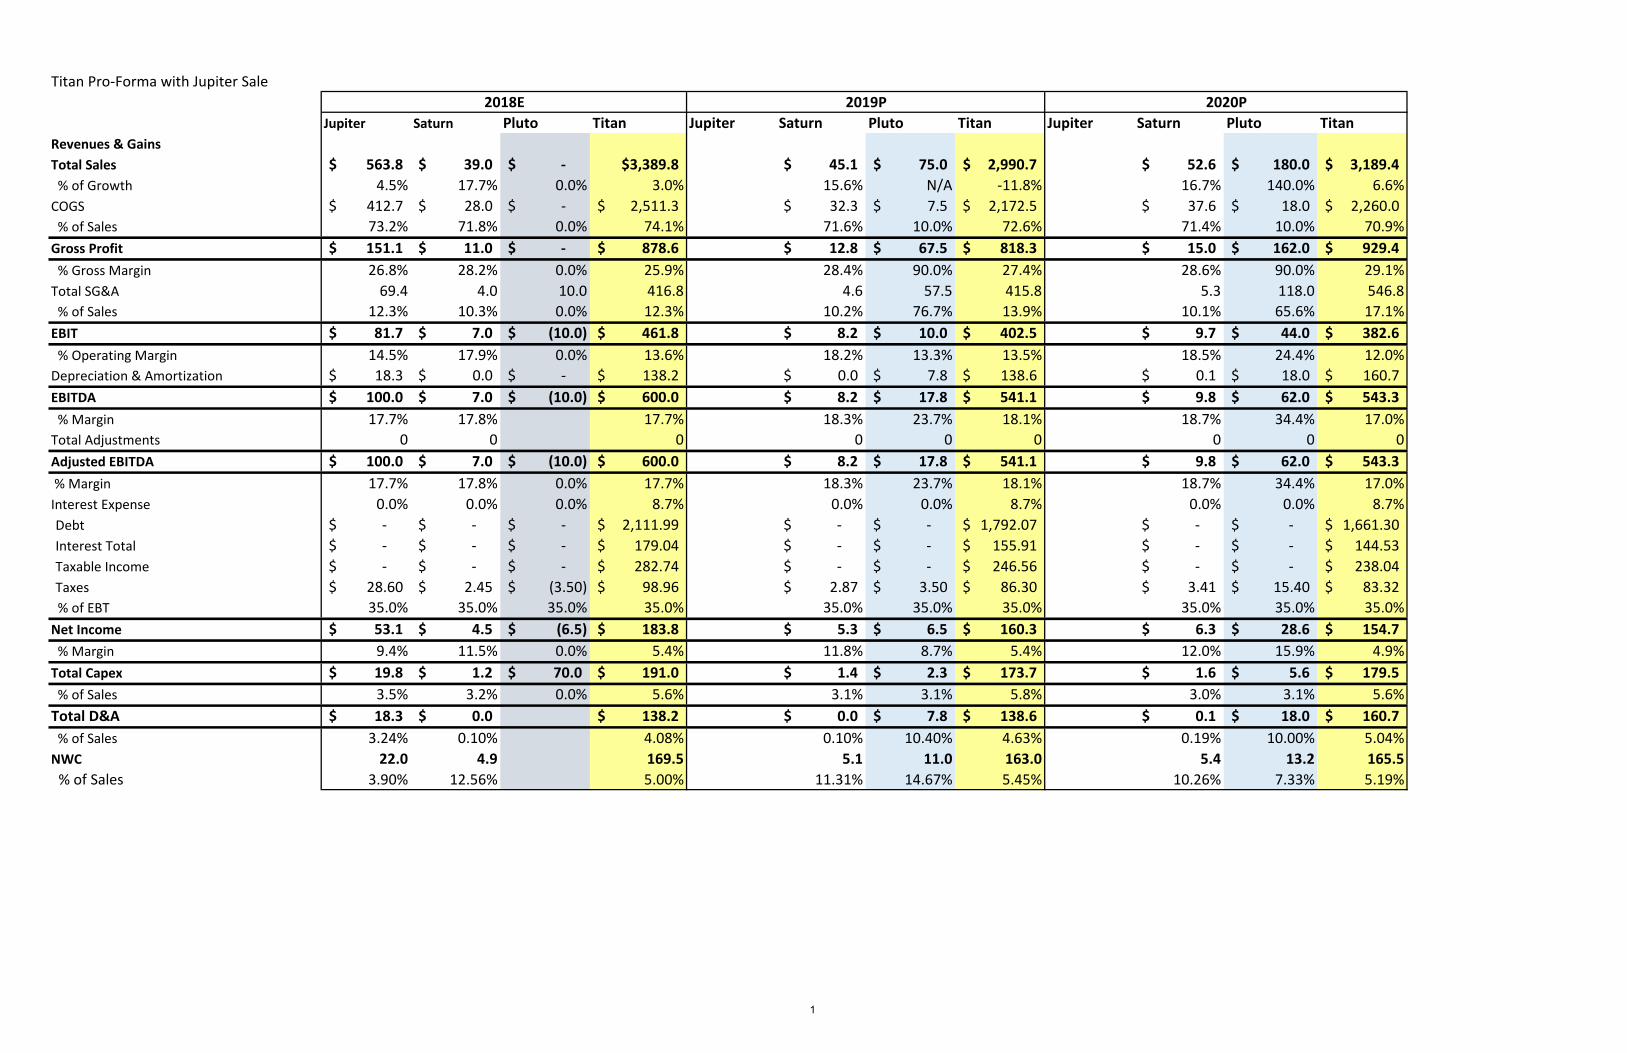
Titan Pro-Forma with Jupiter Sale
Jupiter Saturn Pluto Titan Jupiter Saturn Pluto Titan Jupiter Saturn Pluto TitanRevenues & GainsTotal Sales 563.8$ 39.0$ -$ $3,389.8 45.1$ 75.0$ 2,990.7$ 52.6$ 180.0$ 3,189.4$ % of Growth 4.5% 17.7% 0.0% 3.0% 15.6% N/A -11.8% 16.7% 140.0% 6.6%COGS 412.7$ 28.0$ -$ 2,511.3$ 32.3$ 7.5$ 2,172.5$ 37.6$ 18.0$ 2,260.0$ % of Sales 73.2% 71.8% 0.0% 74.1% 71.6% 10.0% 72.6% 71.4% 10.0% 70.9%Gross Profit 151.1$ 11.0$ -$ 878.6$ 12.8$ 67.5$ 818.3$ 15.0$ 162.0$ 929.4$ % Gross Margin 26.8% 28.2% 0.0% 25.9% 28.4% 90.0% 27.4% 28.6% 90.0% 29.1%Total SG&A 69.4 4.0 10.0 416.8 4.6 57.5 415.8 5.3 118.0 546.8 % of Sales 12.3% 10.3% 0.0% 12.3% 10.2% 76.7% 13.9% 10.1% 65.6% 17.1%EBIT 81.7$ 7.0$ (10.0)$ 461.8$ 8.2$ 10.0$ 402.5$ 9.7$ 44.0$ 382.6$
14.5% 17.9% 0.0% 13.6% 18.2% 13.3% 13.5% 18.5% 24.4% 12.0%Depreciation & Amortization 18.3$ 0.0$ -$ 138.2$ 0.0$ 7.8$ 138.6$ 0.1$ 18.0$ 160.7$
100.0$ 7.0$ (10.0)$ 600.0$ 8.2$ 17.8$ 541.1$ 9.8$ 62.0$ 543.3$ % Margin 17.7% 17.8% 17.7% 18.3% 23.7% 18.1% 18.7% 34.4% 17.0%
0 0 0 0 0 0 0 0 0Adjusted EBITDA 100.0$ 7.0$ (10.0)$ 600.0$ 8.2$ 17.8$ 541.1$ 9.8$ 62.0$ 543.3$ % Margin 17.7% 17.8% 0.0% 17.7% 18.3% 23.7% 18.1% 18.7% 34.4% 17.0%Interest Expense 0.0% 0.0% 0.0% 8.7% 0.0% 0.0% 8.7% 0.0% 0.0% 8.7%Debt -$ -$ -$ 2,111.99$ -$ -$ 1,792.07$ -$ -$ 1,661.30$ Interest Total -$ -$ -$ 179.04$ -$ -$ 155.91$ -$ -$ 144.53$ Taxable Income -$ -$ -$ 282.74$ -$ -$ 246.56$ -$ -$ 238.04$ Taxes 28.60$ 2.45$ (3.50)$ 98.96$ 2.87$ 3.50$ 86.30$ 3.41$ 15.40$ 83.32$
% of EBT 35.0% 35.0% 35.0% 35.0% 35.0% 35.0% 35.0% 35.0% 35.0% 35.0%Net Income 53.1$ 4.5$ (6.5)$ 183.8$ 5.3$ 6.5$ 160.3$ 6.3$ 28.6$ 154.7$ % Margin 9.4% 11.5% 0.0% 5.4% 11.8% 8.7% 5.4% 12.0% 15.9% 4.9%Total Capex 19.8$ 1.2$ 70.0$ 191.0$ 1.4$ 2.3$ 173.7$ 1.6$ 5.6$ 179.5$ % of Sales 3.5% 3.2% 0.0% 5.6% 3.1% 3.1% 5.8% 3.0% 3.1% 5.6%Total D&A 18.3$ 0.0$ 138.2$ 0.0$ 7.8$ 138.6$ 0.1$ 18.0$ 160.7$ % of Sales 3.24% 0.10% 4.08% 0.10% 10.40% 4.63% 0.19% 10.00% 5.04%NWC 22.0 4.9 169.5 5.1 11.0 163.0 5.4 13.2 165.5 % of Sales 3.90% 12.56% 5.00% 11.31% 14.67% 5.45% 10.26% 7.33% 5.19%
% Operating Margin
EBITDA
Total Adjustments
2018E 2019P 2020P
1
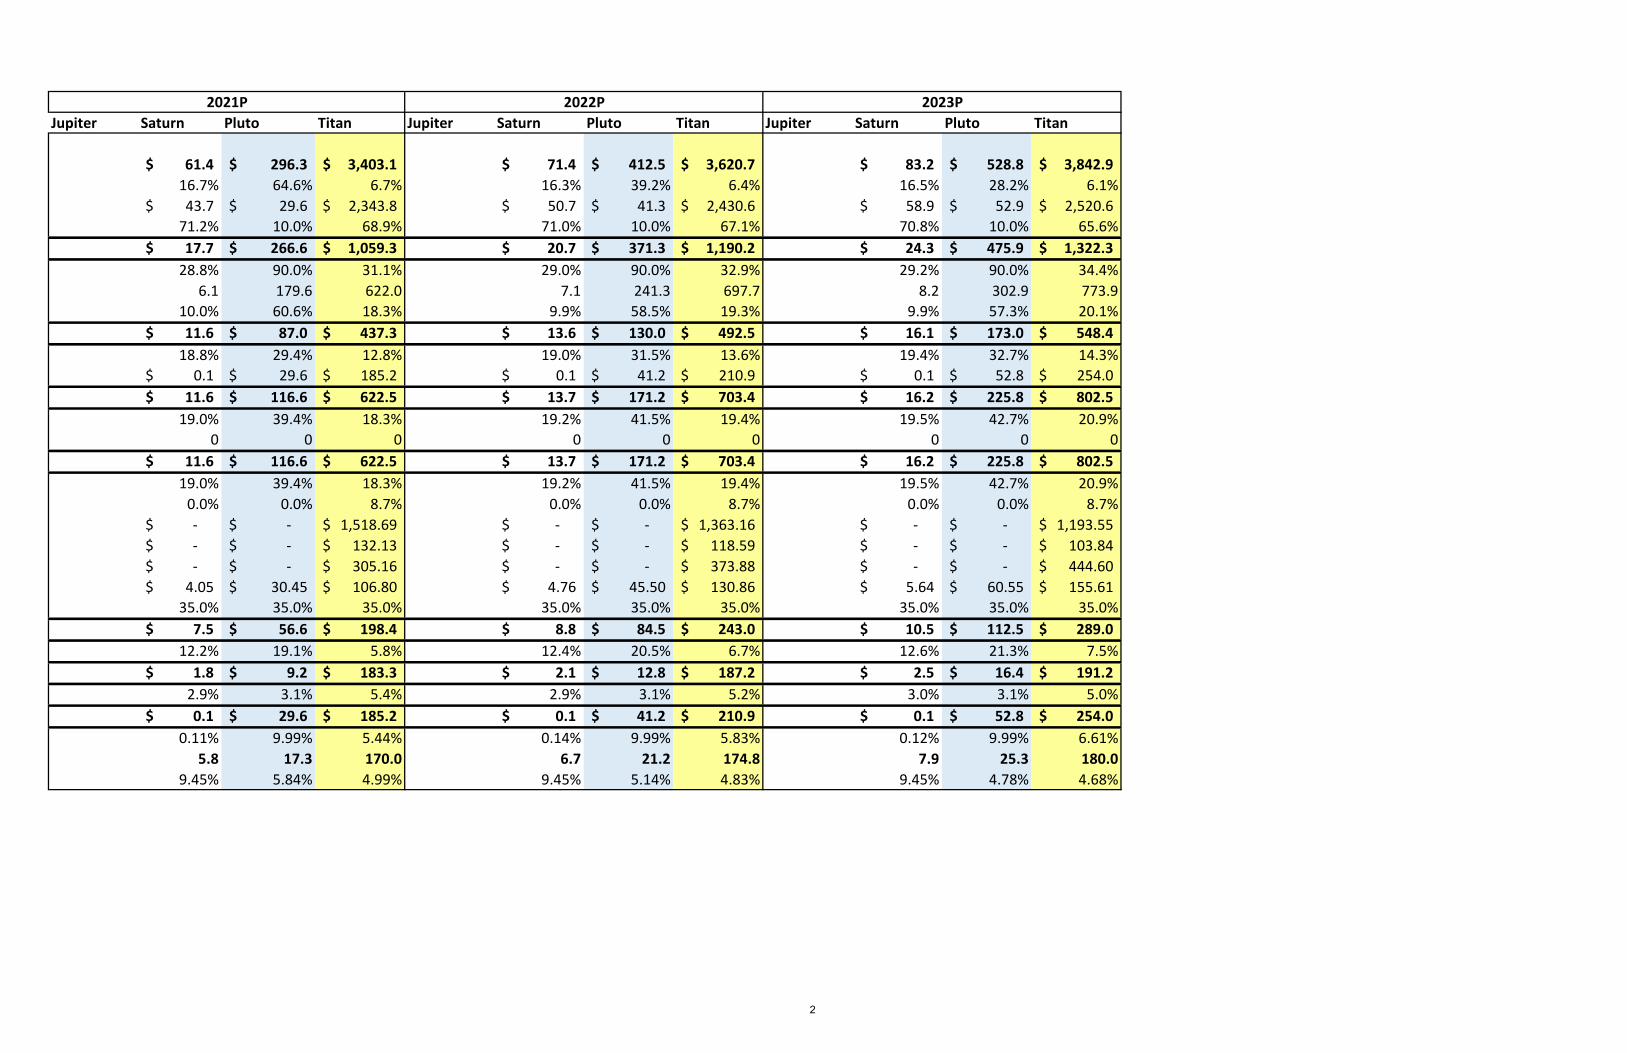
Jupiter Saturn Pluto Titan Jupiter Saturn Pluto Titan Jupiter Saturn Pluto Titan
61.4$ 296.3$ 3,403.1$ 71.4$ 412.5$ 3,620.7$ 83.2$ 528.8$ 3,842.9$ 16.7% 64.6% 6.7% 16.3% 39.2% 6.4% 16.5% 28.2% 6.1%43.7$ 29.6$ 2,343.8$ 50.7$ 41.3$ 2,430.6$ 58.9$ 52.9$ 2,520.6$
71.2% 10.0% 68.9% 71.0% 10.0% 67.1% 70.8% 10.0% 65.6%17.7$ 266.6$ 1,059.3$ 20.7$ 371.3$ 1,190.2$ 24.3$ 475.9$ 1,322.3$
28.8% 90.0% 31.1% 29.0% 90.0% 32.9% 29.2% 90.0% 34.4%6.1 179.6 622.0 7.1 241.3 697.7 8.2 302.9 773.9
10.0% 60.6% 18.3% 9.9% 58.5% 19.3% 9.9% 57.3% 20.1%11.6$ 87.0$ 437.3$ 13.6$ 130.0$ 492.5$ 16.1$ 173.0$ 548.4$
18.8% 29.4% 12.8% 19.0% 31.5% 13.6% 19.4% 32.7% 14.3%0.1$ 29.6$ 185.2$ 0.1$ 41.2$ 210.9$ 0.1$ 52.8$ 254.0$
11.6$ 116.6$ 622.5$ 13.7$ 171.2$ 703.4$ 16.2$ 225.8$ 802.5$ 19.0% 39.4% 18.3% 19.2% 41.5% 19.4% 19.5% 42.7% 20.9%
0 0 0 0 0 0 0 0 011.6$ 116.6$ 622.5$ 13.7$ 171.2$ 703.4$ 16.2$ 225.8$ 802.5$
19.0% 39.4% 18.3% 19.2% 41.5% 19.4% 19.5% 42.7% 20.9%0.0% 0.0% 8.7% 0.0% 0.0% 8.7% 0.0% 0.0% 8.7%-$ -$ 1,518.69$ -$ -$ 1,363.16$ -$ -$ 1,193.55$ -$ -$ 132.13$ -$ -$ 118.59$ -$ -$ 103.84$ -$ -$ 305.16$ -$ -$ 373.88$ -$ -$ 444.60$
4.05$ 30.45$ 106.80$ 4.76$ 45.50$ 130.86$ 5.64$ 60.55$ 155.61$ 35.0% 35.0% 35.0% 35.0% 35.0% 35.0% 35.0% 35.0% 35.0%
7.5$ 56.6$ 198.4$ 8.8$ 84.5$ 243.0$ 10.5$ 112.5$ 289.0$ 12.2% 19.1% 5.8% 12.4% 20.5% 6.7% 12.6% 21.3% 7.5%
1.8$ 9.2$ 183.3$ 2.1$ 12.8$ 187.2$ 2.5$ 16.4$ 191.2$ 2.9% 3.1% 5.4% 2.9% 3.1% 5.2% 3.0% 3.1% 5.0%0.1$ 29.6$ 185.2$ 0.1$ 41.2$ 210.9$ 0.1$ 52.8$ 254.0$
0.11% 9.99% 5.44% 0.14% 9.99% 5.83% 0.12% 9.99% 6.61%5.8 17.3 170.0 6.7 21.2 174.8 7.9 25.3 180.0
9.45% 5.84% 4.99% 9.45% 5.14% 4.83% 9.45% 4.78% 4.68%
2022P 2023P2021P
2
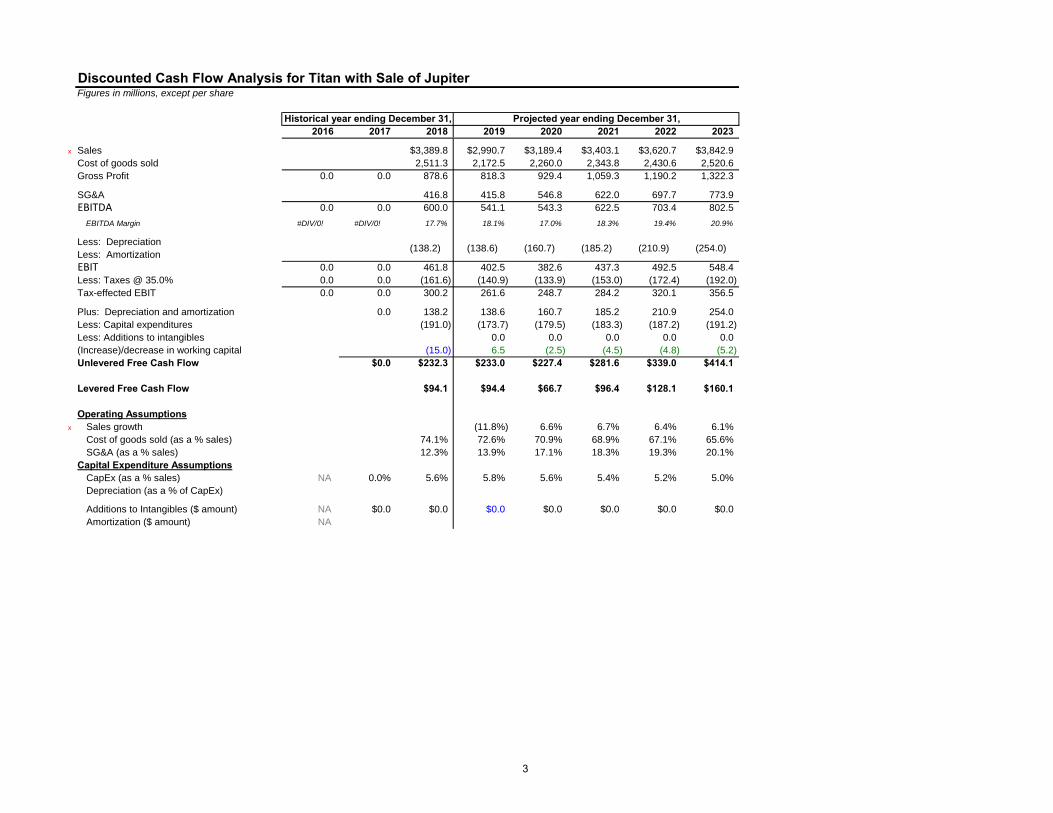
Discounted Cash Flow Analysis for Titan with Sale of JupiterFigures in millions, except per share
Historical year ending December 31, Projected year ending December 31,2016 2017 2018 2019 2020 2021 2022 2023
x Sales $3,389.8 $2,990.7 $3,189.4 $3,403.1 $3,620.7 $3,842.9Cost of goods sold 2,511.3 2,172.5 2,260.0 2,343.8 2,430.6 2,520.6Gross Profit 0.0 0.0 878.6 818.3 929.4 1,059.3 1,190.2 1,322.3
SG&A 416.8 415.8 546.8 622.0 697.7 773.9EBITDA 0.0 0.0 600.0 541.1 543.3 622.5 703.4 802.5
EBITDA Margin #DIV/0! #DIV/0! 17.7% 18.1% 17.0% 18.3% 19.4% 20.9%
Less: DepreciationLess: AmortizationEBIT 0.0 0.0 461.8 402.5 382.6 437.3 492.5 548.4Less: Taxes @ 35.0% 0.0 0.0 (161.6) (140.9) (133.9) (153.0) (172.4) (192.0)Tax-effected EBIT 0.0 0.0 300.2 261.6 248.7 284.2 320.1 356.5
Plus: Depreciation and amortization 0.0 138.2 138.6 160.7 185.2 210.9 254.0Less: Capital expenditures (191.0) (173.7) (179.5) (183.3) (187.2) (191.2)Less: Additions to intangibles 0.0 0.0 0.0 0.0 0.0(Increase)/decrease in working capital (15.0) 6.5 (2.5) (4.5) (4.8) (5.2)Unlevered Free Cash Flow $0.0 $232.3 $233.0 $227.4 $281.6 $339.0 $414.1
Levered Free Cash Flow $94.1 $94.4 $66.7 $96.4 $128.1 $160.1
Operating Assumptionsx Sales growth (11.8%) 6.6% 6.7% 6.4% 6.1%
Cost of goods sold (as a % sales) 74.1% 72.6% 70.9% 68.9% 67.1% 65.6%SG&A (as a % sales) 12.3% 13.9% 17.1% 18.3% 19.3% 20.1%
Capital Expenditure AssumptionsCapEx (as a % sales) NA 0.0% 5.6% 5.8% 5.6% 5.4% 5.2% 5.0%Depreciation (as a % of CapEx)
Additions to Intangibles ($ amount) NA $0.0 $0.0 $0.0 $0.0 $0.0 $0.0 $0.0Amortization ($ amount) NA
(210.9) (254.0)(138.2) (138.6) (160.7) (185.2)
3

Perpetuity Growth Method EBITDA Multiple Method
Weighted average cost of capital: 10.0% Weighted average cost of capital: 10.0% Net present value of free cash flow $1,100.0 Net present value of free cash flow $1,100.0
Terminal growth rate 3.0% Terminal multiple 6.8xTerminal value $6,092.8 Terminal value $5,456.7 Present value of the terminal value 3,783.2 Present value of the terminal value 3,388.2
Enterprise value $4,883.1 Enterprise value $4,488.2 Less: Net debt* (1,612.1) Less: Net debt* (1,612.1) Equity value $3,271.1 Equity value $2,876.1
Diluted shares: 100.000 Diluted shares: 100.000
x Equity Value Per Share $32.71 Equity Value Per Share $28.76
Implied EBITDA Terminal Multiple Implied Perpetuity Growth RateTerminal year unlevered free cash flow $414.1 Terminal year EBITDA $802.5Weighted average cost of capital 10.0% Weighted average cost of capital 10.0%Growth rate of free cash flow after terminal year 3.0% Multiple 6.8xTerminal year EBITDA $802.5 Terminal year unlevered free cash flow $414.1
Implied EBITDA Terminal Multiple: 7.6x Implied Growth Rate: 2.2%[$414.1 x (1+3.0%) x (1+0.0%)^0.5 )] / [$802.5 x (10.0% - 3.0%)] = 7.6x [$802.5 x 6.8 x 10.0%) - $414.1) x (1+0.0%)^0.5 )] / [($802.5 x 6.8) + $414.1 x (1+0.0%)^0.5] = 2.2%
* Note: Net debt represents total debt, minority interest and preferred stock, less cash & equivalents.This model is provided "as is". Training The Street, Inc. and their affiliates have no liability arising out of the use of this model.
4
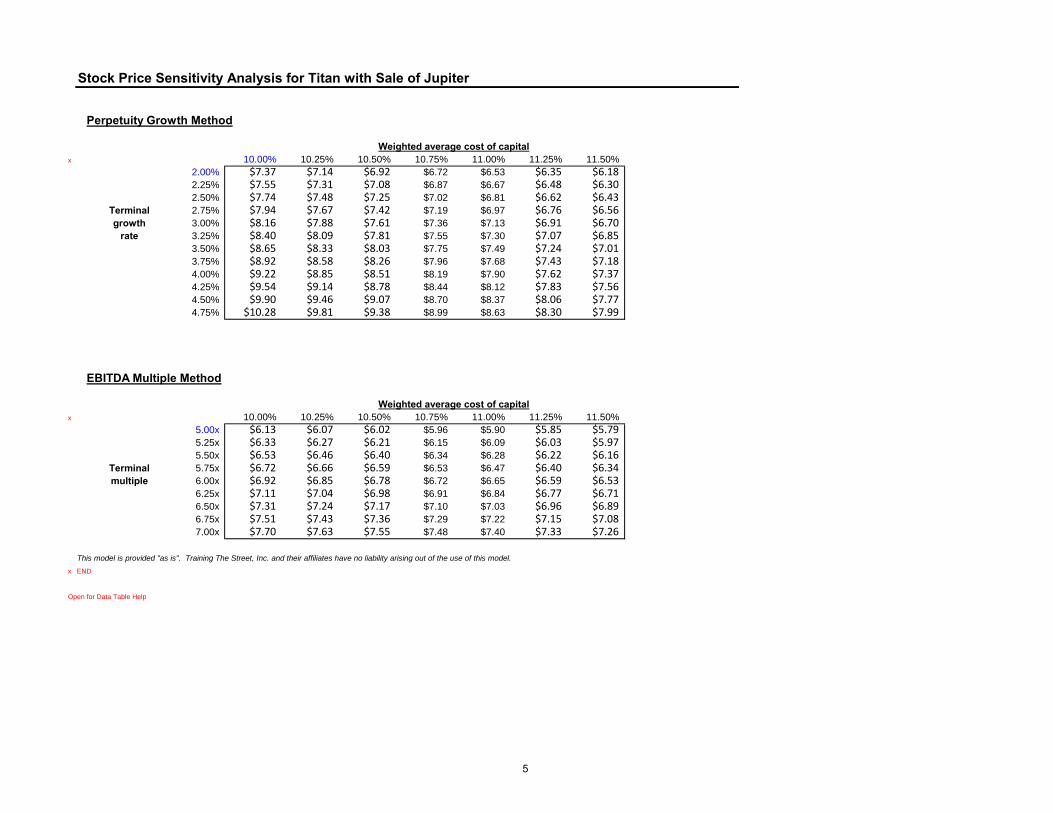
Stock Price Sensitivity Analysis for Titan with Sale of Jupiter
Perpetuity Growth Method
Weighted average cost of capitalx 10.00% 10.25% 10.50% 10.75% 11.00% 11.25% 11.50%
2.00% $7.37 $7.14 $6.92 $6.72 $6.53 $6.35 $6.182.25% $7.55 $7.31 $7.08 $6.87 $6.67 $6.48 $6.302.50% $7.74 $7.48 $7.25 $7.02 $6.81 $6.62 $6.43
Terminal 2.75% $7.94 $7.67 $7.42 $7.19 $6.97 $6.76 $6.56growth 3.00% $8.16 $7.88 $7.61 $7.36 $7.13 $6.91 $6.70
rate 3.25% $8.40 $8.09 $7.81 $7.55 $7.30 $7.07 $6.853.50% $8.65 $8.33 $8.03 $7.75 $7.49 $7.24 $7.013.75% $8.92 $8.58 $8.26 $7.96 $7.68 $7.43 $7.184.00% $9.22 $8.85 $8.51 $8.19 $7.90 $7.62 $7.374.25% $9.54 $9.14 $8.78 $8.44 $8.12 $7.83 $7.564.50% $9.90 $9.46 $9.07 $8.70 $8.37 $8.06 $7.774.75% $10.28 $9.81 $9.38 $8.99 $8.63 $8.30 $7.99
EBITDA Multiple Method
Weighted average cost of capitalx 10.00% 10.25% 10.50% 10.75% 11.00% 11.25% 11.50%
5.00x $6.13 $6.07 $6.02 $5.96 $5.90 $5.85 $5.795.25x $6.33 $6.27 $6.21 $6.15 $6.09 $6.03 $5.975.50x $6.53 $6.46 $6.40 $6.34 $6.28 $6.22 $6.16
Terminal 5.75x $6.72 $6.66 $6.59 $6.53 $6.47 $6.40 $6.34multiple 6.00x $6.92 $6.85 $6.78 $6.72 $6.65 $6.59 $6.53
6.25x $7.11 $7.04 $6.98 $6.91 $6.84 $6.77 $6.716.50x $7.31 $7.24 $7.17 $7.10 $7.03 $6.96 $6.896.75x $7.51 $7.43 $7.36 $7.29 $7.22 $7.15 $7.087.00x $7.70 $7.63 $7.55 $7.48 $7.40 $7.33 $7.26
This model is provided "as is". Training The Street, Inc. and their affiliates have no liability arising out of the use of this model.x END
Open for Data Table Help
5
COPYRIGHT 2014 © by Training The Street, Inc For training purposes only!
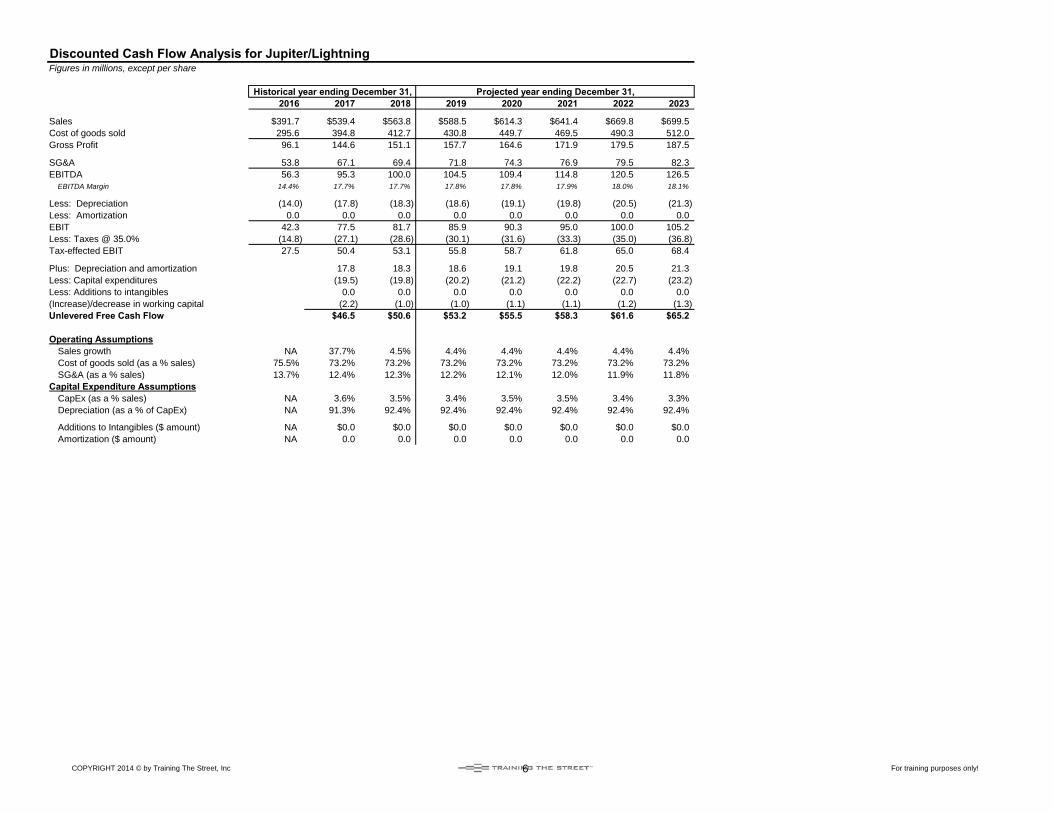
Discounted Cash Flow Analysis for Jupiter/LightningFigures in millions, except per share
Historical year ending December 31, Projected year ending December 31,2016 2017 2018 2019 2020 2021 2022 2023
Sales $391.7 $539.4 $563.8 $588.5 $614.3 $641.4 $669.8 $699.5Cost of goods sold 295.6 394.8 412.7 430.8 449.7 469.5 490.3 512.0Gross Profit 96.1 144.6 151.1 157.7 164.6 171.9 179.5 187.5
SG&A 53.8 67.1 69.4 71.8 74.3 76.9 79.5 82.3EBITDA 56.3 95.3 100.0 104.5 109.4 114.8 120.5 126.5
EBITDA Margin 14.4% 17.7% 17.7% 17.8% 17.8% 17.9% 18.0% 18.1%
Less: Depreciation (14.0) (17.8) (18.3) (18.6) (19.1) (19.8) (20.5) (21.3)Less: Amortization 0.0 0.0 0.0 0.0 0.0 0.0 0.0 0.0EBIT 42.3 77.5 81.7 85.9 90.3 95.0 100.0 105.2Less: Taxes @ 35.0% (14.8) (27.1) (28.6) (30.1) (31.6) (33.3) (35.0) (36.8)Tax-effected EBIT 27.5 50.4 53.1 55.8 58.7 61.8 65.0 68.4
Plus: Depreciation and amortization 17.8 18.3 18.6 19.1 19.8 20.5 21.3Less: Capital expenditures (19.5) (19.8) (20.2) (21.2) (22.2) (22.7) (23.2)Less: Additions to intangibles 0.0 0.0 0.0 0.0 0.0 0.0 0.0(Increase)/decrease in working capital (2.2) (1.0) (1.0) (1.1) (1.1) (1.2) (1.3)Unlevered Free Cash Flow $46.5 $50.6 $53.2 $55.5 $58.3 $61.6 $65.2
Operating AssumptionsSales growth NA 37.7% 4.5% 4.4% 4.4% 4.4% 4.4% 4.4%Cost of goods sold (as a % sales) 75.5% 73.2% 73.2% 73.2% 73.2% 73.2% 73.2% 73.2%SG&A (as a % sales) 13.7% 12.4% 12.3% 12.2% 12.1% 12.0% 11.9% 11.8%
Capital Expenditure AssumptionsCapEx (as a % sales) NA 3.6% 3.5% 3.4% 3.5% 3.5% 3.4% 3.3%Depreciation (as a % of CapEx) NA 91.3% 92.4% 92.4% 92.4% 92.4% 92.4% 92.4%
Additions to Intangibles ($ amount) NA $0.0 $0.0 $0.0 $0.0 $0.0 $0.0 $0.0Amortization ($ amount) NA 0.0 0.0 0.0 0.0 0.0 0.0 0.0
6

COPYRIGHT 2014 © by Training The Street, Inc For training purposes only!
Perpetuity Growth Method EBITDA Multiple Method
Weighted average cost of capital: 10.0% Weighted average cost of capital: 10.0% Net present value of free cash flow $220.6 Net present value of free cash flow $220.6
Terminal growth rate 3.0% Terminal multiple 6.8xTerminal value $959.1 Terminal value $860.2 Present value of the terminal value 595.5 Present value of the terminal value 534.1
Enterprise value $816.1 Enterprise value $754.7 Less: Net debt* 0.0 Less: Net debt* 0.0 Equity value $816.1 Equity value $754.7
Diluted shares: 100.000 Diluted shares: 100.000
Equity Value Per Share $8.16 Equity Value Per Share $7.55
Implied EBITDA Terminal Multiple Implied Perpetuity Growth RateTerminal year unlevered free cash flow $65.2 Terminal year EBITDA $126.5Weighted average cost of capital 10.0% Weighted average cost of capital 10.0%Growth rate of free cash flow after terminal year 3.0% Multiple 6.8xTerminal year EBITDA $126.5 Terminal year unlevered free cash flow $65.2
Implied EBITDA Terminal Multiple: 7.6x Implied Growth Rate: 2.3%[$65.2 x (1+3.0%) x (1+0.0%)^0.5 )] / [$126.5 x (10.0% - 3.0%)] = 7.6x [$126.5 x 6.8 x 10.0%) - $65.2) x (1+0.0%)^0.5 )] / [($126.5 x 6.8) + $65.2 x (1+0.0%)^0.5] = 2.3%
* Note: Net debt represents total debt, minority interest and preferred stock, less cash & equivalents.This model is provided "as is". Training The Street, Inc. and their affiliates have no liability arising out of the use of this model.
7
COPYRIGHT 2014 © by Training The Street, Inc For training purposes only!
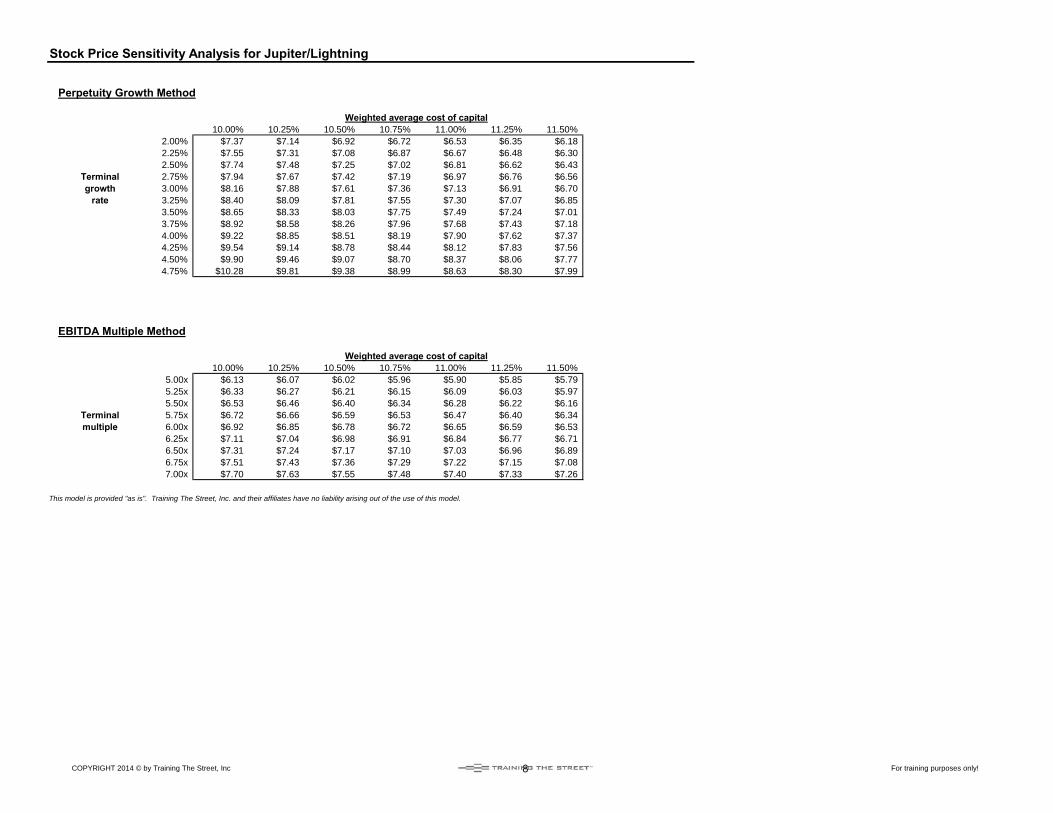
Stock Price Sensitivity Analysis for Jupiter/Lightning
Perpetuity Growth Method
Weighted average cost of capital10.00% 10.25% 10.50% 10.75% 11.00% 11.25% 11.50%
2.00% $7.37 $7.14 $6.92 $6.72 $6.53 $6.35 $6.182.25% $7.55 $7.31 $7.08 $6.87 $6.67 $6.48 $6.302.50% $7.74 $7.48 $7.25 $7.02 $6.81 $6.62 $6.43
Terminal 2.75% $7.94 $7.67 $7.42 $7.19 $6.97 $6.76 $6.56growth 3.00% $8.16 $7.88 $7.61 $7.36 $7.13 $6.91 $6.70
rate 3.25% $8.40 $8.09 $7.81 $7.55 $7.30 $7.07 $6.853.50% $8.65 $8.33 $8.03 $7.75 $7.49 $7.24 $7.013.75% $8.92 $8.58 $8.26 $7.96 $7.68 $7.43 $7.184.00% $9.22 $8.85 $8.51 $8.19 $7.90 $7.62 $7.374.25% $9.54 $9.14 $8.78 $8.44 $8.12 $7.83 $7.564.50% $9.90 $9.46 $9.07 $8.70 $8.37 $8.06 $7.774.75% $10.28 $9.81 $9.38 $8.99 $8.63 $8.30 $7.99
EBITDA Multiple Method
Weighted average cost of capital10.00% 10.25% 10.50% 10.75% 11.00% 11.25% 11.50%
5.00x $6.13 $6.07 $6.02 $5.96 $5.90 $5.85 $5.795.25x $6.33 $6.27 $6.21 $6.15 $6.09 $6.03 $5.975.50x $6.53 $6.46 $6.40 $6.34 $6.28 $6.22 $6.16
Terminal 5.75x $6.72 $6.66 $6.59 $6.53 $6.47 $6.40 $6.34multiple 6.00x $6.92 $6.85 $6.78 $6.72 $6.65 $6.59 $6.53
6.25x $7.11 $7.04 $6.98 $6.91 $6.84 $6.77 $6.716.50x $7.31 $7.24 $7.17 $7.10 $7.03 $6.96 $6.896.75x $7.51 $7.43 $7.36 $7.29 $7.22 $7.15 $7.087.00x $7.70 $7.63 $7.55 $7.48 $7.40 $7.33 $7.26
This model is provided "as is". Training The Street, Inc. and their affiliates have no liability arising out of the use of this model.
8

Name: Charger - Jupiter/Lightning LBO Notes:Before you begin: Ensure that iterations are enabled
12/31/2018 Last fiscal year end Excel 2007–2013: Office Button, Excel Options, Formulas Excel 97–2003: Tools, Options, Calculation tab
365 Numbers of days in the period Excel 2008, 2011 (Mac): Excel, Preferences, Calculation icon● Blue cells are for data input
Purchase price options: 2 ● Green cells are links to between the different worksheets 1) = Premium Paid (Public Co.) 20.0% ● Black cells are formulas 2) = EBITDA Multiple (Private Co.) 6.8x
This template is designed for instructional purposes only. Simplifications have been made to teach the
1 "Circ" To clear "#VALUE!" errors put in 0, calculate fundamentals of Leveraged Buyout Analysis. To learn more about LBO's, contact Training The Street
your model, then put back a 1 and recalculate at [email protected]
Leveraged Buyout of Charger - Jupiter/Lightning LBOFigures in millions, except per share Cumulative
Pro Forma Financing Transaction Assumptions Sources Amount % of Total EBITDA assumptionsCurrent share price $8.16 Cash $0.0 0.0% 0.0x $0.0 Minimum cash
x Offer price premium (16.7%) Bank debt 300.0 43.6% 3.0x 3.0x Bank debt / EBOffer price per share $6.80 Subordinated debt 100.0 14.5% 4.0x 1.0x Subordinated d Target diluted shares outstanding 100.000 Non Bank Mezz debt 80.0 11.6% 4.8x 0.8x Non Bank Mez Offer Value $680.0 Sponsor's equity 208.2 30.2% 6.9x
+ Debt 0.0 Total sources $688.2 100.0% 6.9x+ Preferred 0.0+ Noncontrolling interest 0.0 Uses Amount % of Total- Cash & equivalents 0.0 Purchase of equity $680.0 98.8%
Transaction Value $680.0 Refinancing of existing debt 0.0 0.0% 1.2% Transaction feeTransaction expenses @ 1.2% 8.2 1.2%Total uses $688.2 100.0%
Transaction Multiples Pro Forma IRR Returns Year 4 Year 5 Year 6Transaction Value / Sales 1.21x 6.3x 17.2% 17.8% 12.0%Transaction Value / EBITDA 6.8x EBITDA Exit 6.8x 21.4% 20.8% 14.4%Transaction Value / EBIT 8.3x 7.3x 25.3% 23.5% 16.6%
Pro Forma EBITDA $100.0
Pro Forma Projected year ending December 31,Credit stats 2018 2019 2020 2021 2022 2023 2024 2025 2026Senior Debt / EBITDA 3.0x 2.7x 2.3x 2.0x 1.7x 1.3x 1.2x 0.9x 0.5xTotal Debt / EBITDA 4.0x 3.6x 3.3x 2.9x 2.5x 2.1x 2.1x 1.7x 1.3xEBITDA / Interest NM 2.2x 2.4x 2.7x 3.0x 3.5x 3.4x 4.1x 5.0xEBITDA - CapEx / Interest NM 1.8x 1.9x 2.1x 2.4x 2.8x 2.6x 3.2x 3.9x
9

x Cash Flow Analysis for Figures in millions
Historical year ending December 31, Projected year ending December 31,2016 2017 2018 2019 2020 2021 2022 2023 2024 2025 2026
Sales $391.7 $539.4 $563.8 $588.5 $614.3 $641.4 $669.8 $699.5 $730.3 $762.4 $796.0Cost of goods sold $295.6 $394.8 $412.7 $430.8 $449.7 $469.5 $490.3 $512.0 532.4 553.5 575.5Gross profit 96.1 144.6 151.1 157.7 164.6 171.9 179.5 187.5 197.9 208.9 220.5
SG&A $53.8 $67.1 $69.4 $71.8 $74.3 $76.9 $79.5 $82.3 86.2 90.0 93.9EBITDA 56.3 95.3 100.0 104.5 109.4 114.8 120.5 126.5 111.7 118.9 126.6
EBITDA Margin 14.4% 17.7% 17.7% 17.8% 17.8% 17.9% 18.0% 18.1% 15.3% 15.6% 15.9%
Less: Depreciation (14.0) (17.8) (18.3) (18.6) (19.1) (19.8) (20.5) (21.3) (23.1) (24.1) (25.2)Less: Amortization 0.0 0.0 0.0 0.0 0.0 0.0 0.0 0.0 0.0 0.0 0.0EBIT 42.3 77.5 81.7 85.9 90.3 95.0 100.0 105.2 88.7 94.8 101.4Less: Taxes @ 35.0% (14.8) (27.1) (28.6) (30.1) (31.6) (33.3) (35.0) (36.8) (31.0) (33.2) (35.5)Tax-effected EBIT 27.5 50.4 53.1 55.8 58.7 61.8 65.0 68.4 57.6 61.6 65.9
Plus: Depreciation and amortization 17.8 18.3 18.6 19.1 19.8 20.5 21.3 23.1 24.1 25.2Less: Capital expenditures (19.5) (19.8) (20.2) (21.2) (22.2) (22.7) (23.2) (25.1) (26.2) (27.3)Less: Additions to intangibles 0.0 0.0 0.0 0.0 0.0 0.0 0.0 0.0 0.0 0.0(Increase)/decrease in working capital (2.2) (1.0) (1.0) (1.1) (1.1) (1.2) (1.3) (1.3) (1.3) (1.3)Unlevered Free Cash Flow 46.5 50.6 53.2 55.5 58.3 61.6 65.2 54.3 58.3 62.4
Less: Interest expense 0.0 0.0 (48.1) (45.9) (43.2) (40.1) (36.4) (32.8) (29.3) (25.2)Plus: Tax shield on interest @ 35.0% 0.0 0.0 16.8 16.1 15.1 14.0 12.7 11.5 10.3 8.8Levered Free Cash Flow Before Debt Paydown 46.5 50.6 22.0 25.7 30.1 35.5 41.5 33.0 39.2 46.1
Scheduled debt payments (15.0) (15.0) (15.0) (15.0) (15.0) (15.0) (15.0) (15.0)Excess cash available for debt sweep 7.0 10.7 15.1 20.5 26.5 18.0 24.2 31.1
Required deficit funding 0.0 0.0 0.0 0.0 0.0 0.0 0.0 0.0Application of excess cash
Bank debt (5.2) (8.0) (11.4) (15.4) (19.9) (13.5) (18.2) (23.3)Subordinated debt 0.0 0.0 0.0 0.0 0.0 0.0 0.0 0.0Non Bank Mezz debt (1.7) (2.7) (3.8) (5.1) (6.6) (4.5) (6.1) (7.8)
Net change in cash $0.0 $0.0 $0.0 $0.0 $0.0 $0.0 $0.0 $0.0
10
Historical year ending December 31, Projected year ending December 31,2016 2017 2018 2019 2020 2021 2022 2023 2024 2025 2026
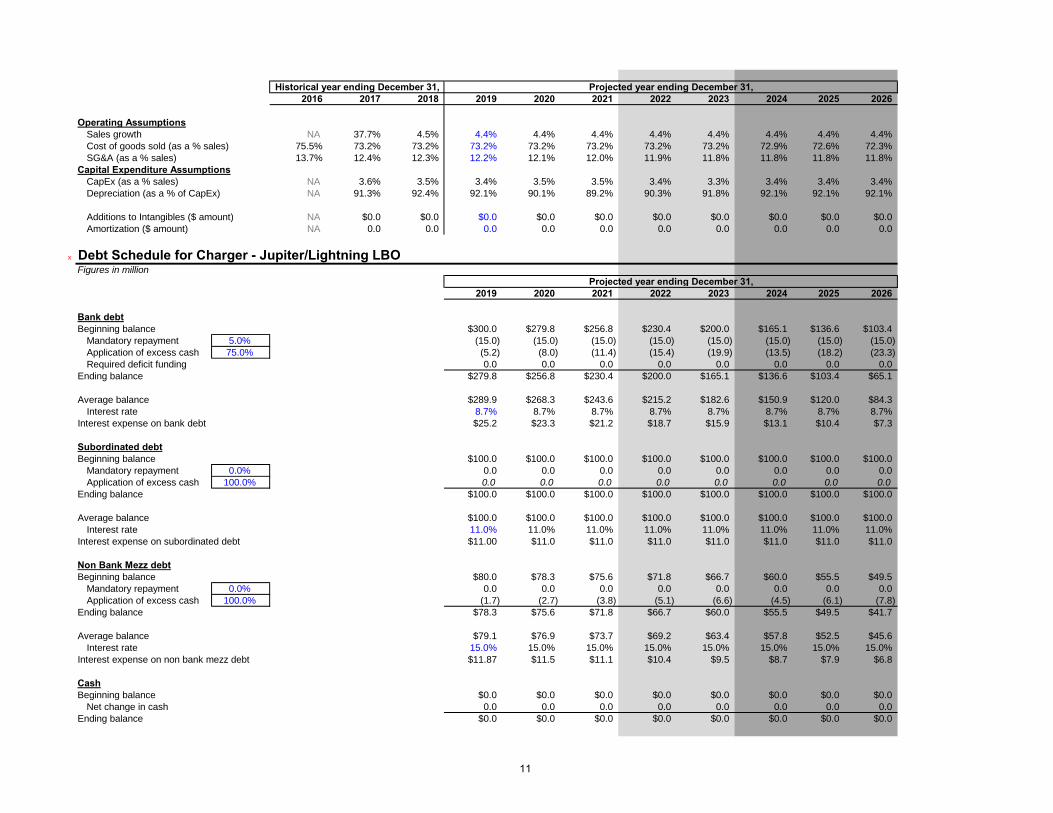
Operating AssumptionsSales growth NA 37.7% 4.5% 4.4% 4.4% 4.4% 4.4% 4.4% 4.4% 4.4% 4.4%Cost of goods sold (as a % sales) 75.5% 73.2% 73.2% 73.2% 73.2% 73.2% 73.2% 73.2% 72.9% 72.6% 72.3%SG&A (as a % sales) 13.7% 12.4% 12.3% 12.2% 12.1% 12.0% 11.9% 11.8% 11.8% 11.8% 11.8%
Capital Expenditure AssumptionsCapEx (as a % sales) NA 3.6% 3.5% 3.4% 3.5% 3.5% 3.4% 3.3% 3.4% 3.4% 3.4%Depreciation (as a % of CapEx) NA 91.3% 92.4% 92.1% 90.1% 89.2% 90.3% 91.8% 92.1% 92.1% 92.1%
Additions to Intangibles ($ amount) NA $0.0 $0.0 $0.0 $0.0 $0.0 $0.0 $0.0 $0.0 $0.0 $0.0Amortization ($ amount) NA 0.0 0.0 0.0 0.0 0.0 0.0 0.0 0.0 0.0 0.0
x Debt Schedule for Charger - Jupiter/Lightning LBOFigures in million
Projected year ending December 31,2019 2020 2021 2022 2023 2024 2025 2026
Bank debtBeginning balance $300.0 $279.8 $256.8 $230.4 $200.0 $165.1 $136.6 $103.4
Mandatory repayment 5.0% (15.0) (15.0) (15.0) (15.0) (15.0) (15.0) (15.0) (15.0)Application of excess cash 75.0% (5.2) (8.0) (11.4) (15.4) (19.9) (13.5) (18.2) (23.3)Required deficit funding 0.0 0.0 0.0 0.0 0.0 0.0 0.0 0.0
Ending balance $279.8 $256.8 $230.4 $200.0 $165.1 $136.6 $103.4 $65.1
Average balance $289.9 $268.3 $243.6 $215.2 $182.6 $150.9 $120.0 $84.3Interest rate 8.7% 8.7% 8.7% 8.7% 8.7% 8.7% 8.7% 8.7%
Interest expense on bank debt $25.2 $23.3 $21.2 $18.7 $15.9 $13.1 $10.4 $7.3
Subordinated debtBeginning balance $100.0 $100.0 $100.0 $100.0 $100.0 $100.0 $100.0 $100.0
Mandatory repayment 0.0% 0.0 0.0 0.0 0.0 0.0 0.0 0.0 0.0Application of excess cash 100.0% 0.0 0.0 0.0 0.0 0.0 0.0 0.0 0.0
Ending balance $100.0 $100.0 $100.0 $100.0 $100.0 $100.0 $100.0 $100.0
Average balance $100.0 $100.0 $100.0 $100.0 $100.0 $100.0 $100.0 $100.0Interest rate 11.0% 11.0% 11.0% 11.0% 11.0% 11.0% 11.0% 11.0%
Interest expense on subordinated debt $11.00 $11.0 $11.0 $11.0 $11.0 $11.0 $11.0 $11.0
Non Bank Mezz debtBeginning balance $80.0 $78.3 $75.6 $71.8 $66.7 $60.0 $55.5 $49.5
Mandatory repayment 0.0% 0.0 0.0 0.0 0.0 0.0 0.0 0.0 0.0Application of excess cash 100.0% (1.7) (2.7) (3.8) (5.1) (6.6) (4.5) (6.1) (7.8)
Ending balance $78.3 $75.6 $71.8 $66.7 $60.0 $55.5 $49.5 $41.7
Average balance $79.1 $76.9 $73.7 $69.2 $63.4 $57.8 $52.5 $45.6Interest rate 15.0% 15.0% 15.0% 15.0% 15.0% 15.0% 15.0% 15.0%
Interest expense on non bank mezz debt $11.87 $11.5 $11.1 $10.4 $9.5 $8.7 $7.9 $6.8
CashBeginning balance $0.0 $0.0 $0.0 $0.0 $0.0 $0.0 $0.0 $0.0
Net change in cash 0.0 0.0 0.0 0.0 0.0 0.0 0.0 0.0Ending balance $0.0 $0.0 $0.0 $0.0 $0.0 $0.0 $0.0 $0.0
11
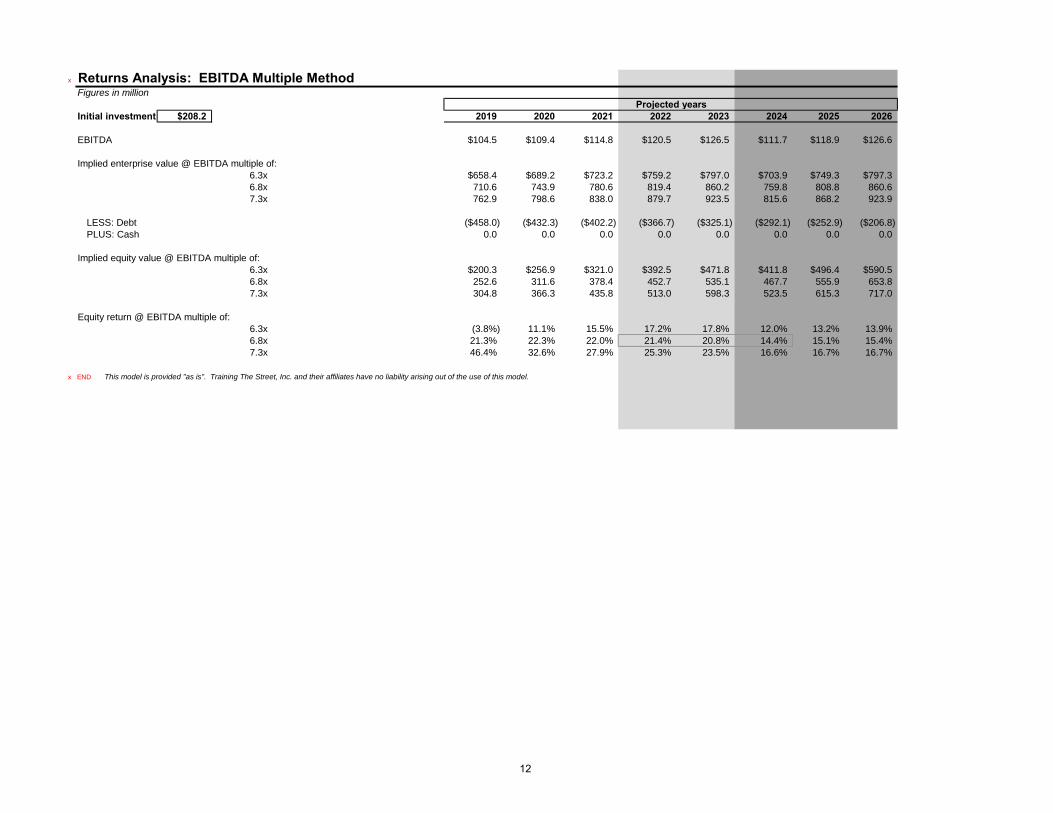
x Returns Analysis: EBITDA Multiple MethodFigures in million
Projected yearsInitial investment $208.2 2019 2020 2021 2022 2023 2024 2025 2026
EBITDA $104.5 $109.4 $114.8 $120.5 $126.5 $111.7 $118.9 $126.6
Implied enterprise value @ EBITDA multiple of:6.3x $658.4 $689.2 $723.2 $759.2 $797.0 $703.9 $749.3 $797.36.8x 710.6 743.9 780.6 819.4 860.2 759.8 808.8 860.67.3x 762.9 798.6 838.0 879.7 923.5 815.6 868.2 923.9
LESS: Debt ($458.0) ($432.3) ($402.2) ($366.7) ($325.1) ($292.1) ($252.9) ($206.8)PLUS: Cash 0.0 0.0 0.0 0.0 0.0 0.0 0.0 0.0
Implied equity value @ EBITDA multiple of:6.3x $200.3 $256.9 $321.0 $392.5 $471.8 $411.8 $496.4 $590.56.8x 252.6 311.6 378.4 452.7 535.1 467.7 555.9 653.87.3x 304.8 366.3 435.8 513.0 598.3 523.5 615.3 717.0
Equity return @ EBITDA multiple of:6.3x (3.8%) 11.1% 15.5% 17.2% 17.8% 12.0% 13.2% 13.9%6.8x 21.3% 22.3% 22.0% 21.4% 20.8% 14.4% 15.1% 15.4%7.3x 46.4% 32.6% 27.9% 25.3% 23.5% 16.6% 16.7% 16.7%
x END This model is provided "as is". Training The Street, Inc. and their affiliates have no liability arising out of the use of this model.
12
COPYRIGHT 2014 © by Training The Street, Inc For training purposes only!
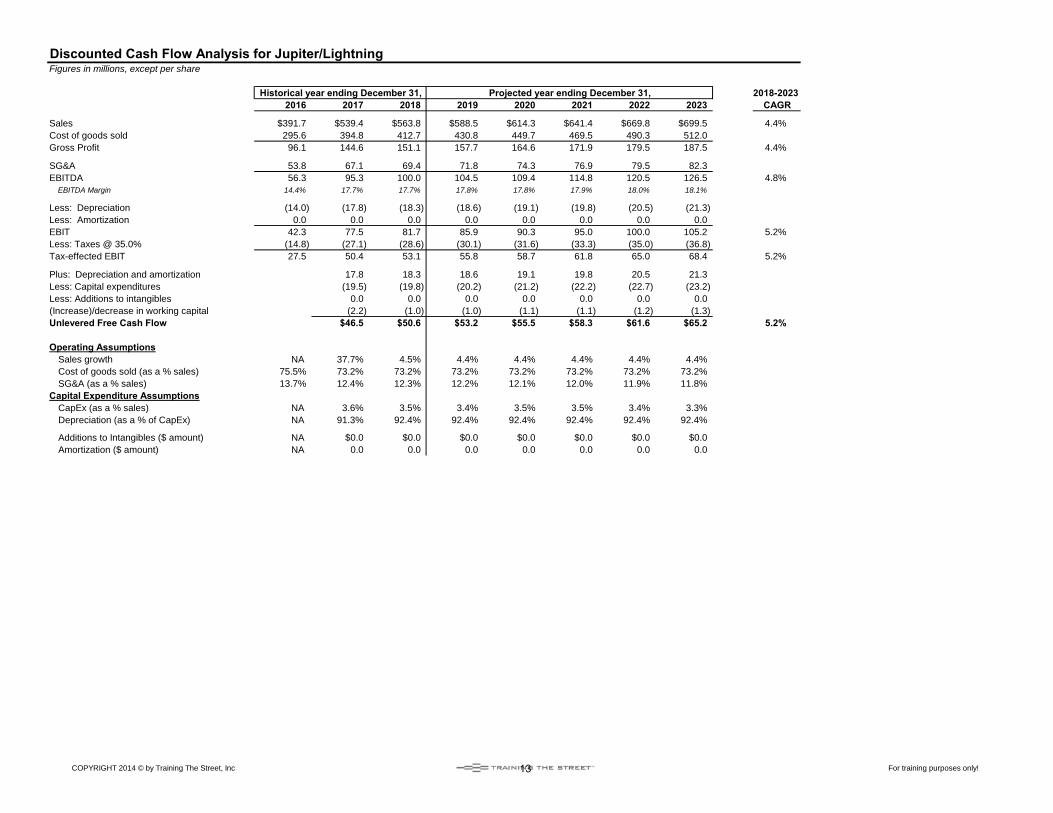
Discounted Cash Flow Analysis for Jupiter/LightningFigures in millions, except per share
Historical year ending December 31, Projected year ending December 31, 2018-20232016 2017 2018 2019 2020 2021 2022 2023 CAGR
Sales $391.7 $539.4 $563.8 $588.5 $614.3 $641.4 $669.8 $699.5 4.4%Cost of goods sold 295.6 394.8 412.7 430.8 449.7 469.5 490.3 512.0Gross Profit 96.1 144.6 151.1 157.7 164.6 171.9 179.5 187.5 4.4%
SG&A 53.8 67.1 69.4 71.8 74.3 76.9 79.5 82.3EBITDA 56.3 95.3 100.0 104.5 109.4 114.8 120.5 126.5 4.8%
EBITDA Margin 14.4% 17.7% 17.7% 17.8% 17.8% 17.9% 18.0% 18.1%
Less: Depreciation (14.0) (17.8) (18.3) (18.6) (19.1) (19.8) (20.5) (21.3)Less: Amortization 0.0 0.0 0.0 0.0 0.0 0.0 0.0 0.0EBIT 42.3 77.5 81.7 85.9 90.3 95.0 100.0 105.2 5.2%Less: Taxes @ 35.0% (14.8) (27.1) (28.6) (30.1) (31.6) (33.3) (35.0) (36.8)Tax-effected EBIT 27.5 50.4 53.1 55.8 58.7 61.8 65.0 68.4 5.2%
Plus: Depreciation and amortization 17.8 18.3 18.6 19.1 19.8 20.5 21.3Less: Capital expenditures (19.5) (19.8) (20.2) (21.2) (22.2) (22.7) (23.2)Less: Additions to intangibles 0.0 0.0 0.0 0.0 0.0 0.0 0.0(Increase)/decrease in working capital (2.2) (1.0) (1.0) (1.1) (1.1) (1.2) (1.3)Unlevered Free Cash Flow $46.5 $50.6 $53.2 $55.5 $58.3 $61.6 $65.2 5.2%
Operating AssumptionsSales growth NA 37.7% 4.5% 4.4% 4.4% 4.4% 4.4% 4.4%Cost of goods sold (as a % sales) 75.5% 73.2% 73.2% 73.2% 73.2% 73.2% 73.2% 73.2%SG&A (as a % sales) 13.7% 12.4% 12.3% 12.2% 12.1% 12.0% 11.9% 11.8%
Capital Expenditure AssumptionsCapEx (as a % sales) NA 3.6% 3.5% 3.4% 3.5% 3.5% 3.4% 3.3%Depreciation (as a % of CapEx) NA 91.3% 92.4% 92.4% 92.4% 92.4% 92.4% 92.4%
Additions to Intangibles ($ amount) NA $0.0 $0.0 $0.0 $0.0 $0.0 $0.0 $0.0Amortization ($ amount) NA 0.0 0.0 0.0 0.0 0.0 0.0 0.0
13

COPYRIGHT 2014 © by Training The Street, Inc For training purposes only!
Perpetuity Growth Method EBITDA Multiple Method
Weighted average cost of capital: 10.0% Weighted average cost of capital: 10.0% Net present value of free cash flow $220.6 Net present value of free cash flow $220.6
Terminal growth rate 3.0% Terminal multiple 6.8xTerminal value $959.1 Terminal value $860.2 Present value of the terminal value 595.5 Present value of the terminal value 534.1
Enterprise value $816.1 Enterprise value $754.7 Less: Net debt* (326.4) Less: Net debt* (326.4) Equity value $489.6 Equity value $428.3
Diluted shares: 100.000 Diluted shares: 100.000
Equity Value Per Share $4.90 Equity Value Per Share $4.28
Implied EBITDA Terminal Multiple Implied Perpetuity Growth RateTerminal year unlevered free cash flow $65.2 Terminal year EBITDA $126.5Weighted average cost of capital 10.0% Weighted average cost of capital 10.0%Growth rate of free cash flow after terminal year 3.0% Multiple 6.8xTerminal year EBITDA $126.5 Terminal year unlevered free cash flow $65.2
Implied EBITDA Terminal Multiple: 7.6x Implied Growth Rate: 2.3%[$65.2 x (1+3.0%) x (1+0.0%)^0.5 )] / [$126.5 x (10.0% - 3.0%)] = 7.6x [$126.5 x 6.8 x 10.0%) - $65.2) x (1+0.0%)^0.5 )] / [($126.5 x 6.8) + $65.2 x (1+0.0%)^0.5] = 2.3%
* Note: Net debt represents total debt, minority interest and preferred stock, less cash & equivalents.This model is provided "as is". Training The Street, Inc. and their affiliates have no liability arising out of the use of this model.
14
COPYRIGHT 2014 © by Training The Street, Inc For training purposes only!
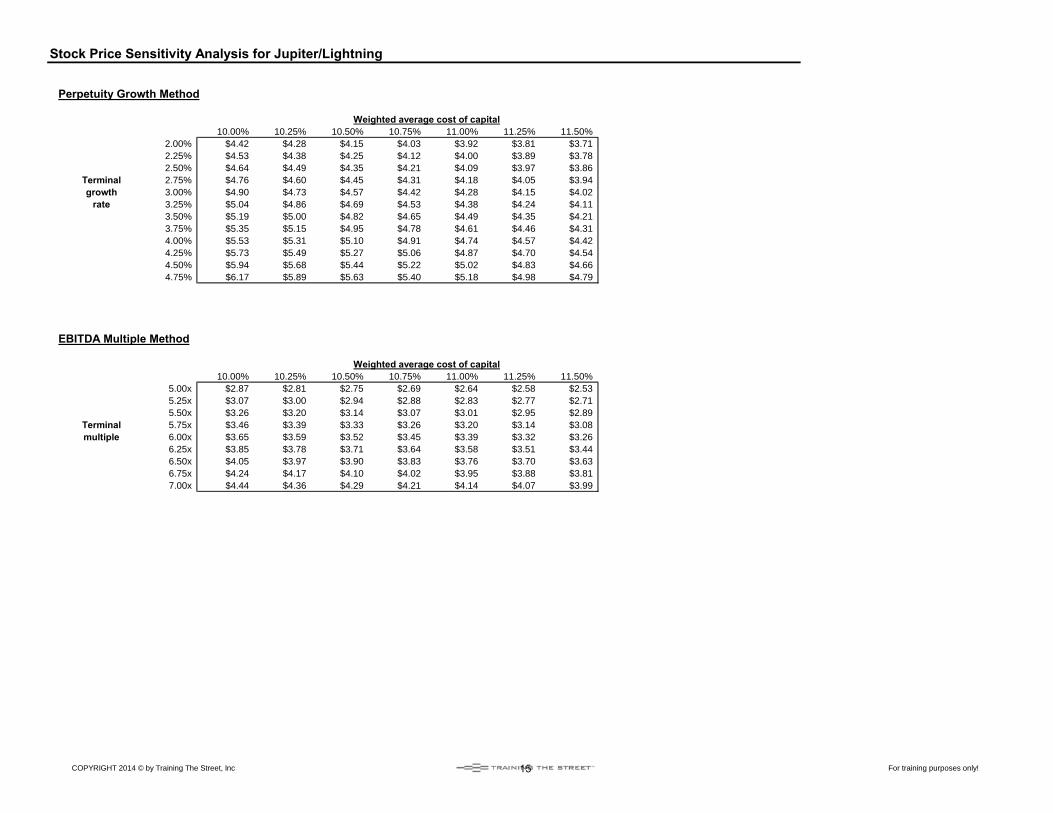
Stock Price Sensitivity Analysis for Jupiter/Lightning
Perpetuity Growth Method
Weighted average cost of capital10.00% 10.25% 10.50% 10.75% 11.00% 11.25% 11.50%
2.00% $4.42 $4.28 $4.15 $4.03 $3.92 $3.81 $3.712.25% $4.53 $4.38 $4.25 $4.12 $4.00 $3.89 $3.782.50% $4.64 $4.49 $4.35 $4.21 $4.09 $3.97 $3.86
Terminal 2.75% $4.76 $4.60 $4.45 $4.31 $4.18 $4.05 $3.94growth 3.00% $4.90 $4.73 $4.57 $4.42 $4.28 $4.15 $4.02
rate 3.25% $5.04 $4.86 $4.69 $4.53 $4.38 $4.24 $4.113.50% $5.19 $5.00 $4.82 $4.65 $4.49 $4.35 $4.213.75% $5.35 $5.15 $4.95 $4.78 $4.61 $4.46 $4.314.00% $5.53 $5.31 $5.10 $4.91 $4.74 $4.57 $4.424.25% $5.73 $5.49 $5.27 $5.06 $4.87 $4.70 $4.544.50% $5.94 $5.68 $5.44 $5.22 $5.02 $4.83 $4.664.75% $6.17 $5.89 $5.63 $5.40 $5.18 $4.98 $4.79
EBITDA Multiple Method
Weighted average cost of capital10.00% 10.25% 10.50% 10.75% 11.00% 11.25% 11.50%
5.00x $2.87 $2.81 $2.75 $2.69 $2.64 $2.58 $2.535.25x $3.07 $3.00 $2.94 $2.88 $2.83 $2.77 $2.715.50x $3.26 $3.20 $3.14 $3.07 $3.01 $2.95 $2.89
Terminal 5.75x $3.46 $3.39 $3.33 $3.26 $3.20 $3.14 $3.08multiple 6.00x $3.65 $3.59 $3.52 $3.45 $3.39 $3.32 $3.26
6.25x $3.85 $3.78 $3.71 $3.64 $3.58 $3.51 $3.446.50x $4.05 $3.97 $3.90 $3.83 $3.76 $3.70 $3.636.75x $4.24 $4.17 $4.10 $4.02 $3.95 $3.88 $3.817.00x $4.44 $4.36 $4.29 $4.21 $4.14 $4.07 $3.99
15
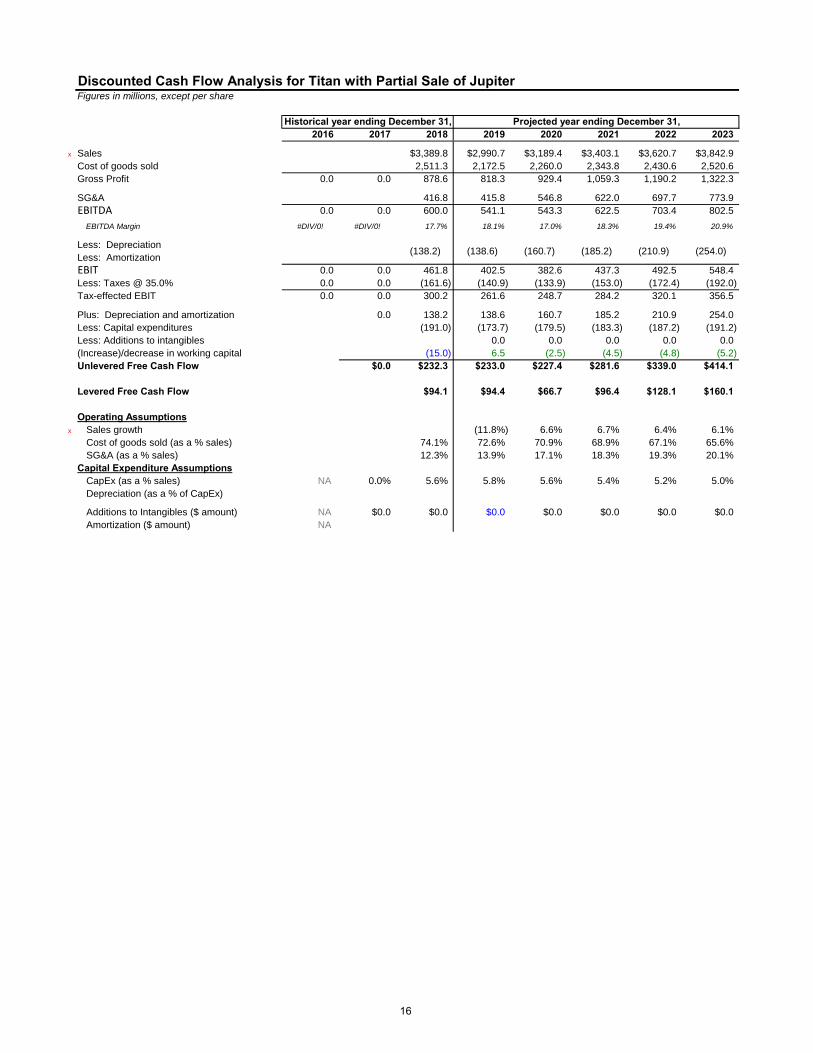
Discounted Cash Flow Analysis for Titan with Partial Sale of JupiterFigures in millions, except per share
Historical year ending December 31, Projected year ending December 31,2016 2017 2018 2019 2020 2021 2022 2023
x Sales $3,389.8 $2,990.7 $3,189.4 $3,403.1 $3,620.7 $3,842.9Cost of goods sold 2,511.3 2,172.5 2,260.0 2,343.8 2,430.6 2,520.6Gross Profit 0.0 0.0 878.6 818.3 929.4 1,059.3 1,190.2 1,322.3
SG&A 416.8 415.8 546.8 622.0 697.7 773.9EBITDA 0.0 0.0 600.0 541.1 543.3 622.5 703.4 802.5
EBITDA Margin #DIV/0! #DIV/0! 17.7% 18.1% 17.0% 18.3% 19.4% 20.9%
Less: DepreciationLess: AmortizationEBIT 0.0 0.0 461.8 402.5 382.6 437.3 492.5 548.4Less: Taxes @ 35.0% 0.0 0.0 (161.6) (140.9) (133.9) (153.0) (172.4) (192.0)Tax-effected EBIT 0.0 0.0 300.2 261.6 248.7 284.2 320.1 356.5
Plus: Depreciation and amortization 0.0 138.2 138.6 160.7 185.2 210.9 254.0Less: Capital expenditures (191.0) (173.7) (179.5) (183.3) (187.2) (191.2)Less: Additions to intangibles 0.0 0.0 0.0 0.0 0.0(Increase)/decrease in working capital (15.0) 6.5 (2.5) (4.5) (4.8) (5.2)Unlevered Free Cash Flow $0.0 $232.3 $233.0 $227.4 $281.6 $339.0 $414.1
Levered Free Cash Flow $94.1 $94.4 $66.7 $96.4 $128.1 $160.1
Operating Assumptionsx Sales growth (11.8%) 6.6% 6.7% 6.4% 6.1%
Cost of goods sold (as a % sales) 74.1% 72.6% 70.9% 68.9% 67.1% 65.6%SG&A (as a % sales) 12.3% 13.9% 17.1% 18.3% 19.3% 20.1%
Capital Expenditure AssumptionsCapEx (as a % sales) NA 0.0% 5.6% 5.8% 5.6% 5.4% 5.2% 5.0%Depreciation (as a % of CapEx)
Additions to Intangibles ($ amount) NA $0.0 $0.0 $0.0 $0.0 $0.0 $0.0 $0.0Amortization ($ amount) NA
(210.9) (254.0)(138.2) (138.6) (160.7) (185.2)
16
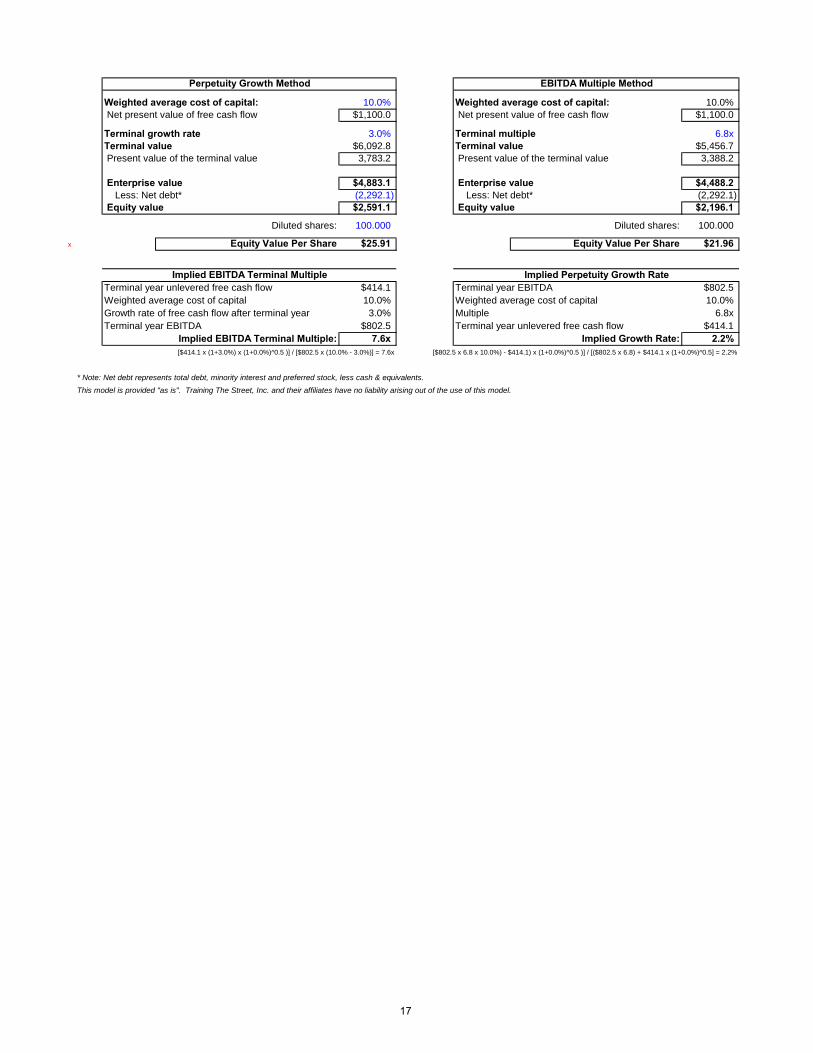
Perpetuity Growth Method EBITDA Multiple Method
Weighted average cost of capital: 10.0% Weighted average cost of capital: 10.0% Net present value of free cash flow $1,100.0 Net present value of free cash flow $1,100.0
Terminal growth rate 3.0% Terminal multiple 6.8xTerminal value $6,092.8 Terminal value $5,456.7 Present value of the terminal value 3,783.2 Present value of the terminal value 3,388.2
Enterprise value $4,883.1 Enterprise value $4,488.2 Less: Net debt* (2,292.1) Less: Net debt* (2,292.1) Equity value $2,591.1 Equity value $2,196.1
Diluted shares: 100.000 Diluted shares: 100.000
x Equity Value Per Share $25.91 Equity Value Per Share $21.96
Implied EBITDA Terminal Multiple Implied Perpetuity Growth RateTerminal year unlevered free cash flow $414.1 Terminal year EBITDA $802.5Weighted average cost of capital 10.0% Weighted average cost of capital 10.0%Growth rate of free cash flow after terminal year 3.0% Multiple 6.8xTerminal year EBITDA $802.5 Terminal year unlevered free cash flow $414.1
Implied EBITDA Terminal Multiple: 7.6x Implied Growth Rate: 2.2%[$414.1 x (1+3.0%) x (1+0.0%)^0.5 )] / [$802.5 x (10.0% - 3.0%)] = 7.6x [$802.5 x 6.8 x 10.0%) - $414.1) x (1+0.0%)^0.5 )] / [($802.5 x 6.8) + $414.1 x (1+0.0%)^0.5] = 2.2%
* Note: Net debt represents total debt, minority interest and preferred stock, less cash & equivalents.This model is provided "as is". Training The Street, Inc. and their affiliates have no liability arising out of the use of this model.
17
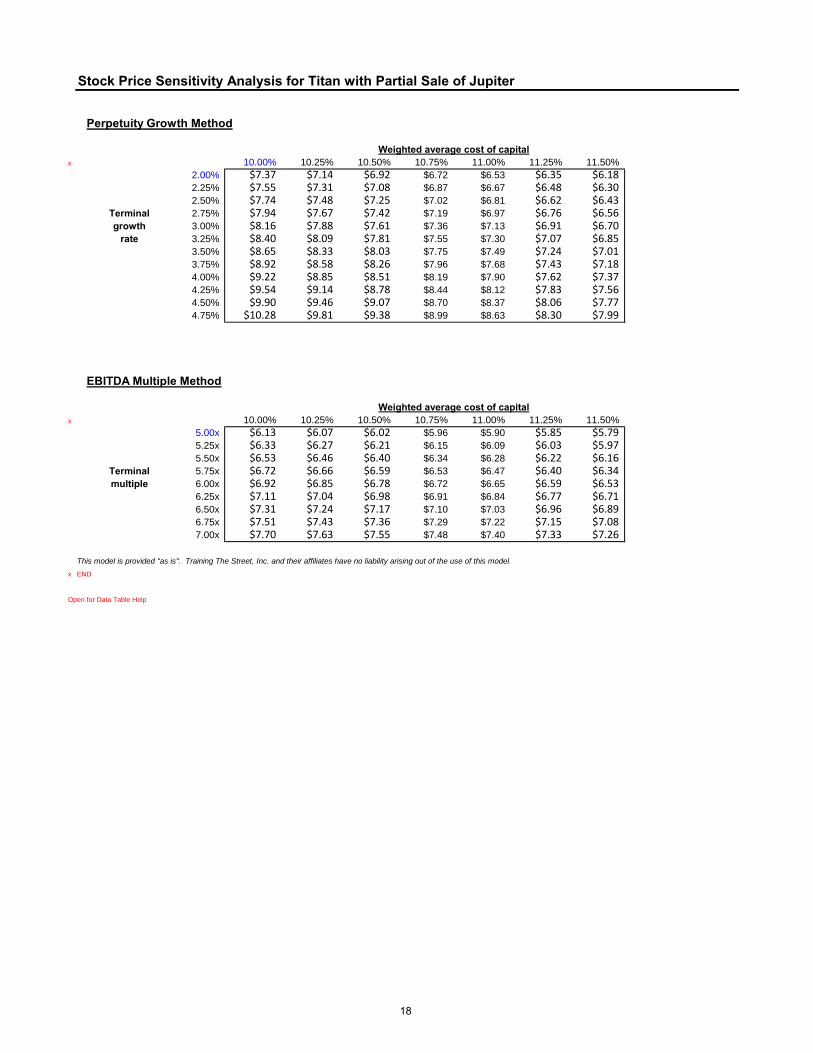
Stock Price Sensitivity Analysis for Titan with Partial Sale of Jupiter
Perpetuity Growth Method
Weighted average cost of capitalx 10.00% 10.25% 10.50% 10.75% 11.00% 11.25% 11.50%
2.00% $7.37 $7.14 $6.92 $6.72 $6.53 $6.35 $6.182.25% $7.55 $7.31 $7.08 $6.87 $6.67 $6.48 $6.302.50% $7.74 $7.48 $7.25 $7.02 $6.81 $6.62 $6.43
Terminal 2.75% $7.94 $7.67 $7.42 $7.19 $6.97 $6.76 $6.56growth 3.00% $8.16 $7.88 $7.61 $7.36 $7.13 $6.91 $6.70
rate 3.25% $8.40 $8.09 $7.81 $7.55 $7.30 $7.07 $6.853.50% $8.65 $8.33 $8.03 $7.75 $7.49 $7.24 $7.013.75% $8.92 $8.58 $8.26 $7.96 $7.68 $7.43 $7.184.00% $9.22 $8.85 $8.51 $8.19 $7.90 $7.62 $7.374.25% $9.54 $9.14 $8.78 $8.44 $8.12 $7.83 $7.564.50% $9.90 $9.46 $9.07 $8.70 $8.37 $8.06 $7.774.75% $10.28 $9.81 $9.38 $8.99 $8.63 $8.30 $7.99
EBITDA Multiple Method
Weighted average cost of capitalx 10.00% 10.25% 10.50% 10.75% 11.00% 11.25% 11.50%
5.00x $6.13 $6.07 $6.02 $5.96 $5.90 $5.85 $5.795.25x $6.33 $6.27 $6.21 $6.15 $6.09 $6.03 $5.975.50x $6.53 $6.46 $6.40 $6.34 $6.28 $6.22 $6.16
Terminal 5.75x $6.72 $6.66 $6.59 $6.53 $6.47 $6.40 $6.34multiple 6.00x $6.92 $6.85 $6.78 $6.72 $6.65 $6.59 $6.53
6.25x $7.11 $7.04 $6.98 $6.91 $6.84 $6.77 $6.716.50x $7.31 $7.24 $7.17 $7.10 $7.03 $6.96 $6.896.75x $7.51 $7.43 $7.36 $7.29 $7.22 $7.15 $7.087.00x $7.70 $7.63 $7.55 $7.48 $7.40 $7.33 $7.26
This model is provided "as is". Training The Street, Inc. and their affiliates have no liability arising out of the use of this model.x END
Open for Data Table Help
18

Titan Pro-Forma With Sale of Saturn and Private Equity into Pluto
Jupiter Saturn Pluto Titan Jupiter Saturn Pluto Titan Jupiter Saturn Pluto TitanRevenues & GainsTotal Sales 563.8$ 39.0$ -$ $3,389.8 588.5$ 75.0$ 3,534.1$ 614.3$ 180.0$ 3,751.1$ % of Growth 4.5% 17.7% 0.0% 3.0% 4.4% N/A 4.3% 4.4% 140.0% 6.1%COGS 412.7$ 28.0$ -$ 2,511.3$ 430.8$ 7.5$ 2,571.0$ 449.7$ 18.0$ 2,672.1$ % of Sales 73.2% 71.8% 0.0% 74.1% 73.2% 10.0% 72.7% 73.2% 10.0% 71.2%Gross Profit 151.1$ 11.0$ -$ 878.6$ 157.7$ 67.5$ 963.2$ 164.6$ 162.0$ 1,079.0$ % Gross Margin 26.8% 28.2% 0.0% 25.9% 26.8% 90.0% 27.3% 26.8% 90.0% 28.8%Total SG&A 69.4 4.0 10.0 416.8 71.8 57.5 483.0 74.3 118.0 615.8 % of Sales 12.3% 10.3% 0.0% 12.3% 12.2% 76.7% 13.7% 12.1% 65.6% 16.4%EBIT 81.7$ 7.0$ (10.0)$ 461.8$ 85.9$ 10.0$ 480.2$ 90.3$ 44.0$ 463.1$
14.5% 17.9% 0.0% 13.6% 14.6% 13.3% 13.6% 14.7% 24.4% 12.3%Depreciation & Amortization 18.3$ 0.0$ -$ 138.2$ 18.6$ 7.8$ 157.2$ 19.1$ 18.0$ 179.7$
100.0$ 7.0$ (10.0)$ 600.0$ 104.5$ 17.8$ 637.3$ 109.4$ 62.0$ 642.9$ % Margin 17.7% 17.8% 0.0% 17.7% 17.8% 23.7% 18.0% 17.8% 34.4% 17.1%
0 0 0 0 0 0 0 0 0 0Adjusted EBITDA 100.0$ 7.0$ (10.0)$ 600.0$ 104.5$ 17.8$ 637.3$ 109.4$ 62.0$ 642.9$ % Margin 17.7% 17.8% 0.0% 17.7% 17.8% 23.7% 18.0% 17.8% 34.4% 17.1%Interest Expense 0.0% 0.0% 0.0% 8.7% 0.0% 0.0% 8.7% 0.0% 0.0% 8.7%Debt -$ -$ -$ 2,111.99$ -$ -$ 1,792.07$ -$ -$ 1,661.30$ Interest Total -$ -$ -$ 179.04$ -$ -$ 155.91$ -$ -$ 144.53$ Taxable Income -$ -$ -$ 282.74$ -$ -$ 324.26$ -$ -$ 318.61$ Taxes 28.60$ 2.45$ (3.50)$ 98.96$ 30.07$ 3.50$ 113.49$ 31.61$ 15.40$ 111.51$
% of EBT 35.0% 35.0% 35.0% 35.0% 35.0% 35.0% 35.0% 35.0% 35.0% 35.0%Net Income 53.1$ 4.5$ (6.5)$ 183.8$ 55.8$ 6.5$ 210.8$ 58.7$ 28.6$ 207.1$ % Margin 9.4% 11.5% 0.0% 5.4% 9.5% 8.7% 6.0% 9.6% 15.9% 5.5%Total Capex 19.8$ 1.2$ 70.0$ 191.0$ 20.2$ 2.3$ 192.5$ 21.2$ 5.6$ 199.1$ % of Sales 3.5% 3.2% 0.0% 5.6% 3.4% 3.1% 5.4% 3.5% 3.1% 5.3%Total D&A 18.3$ 0.0$ -$ 138.2$ 18.6$ 7.8$ 157.2$ 19.1$ 18.0$ 179.7$ % of Sales 3.24% 0.10% 0.00% 4.08% 3.16% 10.40% 4.45% 3.11% 10.00% 4.79%NWC 22.0 4.9 0.0 169.5 22.0 11.0 179.9 24.1 13.2 184.2 % of Sales 3.90% 12.56% 0.00% 5.00% 3.74% 14.67% 5.09% 3.92% 7.33% 4.91%
% Operating Margin
EBITDA
Total Adjustments
2018E 2019P 2020P
19
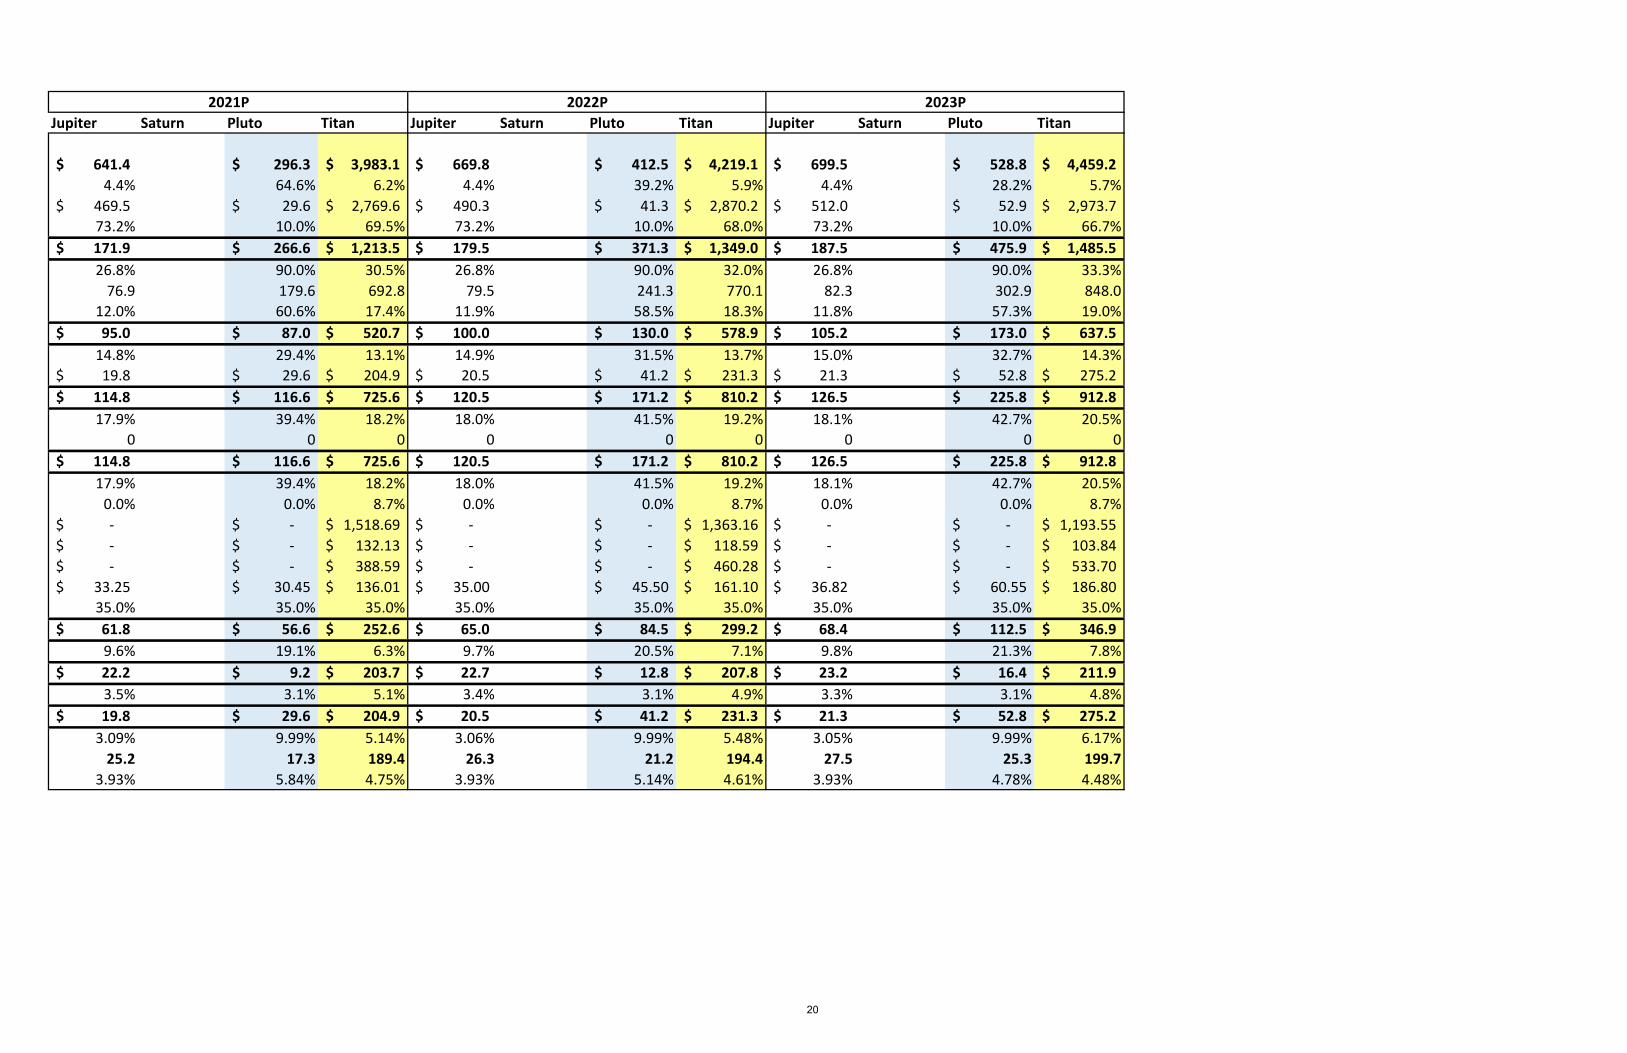
Jupiter Saturn Pluto Titan Jupiter Saturn Pluto Titan Jupiter Saturn Pluto Titan
641.4$ 296.3$ 3,983.1$ 669.8$ 412.5$ 4,219.1$ 699.5$ 528.8$ 4,459.2$ 4.4% 64.6% 6.2% 4.4% 39.2% 5.9% 4.4% 28.2% 5.7%
469.5$ 29.6$ 2,769.6$ 490.3$ 41.3$ 2,870.2$ 512.0$ 52.9$ 2,973.7$ 73.2% 10.0% 69.5% 73.2% 10.0% 68.0% 73.2% 10.0% 66.7%171.9$ 266.6$ 1,213.5$ 179.5$ 371.3$ 1,349.0$ 187.5$ 475.9$ 1,485.5$ 26.8% 90.0% 30.5% 26.8% 90.0% 32.0% 26.8% 90.0% 33.3%
76.9 179.6 692.8 79.5 241.3 770.1 82.3 302.9 848.012.0% 60.6% 17.4% 11.9% 58.5% 18.3% 11.8% 57.3% 19.0%95.0$ 87.0$ 520.7$ 100.0$ 130.0$ 578.9$ 105.2$ 173.0$ 637.5$
14.8% 29.4% 13.1% 14.9% 31.5% 13.7% 15.0% 32.7% 14.3%19.8$ 29.6$ 204.9$ 20.5$ 41.2$ 231.3$ 21.3$ 52.8$ 275.2$
114.8$ 116.6$ 725.6$ 120.5$ 171.2$ 810.2$ 126.5$ 225.8$ 912.8$ 17.9% 39.4% 18.2% 18.0% 41.5% 19.2% 18.1% 42.7% 20.5%
0 0 0 0 0 0 0 0 0114.8$ 116.6$ 725.6$ 120.5$ 171.2$ 810.2$ 126.5$ 225.8$ 912.8$ 17.9% 39.4% 18.2% 18.0% 41.5% 19.2% 18.1% 42.7% 20.5%
0.0% 0.0% 8.7% 0.0% 0.0% 8.7% 0.0% 0.0% 8.7%-$ -$ 1,518.69$ -$ -$ 1,363.16$ -$ -$ 1,193.55$ -$ -$ 132.13$ -$ -$ 118.59$ -$ -$ 103.84$ -$ -$ 388.59$ -$ -$ 460.28$ -$ -$ 533.70$
33.25$ 30.45$ 136.01$ 35.00$ 45.50$ 161.10$ 36.82$ 60.55$ 186.80$ 35.0% 35.0% 35.0% 35.0% 35.0% 35.0% 35.0% 35.0% 35.0%61.8$ 56.6$ 252.6$ 65.0$ 84.5$ 299.2$ 68.4$ 112.5$ 346.9$ 9.6% 19.1% 6.3% 9.7% 20.5% 7.1% 9.8% 21.3% 7.8%22.2$ 9.2$ 203.7$ 22.7$ 12.8$ 207.8$ 23.2$ 16.4$ 211.9$ 3.5% 3.1% 5.1% 3.4% 3.1% 4.9% 3.3% 3.1% 4.8%19.8$ 29.6$ 204.9$ 20.5$ 41.2$ 231.3$ 21.3$ 52.8$ 275.2$
3.09% 9.99% 5.14% 3.06% 9.99% 5.48% 3.05% 9.99% 6.17%25.2 17.3 189.4 26.3 21.2 194.4 27.5 25.3 199.7
3.93% 5.84% 4.75% 3.93% 5.14% 4.61% 3.93% 4.78% 4.48%
2022P 2023P2021P
20
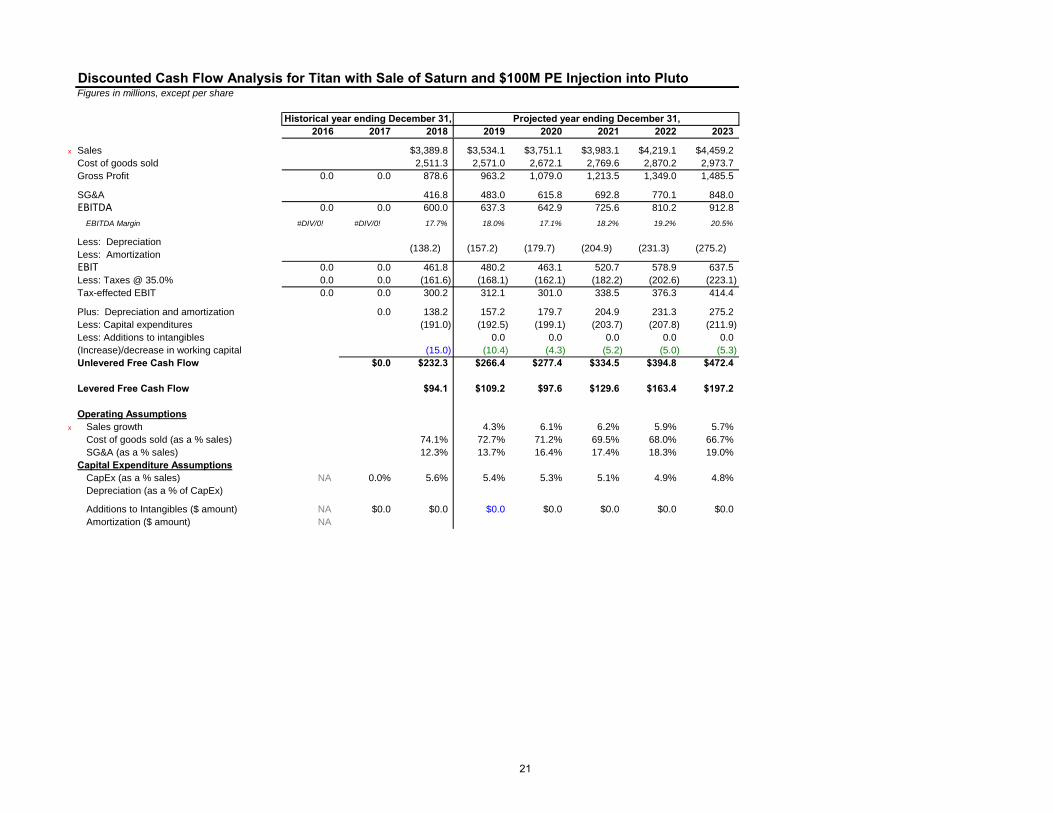
Discounted Cash Flow Analysis for Titan with Sale of Saturn and $100M PE Injection into PlutoFigures in millions, except per share
Historical year ending December 31, Projected year ending December 31,2016 2017 2018 2019 2020 2021 2022 2023
x Sales $3,389.8 $3,534.1 $3,751.1 $3,983.1 $4,219.1 $4,459.2Cost of goods sold 2,511.3 2,571.0 2,672.1 2,769.6 2,870.2 2,973.7Gross Profit 0.0 0.0 878.6 963.2 1,079.0 1,213.5 1,349.0 1,485.5
SG&A 416.8 483.0 615.8 692.8 770.1 848.0EBITDA 0.0 0.0 600.0 637.3 642.9 725.6 810.2 912.8
EBITDA Margin #DIV/0! #DIV/0! 17.7% 18.0% 17.1% 18.2% 19.2% 20.5%
Less: DepreciationLess: AmortizationEBIT 0.0 0.0 461.8 480.2 463.1 520.7 578.9 637.5Less: Taxes @ 35.0% 0.0 0.0 (161.6) (168.1) (162.1) (182.2) (202.6) (223.1)Tax-effected EBIT 0.0 0.0 300.2 312.1 301.0 338.5 376.3 414.4
Plus: Depreciation and amortization 0.0 138.2 157.2 179.7 204.9 231.3 275.2Less: Capital expenditures (191.0) (192.5) (199.1) (203.7) (207.8) (211.9)Less: Additions to intangibles 0.0 0.0 0.0 0.0 0.0(Increase)/decrease in working capital (15.0) (10.4) (4.3) (5.2) (5.0) (5.3)Unlevered Free Cash Flow $0.0 $232.3 $266.4 $277.4 $334.5 $394.8 $472.4
Levered Free Cash Flow $94.1 $109.2 $97.6 $129.6 $163.4 $197.2
Operating Assumptionsx Sales growth 4.3% 6.1% 6.2% 5.9% 5.7%
Cost of goods sold (as a % sales) 74.1% 72.7% 71.2% 69.5% 68.0% 66.7%SG&A (as a % sales) 12.3% 13.7% 16.4% 17.4% 18.3% 19.0%
Capital Expenditure AssumptionsCapEx (as a % sales) NA 0.0% 5.6% 5.4% 5.3% 5.1% 4.9% 4.8%Depreciation (as a % of CapEx)
Additions to Intangibles ($ amount) NA $0.0 $0.0 $0.0 $0.0 $0.0 $0.0 $0.0Amortization ($ amount) NA
(231.3) (275.2)(138.2) (157.2) (179.7) (204.9)
21
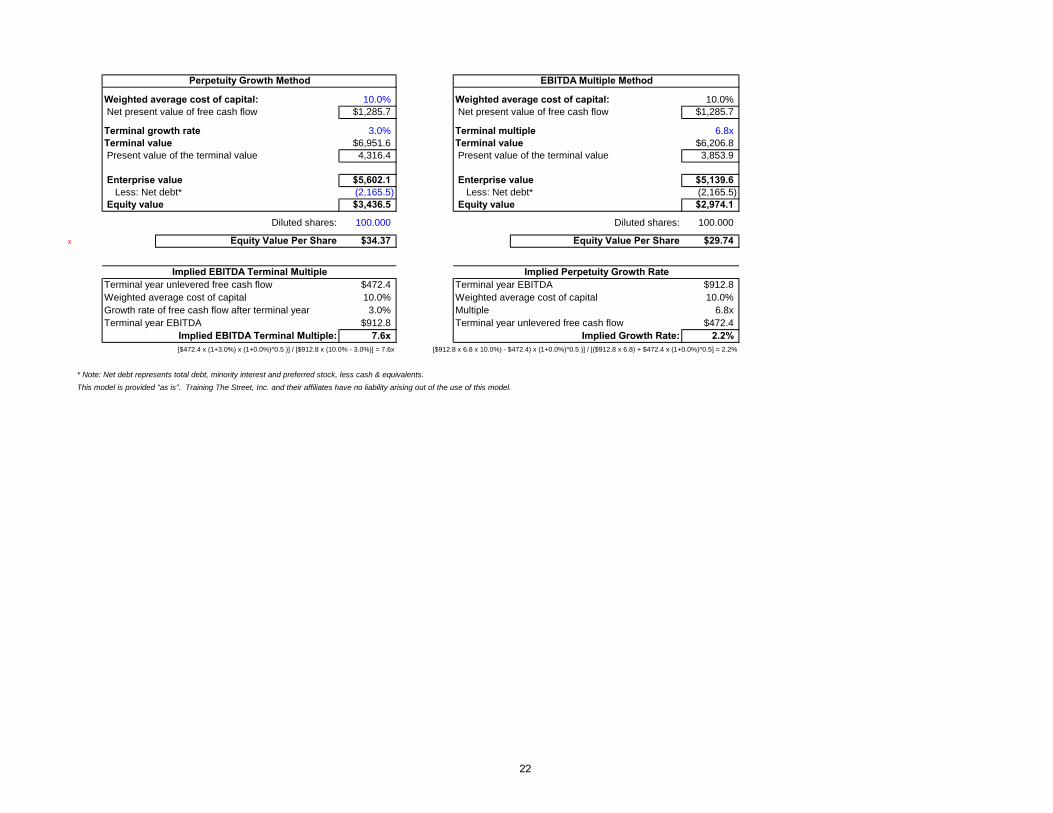
Perpetuity Growth Method EBITDA Multiple Method
Weighted average cost of capital: 10.0% Weighted average cost of capital: 10.0% Net present value of free cash flow $1,285.7 Net present value of free cash flow $1,285.7
Terminal growth rate 3.0% Terminal multiple 6.8xTerminal value $6,951.6 Terminal value $6,206.8 Present value of the terminal value 4,316.4 Present value of the terminal value 3,853.9
Enterprise value $5,602.1 Enterprise value $5,139.6 Less: Net debt* (2,165.5) Less: Net debt* (2,165.5) Equity value $3,436.5 Equity value $2,974.1
Diluted shares: 100.000 Diluted shares: 100.000
x Equity Value Per Share $34.37 Equity Value Per Share $29.74
Implied EBITDA Terminal Multiple Implied Perpetuity Growth RateTerminal year unlevered free cash flow $472.4 Terminal year EBITDA $912.8Weighted average cost of capital 10.0% Weighted average cost of capital 10.0%Growth rate of free cash flow after terminal year 3.0% Multiple 6.8xTerminal year EBITDA $912.8 Terminal year unlevered free cash flow $472.4
Implied EBITDA Terminal Multiple: 7.6x Implied Growth Rate: 2.2%[$472.4 x (1+3.0%) x (1+0.0%)^0.5 )] / [$912.8 x (10.0% - 3.0%)] = 7.6x [$912.8 x 6.8 x 10.0%) - $472.4) x (1+0.0%)^0.5 )] / [($912.8 x 6.8) + $472.4 x (1+0.0%)^0.5] = 2.2%
* Note: Net debt represents total debt, minority interest and preferred stock, less cash & equivalents.This model is provided "as is". Training The Street, Inc. and their affiliates have no liability arising out of the use of this model.
22
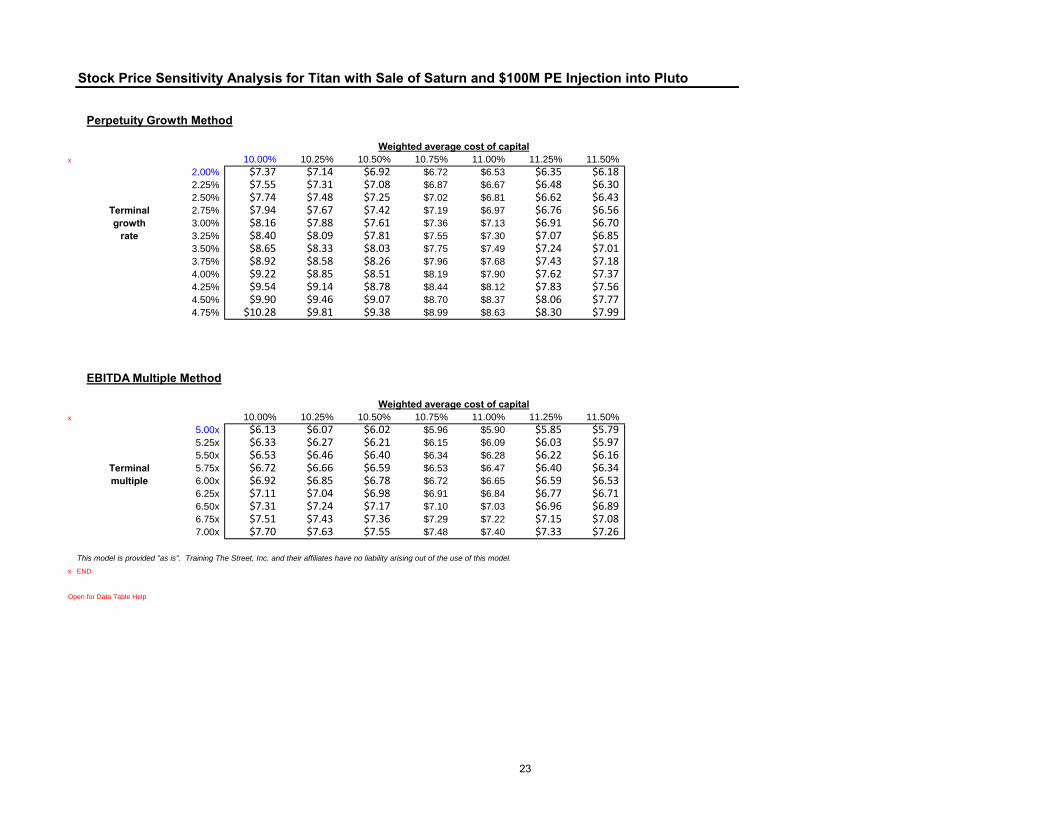
Stock Price Sensitivity Analysis for Titan with Sale of Saturn and $100M PE Injection into Pluto
Perpetuity Growth Method
Weighted average cost of capitalx 10.00% 10.25% 10.50% 10.75% 11.00% 11.25% 11.50%
2.00% $7.37 $7.14 $6.92 $6.72 $6.53 $6.35 $6.182.25% $7.55 $7.31 $7.08 $6.87 $6.67 $6.48 $6.302.50% $7.74 $7.48 $7.25 $7.02 $6.81 $6.62 $6.43
Terminal 2.75% $7.94 $7.67 $7.42 $7.19 $6.97 $6.76 $6.56growth 3.00% $8.16 $7.88 $7.61 $7.36 $7.13 $6.91 $6.70
rate 3.25% $8.40 $8.09 $7.81 $7.55 $7.30 $7.07 $6.853.50% $8.65 $8.33 $8.03 $7.75 $7.49 $7.24 $7.013.75% $8.92 $8.58 $8.26 $7.96 $7.68 $7.43 $7.184.00% $9.22 $8.85 $8.51 $8.19 $7.90 $7.62 $7.374.25% $9.54 $9.14 $8.78 $8.44 $8.12 $7.83 $7.564.50% $9.90 $9.46 $9.07 $8.70 $8.37 $8.06 $7.774.75% $10.28 $9.81 $9.38 $8.99 $8.63 $8.30 $7.99
EBITDA Multiple Method
Weighted average cost of capitalx 10.00% 10.25% 10.50% 10.75% 11.00% 11.25% 11.50%
5.00x $6.13 $6.07 $6.02 $5.96 $5.90 $5.85 $5.795.25x $6.33 $6.27 $6.21 $6.15 $6.09 $6.03 $5.975.50x $6.53 $6.46 $6.40 $6.34 $6.28 $6.22 $6.16
Terminal 5.75x $6.72 $6.66 $6.59 $6.53 $6.47 $6.40 $6.34multiple 6.00x $6.92 $6.85 $6.78 $6.72 $6.65 $6.59 $6.53
6.25x $7.11 $7.04 $6.98 $6.91 $6.84 $6.77 $6.716.50x $7.31 $7.24 $7.17 $7.10 $7.03 $6.96 $6.896.75x $7.51 $7.43 $7.36 $7.29 $7.22 $7.15 $7.087.00x $7.70 $7.63 $7.55 $7.48 $7.40 $7.33 $7.26
This model is provided "as is". Training The Street, Inc. and their affiliates have no liability arising out of the use of this model.x END
Open for Data Table Help
23

Titan Pro-Forma with $200M PE Investment In Pluto
Jupiter Saturn Pluto Titan Jupiter Saturn Pluto Titan Jupiter Saturn Pluto TitanRevenues & GainsTotal Sales 563.8$ 39.0$ -$ $3,389.8 588.5$ 45.1$ 75.0$ 3,579.2$ 614.3$ 52.6$ 180.0$ 3,803.7$ % of Growth 4.5% 17.7% 0.0% 3.0% 4.4% 15.6% N/A 5.6% 4.4% 16.7% 140.0% 6.3%COGS 412.7$ 28.0$ -$ 2,511.3$ 430.8$ 32.3$ 7.5$ 2,603.3$ 449.7$ 37.6$ 18.0$ 2,709.7$ % of Sales 73.2% 71.8% 0.0% 74.1% 73.2% 71.6% 10.0% 72.7% 73.2% 71.4% 10.0% 71.2%Gross Profit 151.1$ 11.0$ -$ 878.6$ 157.7$ 12.8$ 67.5$ 976.0$ 164.6$ 15.0$ 162.0$ 1,094.0$ % Gross Margin 26.8% 28.2% 0.0% 25.9% 26.8% 28.4% 90.0% 27.3% 26.8% 28.6% 90.0% 28.8%Total SG&A 69.4 4.0 10.0 416.8 71.8 4.6 57.5 487.6 74.3 5.3 118.0 621.1 % of Sales 12.3% 10.3% 0.0% 12.3% 12.2% 10.2% 76.7% 13.6% 12.1% 10.1% 65.6% 16.3%EBIT 81.7$ 7.0$ (10.0)$ 461.8$ 85.9$ 8.2$ 10.0$ 488.4$ 90.3$ 9.7$ 44.0$ 472.9$
14.5% 17.9% 0.0% 13.6% 14.6% 18.2% 13.3% 13.6% 14.7% 18.5% 24.4% 12.4%Depreciation & Amortization 18.3$ 0.0$ -$ 138.2$ 18.6$ 0.0$ 7.8$ 157.2$ 19.1$ 0.1$ 18.0$ 179.8$
100.0$ 7.0$ (10.0)$ 600.0$ 104.5$ 8.2$ 17.8$ 645.6$ 109.4$ 9.8$ 62.0$ 652.7$ % Margin 17.7% 17.8% 0.0% 17.7% 17.8% 18.3% 23.7% 18.0% 17.8% 18.7% 34.4% 17.2%
0 0 0 0 0 0 0 0 0 0 0 0Adjusted EBITDA 100.0$ 7.0$ (10.0)$ 600.0$ 104.5$ 8.2$ 17.8$ 645.6$ 109.4$ 9.8$ 62.0$ 652.7$ % Margin 17.7% 17.8% 0.0% 17.7% 17.8% 18.3% 23.7% 18.0% 17.8% 18.7% 34.4% 17.2%Interest Expense 0.0% 0.0% 0.0% 8.7% 0.0% 0.0% 0.0% 8.7% 0.0% 0.0% 0.0% 8.7%Debt -$ -$ -$ 2,111.99$ -$ -$ -$ 1,792.07$ -$ -$ -$ 1,661.30$ Interest Total -$ -$ -$ 179.04$ -$ -$ -$ 155.91$ -$ -$ -$ 144.53$ Taxable Income -$ -$ -$ 282.74$ -$ -$ -$ 332.46$ -$ -$ -$ 328.34$ Taxes 28.60$ 2.45$ (3.50)$ 98.96$ 30.07$ 2.87$ 3.50$ 116.36$ 31.61$ 3.41$ 15.40$ 114.92$
% of EBT 35.0% 35.0% 35.0% 35.0% 35.0% 35.0% 35.0% 35.0% 35.0% 35.0% 35.0% 35.0%Net Income 53.1$ 4.5$ (6.5)$ 183.8$ 55.8$ 5.3$ 6.5$ 216.1$ 58.7$ 6.3$ 28.6$ 213.4$ % Margin 9.4% 11.5% 0.0% 5.4% 9.5% 11.8% 8.7% 6.0% 9.6% 12.0% 15.9% 5.6%Total Capex 19.8$ 1.2$ 70.0$ 191.0$ 20.2$ 1.4$ 2.3$ 193.9$ 21.2$ 1.6$ 5.6$ 200.7$ % of Sales 3.5% 3.2% 0.0% 5.6% 3.4% 3.1% 3.1% 5.4% 3.5% 3.0% 3.1% 5.3%Total D&A 18.3$ 0.0$ -$ 138.2$ 18.6$ 0.0$ 7.8$ 157.2$ 19.1$ 0.1$ 18.0$ 179.8$ % of Sales 3.24% 0.10% 0.00% 4.08% 3.16% 0.10% 10.40% 4.39% 3.11% 0.19% 10.00% 4.73%NWC 22.0 4.9 0.0 169.5 22.0 5.1 11.0 185.0 24.1 5.4 13.2 189.6 % of Sales 3.90% 12.56% 0.00% 5.00% 3.74% 11.31% 14.67% 5.17% 3.92% 10.26% 7.33% 4.98%
% Operating Margin
EBITDA
Total Adjustments
2018E 2019P 2020P
24
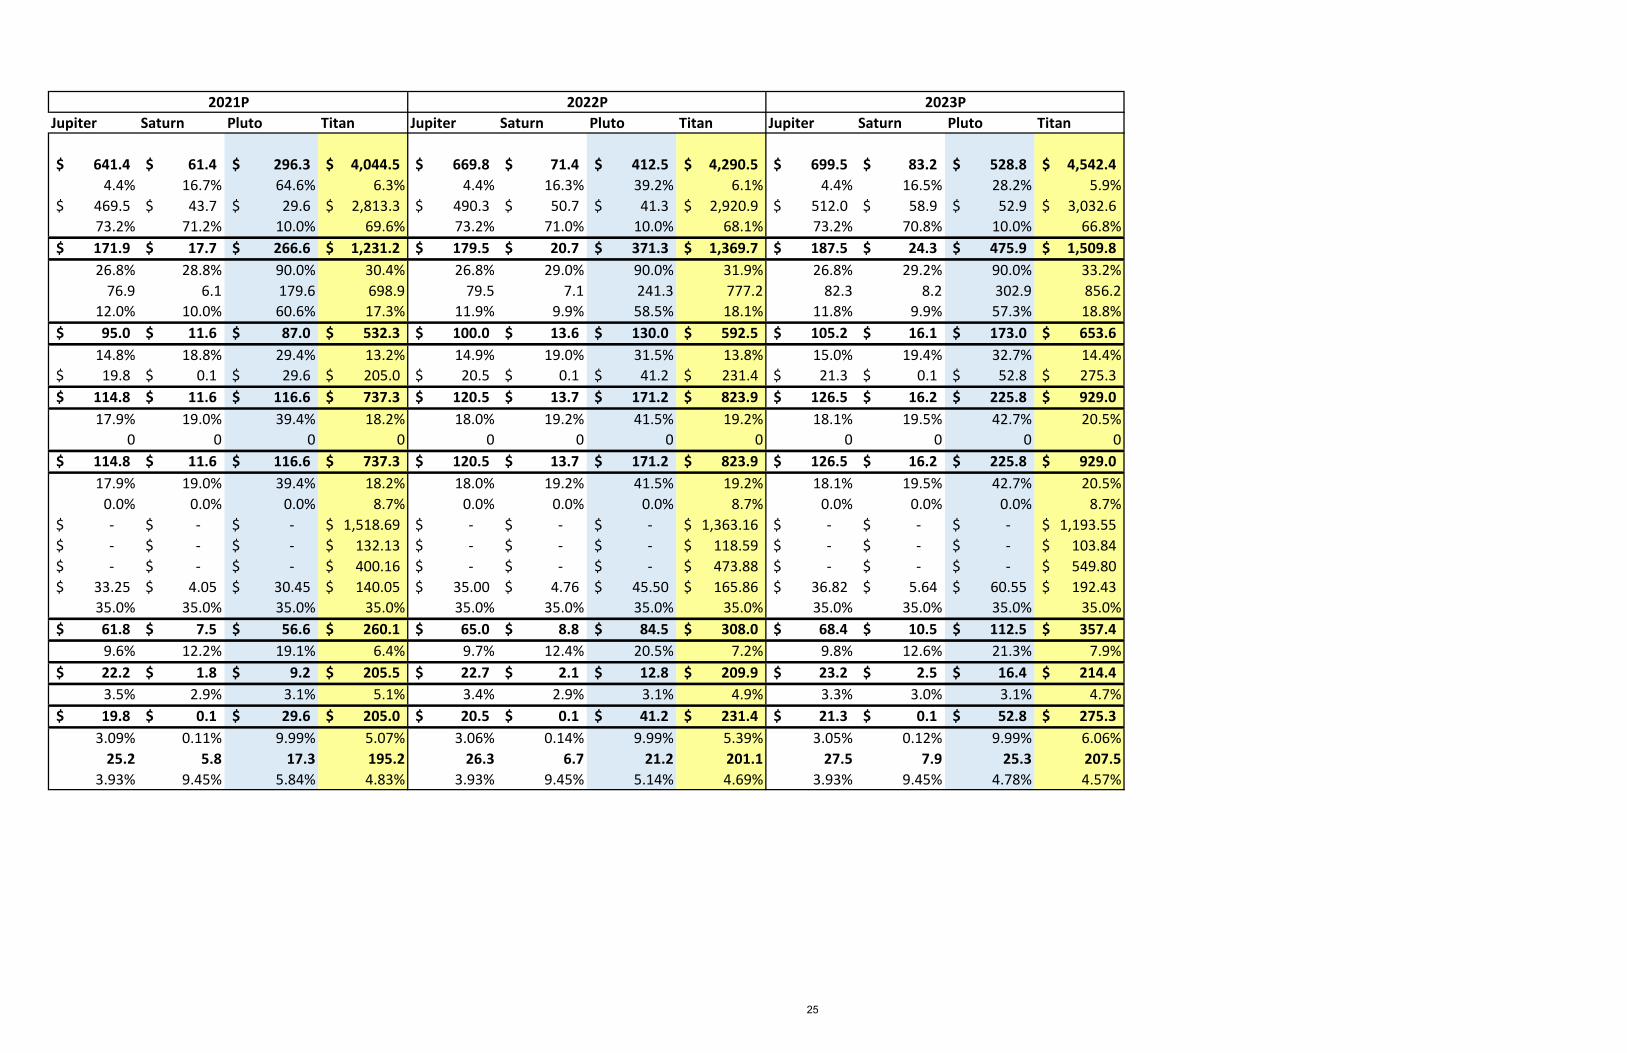
Jupiter Saturn Pluto Titan Jupiter Saturn Pluto Titan Jupiter Saturn Pluto Titan
641.4$ 61.4$ 296.3$ 4,044.5$ 669.8$ 71.4$ 412.5$ 4,290.5$ 699.5$ 83.2$ 528.8$ 4,542.4$ 4.4% 16.7% 64.6% 6.3% 4.4% 16.3% 39.2% 6.1% 4.4% 16.5% 28.2% 5.9%
469.5$ 43.7$ 29.6$ 2,813.3$ 490.3$ 50.7$ 41.3$ 2,920.9$ 512.0$ 58.9$ 52.9$ 3,032.6$ 73.2% 71.2% 10.0% 69.6% 73.2% 71.0% 10.0% 68.1% 73.2% 70.8% 10.0% 66.8%171.9$ 17.7$ 266.6$ 1,231.2$ 179.5$ 20.7$ 371.3$ 1,369.7$ 187.5$ 24.3$ 475.9$ 1,509.8$ 26.8% 28.8% 90.0% 30.4% 26.8% 29.0% 90.0% 31.9% 26.8% 29.2% 90.0% 33.2%
76.9 6.1 179.6 698.9 79.5 7.1 241.3 777.2 82.3 8.2 302.9 856.212.0% 10.0% 60.6% 17.3% 11.9% 9.9% 58.5% 18.1% 11.8% 9.9% 57.3% 18.8%95.0$ 11.6$ 87.0$ 532.3$ 100.0$ 13.6$ 130.0$ 592.5$ 105.2$ 16.1$ 173.0$ 653.6$
14.8% 18.8% 29.4% 13.2% 14.9% 19.0% 31.5% 13.8% 15.0% 19.4% 32.7% 14.4%19.8$ 0.1$ 29.6$ 205.0$ 20.5$ 0.1$ 41.2$ 231.4$ 21.3$ 0.1$ 52.8$ 275.3$
114.8$ 11.6$ 116.6$ 737.3$ 120.5$ 13.7$ 171.2$ 823.9$ 126.5$ 16.2$ 225.8$ 929.0$ 17.9% 19.0% 39.4% 18.2% 18.0% 19.2% 41.5% 19.2% 18.1% 19.5% 42.7% 20.5%
0 0 0 0 0 0 0 0 0 0 0 0114.8$ 11.6$ 116.6$ 737.3$ 120.5$ 13.7$ 171.2$ 823.9$ 126.5$ 16.2$ 225.8$ 929.0$ 17.9% 19.0% 39.4% 18.2% 18.0% 19.2% 41.5% 19.2% 18.1% 19.5% 42.7% 20.5%
0.0% 0.0% 0.0% 8.7% 0.0% 0.0% 0.0% 8.7% 0.0% 0.0% 0.0% 8.7%-$ -$ -$ 1,518.69$ -$ -$ -$ 1,363.16$ -$ -$ -$ 1,193.55$ -$ -$ -$ 132.13$ -$ -$ -$ 118.59$ -$ -$ -$ 103.84$ -$ -$ -$ 400.16$ -$ -$ -$ 473.88$ -$ -$ -$ 549.80$
33.25$ 4.05$ 30.45$ 140.05$ 35.00$ 4.76$ 45.50$ 165.86$ 36.82$ 5.64$ 60.55$ 192.43$ 35.0% 35.0% 35.0% 35.0% 35.0% 35.0% 35.0% 35.0% 35.0% 35.0% 35.0% 35.0%61.8$ 7.5$ 56.6$ 260.1$ 65.0$ 8.8$ 84.5$ 308.0$ 68.4$ 10.5$ 112.5$ 357.4$ 9.6% 12.2% 19.1% 6.4% 9.7% 12.4% 20.5% 7.2% 9.8% 12.6% 21.3% 7.9%22.2$ 1.8$ 9.2$ 205.5$ 22.7$ 2.1$ 12.8$ 209.9$ 23.2$ 2.5$ 16.4$ 214.4$ 3.5% 2.9% 3.1% 5.1% 3.4% 2.9% 3.1% 4.9% 3.3% 3.0% 3.1% 4.7%19.8$ 0.1$ 29.6$ 205.0$ 20.5$ 0.1$ 41.2$ 231.4$ 21.3$ 0.1$ 52.8$ 275.3$
3.09% 0.11% 9.99% 5.07% 3.06% 0.14% 9.99% 5.39% 3.05% 0.12% 9.99% 6.06%25.2 5.8 17.3 195.2 26.3 6.7 21.2 201.1 27.5 7.9 25.3 207.5
3.93% 9.45% 5.84% 4.83% 3.93% 9.45% 5.14% 4.69% 3.93% 9.45% 4.78% 4.57%
2022P 2023P2021P
25
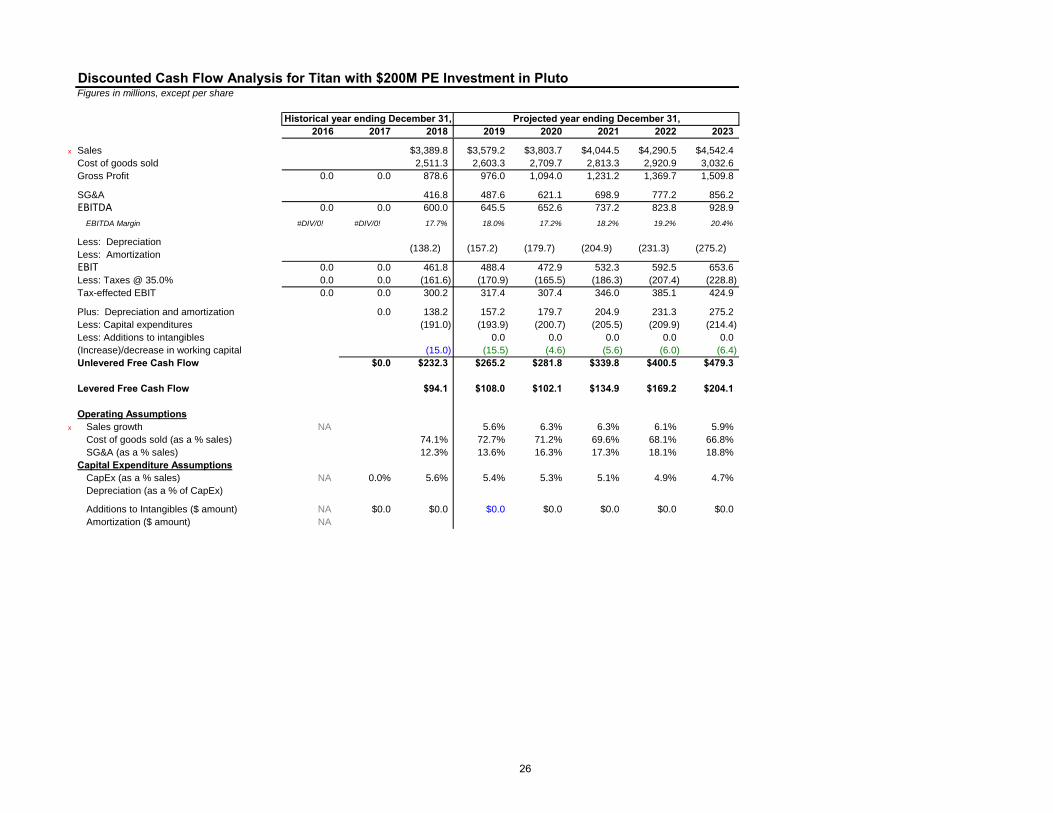
Discounted Cash Flow Analysis for Titan with $200M PE Investment in PlutoFigures in millions, except per share
Historical year ending December 31, Projected year ending December 31,2016 2017 2018 2019 2020 2021 2022 2023
x Sales $3,389.8 $3,579.2 $3,803.7 $4,044.5 $4,290.5 $4,542.4Cost of goods sold 2,511.3 2,603.3 2,709.7 2,813.3 2,920.9 3,032.6Gross Profit 0.0 0.0 878.6 976.0 1,094.0 1,231.2 1,369.7 1,509.8
SG&A 416.8 487.6 621.1 698.9 777.2 856.2EBITDA 0.0 0.0 600.0 645.5 652.6 737.2 823.8 928.9
EBITDA Margin #DIV/0! #DIV/0! 17.7% 18.0% 17.2% 18.2% 19.2% 20.4%
Less: DepreciationLess: AmortizationEBIT 0.0 0.0 461.8 488.4 472.9 532.3 592.5 653.6Less: Taxes @ 35.0% 0.0 0.0 (161.6) (170.9) (165.5) (186.3) (207.4) (228.8)Tax-effected EBIT 0.0 0.0 300.2 317.4 307.4 346.0 385.1 424.9
Plus: Depreciation and amortization 0.0 138.2 157.2 179.7 204.9 231.3 275.2Less: Capital expenditures (191.0) (193.9) (200.7) (205.5) (209.9) (214.4)Less: Additions to intangibles 0.0 0.0 0.0 0.0 0.0(Increase)/decrease in working capital (15.0) (15.5) (4.6) (5.6) (6.0) (6.4)Unlevered Free Cash Flow $0.0 $232.3 $265.2 $281.8 $339.8 $400.5 $479.3
Levered Free Cash Flow $94.1 $108.0 $102.1 $134.9 $169.2 $204.1
Operating Assumptionsx Sales growth NA 5.6% 6.3% 6.3% 6.1% 5.9%
Cost of goods sold (as a % sales) 74.1% 72.7% 71.2% 69.6% 68.1% 66.8%SG&A (as a % sales) 12.3% 13.6% 16.3% 17.3% 18.1% 18.8%
Capital Expenditure AssumptionsCapEx (as a % sales) NA 0.0% 5.6% 5.4% 5.3% 5.1% 4.9% 4.7%Depreciation (as a % of CapEx)
Additions to Intangibles ($ amount) NA $0.0 $0.0 $0.0 $0.0 $0.0 $0.0 $0.0Amortization ($ amount) NA
(231.3) (275.2)(138.2) (157.2) (179.7) (204.9)
26

Perpetuity Growth Method EBITDA Multiple Method
Weighted average cost of capital: 10.0% Weighted average cost of capital: 10.0% Net present value of free cash flow $1,300.5 Net present value of free cash flow $1,300.5
Terminal growth rate 3.0% Terminal multiple 6.8xTerminal value $7,052.4 Terminal value $6,316.3 Present value of the terminal value 4,379.0 Present value of the terminal value 3,921.9
Enterprise value $5,679.4 Enterprise value $5,222.4 Less: Net debt* (2,319.0) Less: Net debt* (2,319.0) Equity value $3,360.5 Equity value $2,903.4
Diluted shares: 100.000 Diluted shares: 100.000
x Equity Value Per Share $33.60 Equity Value Per Share $29.03
Implied EBITDA Terminal Multiple Implied Perpetuity Growth RateTerminal year unlevered free cash flow $479.3 Terminal year EBITDA $928.9Weighted average cost of capital 10.0% Weighted average cost of capital 10.0%Growth rate of free cash flow after terminal year 3.0% Multiple 6.8xTerminal year EBITDA $928.9 Terminal year unlevered free cash flow $479.3
Implied EBITDA Terminal Multiple: 7.6x Implied Growth Rate: 2.2%[$479.3 x (1+3.0%) x (1+0.0%)^0.5 )] / [$928.9 x (10.0% - 3.0%)] = 7.6x [$928.9 x 6.8 x 10.0%) - $479.3) x (1+0.0%)^0.5 )] / [($928.9 x 6.8) + $479.3 x (1+0.0%)^0.5] = 2.2%
* Note: Net debt represents total debt, minority interest and preferred stock, less cash & equivalents.This model is provided "as is". Training The Street, Inc. and their affiliates have no liability arising out of the use of this model.
27
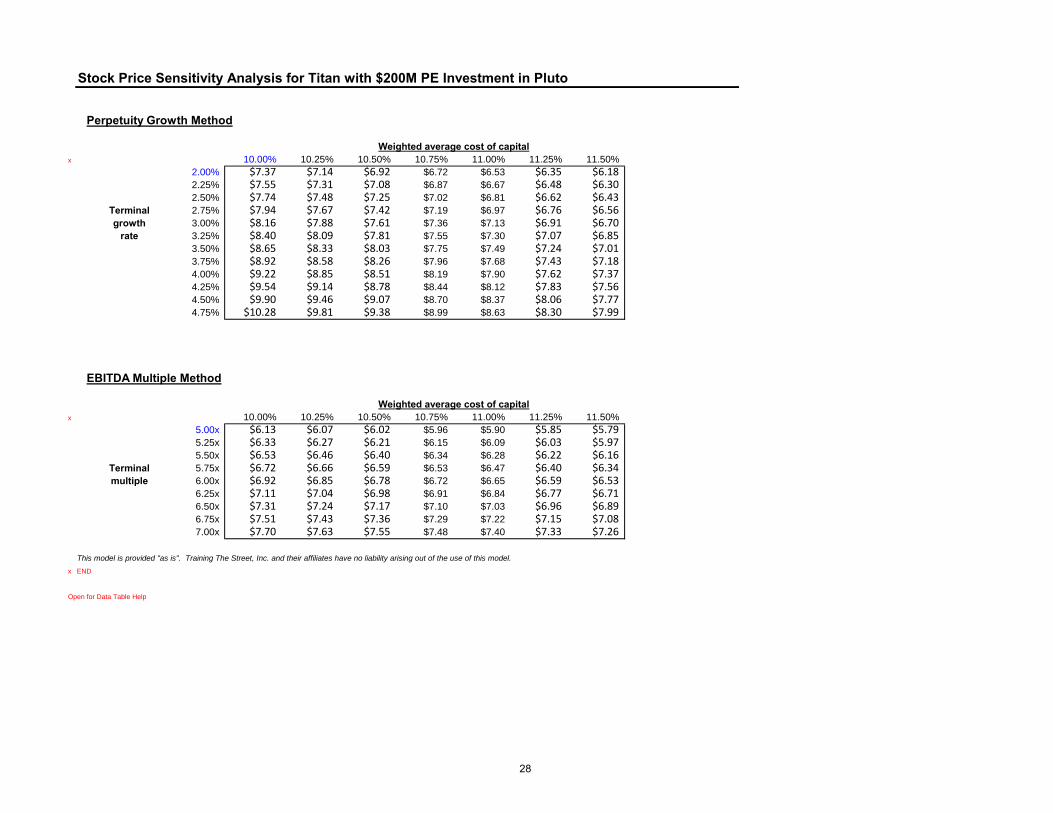
Stock Price Sensitivity Analysis for Titan with $200M PE Investment in Pluto
Perpetuity Growth Method
Weighted average cost of capitalx 10.00% 10.25% 10.50% 10.75% 11.00% 11.25% 11.50%
2.00% $7.37 $7.14 $6.92 $6.72 $6.53 $6.35 $6.182.25% $7.55 $7.31 $7.08 $6.87 $6.67 $6.48 $6.302.50% $7.74 $7.48 $7.25 $7.02 $6.81 $6.62 $6.43
Terminal 2.75% $7.94 $7.67 $7.42 $7.19 $6.97 $6.76 $6.56growth 3.00% $8.16 $7.88 $7.61 $7.36 $7.13 $6.91 $6.70
rate 3.25% $8.40 $8.09 $7.81 $7.55 $7.30 $7.07 $6.853.50% $8.65 $8.33 $8.03 $7.75 $7.49 $7.24 $7.013.75% $8.92 $8.58 $8.26 $7.96 $7.68 $7.43 $7.184.00% $9.22 $8.85 $8.51 $8.19 $7.90 $7.62 $7.374.25% $9.54 $9.14 $8.78 $8.44 $8.12 $7.83 $7.564.50% $9.90 $9.46 $9.07 $8.70 $8.37 $8.06 $7.774.75% $10.28 $9.81 $9.38 $8.99 $8.63 $8.30 $7.99
EBITDA Multiple Method
Weighted average cost of capitalx 10.00% 10.25% 10.50% 10.75% 11.00% 11.25% 11.50%
5.00x $6.13 $6.07 $6.02 $5.96 $5.90 $5.85 $5.795.25x $6.33 $6.27 $6.21 $6.15 $6.09 $6.03 $5.975.50x $6.53 $6.46 $6.40 $6.34 $6.28 $6.22 $6.16
Terminal 5.75x $6.72 $6.66 $6.59 $6.53 $6.47 $6.40 $6.34multiple 6.00x $6.92 $6.85 $6.78 $6.72 $6.65 $6.59 $6.53
6.25x $7.11 $7.04 $6.98 $6.91 $6.84 $6.77 $6.716.50x $7.31 $7.24 $7.17 $7.10 $7.03 $6.96 $6.896.75x $7.51 $7.43 $7.36 $7.29 $7.22 $7.15 $7.087.00x $7.70 $7.63 $7.55 $7.48 $7.40 $7.33 $7.26
This model is provided "as is". Training The Street, Inc. and their affiliates have no liability arising out of the use of this model.x END
Open for Data Table Help
28
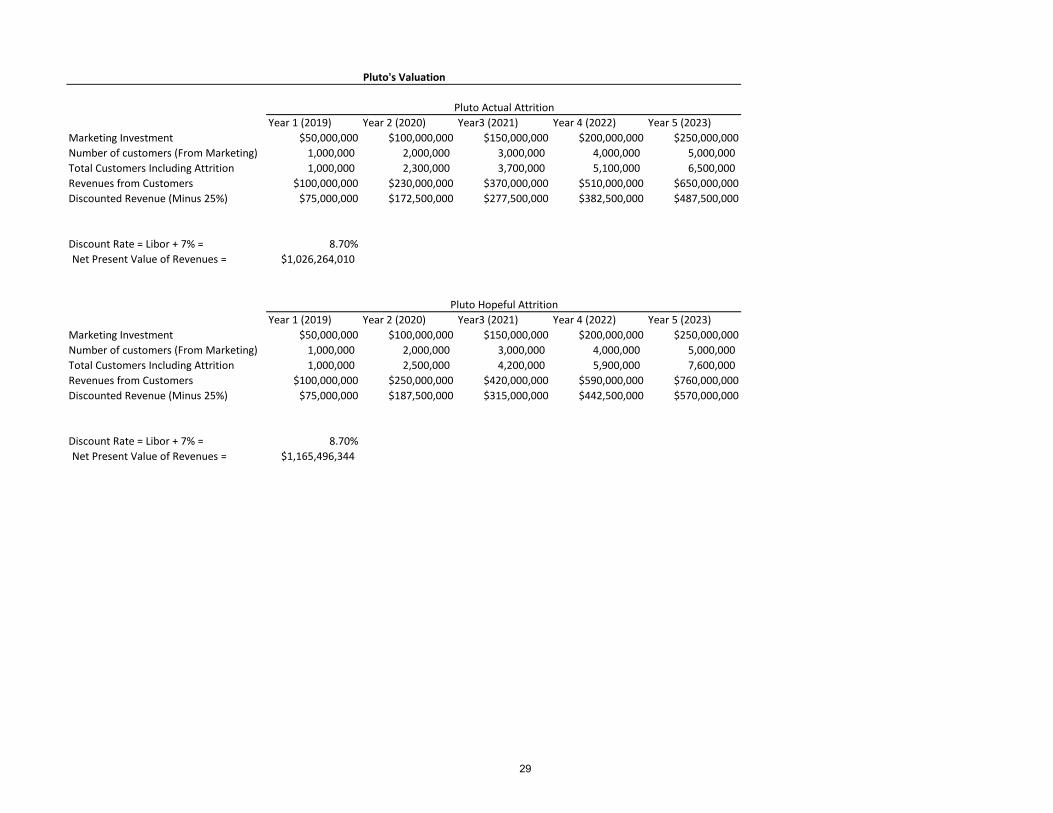
Year 1 (2019) Year 2 (2020) Year3 (2021) Year 4 (2022) Year 5 (2023)Marketing Investment $50,000,000 $100,000,000 $150,000,000 $200,000,000 $250,000,000Number of customers (From Marketing) 1,000,000 2,000,000 3,000,000 4,000,000 5,000,000 Total Customers Including Attrition 1,000,000 2,300,000 3,700,000 5,100,000 6,500,000 Revenues from Customers $100,000,000 $230,000,000 $370,000,000 $510,000,000 $650,000,000Discounted Revenue (Minus 25%) $75,000,000 $172,500,000 $277,500,000 $382,500,000 $487,500,000
Discount Rate = Libor + 7% = 8.70%Net Present Value of Revenues = $1,026,264,010
Year 1 (2019) Year 2 (2020) Year3 (2021) Year 4 (2022) Year 5 (2023)Marketing Investment $50,000,000 $100,000,000 $150,000,000 $200,000,000 $250,000,000Number of customers (From Marketing) 1,000,000 2,000,000 3,000,000 4,000,000 5,000,000 Total Customers Including Attrition 1,000,000 2,500,000 4,200,000 5,900,000 7,600,000 Revenues from Customers $100,000,000 $250,000,000 $420,000,000 $590,000,000 $760,000,000Discounted Revenue (Minus 25%) $75,000,000 $187,500,000 $315,000,000 $442,500,000 $570,000,000
Discount Rate = Libor + 7% = 8.70%Net Present Value of Revenues = $1,165,496,344
Pluto Actual Attrition
Pluto Hopeful Attrition
Pluto's Valuation
29
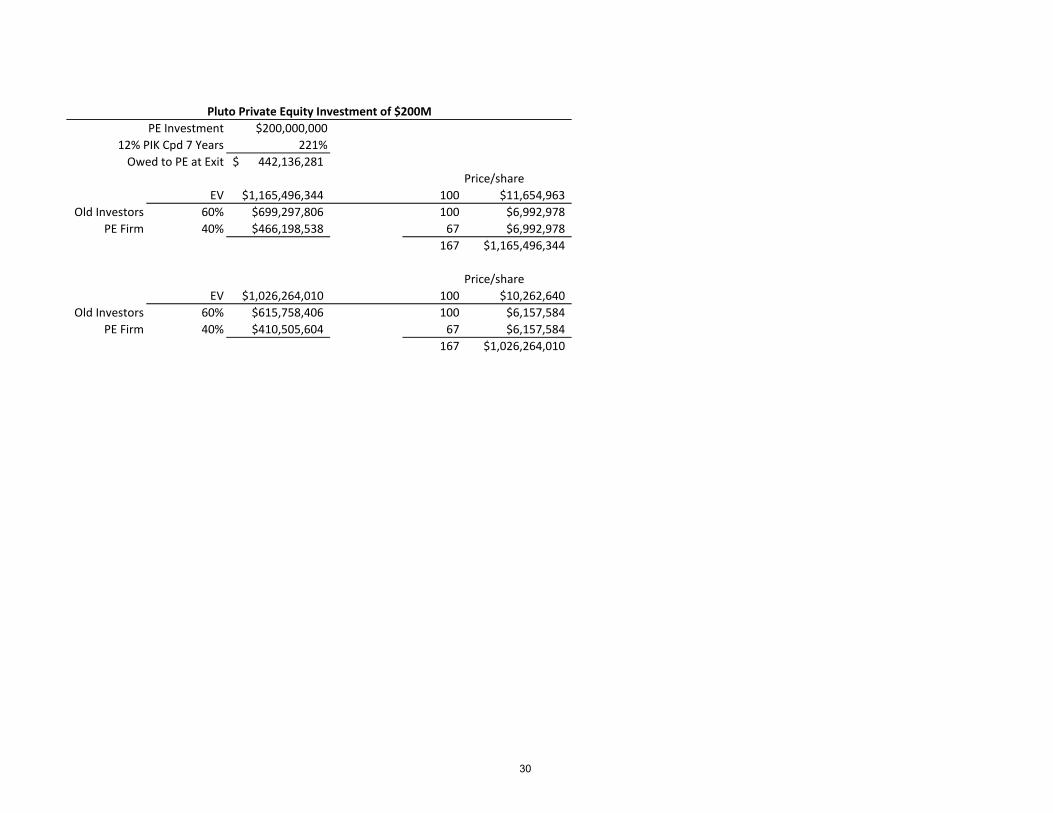
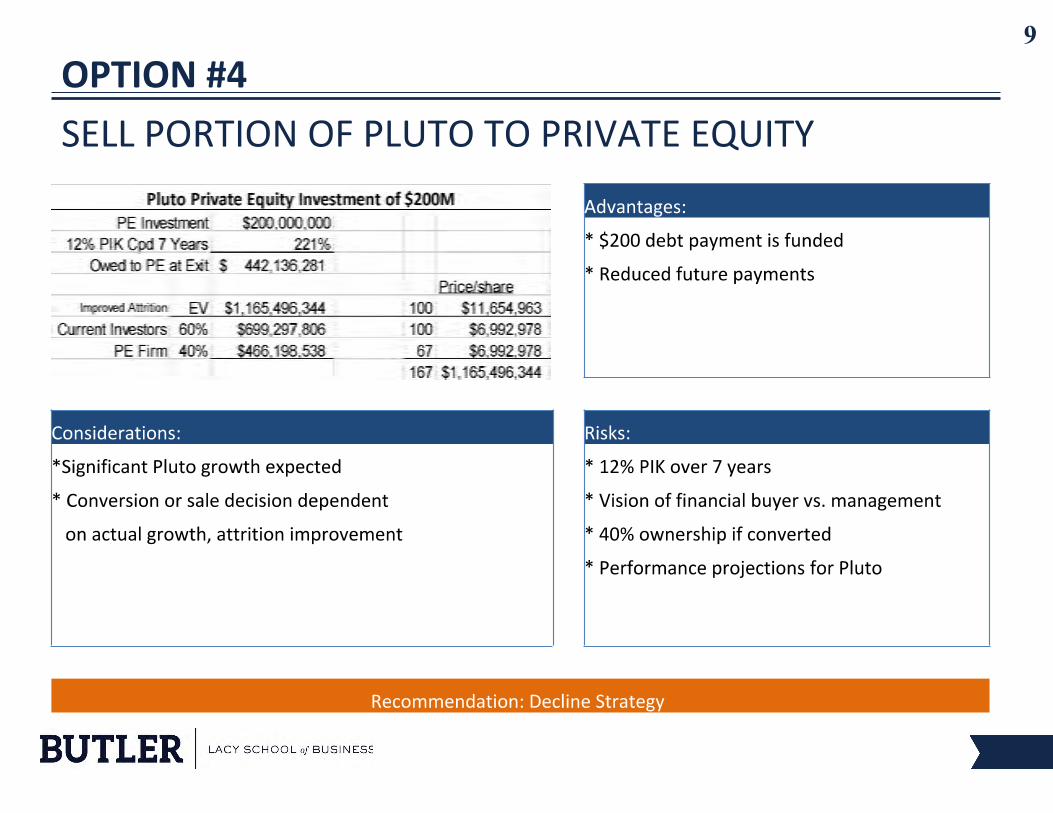
PE Investment $200,000,00012% PIK Cpd 7 Years 221%
Owed to PE at Exit 442,136,281$ Price/share
EV $1,165,496,344 100 $11,654,963Old Investors 60% $699,297,806 100 $6,992,978
PE Firm 40% $466,198,538 67 $6,992,978167 $1,165,496,344
Price/shareEV $1,026,264,010 100 $10,262,640
Old Investors 60% $615,758,406 100 $6,157,584PE Firm 40% $410,505,604 67 $6,157,584
167 $1,026,264,010
Pluto Private Equity Investment of $200M
30

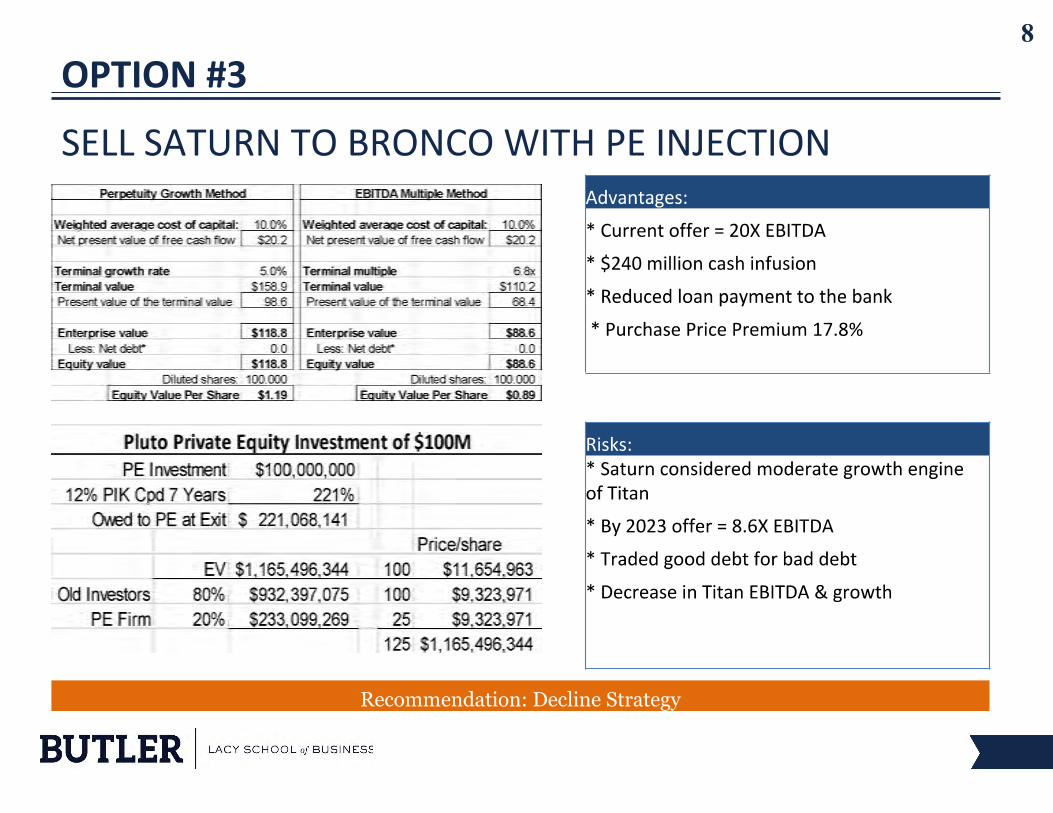
PE Investment $100,000,00012% PIK Cpd 7 Years 221%
Owed to PE at Exit 221,068,141$ Price/share
EV $1,165,496,344 100 $11,654,963Old Investors 80% $932,397,075 100 $9,323,971
PE Firm 20% $233,099,269 25 $9,323,971125 $1,165,496,344
Price/shareEV $1,026,264,010 100 $10,262,640
Old Investors 80% $821,011,208 100 $8,210,112PE Firm 20% $205,252,802 25 $8,210,112
125 $1,026,264,010
Pluto Private Equity Investment of $100M
31
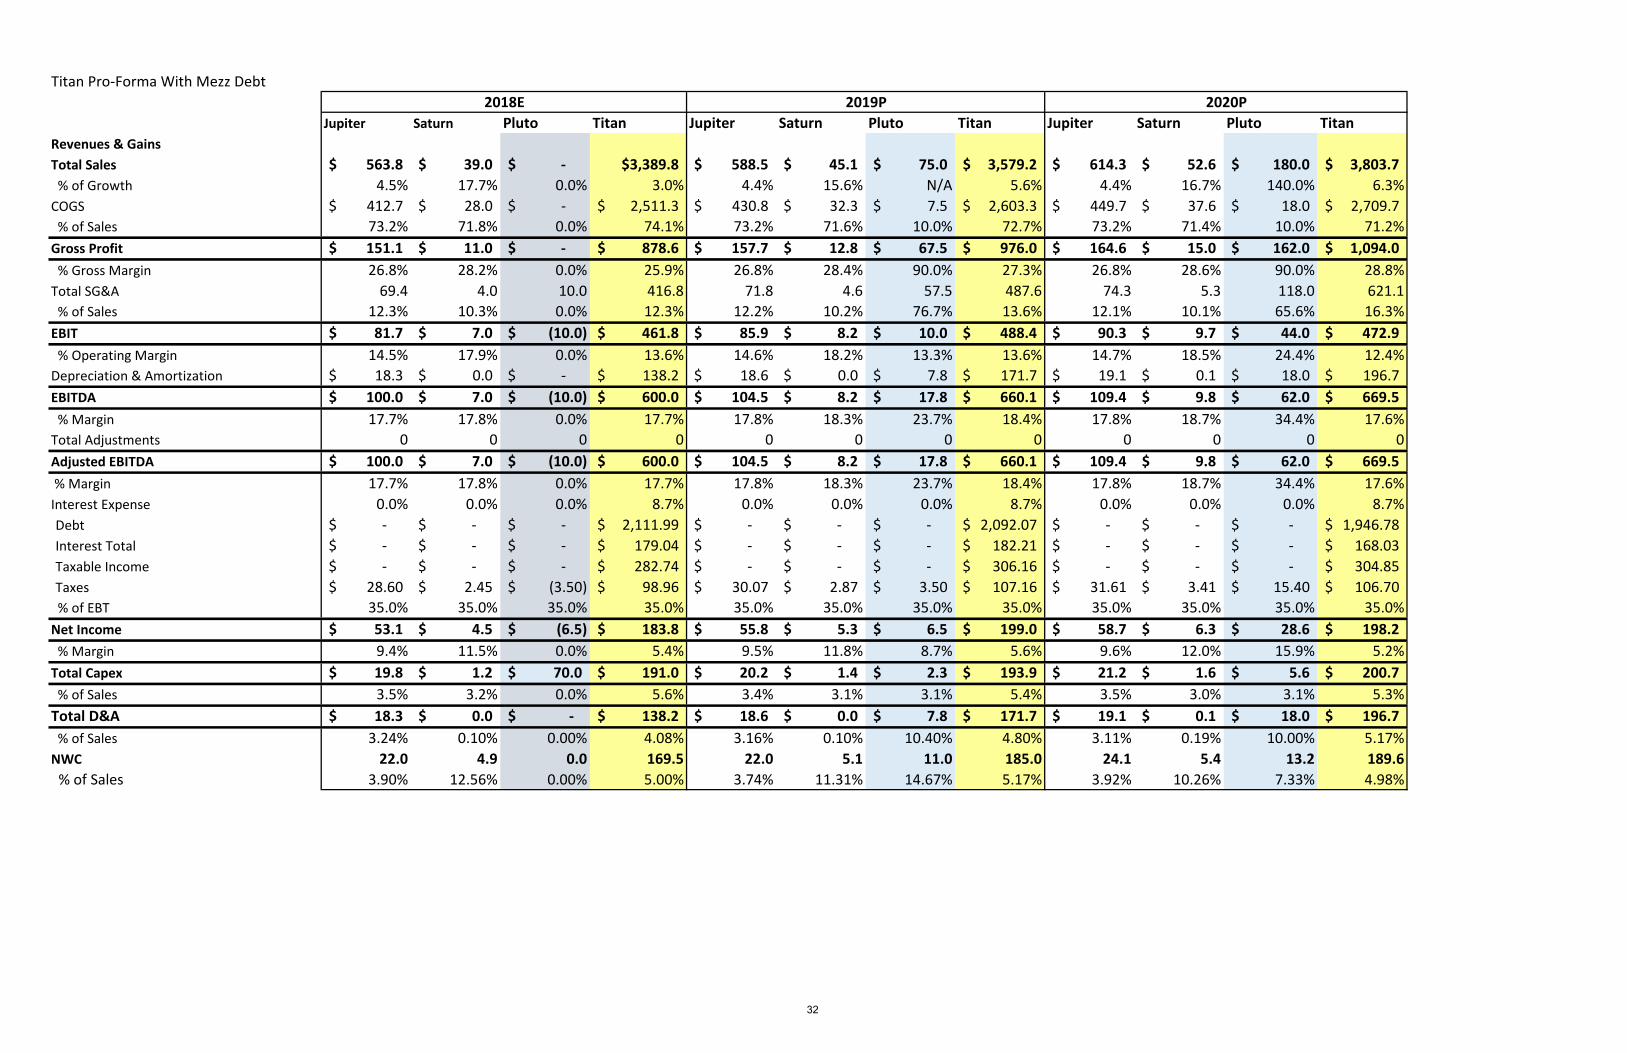
Titan Pro-Forma With Mezz Debt
Jupiter Saturn Pluto Titan Jupiter Saturn Pluto Titan Jupiter Saturn Pluto TitanRevenues & GainsTotal Sales 563.8$ 39.0$ -$ $3,389.8 588.5$ 45.1$ 75.0$ 3,579.2$ 614.3$ 52.6$ 180.0$ 3,803.7$ % of Growth 4.5% 17.7% 0.0% 3.0% 4.4% 15.6% N/A 5.6% 4.4% 16.7% 140.0% 6.3%COGS 412.7$ 28.0$ -$ 2,511.3$ 430.8$ 32.3$ 7.5$ 2,603.3$ 449.7$ 37.6$ 18.0$ 2,709.7$ % of Sales 73.2% 71.8% 0.0% 74.1% 73.2% 71.6% 10.0% 72.7% 73.2% 71.4% 10.0% 71.2%Gross Profit 151.1$ 11.0$ -$ 878.6$ 157.7$ 12.8$ 67.5$ 976.0$ 164.6$ 15.0$ 162.0$ 1,094.0$ % Gross Margin 26.8% 28.2% 0.0% 25.9% 26.8% 28.4% 90.0% 27.3% 26.8% 28.6% 90.0% 28.8%Total SG&A 69.4 4.0 10.0 416.8 71.8 4.6 57.5 487.6 74.3 5.3 118.0 621.1 % of Sales 12.3% 10.3% 0.0% 12.3% 12.2% 10.2% 76.7% 13.6% 12.1% 10.1% 65.6% 16.3%EBIT 81.7$ 7.0$ (10.0)$ 461.8$ 85.9$ 8.2$ 10.0$ 488.4$ 90.3$ 9.7$ 44.0$ 472.9$
14.5% 17.9% 0.0% 13.6% 14.6% 18.2% 13.3% 13.6% 14.7% 18.5% 24.4% 12.4%Depreciation & Amortization 18.3$ 0.0$ -$ 138.2$ 18.6$ 0.0$ 7.8$ 171.7$ 19.1$ 0.1$ 18.0$ 196.7$
100.0$ 7.0$ (10.0)$ 600.0$ 104.5$ 8.2$ 17.8$ 660.1$ 109.4$ 9.8$ 62.0$ 669.5$ % Margin 17.7% 17.8% 0.0% 17.7% 17.8% 18.3% 23.7% 18.4% 17.8% 18.7% 34.4% 17.6%
0 0 0 0 0 0 0 0 0 0 0 0Adjusted EBITDA 100.0$ 7.0$ (10.0)$ 600.0$ 104.5$ 8.2$ 17.8$ 660.1$ 109.4$ 9.8$ 62.0$ 669.5$ % Margin 17.7% 17.8% 0.0% 17.7% 17.8% 18.3% 23.7% 18.4% 17.8% 18.7% 34.4% 17.6%Interest Expense 0.0% 0.0% 0.0% 8.7% 0.0% 0.0% 0.0% 8.7% 0.0% 0.0% 0.0% 8.7%Debt -$ -$ -$ 2,111.99$ -$ -$ -$ 2,092.07$ -$ -$ -$ 1,946.78$ Interest Total -$ -$ -$ 179.04$ -$ -$ -$ 182.21$ -$ -$ -$ 168.03$ Taxable Income -$ -$ -$ 282.74$ -$ -$ -$ 306.16$ -$ -$ -$ 304.85$ Taxes 28.60$ 2.45$ (3.50)$ 98.96$ 30.07$ 2.87$ 3.50$ 107.16$ 31.61$ 3.41$ 15.40$ 106.70$
% of EBT 35.0% 35.0% 35.0% 35.0% 35.0% 35.0% 35.0% 35.0% 35.0% 35.0% 35.0% 35.0%Net Income 53.1$ 4.5$ (6.5)$ 183.8$ 55.8$ 5.3$ 6.5$ 199.0$ 58.7$ 6.3$ 28.6$ 198.2$ % Margin 9.4% 11.5% 0.0% 5.4% 9.5% 11.8% 8.7% 5.6% 9.6% 12.0% 15.9% 5.2%Total Capex 19.8$ 1.2$ 70.0$ 191.0$ 20.2$ 1.4$ 2.3$ 193.9$ 21.2$ 1.6$ 5.6$ 200.7$ % of Sales 3.5% 3.2% 0.0% 5.6% 3.4% 3.1% 3.1% 5.4% 3.5% 3.0% 3.1% 5.3%Total D&A 18.3$ 0.0$ -$ 138.2$ 18.6$ 0.0$ 7.8$ 171.7$ 19.1$ 0.1$ 18.0$ 196.7$ % of Sales 3.24% 0.10% 0.00% 4.08% 3.16% 0.10% 10.40% 4.80% 3.11% 0.19% 10.00% 5.17%NWC 22.0 4.9 0.0 169.5 22.0 5.1 11.0 185.0 24.1 5.4 13.2 189.6 % of Sales 3.90% 12.56% 0.00% 5.00% 3.74% 11.31% 14.67% 5.17% 3.92% 10.26% 7.33% 4.98%
Total Adjustments
% Operating Margin
EBITDA
2018E 2019P 2020P
32
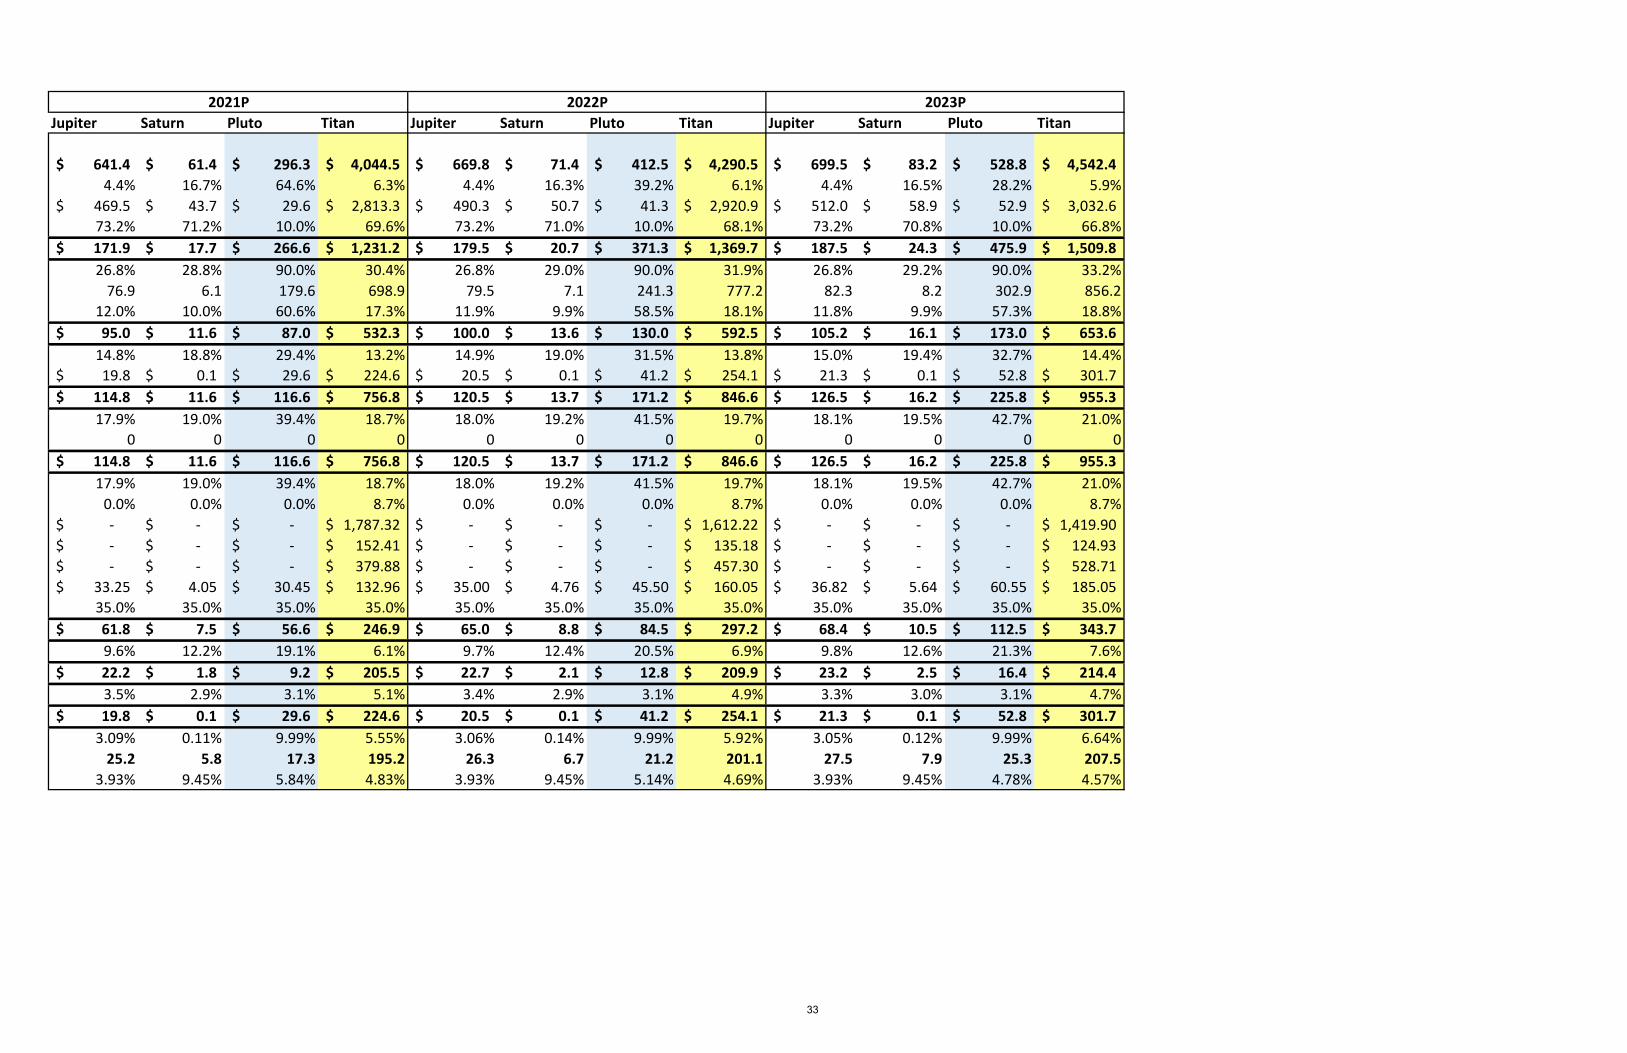
Jupiter Saturn Pluto Titan Jupiter Saturn Pluto Titan Jupiter Saturn Pluto Titan
641.4$ 61.4$ 296.3$ 4,044.5$ 669.8$ 71.4$ 412.5$ 4,290.5$ 699.5$ 83.2$ 528.8$ 4,542.4$ 4.4% 16.7% 64.6% 6.3% 4.4% 16.3% 39.2% 6.1% 4.4% 16.5% 28.2% 5.9%
469.5$ 43.7$ 29.6$ 2,813.3$ 490.3$ 50.7$ 41.3$ 2,920.9$ 512.0$ 58.9$ 52.9$ 3,032.6$ 73.2% 71.2% 10.0% 69.6% 73.2% 71.0% 10.0% 68.1% 73.2% 70.8% 10.0% 66.8%171.9$ 17.7$ 266.6$ 1,231.2$ 179.5$ 20.7$ 371.3$ 1,369.7$ 187.5$ 24.3$ 475.9$ 1,509.8$ 26.8% 28.8% 90.0% 30.4% 26.8% 29.0% 90.0% 31.9% 26.8% 29.2% 90.0% 33.2%
76.9 6.1 179.6 698.9 79.5 7.1 241.3 777.2 82.3 8.2 302.9 856.212.0% 10.0% 60.6% 17.3% 11.9% 9.9% 58.5% 18.1% 11.8% 9.9% 57.3% 18.8%95.0$ 11.6$ 87.0$ 532.3$ 100.0$ 13.6$ 130.0$ 592.5$ 105.2$ 16.1$ 173.0$ 653.6$
14.8% 18.8% 29.4% 13.2% 14.9% 19.0% 31.5% 13.8% 15.0% 19.4% 32.7% 14.4%19.8$ 0.1$ 29.6$ 224.6$ 20.5$ 0.1$ 41.2$ 254.1$ 21.3$ 0.1$ 52.8$ 301.7$
114.8$ 11.6$ 116.6$ 756.8$ 120.5$ 13.7$ 171.2$ 846.6$ 126.5$ 16.2$ 225.8$ 955.3$ 17.9% 19.0% 39.4% 18.7% 18.0% 19.2% 41.5% 19.7% 18.1% 19.5% 42.7% 21.0%
0 0 0 0 0 0 0 0 0 0 0 0114.8$ 11.6$ 116.6$ 756.8$ 120.5$ 13.7$ 171.2$ 846.6$ 126.5$ 16.2$ 225.8$ 955.3$ 17.9% 19.0% 39.4% 18.7% 18.0% 19.2% 41.5% 19.7% 18.1% 19.5% 42.7% 21.0%
0.0% 0.0% 0.0% 8.7% 0.0% 0.0% 0.0% 8.7% 0.0% 0.0% 0.0% 8.7%-$ -$ -$ 1,787.32$ -$ -$ -$ 1,612.22$ -$ -$ -$ 1,419.90$ -$ -$ -$ 152.41$ -$ -$ -$ 135.18$ -$ -$ -$ 124.93$ -$ -$ -$ 379.88$ -$ -$ -$ 457.30$ -$ -$ -$ 528.71$
33.25$ 4.05$ 30.45$ 132.96$ 35.00$ 4.76$ 45.50$ 160.05$ 36.82$ 5.64$ 60.55$ 185.05$ 35.0% 35.0% 35.0% 35.0% 35.0% 35.0% 35.0% 35.0% 35.0% 35.0% 35.0% 35.0%61.8$ 7.5$ 56.6$ 246.9$ 65.0$ 8.8$ 84.5$ 297.2$ 68.4$ 10.5$ 112.5$ 343.7$ 9.6% 12.2% 19.1% 6.1% 9.7% 12.4% 20.5% 6.9% 9.8% 12.6% 21.3% 7.6%22.2$ 1.8$ 9.2$ 205.5$ 22.7$ 2.1$ 12.8$ 209.9$ 23.2$ 2.5$ 16.4$ 214.4$ 3.5% 2.9% 3.1% 5.1% 3.4% 2.9% 3.1% 4.9% 3.3% 3.0% 3.1% 4.7%19.8$ 0.1$ 29.6$ 224.6$ 20.5$ 0.1$ 41.2$ 254.1$ 21.3$ 0.1$ 52.8$ 301.7$
3.09% 0.11% 9.99% 5.55% 3.06% 0.14% 9.99% 5.92% 3.05% 0.12% 9.99% 6.64%25.2 5.8 17.3 195.2 26.3 6.7 21.2 201.1 27.5 7.9 25.3 207.5
3.93% 9.45% 5.84% 4.83% 3.93% 9.45% 5.14% 4.69% 3.93% 9.45% 4.78% 4.57%
2022P 2023P2021P
33
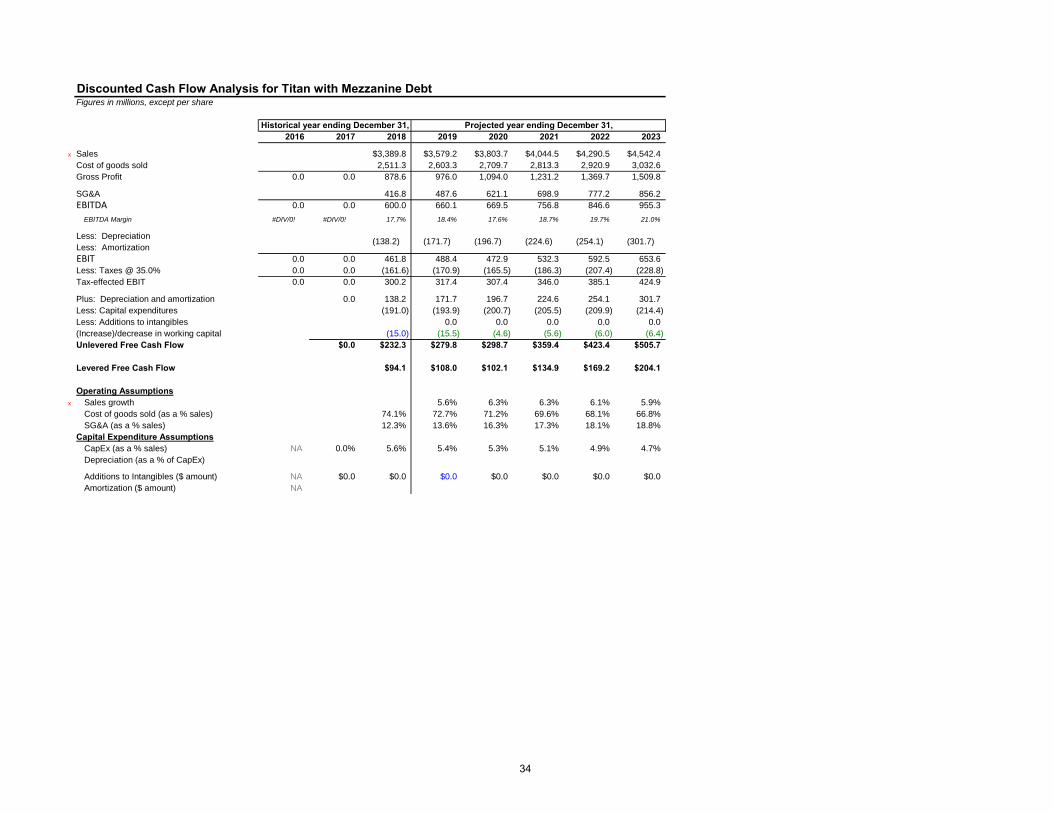
Discounted Cash Flow Analysis for Titan with Mezzanine DebtFigures in millions, except per share
Historical year ending December 31, Projected year ending December 31,2016 2017 2018 2019 2020 2021 2022 2023
x Sales $3,389.8 $3,579.2 $3,803.7 $4,044.5 $4,290.5 $4,542.4Cost of goods sold 2,511.3 2,603.3 2,709.7 2,813.3 2,920.9 3,032.6Gross Profit 0.0 0.0 878.6 976.0 1,094.0 1,231.2 1,369.7 1,509.8
SG&A 416.8 487.6 621.1 698.9 777.2 856.2EBITDA 0.0 0.0 600.0 660.1 669.5 756.8 846.6 955.3
EBITDA Margin #DIV/0! #DIV/0! 17.7% 18.4% 17.6% 18.7% 19.7% 21.0%
Less: DepreciationLess: AmortizationEBIT 0.0 0.0 461.8 488.4 472.9 532.3 592.5 653.6Less: Taxes @ 35.0% 0.0 0.0 (161.6) (170.9) (165.5) (186.3) (207.4) (228.8)Tax-effected EBIT 0.0 0.0 300.2 317.4 307.4 346.0 385.1 424.9
Plus: Depreciation and amortization 0.0 138.2 171.7 196.7 224.6 254.1 301.7Less: Capital expenditures (191.0) (193.9) (200.7) (205.5) (209.9) (214.4)Less: Additions to intangibles 0.0 0.0 0.0 0.0 0.0(Increase)/decrease in working capital (15.0) (15.5) (4.6) (5.6) (6.0) (6.4)Unlevered Free Cash Flow $0.0 $232.3 $279.8 $298.7 $359.4 $423.4 $505.7
Levered Free Cash Flow $94.1 $108.0 $102.1 $134.9 $169.2 $204.1
Operating Assumptionsx Sales growth 5.6% 6.3% 6.3% 6.1% 5.9%
Cost of goods sold (as a % sales) 74.1% 72.7% 71.2% 69.6% 68.1% 66.8%SG&A (as a % sales) 12.3% 13.6% 16.3% 17.3% 18.1% 18.8%
Capital Expenditure AssumptionsCapEx (as a % sales) NA 0.0% 5.6% 5.4% 5.3% 5.1% 4.9% 4.7%Depreciation (as a % of CapEx)
Additions to Intangibles ($ amount) NA $0.0 $0.0 $0.0 $0.0 $0.0 $0.0 $0.0Amortization ($ amount) NA
(254.1) (301.7)(138.2) (171.7) (196.7) (224.6)
34
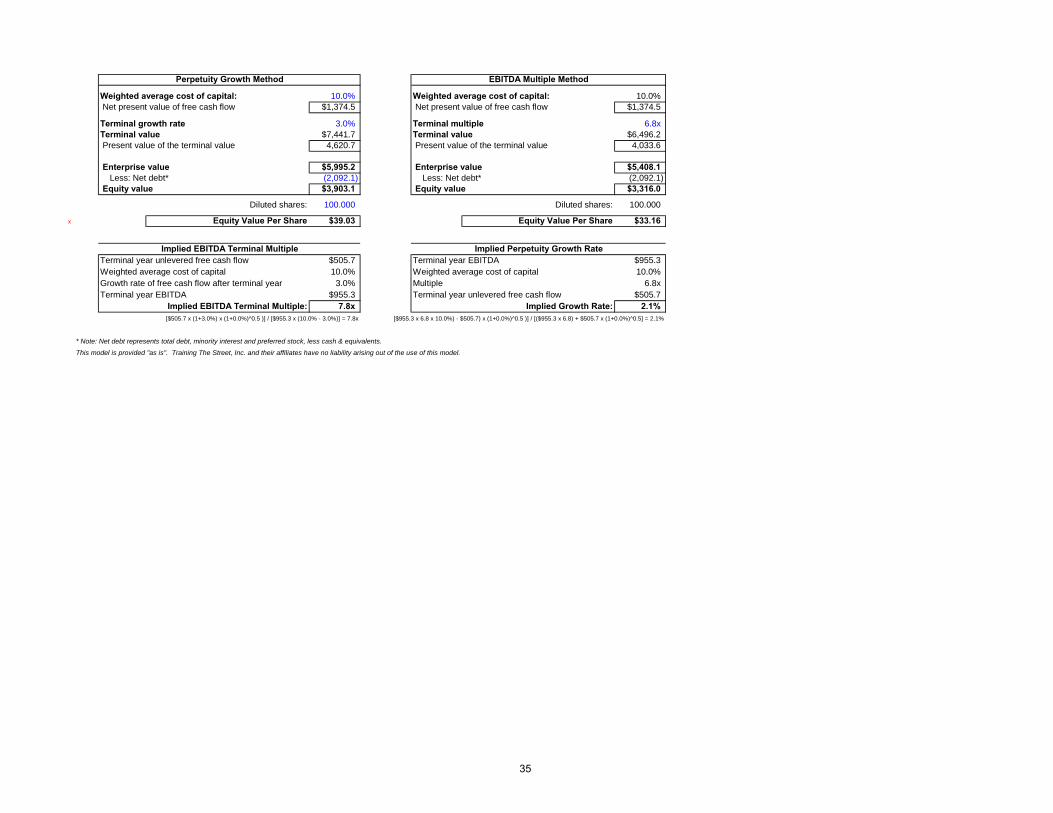
Perpetuity Growth Method EBITDA Multiple Method
Weighted average cost of capital: 10.0% Weighted average cost of capital: 10.0% Net present value of free cash flow $1,374.5 Net present value of free cash flow $1,374.5
Terminal growth rate 3.0% Terminal multiple 6.8xTerminal value $7,441.7 Terminal value $6,496.2 Present value of the terminal value 4,620.7 Present value of the terminal value 4,033.6
Enterprise value $5,995.2 Enterprise value $5,408.1 Less: Net debt* (2,092.1) Less: Net debt* (2,092.1) Equity value $3,903.1 Equity value $3,316.0
Diluted shares: 100.000 Diluted shares: 100.000
x Equity Value Per Share $39.03 Equity Value Per Share $33.16
Implied EBITDA Terminal Multiple Implied Perpetuity Growth RateTerminal year unlevered free cash flow $505.7 Terminal year EBITDA $955.3Weighted average cost of capital 10.0% Weighted average cost of capital 10.0%Growth rate of free cash flow after terminal year 3.0% Multiple 6.8xTerminal year EBITDA $955.3 Terminal year unlevered free cash flow $505.7
Implied EBITDA Terminal Multiple: 7.8x Implied Growth Rate: 2.1%[$505.7 x (1+3.0%) x (1+0.0%)^0.5 )] / [$955.3 x (10.0% - 3.0%)] = 7.8x [$955.3 x 6.8 x 10.0%) - $505.7) x (1+0.0%)^0.5 )] / [($955.3 x 6.8) + $505.7 x (1+0.0%)^0.5] = 2.1%
* Note: Net debt represents total debt, minority interest and preferred stock, less cash & equivalents.
This model is provided "as is". Training The Street, Inc. and their affiliates have no liability arising out of the use of this model.
35
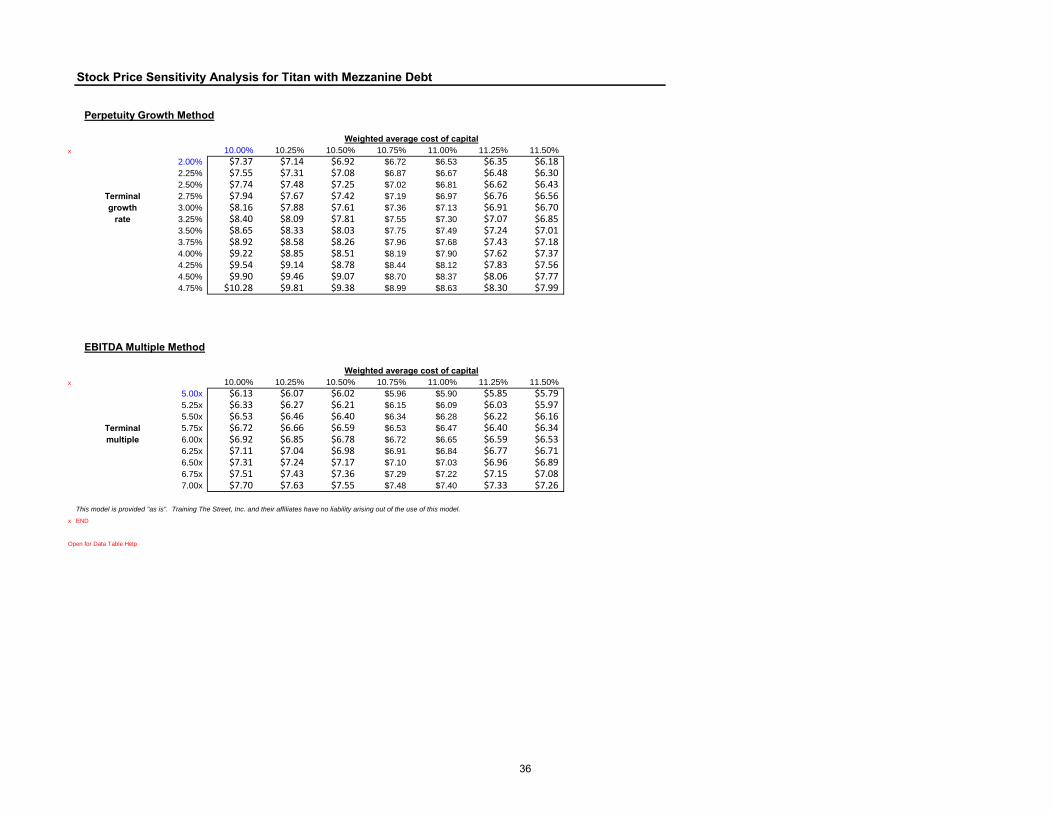
Stock Price Sensitivity Analysis for Titan with Mezzanine Debt
Perpetuity Growth Method
Weighted average cost of capitalx 10.00% 10.25% 10.50% 10.75% 11.00% 11.25% 11.50%
2.00% $7.37 $7.14 $6.92 $6.72 $6.53 $6.35 $6.182.25% $7.55 $7.31 $7.08 $6.87 $6.67 $6.48 $6.302.50% $7.74 $7.48 $7.25 $7.02 $6.81 $6.62 $6.43
Terminal 2.75% $7.94 $7.67 $7.42 $7.19 $6.97 $6.76 $6.56growth 3.00% $8.16 $7.88 $7.61 $7.36 $7.13 $6.91 $6.70
rate 3.25% $8.40 $8.09 $7.81 $7.55 $7.30 $7.07 $6.853.50% $8.65 $8.33 $8.03 $7.75 $7.49 $7.24 $7.013.75% $8.92 $8.58 $8.26 $7.96 $7.68 $7.43 $7.184.00% $9.22 $8.85 $8.51 $8.19 $7.90 $7.62 $7.374.25% $9.54 $9.14 $8.78 $8.44 $8.12 $7.83 $7.564.50% $9.90 $9.46 $9.07 $8.70 $8.37 $8.06 $7.774.75% $10.28 $9.81 $9.38 $8.99 $8.63 $8.30 $7.99
EBITDA Multiple Method
Weighted average cost of capitalx 10.00% 10.25% 10.50% 10.75% 11.00% 11.25% 11.50%
5.00x $6.13 $6.07 $6.02 $5.96 $5.90 $5.85 $5.795.25x $6.33 $6.27 $6.21 $6.15 $6.09 $6.03 $5.975.50x $6.53 $6.46 $6.40 $6.34 $6.28 $6.22 $6.16
Terminal 5.75x $6.72 $6.66 $6.59 $6.53 $6.47 $6.40 $6.34multiple 6.00x $6.92 $6.85 $6.78 $6.72 $6.65 $6.59 $6.53
6.25x $7.11 $7.04 $6.98 $6.91 $6.84 $6.77 $6.716.50x $7.31 $7.24 $7.17 $7.10 $7.03 $6.96 $6.896.75x $7.51 $7.43 $7.36 $7.29 $7.22 $7.15 $7.087.00x $7.70 $7.63 $7.55 $7.48 $7.40 $7.33 $7.26
This model is provided "as is". Training The Street, Inc. and their affiliates have no liability arising out of the use of this model.
x END
Open for Data Table Help
36
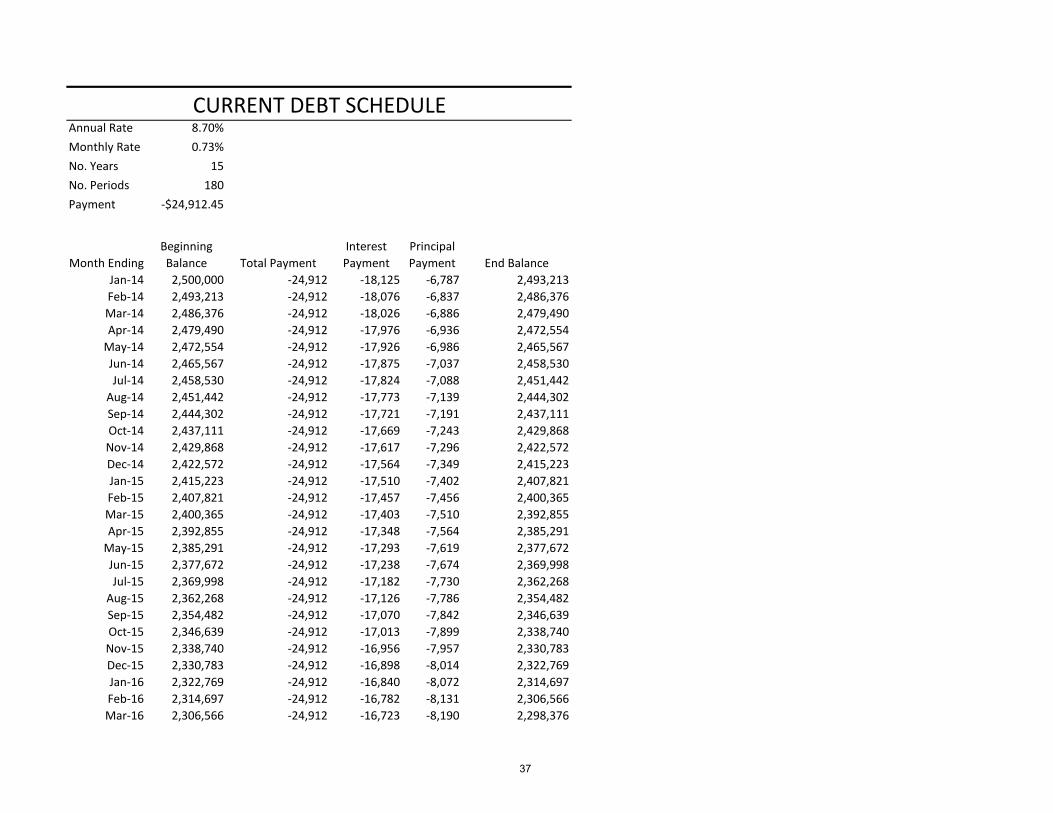
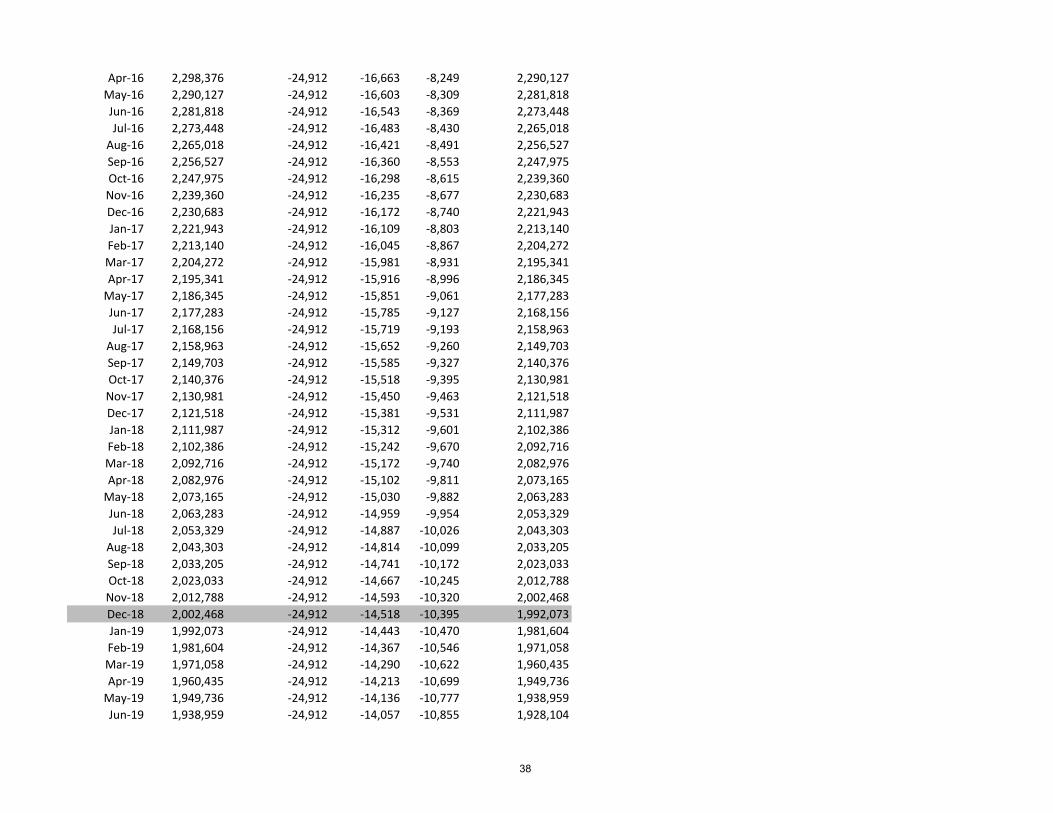
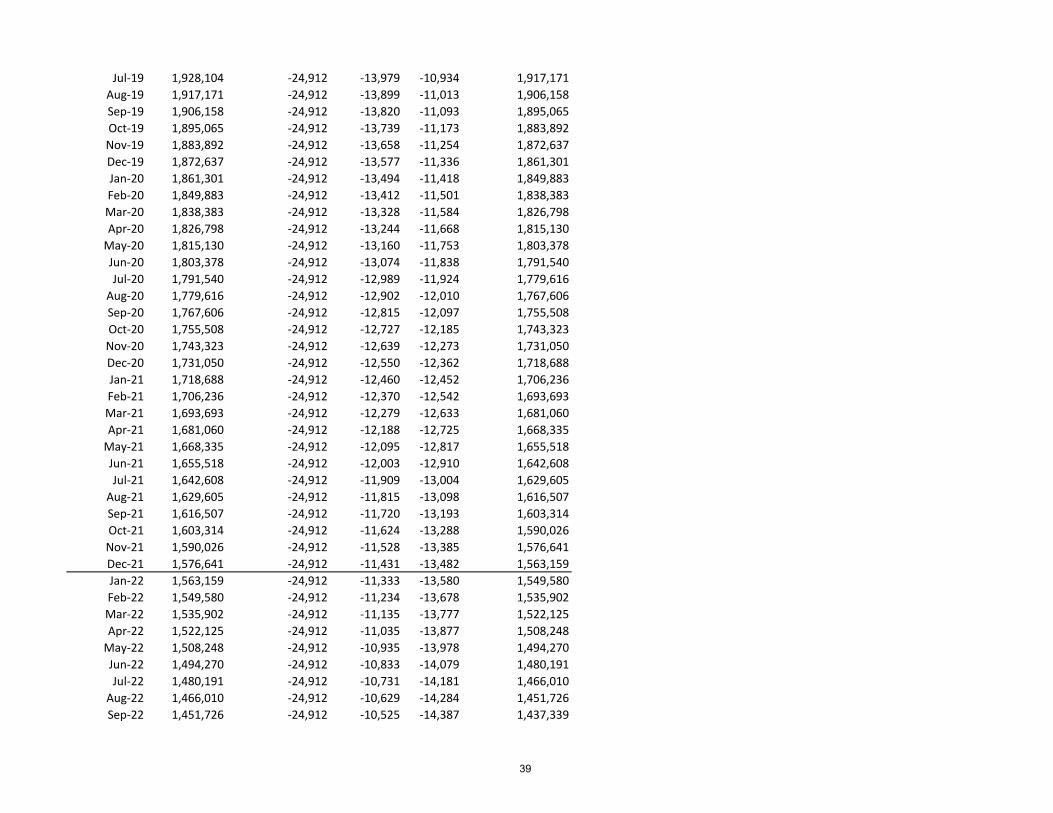
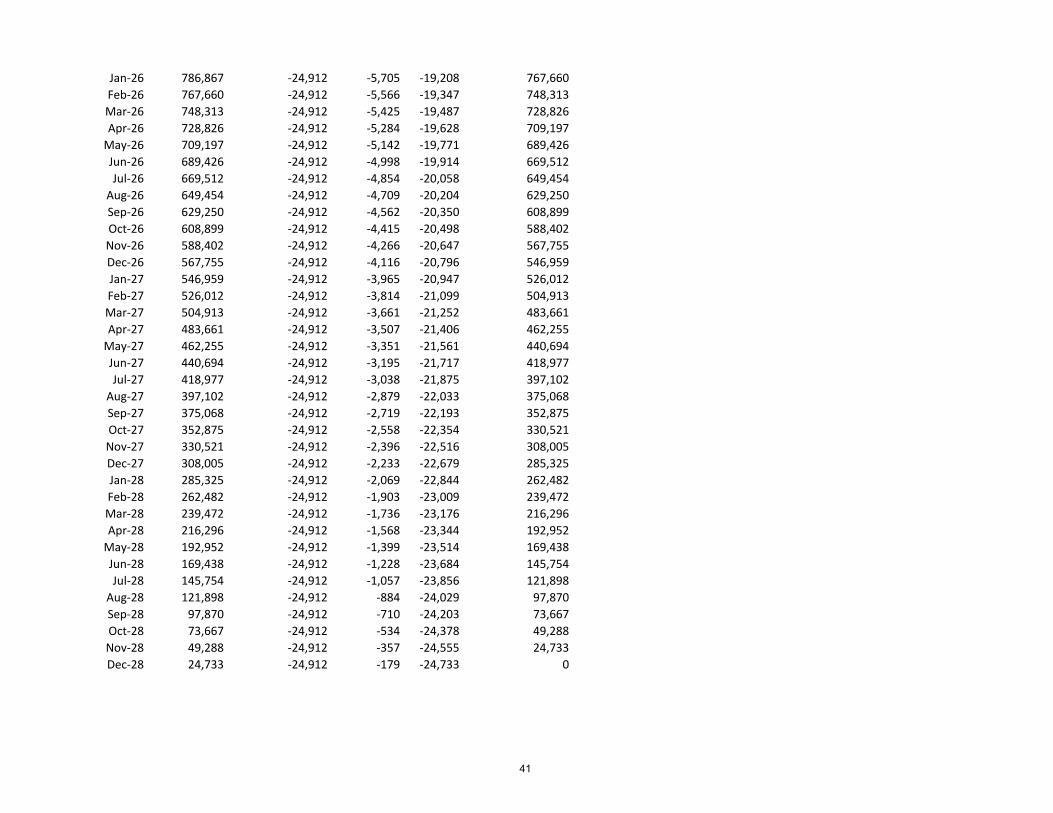
Annual Rate 8.70%Monthly Rate 0.73%No. Years 15No. Periods 180Payment -$24,912.45
Jan-14 2,500,000 -24,912 -18,125 -6,787 2,493,213Feb-14 2,493,213 -24,912 -18,076 -6,837 2,486,376Mar-14 2,486,376 -24,912 -18,026 -6,886 2,479,490Apr-14 2,479,490 -24,912 -17,976 -6,936 2,472,554
May-14 2,472,554 -24,912 -17,926 -6,986 2,465,567Jun-14 2,465,567 -24,912 -17,875 -7,037 2,458,530Jul-14 2,458,530 -24,912 -17,824 -7,088 2,451,442
Aug-14 2,451,442 -24,912 -17,773 -7,139 2,444,302Sep-14 2,444,302 -24,912 -17,721 -7,191 2,437,111Oct-14 2,437,111 -24,912 -17,669 -7,243 2,429,868Nov-14 2,429,868 -24,912 -17,617 -7,296 2,422,572Dec-14 2,422,572 -24,912 -17,564 -7,349 2,415,223Jan-15 2,415,223 -24,912 -17,510 -7,402 2,407,821Feb-15 2,407,821 -24,912 -17,457 -7,456 2,400,365Mar-15 2,400,365 -24,912 -17,403 -7,510 2,392,855Apr-15 2,392,855 -24,912 -17,348 -7,564 2,385,291
May-15 2,385,291 -24,912 -17,293 -7,619 2,377,672Jun-15 2,377,672 -24,912 -17,238 -7,674 2,369,998Jul-15 2,369,998 -24,912 -17,182 -7,730 2,362,268
Aug-15 2,362,268 -24,912 -17,126 -7,786 2,354,482Sep-15 2,354,482 -24,912 -17,070 -7,842 2,346,639Oct-15 2,346,639 -24,912 -17,013 -7,899 2,338,740Nov-15 2,338,740 -24,912 -16,956 -7,957 2,330,783Dec-15 2,330,783 -24,912 -16,898 -8,014 2,322,769Jan-16 2,322,769 -24,912 -16,840 -8,072 2,314,697Feb-16 2,314,697 -24,912 -16,782 -8,131 2,306,566Mar-16 2,306,566 -24,912 -16,723 -8,190 2,298,376
Interest Payment
Principal Payment End Balance
CURRENT DEBT SCHEDULE
Month EndingBeginning Balance Total Payment
37
Apr-16 2,298,376 -24,912 -16,663 -8,249 2,290,127May-16 2,290,127 -24,912 -16,603 -8,309 2,281,818Jun-16 2,281,818 -24,912 -16,543 -8,369 2,273,448Jul-16 2,273,448 -24,912 -16,483 -8,430 2,265,018
Aug-16 2,265,018 -24,912 -16,421 -8,491 2,256,527Sep-16 2,256,527 -24,912 -16,360 -8,553 2,247,975Oct-16 2,247,975 -24,912 -16,298 -8,615 2,239,360Nov-16 2,239,360 -24,912 -16,235 -8,677 2,230,683Dec-16 2,230,683 -24,912 -16,172 -8,740 2,221,943Jan-17 2,221,943 -24,912 -16,109 -8,803 2,213,140Feb-17 2,213,140 -24,912 -16,045 -8,867 2,204,272Mar-17 2,204,272 -24,912 -15,981 -8,931 2,195,341Apr-17 2,195,341 -24,912 -15,916 -8,996 2,186,345
May-17 2,186,345 -24,912 -15,851 -9,061 2,177,283Jun-17 2,177,283 -24,912 -15,785 -9,127 2,168,156Jul-17 2,168,156 -24,912 -15,719 -9,193 2,158,963
Aug-17 2,158,963 -24,912 -15,652 -9,260 2,149,703Sep-17 2,149,703 -24,912 -15,585 -9,327 2,140,376Oct-17 2,140,376 -24,912 -15,518 -9,395 2,130,981Nov-17 2,130,981 -24,912 -15,450 -9,463 2,121,518Dec-17 2,121,518 -24,912 -15,381 -9,531 2,111,987Jan-18 2,111,987 -24,912 -15,312 -9,601 2,102,386Feb-18 2,102,386 -24,912 -15,242 -9,670 2,092,716Mar-18 2,092,716 -24,912 -15,172 -9,740 2,082,976Apr-18 2,082,976 -24,912 -15,102 -9,811 2,073,165
May-18 2,073,165 -24,912 -15,030 -9,882 2,063,283Jun-18 2,063,283 -24,912 -14,959 -9,954 2,053,329Jul-18 2,053,329 -24,912 -14,887 -10,026 2,043,303
Aug-18 2,043,303 -24,912 -14,814 -10,099 2,033,205Sep-18 2,033,205 -24,912 -14,741 -10,172 2,023,033Oct-18 2,023,033 -24,912 -14,667 -10,245 2,012,788Nov-18 2,012,788 -24,912 -14,593 -10,320 2,002,468Dec-18 2,002,468 -24,912 -14,518 -10,395 1,992,073Jan-19 1,992,073 -24,912 -14,443 -10,470 1,981,604Feb-19 1,981,604 -24,912 -14,367 -10,546 1,971,058Mar-19 1,971,058 -24,912 -14,290 -10,622 1,960,435Apr-19 1,960,435 -24,912 -14,213 -10,699 1,949,736
May-19 1,949,736 -24,912 -14,136 -10,777 1,938,959Jun-19 1,938,959 -24,912 -14,057 -10,855 1,928,104
38
Jul-19 1,928,104 -24,912 -13,979 -10,934 1,917,171Aug-19 1,917,171 -24,912 -13,899 -11,013 1,906,158Sep-19 1,906,158 -24,912 -13,820 -11,093 1,895,065Oct-19 1,895,065 -24,912 -13,739 -11,173 1,883,892Nov-19 1,883,892 -24,912 -13,658 -11,254 1,872,637Dec-19 1,872,637 -24,912 -13,577 -11,336 1,861,301Jan-20 1,861,301 -24,912 -13,494 -11,418 1,849,883Feb-20 1,849,883 -24,912 -13,412 -11,501 1,838,383Mar-20 1,838,383 -24,912 -13,328 -11,584 1,826,798Apr-20 1,826,798 -24,912 -13,244 -11,668 1,815,130
May-20 1,815,130 -24,912 -13,160 -11,753 1,803,378Jun-20 1,803,378 -24,912 -13,074 -11,838 1,791,540Jul-20 1,791,540 -24,912 -12,989 -11,924 1,779,616
Aug-20 1,779,616 -24,912 -12,902 -12,010 1,767,606Sep-20 1,767,606 -24,912 -12,815 -12,097 1,755,508Oct-20 1,755,508 -24,912 -12,727 -12,185 1,743,323Nov-20 1,743,323 -24,912 -12,639 -12,273 1,731,050Dec-20 1,731,050 -24,912 -12,550 -12,362 1,718,688Jan-21 1,718,688 -24,912 -12,460 -12,452 1,706,236Feb-21 1,706,236 -24,912 -12,370 -12,542 1,693,693Mar-21 1,693,693 -24,912 -12,279 -12,633 1,681,060Apr-21 1,681,060 -24,912 -12,188 -12,725 1,668,335
May-21 1,668,335 -24,912 -12,095 -12,817 1,655,518Jun-21 1,655,518 -24,912 -12,003 -12,910 1,642,608Jul-21 1,642,608 -24,912 -11,909 -13,004 1,629,605
Aug-21 1,629,605 -24,912 -11,815 -13,098 1,616,507Sep-21 1,616,507 -24,912 -11,720 -13,193 1,603,314Oct-21 1,603,314 -24,912 -11,624 -13,288 1,590,026Nov-21 1,590,026 -24,912 -11,528 -13,385 1,576,641Dec-21 1,576,641 -24,912 -11,431 -13,482 1,563,159Jan-22 1,563,159 -24,912 -11,333 -13,580 1,549,580Feb-22 1,549,580 -24,912 -11,234 -13,678 1,535,902Mar-22 1,535,902 -24,912 -11,135 -13,777 1,522,125Apr-22 1,522,125 -24,912 -11,035 -13,877 1,508,248
May-22 1,508,248 -24,912 -10,935 -13,978 1,494,270Jun-22 1,494,270 -24,912 -10,833 -14,079 1,480,191Jul-22 1,480,191 -24,912 -10,731 -14,181 1,466,010
Aug-22 1,466,010 -24,912 -10,629 -14,284 1,451,726Sep-22 1,451,726 -24,912 -10,525 -14,387 1,437,339
39

Oct-22 1,437,339 -24,912 -10,421 -14,492 1,422,847Nov-22 1,422,847 -24,912 -10,316 -14,597 1,408,250Dec-22 1,408,250 -24,912 -10,210 -14,703 1,393,547Jan-23 1,393,547 -24,912 -10,103 -14,809 1,378,738Feb-23 1,378,738 -24,912 -9,996 -14,917 1,363,821Mar-23 1,363,821 -24,912 -9,888 -15,025 1,348,797Apr-23 1,348,797 -24,912 -9,779 -15,134 1,333,663
May-23 1,333,663 -24,912 -9,669 -15,243 1,318,420Jun-23 1,318,420 -24,912 -9,559 -15,354 1,303,066Jul-23 1,303,066 -24,912 -9,447 -15,465 1,287,601
Aug-23 1,287,601 -24,912 -9,335 -15,577 1,272,023Sep-23 1,272,023 -24,912 -9,222 -15,690 1,256,333Oct-23 1,256,333 -24,912 -9,108 -15,804 1,240,529Nov-23 1,240,529 -24,912 -8,994 -15,919 1,224,610Dec-23 1,224,610 -24,912 -8,878 -16,034 1,208,576Jan-24 1,208,576 -24,912 -8,762 -16,150 1,192,426Feb-24 1,192,426 -24,912 -8,645 -16,267 1,176,159Mar-24 1,176,159 -24,912 -8,527 -16,385 1,159,773Apr-24 1,159,773 -24,912 -8,408 -16,504 1,143,269
May-24 1,143,269 -24,912 -8,289 -16,624 1,126,645Jun-24 1,126,645 -24,912 -8,168 -16,744 1,109,901Jul-24 1,109,901 -24,912 -8,047 -16,866 1,093,035
Aug-24 1,093,035 -24,912 -7,925 -16,988 1,076,048Sep-24 1,076,048 -24,912 -7,801 -17,111 1,058,936Oct-24 1,058,936 -24,912 -7,677 -17,235 1,041,701Nov-24 1,041,701 -24,912 -7,552 -17,360 1,024,341Dec-24 1,024,341 -24,912 -7,426 -17,486 1,006,855Jan-25 1,006,855 -24,912 -7,300 -17,613 989,242Feb-25 989,242 -24,912 -7,172 -17,740 971,502Mar-25 971,502 -24,912 -7,043 -17,869 953,633Apr-25 953,633 -24,912 -6,914 -17,999 935,634
May-25 935,634 -24,912 -6,783 -18,129 917,505Jun-25 917,505 -24,912 -6,652 -18,261 899,245Jul-25 899,245 -24,912 -6,520 -18,393 880,852
Aug-25 880,852 -24,912 -6,386 -18,526 862,325Sep-25 862,325 -24,912 -6,252 -18,661 843,665Oct-25 843,665 -24,912 -6,117 -18,796 824,869Nov-25 824,869 -24,912 -5,980 -18,932 805,937Dec-25 805,937 -24,912 -5,843 -19,069 786,867
40
Jan-26 786,867 -24,912 -5,705 -19,208 767,660Feb-26 767,660 -24,912 -5,566 -19,347 748,313Mar-26 748,313 -24,912 -5,425 -19,487 728,826Apr-26 728,826 -24,912 -5,284 -19,628 709,197
May-26 709,197 -24,912 -5,142 -19,771 689,426Jun-26 689,426 -24,912 -4,998 -19,914 669,512Jul-26 669,512 -24,912 -4,854 -20,058 649,454
Aug-26 649,454 -24,912 -4,709 -20,204 629,250Sep-26 629,250 -24,912 -4,562 -20,350 608,899Oct-26 608,899 -24,912 -4,415 -20,498 588,402Nov-26 588,402 -24,912 -4,266 -20,647 567,755Dec-26 567,755 -24,912 -4,116 -20,796 546,959Jan-27 546,959 -24,912 -3,965 -20,947 526,012Feb-27 526,012 -24,912 -3,814 -21,099 504,913Mar-27 504,913 -24,912 -3,661 -21,252 483,661Apr-27 483,661 -24,912 -3,507 -21,406 462,255
May-27 462,255 -24,912 -3,351 -21,561 440,694Jun-27 440,694 -24,912 -3,195 -21,717 418,977Jul-27 418,977 -24,912 -3,038 -21,875 397,102
Aug-27 397,102 -24,912 -2,879 -22,033 375,068Sep-27 375,068 -24,912 -2,719 -22,193 352,875Oct-27 352,875 -24,912 -2,558 -22,354 330,521Nov-27 330,521 -24,912 -2,396 -22,516 308,005Dec-27 308,005 -24,912 -2,233 -22,679 285,325Jan-28 285,325 -24,912 -2,069 -22,844 262,482Feb-28 262,482 -24,912 -1,903 -23,009 239,472Mar-28 239,472 -24,912 -1,736 -23,176 216,296Apr-28 216,296 -24,912 -1,568 -23,344 192,952
May-28 192,952 -24,912 -1,399 -23,514 169,438Jun-28 169,438 -24,912 -1,228 -23,684 145,754Jul-28 145,754 -24,912 -1,057 -23,856 121,898
Aug-28 121,898 -24,912 -884 -24,029 97,870Sep-28 97,870 -24,912 -710 -24,203 73,667Oct-28 73,667 -24,912 -534 -24,378 49,288Nov-28 49,288 -24,912 -357 -24,555 24,733Dec-28 24,733 -24,912 -179 -24,733 0
41

42

43
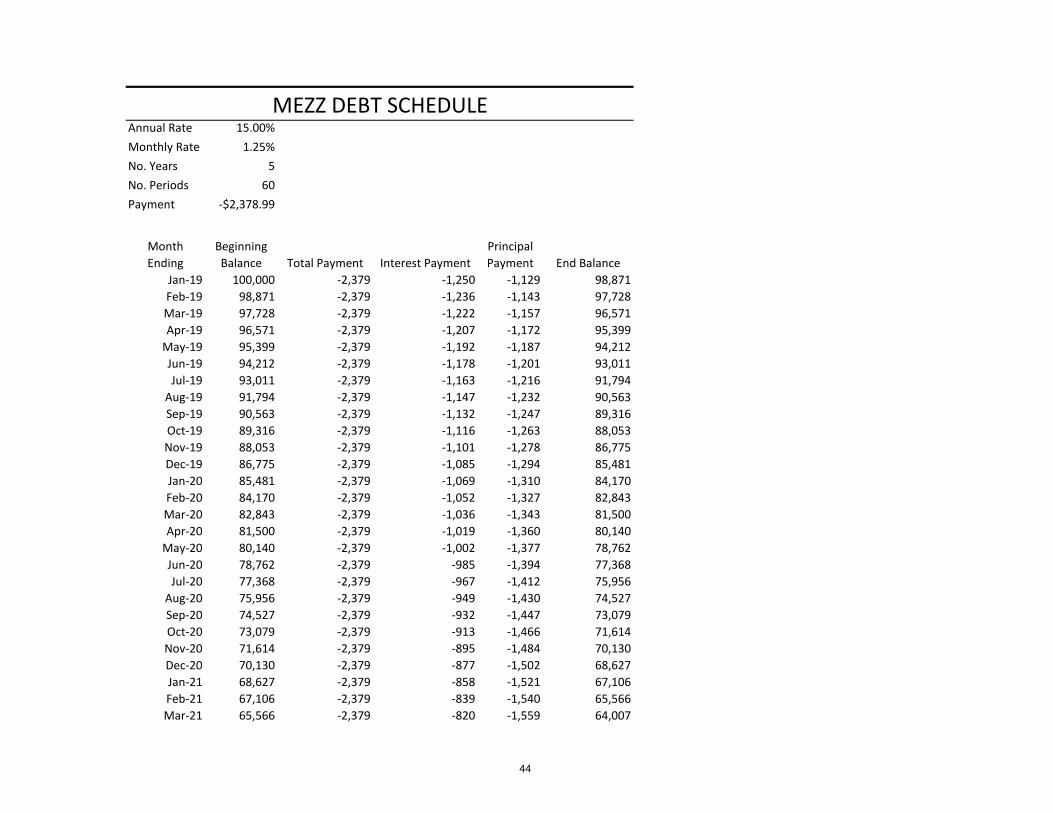
Annual Rate 15.00%Monthly Rate 1.25%No. Years 5No. Periods 60Payment -$2,378.99
Jan-19 100,000 -2,379 -1,250 -1,129 98,871Feb-19 98,871 -2,379 -1,236 -1,143 97,728Mar-19 97,728 -2,379 -1,222 -1,157 96,571Apr-19 96,571 -2,379 -1,207 -1,172 95,399
May-19 95,399 -2,379 -1,192 -1,187 94,212Jun-19 94,212 -2,379 -1,178 -1,201 93,011Jul-19 93,011 -2,379 -1,163 -1,216 91,794
Aug-19 91,794 -2,379 -1,147 -1,232 90,563Sep-19 90,563 -2,379 -1,132 -1,247 89,316Oct-19 89,316 -2,379 -1,116 -1,263 88,053Nov-19 88,053 -2,379 -1,101 -1,278 86,775Dec-19 86,775 -2,379 -1,085 -1,294 85,481Jan-20 85,481 -2,379 -1,069 -1,310 84,170Feb-20 84,170 -2,379 -1,052 -1,327 82,843Mar-20 82,843 -2,379 -1,036 -1,343 81,500Apr-20 81,500 -2,379 -1,019 -1,360 80,140
May-20 80,140 -2,379 -1,002 -1,377 78,762Jun-20 78,762 -2,379 -985 -1,394 77,368Jul-20 77,368 -2,379 -967 -1,412 75,956
Aug-20 75,956 -2,379 -949 -1,430 74,527Sep-20 74,527 -2,379 -932 -1,447 73,079Oct-20 73,079 -2,379 -913 -1,466 71,614Nov-20 71,614 -2,379 -895 -1,484 70,130Dec-20 70,130 -2,379 -877 -1,502 68,627Jan-21 68,627 -2,379 -858 -1,521 67,106Feb-21 67,106 -2,379 -839 -1,540 65,566Mar-21 65,566 -2,379 -820 -1,559 64,007
Month Ending
Beginning Balance
MEZZ DEBT SCHEDULE
End BalanceTotal Payment Interest PaymentPrincipal Payment
44
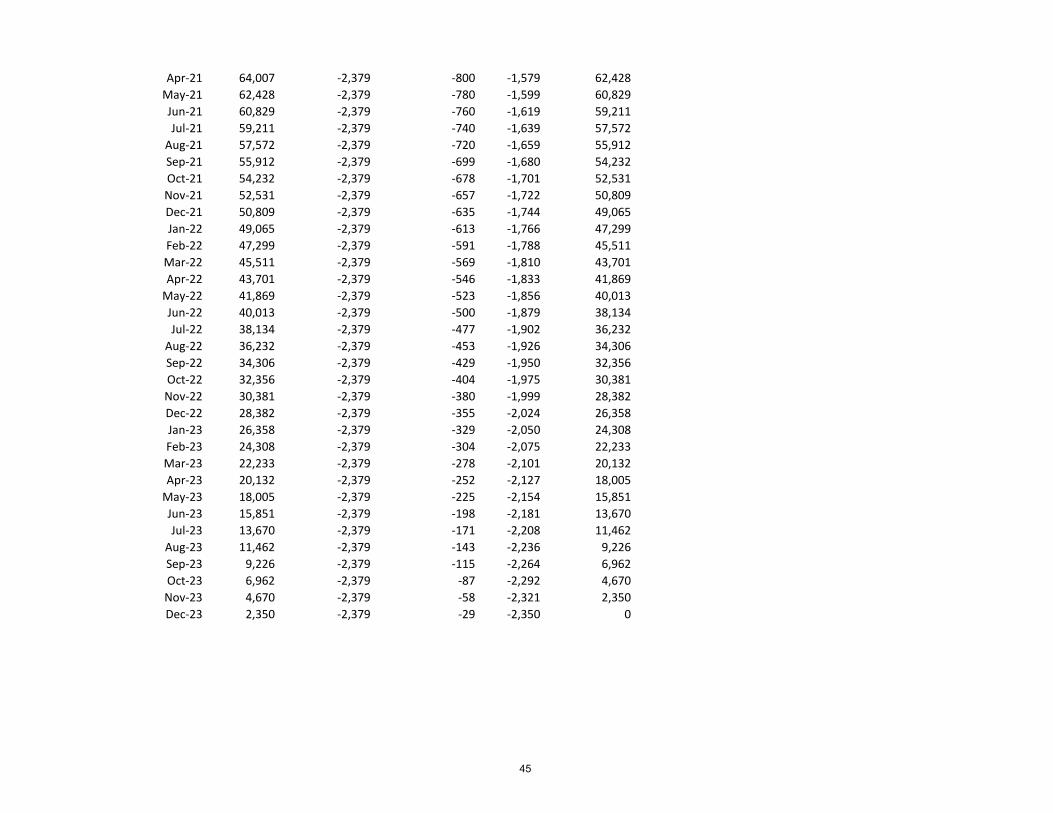
Apr-21 64,007 -2,379 -800 -1,579 62,428May-21 62,428 -2,379 -780 -1,599 60,829Jun-21 60,829 -2,379 -760 -1,619 59,211Jul-21 59,211 -2,379 -740 -1,639 57,572
Aug-21 57,572 -2,379 -720 -1,659 55,912Sep-21 55,912 -2,379 -699 -1,680 54,232Oct-21 54,232 -2,379 -678 -1,701 52,531Nov-21 52,531 -2,379 -657 -1,722 50,809Dec-21 50,809 -2,379 -635 -1,744 49,065Jan-22 49,065 -2,379 -613 -1,766 47,299Feb-22 47,299 -2,379 -591 -1,788 45,511Mar-22 45,511 -2,379 -569 -1,810 43,701Apr-22 43,701 -2,379 -546 -1,833 41,869
May-22 41,869 -2,379 -523 -1,856 40,013Jun-22 40,013 -2,379 -500 -1,879 38,134Jul-22 38,134 -2,379 -477 -1,902 36,232
Aug-22 36,232 -2,379 -453 -1,926 34,306Sep-22 34,306 -2,379 -429 -1,950 32,356Oct-22 32,356 -2,379 -404 -1,975 30,381Nov-22 30,381 -2,379 -380 -1,999 28,382Dec-22 28,382 -2,379 -355 -2,024 26,358Jan-23 26,358 -2,379 -329 -2,050 24,308Feb-23 24,308 -2,379 -304 -2,075 22,233Mar-23 22,233 -2,379 -278 -2,101 20,132Apr-23 20,132 -2,379 -252 -2,127 18,005
May-23 18,005 -2,379 -225 -2,154 15,851Jun-23 15,851 -2,379 -198 -2,181 13,670Jul-23 13,670 -2,379 -171 -2,208 11,462
Aug-23 11,462 -2,379 -143 -2,236 9,226Sep-23 9,226 -2,379 -115 -2,264 6,962Oct-23 6,962 -2,379 -87 -2,292 4,670Nov-23 4,670 -2,379 -58 -2,321 2,350Dec-23 2,350 -2,379 -29 -2,350 0
45

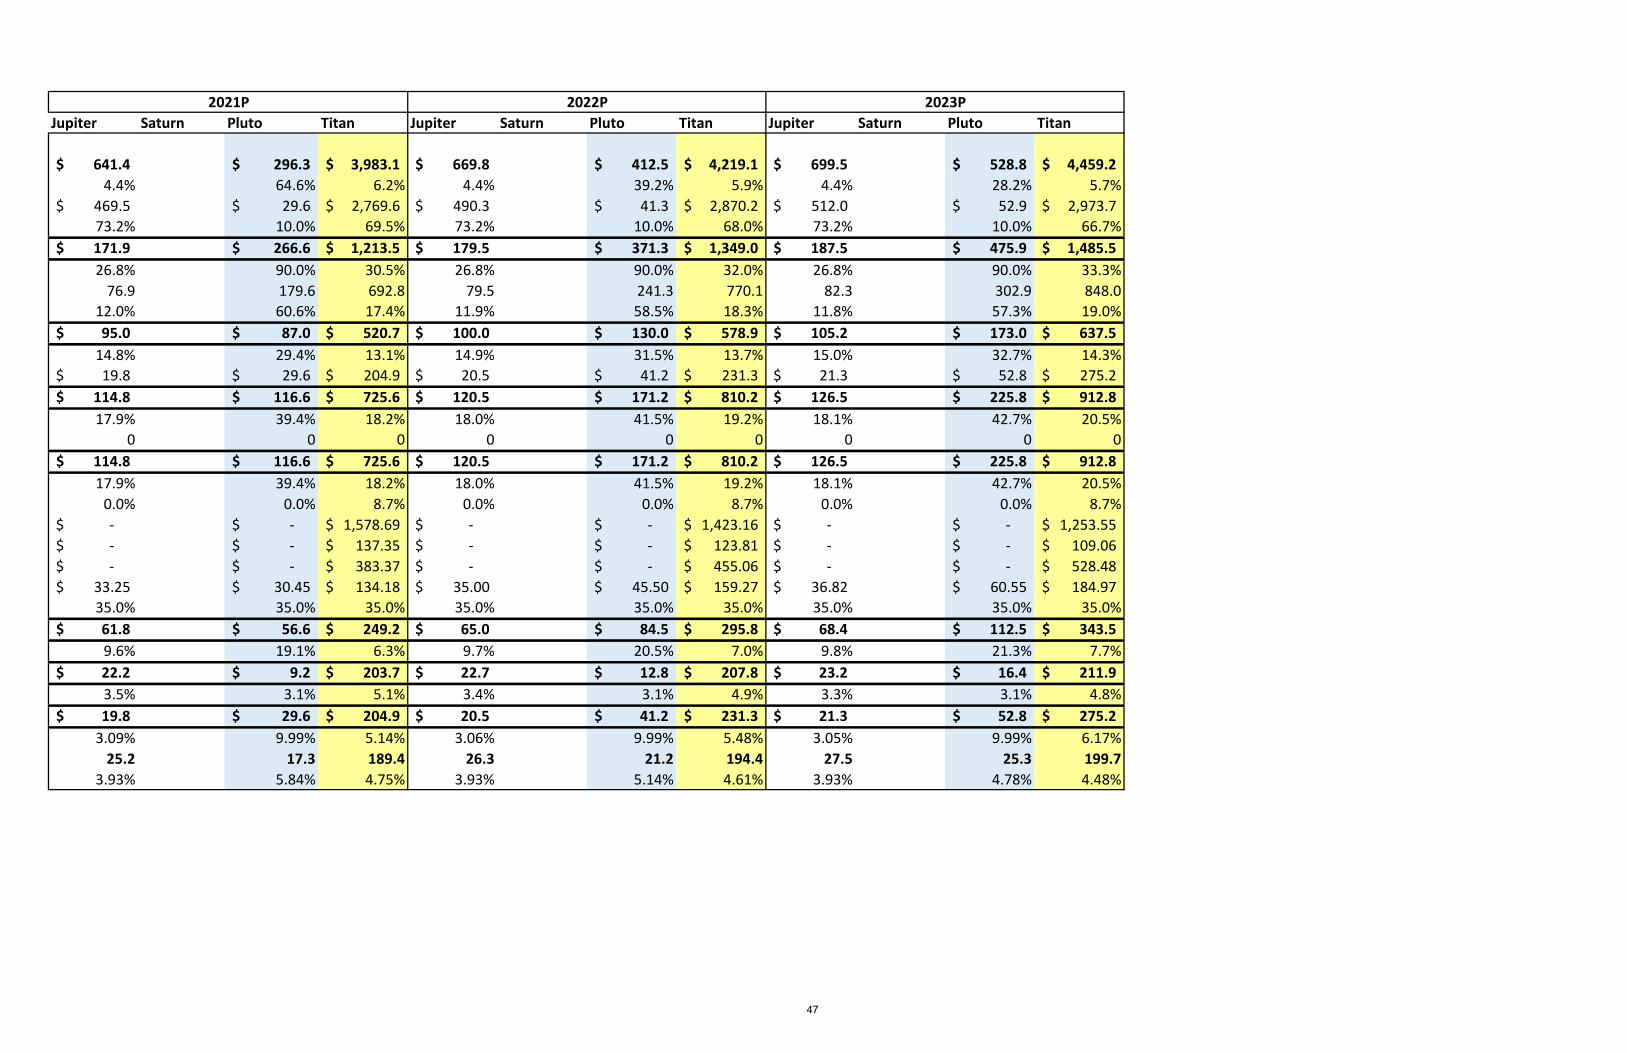
Titan Pro-Forma with Saturn Sale
Jupiter Saturn Pluto Titan Jupiter Saturn Pluto Titan Jupiter Saturn Pluto TitanRevenues & GainsTotal Sales 563.8$ 39.0$ -$ $3,389.8 588.5$ 75.0$ 3,534.1$ 614.3$ 180.0$ 3,751.1$ % of Growth 4.5% 17.7% 0.0% 3.0% 4.4% N/A 4.3% 4.4% 140.0% 6.1%COGS 412.7$ 28.0$ -$ 2,511.3$ 430.8$ 7.5$ 2,571.0$ 449.7$ 18.0$ 2,672.1$ % of Sales 73.2% 71.8% 0.0% 74.1% 73.2% 10.0% 72.7% 73.2% 10.0% 71.2%Gross Profit 151.1$ 11.0$ -$ 878.6$ 157.7$ 67.5$ 963.2$ 164.6$ 162.0$ 1,079.0$ % Gross Margin 26.8% 28.2% 0.0% 25.9% 26.8% 90.0% 27.3% 26.8% 90.0% 28.8%Total SG&A 69.4 4.0 10.0 416.8 71.8 57.5 483.0 74.3 118.0 615.8 % of Sales 12.3% 10.3% 0.0% 12.3% 12.2% 76.7% 13.7% 12.1% 65.6% 16.4%EBIT 81.7$ 7.0$ (10.0)$ 461.8$ 85.9$ 10.0$ 480.2$ 90.3$ 44.0$ 463.1$
14.5% 17.9% 0.0% 13.6% 14.6% 13.3% 13.6% 14.7% 24.4% 12.3%Depreciation & Amortization 18.3$ 0.0$ -$ 138.2$ 18.6$ 7.8$ 157.2$ 19.1$ 18.0$ 179.7$
100.0$ 7.0$ (10.0)$ 600.0$ 104.5$ 17.8$ 637.3$ 109.4$ 62.0$ 642.9$ % Margin 17.7% 17.8% 0.0% 17.7% 17.8% 23.7% 18.0% 17.8% 34.4% 17.1%
0 0 0 0 0 0 0 0 0 0Adjusted EBITDA 100.0$ 7.0$ (10.0)$ 600.0$ 104.5$ 17.8$ 637.3$ 109.4$ 62.0$ 642.9$ % Margin 17.7% 17.8% 0.0% 17.7% 17.8% 23.7% 18.0% 17.8% 34.4% 17.1%Interest Expense 0.0% 0.0% 0.0% 8.7% 0.0% 0.0% 8.7% 0.0% 0.0% 8.7%Debt -$ -$ -$ 2,111.99$ -$ -$ 1,852.07$ -$ -$ 1,721.30$ Interest Total -$ -$ -$ 179.04$ -$ -$ 161.13$ -$ -$ 149.75$ Taxable Income -$ -$ -$ 282.74$ -$ -$ 319.04$ -$ -$ 313.39$ Taxes 28.60$ 2.45$ (3.50)$ 98.96$ 30.07$ 3.50$ 111.66$ 31.61$ 15.40$ 109.69$
% of EBT 35.0% 35.0% 35.0% 35.0% 35.0% 35.0% 35.0% 35.0% 35.0% 35.0%Net Income 53.1$ 4.5$ (6.5)$ 183.8$ 55.8$ 6.5$ 207.4$ 58.7$ 28.6$ 203.7$ % Margin 9.4% 11.5% 0.0% 5.4% 9.5% 8.7% 5.9% 9.6% 15.9% 5.4%Total Capex 19.8$ 1.2$ 70.0$ 191.0$ 20.2$ 2.3$ 192.5$ 21.2$ 5.6$ 199.1$ % of Sales 3.5% 3.2% 0.0% 5.6% 3.4% 3.1% 5.4% 3.5% 3.1% 5.3%Total D&A 18.3$ 0.0$ -$ 138.2$ 18.6$ 7.8$ 157.2$ 19.1$ 18.0$ 179.7$ % of Sales 3.24% 0.10% 0.00% 4.08% 3.16% 10.40% 4.45% 3.11% 10.00% 4.79%NWC 22.0 4.9 0.0 169.5 22.0 11.0 179.9 24.1 13.2 184.2 % of Sales 3.90% 12.56% 0.00% 5.00% 3.74% 14.67% 5.09% 3.92% 7.33% 4.91%
% Operating Margin
EBITDA
Total Adjustments
2018E 2019P 2020P
46
Jupiter Saturn Pluto Titan Jupiter Saturn Pluto Titan Jupiter Saturn Pluto Titan
641.4$ 296.3$ 3,983.1$ 669.8$ 412.5$ 4,219.1$ 699.5$ 528.8$ 4,459.2$ 4.4% 64.6% 6.2% 4.4% 39.2% 5.9% 4.4% 28.2% 5.7%
469.5$ 29.6$ 2,769.6$ 490.3$ 41.3$ 2,870.2$ 512.0$ 52.9$ 2,973.7$ 73.2% 10.0% 69.5% 73.2% 10.0% 68.0% 73.2% 10.0% 66.7%171.9$ 266.6$ 1,213.5$ 179.5$ 371.3$ 1,349.0$ 187.5$ 475.9$ 1,485.5$ 26.8% 90.0% 30.5% 26.8% 90.0% 32.0% 26.8% 90.0% 33.3%
76.9 179.6 692.8 79.5 241.3 770.1 82.3 302.9 848.012.0% 60.6% 17.4% 11.9% 58.5% 18.3% 11.8% 57.3% 19.0%95.0$ 87.0$ 520.7$ 100.0$ 130.0$ 578.9$ 105.2$ 173.0$ 637.5$
14.8% 29.4% 13.1% 14.9% 31.5% 13.7% 15.0% 32.7% 14.3%19.8$ 29.6$ 204.9$ 20.5$ 41.2$ 231.3$ 21.3$ 52.8$ 275.2$
114.8$ 116.6$ 725.6$ 120.5$ 171.2$ 810.2$ 126.5$ 225.8$ 912.8$ 17.9% 39.4% 18.2% 18.0% 41.5% 19.2% 18.1% 42.7% 20.5%
0 0 0 0 0 0 0 0 0114.8$ 116.6$ 725.6$ 120.5$ 171.2$ 810.2$ 126.5$ 225.8$ 912.8$ 17.9% 39.4% 18.2% 18.0% 41.5% 19.2% 18.1% 42.7% 20.5%
0.0% 0.0% 8.7% 0.0% 0.0% 8.7% 0.0% 0.0% 8.7%-$ -$ 1,578.69$ -$ -$ 1,423.16$ -$ -$ 1,253.55$ -$ -$ 137.35$ -$ -$ 123.81$ -$ -$ 109.06$ -$ -$ 383.37$ -$ -$ 455.06$ -$ -$ 528.48$
33.25$ 30.45$ 134.18$ 35.00$ 45.50$ 159.27$ 36.82$ 60.55$ 184.97$ 35.0% 35.0% 35.0% 35.0% 35.0% 35.0% 35.0% 35.0% 35.0%61.8$ 56.6$ 249.2$ 65.0$ 84.5$ 295.8$ 68.4$ 112.5$ 343.5$ 9.6% 19.1% 6.3% 9.7% 20.5% 7.0% 9.8% 21.3% 7.7%22.2$ 9.2$ 203.7$ 22.7$ 12.8$ 207.8$ 23.2$ 16.4$ 211.9$ 3.5% 3.1% 5.1% 3.4% 3.1% 4.9% 3.3% 3.1% 4.8%19.8$ 29.6$ 204.9$ 20.5$ 41.2$ 231.3$ 21.3$ 52.8$ 275.2$
3.09% 9.99% 5.14% 3.06% 9.99% 5.48% 3.05% 9.99% 6.17%25.2 17.3 189.4 26.3 21.2 194.4 27.5 25.3 199.7
3.93% 5.84% 4.75% 3.93% 5.14% 4.61% 3.93% 4.78% 4.48%
2022P 2023P2021P
47

Discounted Cash Flow Analysis for Titan with Sale of SaturnFigures in millions, except per share
Historical year ending December 31, Projected year ending December 31,2016 2017 2018 2019 2020 2021 2022 2023
x Sales $3,389.8 $3,534.1 $3,751.1 $3,983.1 $4,219.1 $4,459.2Cost of goods sold 2,511.3 2,571.0 2,672.1 2,769.6 2,870.2 2,973.7Gross Profit 0.0 0.0 878.6 963.2 1,079.0 1,213.5 1,349.0 1,485.5
SG&A 416.8 483.0 615.8 692.8 770.1 848.0EBITDA 0.0 0.0 600.0 637.3 642.9 725.6 810.2 912.8
EBITDA Margin #DIV/0! #DIV/0! 17.7% 18.0% 17.1% 18.2% 19.2% 20.5%
Less: DepreciationLess: AmortizationEBIT 0.0 0.0 461.8 480.2 463.1 520.7 578.9 637.5Less: Taxes @ 35.0% 0.0 0.0 (161.6) (168.1) (162.1) (182.2) (202.6) (223.1)Tax-effected EBIT 0.0 0.0 300.2 312.1 301.0 338.5 376.3 414.4
Plus: Depreciation and amortization 0.0 138.2 157.2 179.7 204.9 231.3 275.2Less: Capital expenditures (191.0) (192.5) (199.1) (203.7) (207.8) (211.9)Less: Additions to intangibles 0.0 0.0 0.0 0.0 0.0(Increase)/decrease in working capital (15.0) (10.4) (4.3) (5.2) (5.0) (5.3)Unlevered Free Cash Flow $0.0 $232.3 $266.4 $277.4 $334.5 $394.8 $472.4
Levered Free Cash Flow $94.1 $109.2 $97.6 $129.6 $163.4 $197.2
Operating Assumptionsx Sales growth 4.3% 6.1% 6.2% 5.9% 5.7%
Cost of goods sold (as a % sales) 74.1% 72.7% 71.2% 69.5% 68.0% 66.7%SG&A (as a % sales) 12.3% 13.7% 16.4% 17.4% 18.3% 19.0%
Capital Expenditure AssumptionsCapEx (as a % sales) NA 0.0% 5.6% 5.4% 5.3% 5.1% 4.9% 4.8%Depreciation (as a % of CapEx)
Additions to Intangibles ($ amount) NA $0.0 $0.0 $0.0 $0.0 $0.0 $0.0 $0.0Amortization ($ amount) NA
(231.3) (275.2)(138.2) (157.2) (179.7) (204.9)
48
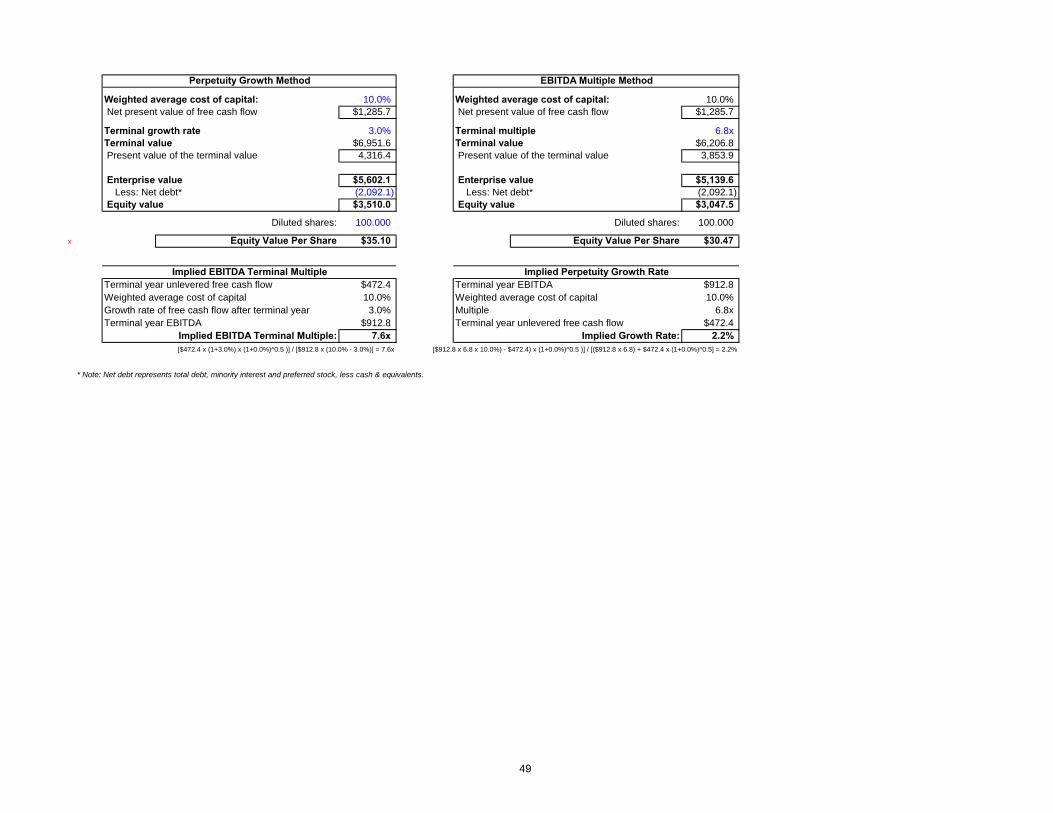
Perpetuity Growth Method EBITDA Multiple Method
Weighted average cost of capital: 10.0% Weighted average cost of capital: 10.0% Net present value of free cash flow $1,285.7 Net present value of free cash flow $1,285.7
Terminal growth rate 3.0% Terminal multiple 6.8xTerminal value $6,951.6 Terminal value $6,206.8 Present value of the terminal value 4,316.4 Present value of the terminal value 3,853.9
Enterprise value $5,602.1 Enterprise value $5,139.6 Less: Net debt* (2,092.1) Less: Net debt* (2,092.1) Equity value $3,510.0 Equity value $3,047.5
Diluted shares: 100.000 Diluted shares: 100.000
x Equity Value Per Share $35.10 Equity Value Per Share $30.47
Implied EBITDA Terminal Multiple Implied Perpetuity Growth RateTerminal year unlevered free cash flow $472.4 Terminal year EBITDA $912.8Weighted average cost of capital 10.0% Weighted average cost of capital 10.0%Growth rate of free cash flow after terminal year 3.0% Multiple 6.8xTerminal year EBITDA $912.8 Terminal year unlevered free cash flow $472.4
Implied EBITDA Terminal Multiple: 7.6x Implied Growth Rate: 2.2%[$472.4 x (1+3.0%) x (1+0.0%)^0.5 )] / [$912.8 x (10.0% - 3.0%)] = 7.6x [$912.8 x 6.8 x 10.0%) - $472.4) x (1+0.0%)^0.5 )] / [($912.8 x 6.8) + $472.4 x (1+0.0%)^0.5] = 2.2%
* Note: Net debt represents total debt, minority interest and preferred stock, less cash & equivalents.
49
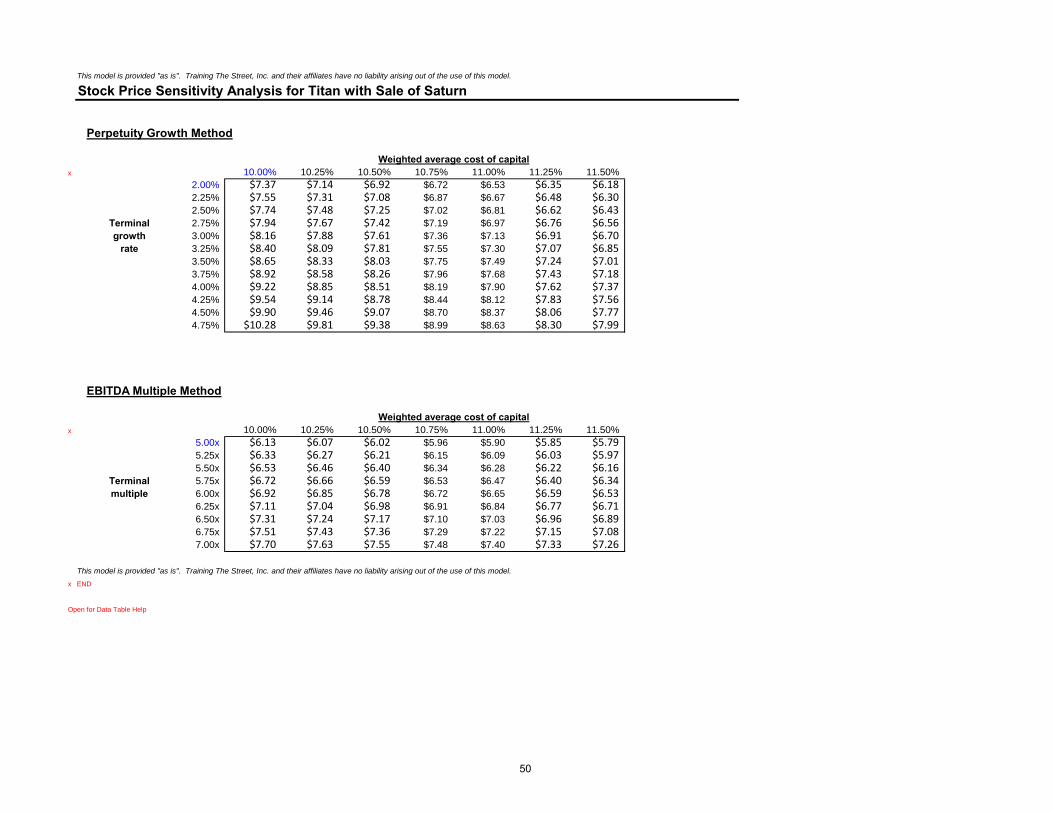
This model is provided "as is". Training The Street, Inc. and their affiliates have no liability arising out of the use of this model.
Stock Price Sensitivity Analysis for Titan with Sale of Saturn
Perpetuity Growth Method
Weighted average cost of capitalx 10.00% 10.25% 10.50% 10.75% 11.00% 11.25% 11.50%
2.00% $7.37 $7.14 $6.92 $6.72 $6.53 $6.35 $6.182.25% $7.55 $7.31 $7.08 $6.87 $6.67 $6.48 $6.302.50% $7.74 $7.48 $7.25 $7.02 $6.81 $6.62 $6.43
Terminal 2.75% $7.94 $7.67 $7.42 $7.19 $6.97 $6.76 $6.56growth 3.00% $8.16 $7.88 $7.61 $7.36 $7.13 $6.91 $6.70
rate 3.25% $8.40 $8.09 $7.81 $7.55 $7.30 $7.07 $6.853.50% $8.65 $8.33 $8.03 $7.75 $7.49 $7.24 $7.013.75% $8.92 $8.58 $8.26 $7.96 $7.68 $7.43 $7.184.00% $9.22 $8.85 $8.51 $8.19 $7.90 $7.62 $7.374.25% $9.54 $9.14 $8.78 $8.44 $8.12 $7.83 $7.564.50% $9.90 $9.46 $9.07 $8.70 $8.37 $8.06 $7.774.75% $10.28 $9.81 $9.38 $8.99 $8.63 $8.30 $7.99
EBITDA Multiple Method
Weighted average cost of capitalx 10.00% 10.25% 10.50% 10.75% 11.00% 11.25% 11.50%
5.00x $6.13 $6.07 $6.02 $5.96 $5.90 $5.85 $5.795.25x $6.33 $6.27 $6.21 $6.15 $6.09 $6.03 $5.975.50x $6.53 $6.46 $6.40 $6.34 $6.28 $6.22 $6.16
Terminal 5.75x $6.72 $6.66 $6.59 $6.53 $6.47 $6.40 $6.34multiple 6.00x $6.92 $6.85 $6.78 $6.72 $6.65 $6.59 $6.53
6.25x $7.11 $7.04 $6.98 $6.91 $6.84 $6.77 $6.716.50x $7.31 $7.24 $7.17 $7.10 $7.03 $6.96 $6.896.75x $7.51 $7.43 $7.36 $7.29 $7.22 $7.15 $7.087.00x $7.70 $7.63 $7.55 $7.48 $7.40 $7.33 $7.26
This model is provided "as is". Training The Street, Inc. and their affiliates have no liability arising out of the use of this model.x END
Open for Data Table Help
50
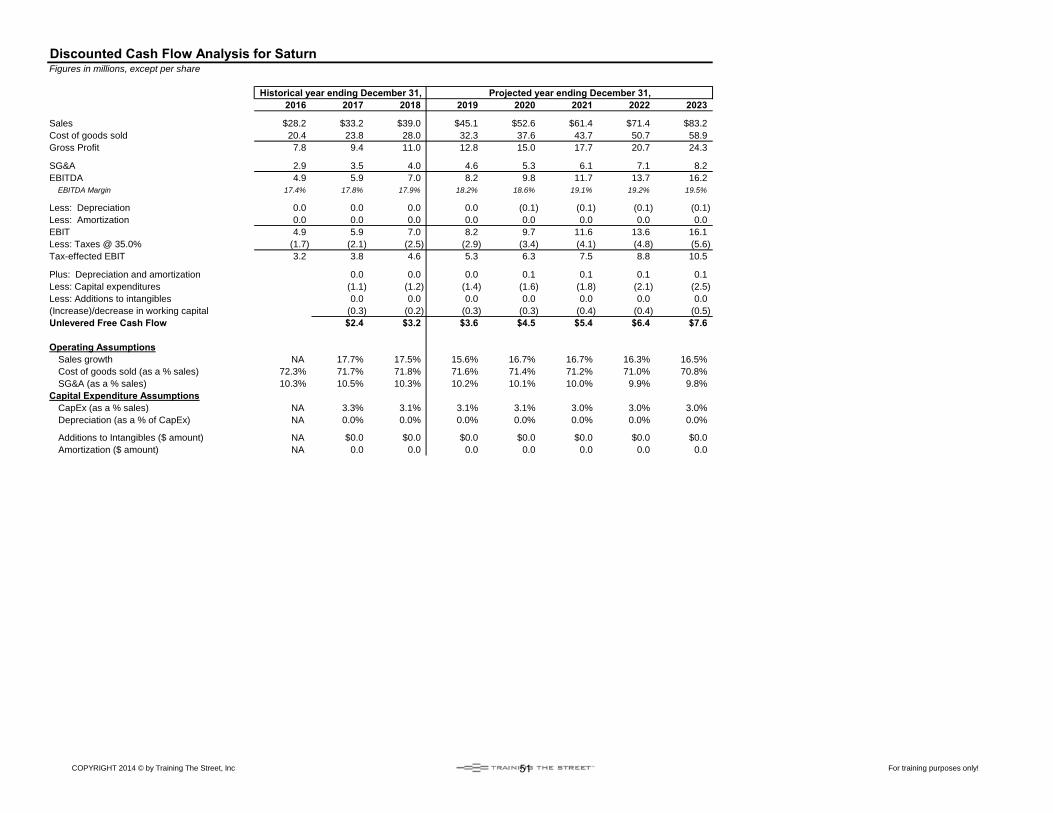
COPYRIGHT 2014 © by Training The Street, Inc For training purposes only!
Discounted Cash Flow Analysis for SaturnFigures in millions, except per share
Historical year ending December 31, Projected year ending December 31,2016 2017 2018 2019 2020 2021 2022 2023
Sales $28.2 $33.2 $39.0 $45.1 $52.6 $61.4 $71.4 $83.2Cost of goods sold 20.4 23.8 28.0 32.3 37.6 43.7 50.7 58.9Gross Profit 7.8 9.4 11.0 12.8 15.0 17.7 20.7 24.3
SG&A 2.9 3.5 4.0 4.6 5.3 6.1 7.1 8.2EBITDA 4.9 5.9 7.0 8.2 9.8 11.7 13.7 16.2
EBITDA Margin 17.4% 17.8% 17.9% 18.2% 18.6% 19.1% 19.2% 19.5%
Less: Depreciation 0.0 0.0 0.0 0.0 (0.1) (0.1) (0.1) (0.1)Less: Amortization 0.0 0.0 0.0 0.0 0.0 0.0 0.0 0.0EBIT 4.9 5.9 7.0 8.2 9.7 11.6 13.6 16.1Less: Taxes @ 35.0% (1.7) (2.1) (2.5) (2.9) (3.4) (4.1) (4.8) (5.6)Tax-effected EBIT 3.2 3.8 4.6 5.3 6.3 7.5 8.8 10.5
Plus: Depreciation and amortization 0.0 0.0 0.0 0.1 0.1 0.1 0.1Less: Capital expenditures (1.1) (1.2) (1.4) (1.6) (1.8) (2.1) (2.5)Less: Additions to intangibles 0.0 0.0 0.0 0.0 0.0 0.0 0.0(Increase)/decrease in working capital (0.3) (0.2) (0.3) (0.3) (0.4) (0.4) (0.5)Unlevered Free Cash Flow $2.4 $3.2 $3.6 $4.5 $5.4 $6.4 $7.6
Operating AssumptionsSales growth NA 17.7% 17.5% 15.6% 16.7% 16.7% 16.3% 16.5%Cost of goods sold (as a % sales) 72.3% 71.7% 71.8% 71.6% 71.4% 71.2% 71.0% 70.8%SG&A (as a % sales) 10.3% 10.5% 10.3% 10.2% 10.1% 10.0% 9.9% 9.8%
Capital Expenditure AssumptionsCapEx (as a % sales) NA 3.3% 3.1% 3.1% 3.1% 3.0% 3.0% 3.0%Depreciation (as a % of CapEx) NA 0.0% 0.0% 0.0% 0.0% 0.0% 0.0% 0.0%
Additions to Intangibles ($ amount) NA $0.0 $0.0 $0.0 $0.0 $0.0 $0.0 $0.0Amortization ($ amount) NA 0.0 0.0 0.0 0.0 0.0 0.0 0.0
51
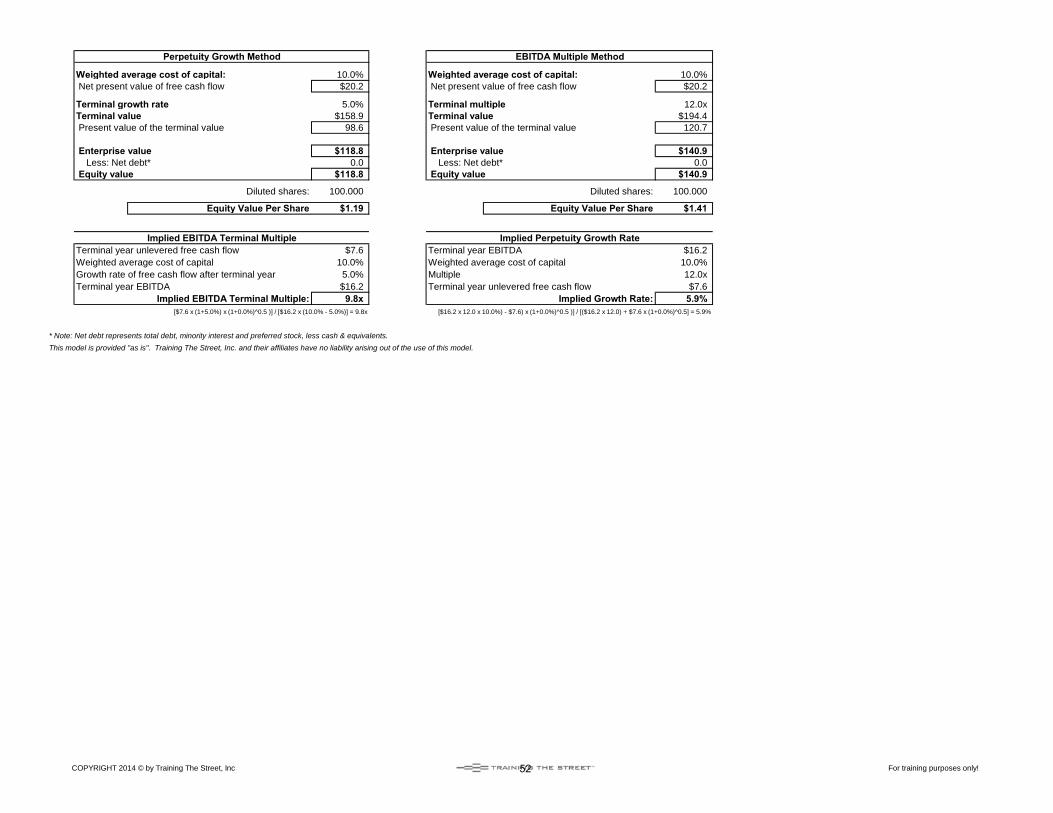
COPYRIGHT 2014 © by Training The Street, Inc For training purposes only!
Perpetuity Growth Method EBITDA Multiple Method
Weighted average cost of capital: 10.0% Weighted average cost of capital: 10.0% Net present value of free cash flow $20.2 Net present value of free cash flow $20.2
Terminal growth rate 5.0% Terminal multiple 12.0xTerminal value $158.9 Terminal value $194.4 Present value of the terminal value 98.6 Present value of the terminal value 120.7
Enterprise value $118.8 Enterprise value $140.9 Less: Net debt* 0.0 Less: Net debt* 0.0 Equity value $118.8 Equity value $140.9
Diluted shares: 100.000 Diluted shares: 100.000
Equity Value Per Share $1.19 Equity Value Per Share $1.41
Implied EBITDA Terminal Multiple Implied Perpetuity Growth RateTerminal year unlevered free cash flow $7.6 Terminal year EBITDA $16.2Weighted average cost of capital 10.0% Weighted average cost of capital 10.0%Growth rate of free cash flow after terminal year 5.0% Multiple 12.0xTerminal year EBITDA $16.2 Terminal year unlevered free cash flow $7.6
Implied EBITDA Terminal Multiple: 9.8x Implied Growth Rate: 5.9%[$7.6 x (1+5.0%) x (1+0.0%)^0.5 )] / [$16.2 x (10.0% - 5.0%)] = 9.8x [$16.2 x 12.0 x 10.0%) - $7.6) x (1+0.0%)^0.5 )] / [($16.2 x 12.0) + $7.6 x (1+0.0%)^0.5] = 5.9%
* Note: Net debt represents total debt, minority interest and preferred stock, less cash & equivalents.This model is provided "as is". Training The Street, Inc. and their affiliates have no liability arising out of the use of this model.
52

COPYRIGHT 2014 © by Training The Street, Inc For training purposes only!
Stock Price Sensitivity Analysis for Saturn
Perpetuity Growth Method
Weighted average cost of capital10.00% 10.25% 10.50% 10.75% 11.00% 11.25% 11.50%
2.00% $0.80 $0.77 $0.75 $0.73 $0.71 $0.68 $0.662.25% $0.82 $0.79 $0.77 $0.74 $0.72 $0.70 $0.682.50% $0.84 $0.81 $0.79 $0.76 $0.74 $0.71 $0.69
Terminal 2.75% $0.87 $0.84 $0.81 $0.78 $0.76 $0.73 $0.71growth 3.00% $0.89 $0.86 $0.83 $0.80 $0.77 $0.75 $0.73
rate 3.25% $0.92 $0.89 $0.85 $0.82 $0.79 $0.77 $0.743.50% $0.95 $0.91 $0.88 $0.85 $0.82 $0.79 $0.763.75% $0.98 $0.94 $0.90 $0.87 $0.84 $0.81 $0.784.00% $1.02 $0.97 $0.93 $0.90 $0.86 $0.83 $0.804.25% $1.05 $1.01 $0.97 $0.93 $0.89 $0.86 $0.824.50% $1.09 $1.04 $1.00 $0.96 $0.92 $0.88 $0.854.75% $1.14 $1.09 $1.04 $0.99 $0.95 $0.91 $0.87
EBITDA Multiple Method
Weighted average cost of capital10.00% 10.25% 10.50% 10.75% 11.00% 11.25% 11.50%
5.00x $0.71 $0.70 $0.69 $0.68 $0.68 $0.67 $0.665.25x $0.73 $0.72 $0.72 $0.71 $0.70 $0.69 $0.695.50x $0.76 $0.75 $0.74 $0.73 $0.73 $0.72 $0.71
Terminal 5.75x $0.78 $0.77 $0.76 $0.76 $0.75 $0.74 $0.73multiple 6.00x $0.81 $0.80 $0.79 $0.78 $0.77 $0.77 $0.76
6.25x $0.83 $0.82 $0.81 $0.81 $0.80 $0.79 $0.786.50x $0.86 $0.85 $0.84 $0.83 $0.82 $0.81 $0.806.75x $0.88 $0.87 $0.86 $0.85 $0.85 $0.84 $0.837.00x $0.91 $0.90 $0.89 $0.88 $0.87 $0.86 $0.85
This model is provided "as is". Training The Street, Inc. and their affiliates have no liability arising out of the use of this model.
53
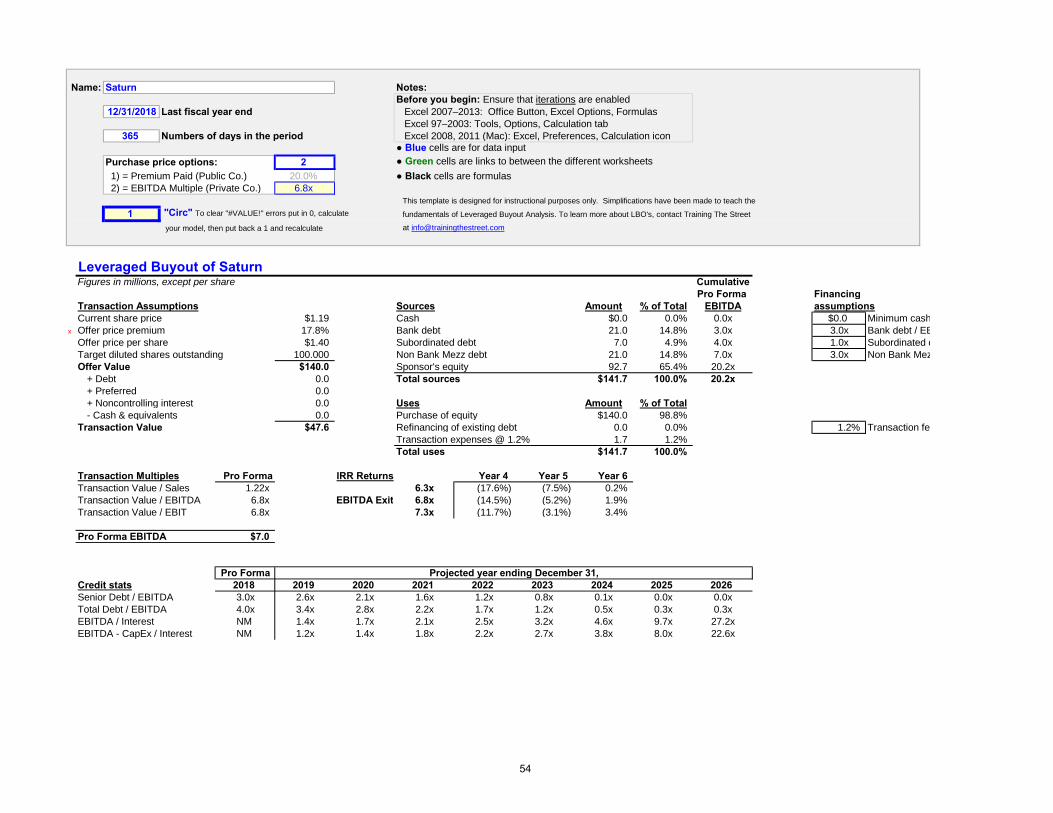
Name: Saturn Notes:Before you begin: Ensure that iterations are enabled
12/31/2018 Last fiscal year end Excel 2007–2013: Office Button, Excel Options, Formulas Excel 97–2003: Tools, Options, Calculation tab
365 Numbers of days in the period Excel 2008, 2011 (Mac): Excel, Preferences, Calculation icon● Blue cells are for data input
Purchase price options: 2 ● Green cells are links to between the different worksheets 1) = Premium Paid (Public Co.) 20.0% ● Black cells are formulas 2) = EBITDA Multiple (Private Co.) 6.8x
This template is designed for instructional purposes only. Simplifications have been made to teach the
1 "Circ" To clear "#VALUE!" errors put in 0, calculate fundamentals of Leveraged Buyout Analysis. To learn more about LBO's, contact Training The Street
your model, then put back a 1 and recalculate at [email protected]
Leveraged Buyout of SaturnFigures in millions, except per share Cumulative
Pro Forma Financing Transaction Assumptions Sources Amount % of Total EBITDA assumptionsCurrent share price $1.19 Cash $0.0 0.0% 0.0x $0.0 Minimum cash
x Offer price premium 17.8% Bank debt 21.0 14.8% 3.0x 3.0x Bank debt / EBOffer price per share $1.40 Subordinated debt 7.0 4.9% 4.0x 1.0x Subordinated d Target diluted shares outstanding 100.000 Non Bank Mezz debt 21.0 14.8% 7.0x 3.0x Non Bank Mez Offer Value $140.0 Sponsor's equity 92.7 65.4% 20.2x
+ Debt 0.0 Total sources $141.7 100.0% 20.2x+ Preferred 0.0+ Noncontrolling interest 0.0 Uses Amount % of Total- Cash & equivalents 0.0 Purchase of equity $140.0 98.8%
Transaction Value $47.6 Refinancing of existing debt 0.0 0.0% 1.2% Transaction feeTransaction expenses @ 1.2% 1.7 1.2%Total uses $141.7 100.0%
Transaction Multiples Pro Forma IRR Returns Year 4 Year 5 Year 6Transaction Value / Sales 1.22x 6.3x (17.6%) (7.5%) 0.2%Transaction Value / EBITDA 6.8x EBITDA Exit 6.8x (14.5%) (5.2%) 1.9%Transaction Value / EBIT 6.8x 7.3x (11.7%) (3.1%) 3.4%
Pro Forma EBITDA $7.0
Pro Forma Projected year ending December 31,Credit stats 2018 2019 2020 2021 2022 2023 2024 2025 2026Senior Debt / EBITDA 3.0x 2.6x 2.1x 1.6x 1.2x 0.8x 0.1x 0.0x 0.0xTotal Debt / EBITDA 4.0x 3.4x 2.8x 2.2x 1.7x 1.2x 0.5x 0.3x 0.3xEBITDA / Interest NM 1.4x 1.7x 2.1x 2.5x 3.2x 4.6x 9.7x 27.2xEBITDA - CapEx / Interest NM 1.2x 1.4x 1.8x 2.2x 2.7x 3.8x 8.0x 22.6x
54
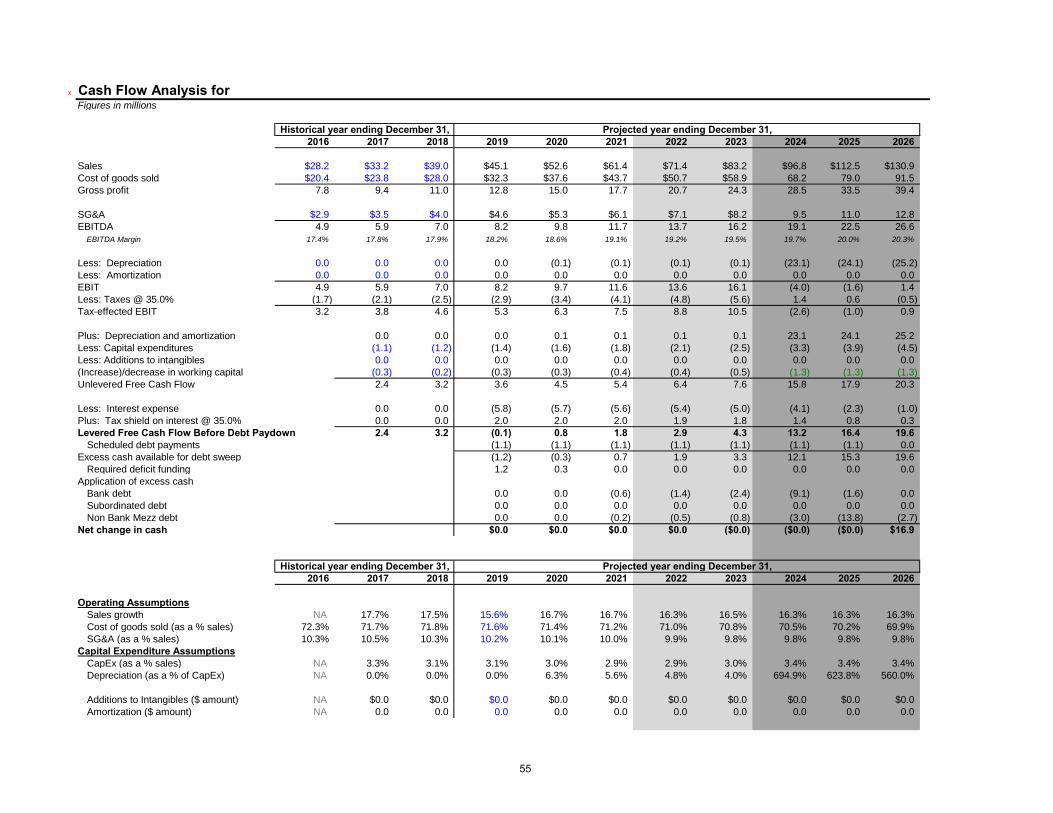
x Cash Flow Analysis for Figures in millions
Historical year ending December 31, Projected year ending December 31,2016 2017 2018 2019 2020 2021 2022 2023 2024 2025 2026
Sales $28.2 $33.2 $39.0 $45.1 $52.6 $61.4 $71.4 $83.2 $96.8 $112.5 $130.9Cost of goods sold $20.4 $23.8 $28.0 $32.3 $37.6 $43.7 $50.7 $58.9 68.2 79.0 91.5Gross profit 7.8 9.4 11.0 12.8 15.0 17.7 20.7 24.3 28.5 33.5 39.4
SG&A $2.9 $3.5 $4.0 $4.6 $5.3 $6.1 $7.1 $8.2 9.5 11.0 12.8EBITDA 4.9 5.9 7.0 8.2 9.8 11.7 13.7 16.2 19.1 22.5 26.6
EBITDA Margin 17.4% 17.8% 17.9% 18.2% 18.6% 19.1% 19.2% 19.5% 19.7% 20.0% 20.3%
Less: Depreciation 0.0 0.0 0.0 0.0 (0.1) (0.1) (0.1) (0.1) (23.1) (24.1) (25.2)Less: Amortization 0.0 0.0 0.0 0.0 0.0 0.0 0.0 0.0 0.0 0.0 0.0EBIT 4.9 5.9 7.0 8.2 9.7 11.6 13.6 16.1 (4.0) (1.6) 1.4Less: Taxes @ 35.0% (1.7) (2.1) (2.5) (2.9) (3.4) (4.1) (4.8) (5.6) 1.4 0.6 (0.5)Tax-effected EBIT 3.2 3.8 4.6 5.3 6.3 7.5 8.8 10.5 (2.6) (1.0) 0.9
Plus: Depreciation and amortization 0.0 0.0 0.0 0.1 0.1 0.1 0.1 23.1 24.1 25.2Less: Capital expenditures (1.1) (1.2) (1.4) (1.6) (1.8) (2.1) (2.5) (3.3) (3.9) (4.5)Less: Additions to intangibles 0.0 0.0 0.0 0.0 0.0 0.0 0.0 0.0 0.0 0.0(Increase)/decrease in working capital (0.3) (0.2) (0.3) (0.3) (0.4) (0.4) (0.5) (1.3) (1.3) (1.3)Unlevered Free Cash Flow 2.4 3.2 3.6 4.5 5.4 6.4 7.6 15.8 17.9 20.3
Less: Interest expense 0.0 0.0 (5.8) (5.7) (5.6) (5.4) (5.0) (4.1) (2.3) (1.0)Plus: Tax shield on interest @ 35.0% 0.0 0.0 2.0 2.0 2.0 1.9 1.8 1.4 0.8 0.3Levered Free Cash Flow Before Debt Paydown 2.4 3.2 (0.1) 0.8 1.8 2.9 4.3 13.2 16.4 19.6
Scheduled debt payments (1.1) (1.1) (1.1) (1.1) (1.1) (1.1) (1.1) 0.0Excess cash available for debt sweep (1.2) (0.3) 0.7 1.9 3.3 12.1 15.3 19.6
Required deficit funding 1.2 0.3 0.0 0.0 0.0 0.0 0.0 0.0Application of excess cash
Bank debt 0.0 0.0 (0.6) (1.4) (2.4) (9.1) (1.6) 0.0Subordinated debt 0.0 0.0 0.0 0.0 0.0 0.0 0.0 0.0Non Bank Mezz debt 0.0 0.0 (0.2) (0.5) (0.8) (3.0) (13.8) (2.7)
Net change in cash $0.0 $0.0 $0.0 $0.0 ($0.0) ($0.0) ($0.0) $16.9
Historical year ending December 31, Projected year ending December 31,2016 2017 2018 2019 2020 2021 2022 2023 2024 2025 2026
Operating AssumptionsSales growth NA 17.7% 17.5% 15.6% 16.7% 16.7% 16.3% 16.5% 16.3% 16.3% 16.3%Cost of goods sold (as a % sales) 72.3% 71.7% 71.8% 71.6% 71.4% 71.2% 71.0% 70.8% 70.5% 70.2% 69.9%SG&A (as a % sales) 10.3% 10.5% 10.3% 10.2% 10.1% 10.0% 9.9% 9.8% 9.8% 9.8% 9.8%
Capital Expenditure AssumptionsCapEx (as a % sales) NA 3.3% 3.1% 3.1% 3.0% 2.9% 2.9% 3.0% 3.4% 3.4% 3.4%Depreciation (as a % of CapEx) NA 0.0% 0.0% 0.0% 6.3% 5.6% 4.8% 4.0% 694.9% 623.8% 560.0%
Additions to Intangibles ($ amount) NA $0.0 $0.0 $0.0 $0.0 $0.0 $0.0 $0.0 $0.0 $0.0 $0.0Amortization ($ amount) NA 0.0 0.0 0.0 0.0 0.0 0.0 0.0 0.0 0.0 0.0
55
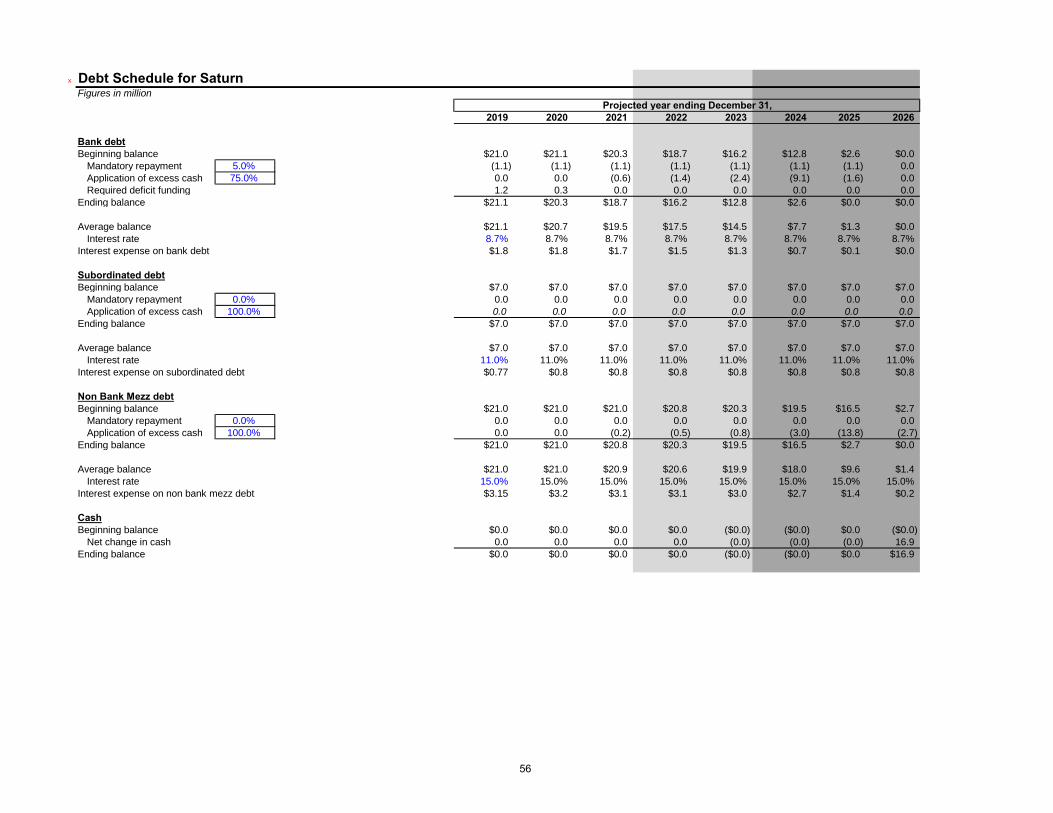
x Debt Schedule for SaturnFigures in million
Projected year ending December 31,2019 2020 2021 2022 2023 2024 2025 2026
Bank debtBeginning balance $21.0 $21.1 $20.3 $18.7 $16.2 $12.8 $2.6 $0.0
Mandatory repayment 5.0% (1.1) (1.1) (1.1) (1.1) (1.1) (1.1) (1.1) 0.0Application of excess cash 75.0% 0.0 0.0 (0.6) (1.4) (2.4) (9.1) (1.6) 0.0Required deficit funding 1.2 0.3 0.0 0.0 0.0 0.0 0.0 0.0
Ending balance $21.1 $20.3 $18.7 $16.2 $12.8 $2.6 $0.0 $0.0
Average balance $21.1 $20.7 $19.5 $17.5 $14.5 $7.7 $1.3 $0.0Interest rate 8.7% 8.7% 8.7% 8.7% 8.7% 8.7% 8.7% 8.7%
Interest expense on bank debt $1.8 $1.8 $1.7 $1.5 $1.3 $0.7 $0.1 $0.0
Subordinated debtBeginning balance $7.0 $7.0 $7.0 $7.0 $7.0 $7.0 $7.0 $7.0
Mandatory repayment 0.0% 0.0 0.0 0.0 0.0 0.0 0.0 0.0 0.0Application of excess cash 100.0% 0.0 0.0 0.0 0.0 0.0 0.0 0.0 0.0
Ending balance $7.0 $7.0 $7.0 $7.0 $7.0 $7.0 $7.0 $7.0
Average balance $7.0 $7.0 $7.0 $7.0 $7.0 $7.0 $7.0 $7.0Interest rate 11.0% 11.0% 11.0% 11.0% 11.0% 11.0% 11.0% 11.0%
Interest expense on subordinated debt $0.77 $0.8 $0.8 $0.8 $0.8 $0.8 $0.8 $0.8
Non Bank Mezz debtBeginning balance $21.0 $21.0 $21.0 $20.8 $20.3 $19.5 $16.5 $2.7
Mandatory repayment 0.0% 0.0 0.0 0.0 0.0 0.0 0.0 0.0 0.0Application of excess cash 100.0% 0.0 0.0 (0.2) (0.5) (0.8) (3.0) (13.8) (2.7)
Ending balance $21.0 $21.0 $20.8 $20.3 $19.5 $16.5 $2.7 $0.0
Average balance $21.0 $21.0 $20.9 $20.6 $19.9 $18.0 $9.6 $1.4Interest rate 15.0% 15.0% 15.0% 15.0% 15.0% 15.0% 15.0% 15.0%
Interest expense on non bank mezz debt $3.15 $3.2 $3.1 $3.1 $3.0 $2.7 $1.4 $0.2
CashBeginning balance $0.0 $0.0 $0.0 $0.0 ($0.0) ($0.0) $0.0 ($0.0)
Net change in cash 0.0 0.0 0.0 0.0 (0.0) (0.0) (0.0) 16.9Ending balance $0.0 $0.0 $0.0 $0.0 ($0.0) ($0.0) $0.0 $16.9
56