ACER Balancing Monitoring Report
48
Page 1 of 48 ACER Balancing Monitoring Report 2019/20 Development and Analysis 20 July 2021
Transcript of ACER Balancing Monitoring Report

Page 1 of 48
ACER Balancing Monitoring Report 2019/20 Development and Analysis 20 July 2021

A C E R B A L A N CI N G M O NI T O RI N G R E P O R T 2 0 1 9 / 20
Page 2 of 48
ACER Balancing Monitoring Report 2019/20 Development and Analysis 20 July 2021
Find us at:
ACER E [email protected] Trg republike 3 1000 Ljubljana Slovenia w ww.acer.europa.eu
© European Union Agency for the Cooperation of Energy Regulators Reproduction is authorised provided the source is acknowledged.

A C E R B A L A N CI N G M O NI T O RI N G R E P O R T 2 0 1 9 / 20
Page 3 of 48
Table of Contents Overview ............................................................................................................................. 4
Introduction ..................................................................................................................... 4 Focussing on the Balancing Analytical Framework ................................................................ 4 Scope ............................................................................................................................. 5
1. Introduction ................................................................................................................. 8 Reading guide ................................................................................................................. 8
2. History and previous reports .......................................................................................... 9 2.1. First Implementation Report ...................................................................................... 9 2.2. Second Implementation Report ................................................................................. 9 2.3. Third Implementation Report ....................................................................................10 2.4. Fourth Implementation Report ..................................................................................10
3. This year’s approach ...................................................................................................12 3.1. Central IT system set up..........................................................................................12 3.2. Data acquisition .....................................................................................................12 3.3. Indicators and comparative analysis..........................................................................13 3.4. New balancing zones analysed ................................................................................14
4. Analysis.....................................................................................................................15 4.1. Market volumes versus domestic volumes .................................................................15 4.2. TSO balancing.......................................................................................................17
4.2.1. Product ranges ..............................................................................................17 4.2.2. Key indicators ...............................................................................................18 4.2.3. TSO Balancing action conclusions....................................................................22
4.3. Imbalance .............................................................................................................22 4.3.1. Key indicators ...............................................................................................23 4.3.2. Imbalance conclusions....................................................................................25 4.3.3. Case exploration 1 – Slovenian high cash out price differential .............................26 4.3.4. Case exploration 2 – The Netherlands ‘continuous imbalance’ regime....................27
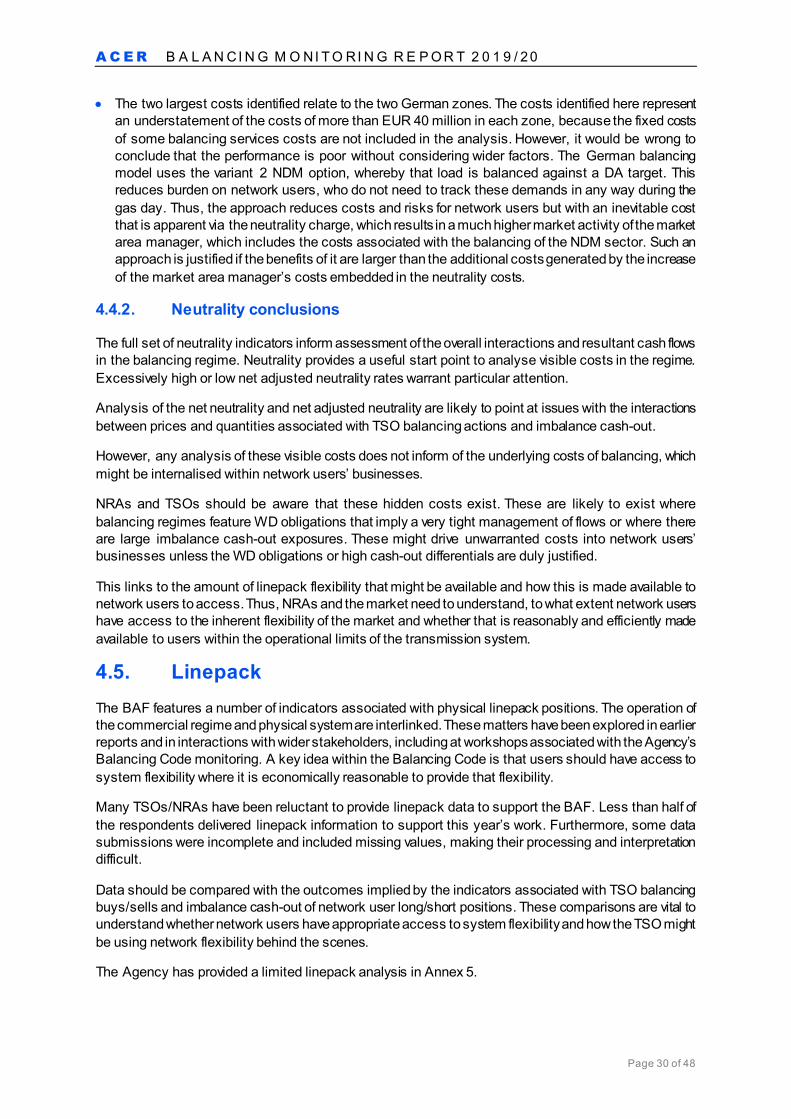
4.4. Neutrality ..............................................................................................................28 4.4.1. Key neutrality indicator....................................................................................29 4.4.2. Neutrality conclusions.....................................................................................30
4.5. Linepack ...............................................................................................................30 4.5.1. Linepack conclusions .....................................................................................31
5. Conclusions and next steps ..........................................................................................32 Annex 1: Balancing zones analysed........................................................................................33 Annex 2: Indicator values ......................................................................................................34 Annex 3: Finnish data submission ..........................................................................................37 Annex 4: Bulgarian data submission .......................................................................................39
Data processing ..............................................................................................................39 Background: data processing ........................................................................................39 Bulgarian data ............................................................................................................39 ZEN indicators derived from national balancing zone data .................................................40
Annex 5: Linepack ...............................................................................................................43 Annex 6: List of abbreviations ................................................................................................45 List of Figures .....................................................................................................................46 List of Tables.......................................................................................................................47

A C E R B A L A N CI N G M O NI T O RI N G R E P O R T 2 0 1 9 / 20
Page 4 of 48
Overview Introduction
1 The Agency’s efforts with respect to gas balancing in 2021 have focussed on establishing the processes for rollout of the Balancing Analytical Framework (BAF) across all balancing zones in Europe.
2 These efforts are important as market based balancing benefits network users, and these benefits are likely to exceed the costs of facilitating the market and replacing the TSO as the sole balancing agent. Transparent balancing systems pave the way for fairly priced balancing products, and consequentially lead to efficiency gains at the wholesale level, which should ultimately benefit final consumers. Focusing on the quantifiable effects of the balancing systems and monitoring the TSOs and network users’ balancing activities can lead to the refinement of the existing balancing designs. Well-established and transparent balancing regimes could better support the integration of renewable gases in the future.
3 The BAF contains a set of indicators to help assess comparative performance across balancing zones and assist NRAs and TSOs understand the strengths and weaknesses of each regime.
4 This report includes some high-level observations about balancing implementations for the gas year 2019/20: the Agency encourages NRAs/TSOs to consider these as part of their ongoing monitoring of balancing regime evolution and effectiveness. The Agency remarks that design features will be important during the decarbonisation of the energy systems; and the Agency’s future work will probably increase focus on providing access and integrating renewable gases to the gas infrastructure and wholesale markets, including balancing ones.
5 The Agency notes that not all balancing zones have been analysed. The exclusions were Austria, Latvia, and Portugal. These zones could not be analysed because of missing data about either TSO balancing actions or network user imbalance information. The Agency had some reservations related to data interpretation on Bulgaria and Finland, which are included with more detail in dedicated annexes of this report, but not in the main body, where the BAF analysis is presented and comparison offered.
Focussing on the Balancing Analytical Framework 6 The principal objective of this year’s analysis has been to automate the calculation processes
associated with the BAF and its indicators.
This year can hence be considered to be a transitional year.
7 The work has involved setting up a new IT system, ZEN, to capture data inputs and to process the data. The ZEN system reads data from the spreadsheets used to gather the information. It then processes the calculations and delivers summary information.
8 ENTSOG assisted with initial data gathering and its efforts have delivered data from a much wider range of balancing zones. The BAF has therefore, been applied more widely than in previous years.
9 Some data checks have been made, and iteration has improved data standardisation and its underlying data quality. However, this year’s work has not involved the detailed interaction with NRAs and/or operators associated with earlier work. Hence, caution must be applied to interpretation of outputs without more detailed consideration of underlying features of each balancing regime.
10 The system automatically processes the data input applying some automatic rules but it makes no judgement about the accuracy or appropriateness of the data received. It is important to note that most of the Agency’s internal effort this year has been associated with building, developing and testing the system, leaving little time available to perform a rigorous challenge of data submission or to understand the detailed implementation that can influence the effectiveness and functioning of the balancing regime. The comments made in this report must be viewed in the light of those caveats.

A C E R B A L A N CI N G M O NI T O RI N G R E P O R T 2 0 1 9 / 20
Page 5 of 48
Scope 11 This review has been wide (covering 22 balancing zones 1). The assessment of each balancing zone
has not been as deep as the Agency’s previous assessments. Nevertheless, the indicators provide valuable pointers towards balancing zones that might need to be more thoroughly assessed by NRAs/TSOs.
12 Some balancing regimes were analysed but were not assessed as fully functioning including:
• Greece – No trading platform is evident;
• Romania – Several days of TSO balancing actions on both sides of the market with inverted prices; this might reflect either a very sophisticated market place or a strange outcome.
13 Furthermore, even the limited analysis and data-driven reviews conducted this year suggest that some other regimes include features that warrant analyses, even when code-compliant. Efficiency gains related to the implementation solutions adopted may emerge in:
• Italy – The use of storage tools 2 side by side with short-term standardised products and high levels of long and short imbalances subject to cash-out, compared to other balancing zones;
• France – The availability of the linepack service (GRTgaz’s Alize, Teréga’s SET) partly3 undermines the incentive of network users to balance themselves fully on a daily basis;
• Germany – High levels of costs visible in balancing, although these might be justified in the context of wider benefits of the variant 2 information model insofar as it supports competition amongst gas suppliers and which might be the subject of a cost-benefit assessment;
• Croatia – Pricing effects may result from the combination of illiquid balancing market and default imbalance pricing rules that may create instability;
• Lithuania – Where the system is apparently always short, necessitating only TSO balancing buys, and where the balancing regime may be distorted via facilities that allow network users to trade after the end of the gas day;
• Hungary – Still using two trading platforms which is likely to fragment short term market liquidity and transparency of price formation;
• Czech Republic – Where most imbalance cash-outs are avoided via an after the day trading of linepack flexibility whereby, effectively, network users are allowed to trade after the end of the gas day;
• Spain – Where the data submission shows that the TSO uses only within-day (WD) title products for balancing, yet some aspects raise questions about the need to refine the TSO’s balancing policy4;
• United Kingdom (Northern Ireland) – Where only balancing services are used for TSO balancing;
• Slovakia – Where very limited TSO balancing actions are fragmented across balancing platform trades and balancing services rather than being focussed on the trading platform;
• Slovenia – Where outcomes may be distorted by wide imbalance price differentials which give rise to a bias towards balancing sells as opposed to discrete periods within year when balancing buys are dominant;
1 Additional zones of Finland and Bulgaria were not included in the main analysis chapter but are included as annexes. 2 TSOs in other zones may have similar tools in place (e.g.: storage, operational balancing agreement, l inepack, etc.) but the Agency could not verify this in the timeframe of this report. See section 4.2.2 for more details. 3 The linepack service applies only on those days when the TSO does not take balancing actions, but network users do not know when this happens, therefore the incentive is only partly undermined. 4 More details are provided in section 4.2.1.

A C E R B A L A N CI N G M O NI T O RI N G R E P O R T 2 0 1 9 / 20
Page 6 of 48
• Latvia-Estonia – Where the TSO balancing actions are dominated by system sells;
• Ireland – Where the TSO balancing actions are dominated by system sells;
• Denmark-Sweden – Where imbalance levels are much higher than observed in our analysis in earlier years.
14 Time has not permitted interaction with NRAs/TSOs this year, given the priority to get the ZEN IT-system up and running. The findings above are derived from a cursory analysis. It is likely that other balancing regimes not mentioned above may also have features that imply some sub-optimality.
15 Thus the analysis singularly based on indicators from this year suggests that some implementations may, following further assessment complementing the one based on indicators, be evolved to maximise the benefits of an efficient implementation of the Balancing Code.
16 Specifically, many balancing regimes remain highly dependent on balancing services. A key objective of the Balancing Code is that TSOs and network users transact in the same market, supported by a trading platform. Experience suggests that the market will deliver the flexible gas as and when required by network users, provided that the regime is sufficiently transparent. Appropriate transparency facilitates the discovery of a fair price for balancing gas and helps deliver appropriate cash-out exposure. Excessive differentials between long and short positions should be avoided to prevent driving unacceptable risk and costs for network users. The cash-out exposure has to be sufficient but proportionate and applied to imbalances that can be forecasted to an appropriate accuracy.
17 The Agency notes that progress has, and continues, to be made. However, the Agency notes that a few countries may be non-compliant with specific provisions of the Balancing Code5. Whilst this year’s analysis has been focussed on an assessment of effectiveness, it might be desirable to review compliance in a future study to complement an effectiveness-based analysis driven by the BAF. This would involve a more detailed consideration of underlying local circumstances and the full set of daily data (including the provision of linepack information).
18 The Agency sees two significant strands of activity (which do not exclude each other) that could support better balancing regime implementation in the upcoming years:
• The first strand would involve enhancing the ZEN application; this could, for example, include access to the data and outputs to facilitate individual NRA/TSO assessment of its regime’s performance compared with others;
• The second strand would be for ACER to perform further studies with increased interaction with NRAs/TSOs/stakeholders to better understand the local specificities of balancing regime implementations and therefore the extent to which compliance and design choices are contributing to deliver efficient outcomes from a consumer perspective. In this respect:
• The provision of quantitative information on the full set of instruments (e.g. storage, operational balancing agreement, linepack, etc.) that TSOs use to balance the network would allow a more complete mapping about the TSOs’ residual role in balancing and capture its related cost. Related cost information at present is mostly only available for balancing services and actions. More information, for example about linepack, would allow to track possible cost transfer between balancing and transmission services.
• A comprehensive description of TSOs’ balancing policy and incentives, and their evolution over time, would allow to spread learnings across the EU and provide for their refinement over time in order to improve design efficiency across the EU.
5 Commission Regulation (EU) No 312/2014 of 26 March 2014 establishing a Network Code on Gas Balancing of Transmission Networks: https://eur-lex.europa.eu/legal-content/EN/TXT/PDF/?uri=CELEX:32014R0312&from=EN

A C E R B A L A N CI N G M O NI T O RI N G R E P O R T 2 0 1 9 / 20
Page 7 of 48
19 The Agency welcomes stakeholder feedback to inform the establishment of a relevant work programme to apply in this area.

A C E R B A L A N CI N G M O NI T O RI N G R E P O R T 2 0 1 9 / 20
Page 8 of 48
1. Introduction This year’s activities have been focussed on extending the application of the Balancing Analytical Framework (BAF)6 to a wider range of balancing zones.
The activities have focussed on the development of an IT system (ZEN) to support the calculation of the indicators defined in the BAF. In parallel with this activity, the Agency has appreciated ENTSOG and its members’ efforts to deliver the base data. The base data supports the derivation of the indicators. The base data and the indicators have informed the commentaries in this report.
ZEN has been used to derive the indicators and these have subsequently been processed to deliver the substantive outputs included in this report.
The Agency has analysed the indicators, and particularly the comparability of indicators across balancing zones, to inform the commentary included in this report.
Reading guide This report provides some background to the history of implementation monitoring and previous reports (Chapter 2), a description of the activities undertaken this year (Chapter 3), the outputs and analysis (Chapter 4) and closes with some conclusions and outline of possible next steps (Chapter 5).
6 The BAF was introduced in ACER’s Second Balancing Implementation Monitoring Report (ACER Report on the implementation of the Balancing Network Code (Second edition) Volume I.pdf (europa.eu), entitled “2017 ACER Report on the Implementation of the Bal NC” and the BAF is covered under Part II and Annexes 2, 3, and 4 of this report.

A C E R B A L A N CI N G M O NI T O RI N G R E P O R T 2 0 1 9 / 20
Page 9 of 48
2. History and previous reports This section captures the experience of previous balancing monitoring reports as background information and for those looking for more in-depth analysis, although on less recent data, on some of the topics covered in the current report.
2.1. First Implementation Report The first implementation report was published on 7 November 2016. This report 7 (with Technical Annexes 8) focussed upon the delivery of specific components required by the Balancing Code. Its focus was about compliance.
On 9 November 2016, a workshop9 was held in Warsaw that focused upon information provision, daily imbalance charges and neutrality. Information provision is critical so that network users can manage their opportunities and exposures. The imbalance charges provide the critical incentive to ensure network users are close to having a daily balanced position. The neutrality regime ensures that net costs (or revenues) arising from the four main cash-flows associated with TSO sales/purchase of gas for residual system balancing and payments to, or monies received from, network user for daily imbalances or receipts in respect of daily imbalances are equitably redistributed to network users.
2.2. Second Implementation Report The second implementation monitoring report was published in a two-volume report on 16 November 2017 (Volume I10 and Volume II11). It introduced the Balancing Analytical Framework (BAF). The BAF is a tool to take basic daily data about the operation of the balancing regime and to derive some summary statistics, referred to as indicators. These indicators can be used to inform an assessment of a regime’s effectiveness. The approach is explained in Volume I within Part II: Applying the Balancing Analytical Framework and Annex 2: Rationale for development of the balancing analytical framework. Part II of the report is dedicated not only to the explanation, but also to the application of this framework.
The rationale for the BAF and the definition of the indicators is not repeated in this report. However, the reader is encouraged to review the BAF explanation to ensure the best understanding of this report.
This report applied the BAF to seven balancing zones:
• United Kingdom (Great Britain) – National Grid
• BeLux high calorific zone – Fluxys
• Germany – NCG
• Denmark – Energinet.dk
• France – GRTgaz Nord
7http://www.acer.europa.eu/Official_documents/Acts_of_the_Agency/Publication/ACER%20Report%20on%20the%20implementation%20of%20the%20Balancing%20Network%20Code.pdf 8https://extranet.acer.europa.eu/en/Gas/Framework%20guidelines_and_network%20codes/Documents/Annex%20II-IV_2016_11_07_for_publication.pdf 9 https://acer.europa.eu/events-and-engagement/news/acer-and-entsog-organise-second-joint-workshop-gas-balancing-warsaw 10 Volume 1: https://documents.acer.europa.eu/Official_documents/Acts_of_the_Agency/Publication/ACER%20Report%20on%20the%20implementation%20of%20the%20Balancing%20Network%20Code%20(Second%20edition)%20Volume%20I.pdf 11 The individual country assessment sheets were included in Volume 2: https://acer.europa.eu/Official_documents/Publications/BAL_IMR%202020_Country%20Assessment%20and%20Methodological/BAL_IMR_2020_vol-II.pdf

A C E R B A L A N CI N G M O NI T O RI N G R E P O R T 2 0 1 9 / 20
Page 10 of 48
• Slovenia – Plinovodi
• Spain - Enagás GTS12
The report also paid particular attention to operational balancing and information provision.
During 2017, a particular focus of attention was within-day obligations. On 15 May 2017, a workshop13 was held in Brussels to consider within-day obligations and the efficacy of within-day regimes where they are assessed as necessary. Whilst within-day obligations may have merit to avoid excessive TSO balancing costs, it is important that within-day obligations do not generate major costs that might not be obvious but which are internalised within network users’ underlying business costs.
After publication of the report, an ACER-ENTSOG workshop14 was held in Vienna. This workshop explored the definition and role of the BAF as a tool to compare the effectiveness of balancing regime implementations. It explored that the underlying neutrality cash flows need careful analysis and assessment to ensure that the overall financial outcomes are consistent with intended outcomes and policy intent. The net cash flow position should generate small redistributions; if the effects are considerable, then it is likely to indicate inappropriate incentives to drive efficient network user balancing and hence system management. It also explained that there is merit in having data about linepack changes on the system. These linepack changes should be compared with those that might be expected to result from TSO and network user activities within the balancing regime to ensure alignment between the commercial and physical reality associated with the balancing regime implementation. The workshop explored the merits of network users having access to an appropriate amount of linepack flexibility. This would ensure the most effective outcomes from a consumer perspective. The first step on this journey is to have linepack data made available so that it can be compared with the outcomes implied by the commercial functioning of the balancing regime.
2.3. Third Implementation Report The third implementation monitoring report 15 was published on 6 August 2018. This report assessed more balancing zones using the BAF including:
• Italy – Snam Rete Gas
• Hungary – FGSZ
• Poland high calorific zone – Gaz-System
• Czech Republic – NET4GAS
The report also reassessed UK (Great Britain) and Denmark to provide additional comparators and continuity given their inclusion in the previous report.
On 12 June 2018, a joint ACER-ENTSOG workshop was held in Brussels. It focussed on the importance of information provision particularly non-daily metered (NDM) demand.
2.4. Fourth Implementation Report
12 The network code in Spain entered into force in October 2016: the TSO provided a complete data-set relevant for the BAF from 1 October 2016 ti l l 31 March 2017, which implied that the data could not be used for comparative analysis for the period from 1 October 2015 to 30 September 2016. 13https://nra.acer.europa.eu/Events/ACER-Workshop-on-Within-Day-Obligations-In-the-context-of-Gas-Balancing-Code-implementation/default.aspx 14 https://nra.acer.europa.eu/Events/3rd-joint-ENTSOGACER-workshop-on-Gas-Balancing/Documents/Forms/AllItems.aspx 15https://acer.europa.eu/Official_documents/Acts_of_the_Agency/Publication/ACER%20Report%20on%20the%20implementation%20of%20the%20Balancing%20Network%20Code%20(Third%20edition).pdf

A C E R B A L A N CI N G M O NI T O RI N G R E P O R T 2 0 1 9 / 20
Page 11 of 48
The fourth report 16 was published on 27 November 2020 and focussed on looking at the enabling of short-term gas markets after interim balancing measures. Whilst this did not involve application of the BAF, the report looked at several balancing zones with a focus on interim measures: the report identified that several balancing zones had terminated interim measures, but that others had maintained interim measures and that actions shall be taken to ensure compliance17.
16https://acer.europa.eu/Official_documents/Acts_of_the_Agency/Publication/ACER%20Report%20on%20enabling%20short-term%20gas%20markets%20after%20interim%20balancing%20measures.pdf 17 Balancing zones that had terminated all interim measures: Germany, Lithuania, Poland, Romania, and Sweden; balancing zones that had only kept tolerances: Ireland; balancing zones that had kept balancing platforms and interim charges: Greece and Slovakia; balancing zones that kept other interim measures: Bulgaria and UK (Northern Ireland); balancing zones that have not terminated transitory measures: Portugal; balancing zones formerly subject to derogation Estonia, Finland, Latvia. Beyond the interim measures, other aspects of code compliance have been reviewed.

A C E R B A L A N CI N G M O NI T O RI N G R E P O R T 2 0 1 9 / 20
Page 12 of 48
3. This year’s approach Stakeholders have welcomed the insights that have arisen from using the BAF. NRAs have indicated that the BAF has helped assess the effectiveness of their balancing regimes. Therefore, this year’s approach extends the application of the BAF.
The work this year has involved three activities:
• The development of a central IT system to process the input data and derive the indicators;
• The gathering of information for a much wider range of balancing zones;
• The derivation of the indicators and some initial comparisons.
3.1. Central IT system set up The primary objective of this year’s activities has been to establish the necessary IT infrastructure to support a much wider application of the BAF.
The new central system, ZEN, has been created to process data and derive the indicators. ZEN creates a central repository to store multi-year data for all balancing zones and is intended to improve the efficiency of data processing and the ease of BAF indicator production. It also creates opportunities to extend previous analyses. For example, it will be possible to investigate individual balancing regime performances over several years.
Thus, considerable efforts have been expended in developing ZEN and testing it to ensure all indicators are correctly calculated. These efforts left less opportunity for detailed analyses of individual regime performance. Nevertheless, the report makes some relevant observations about individual regime performance informed by the BAF indicators obtained from the ZEN outputs.
3.2. Data acquisition An aspiration of this report was to increase the number of balancing regimes assessed.
The Agency and ENTSOG developed a data collection spreadsheet to provide inputs to the ZEN system. The data items in the spreadsheet have evolved since the initial formulation of the BAF. For example, the data collected now involves information about market volumes and domestic volumes. These are explored to a limited extent in the analysis part of this report.
ENTSOG has worked with its members to secure data from a much wider range of balancing zones than had previously been analysed. The result is a much wider range of balancing zones for inclusion in the analysis. ENTSOG has worked closely with the Agency and its members to deliver a significant increase in both the number of balancing regimes and the quality of the underlying data. The Agency thanks ENTSOG and its members for its efforts.
At the same time, the process and interaction with ENTSOG has exposed some major data errors that have been corrected. For example, some data were originally submitted without comprehensive validation. Where the Agency doubted information ENTSOG was notified and some updates have been provided. There has been no consistent pattern to the data anomalies. Several sources have acknowledged data errors 18. The Agency calls TSOs and ENTSOG to implement a proper data validation process in the cases where it is still missing.
18 For example, one respondent indicated that “after careful review, some inconsistencies were found due to automatic retrieval of data from the TSO’s systems”. Regrettably, the integrity and value of this report depends upon the underlying data quality of the inputs. The report must therefore, be read in this context.

A C E R B A L A N CI N G M O NI T O RI N G R E P O R T 2 0 1 9 / 20
Page 13 of 48
3.3. Indicators and comparative analysis Data was received in respect of 27 balancing zones.
The focus of this year’s analysis is on the gas year 2019/202019.
Whilst progress is still being made in some balancing zones, an assessment was made that the BAF would not yield meaningful information in respect of the following balancing zones:
• Bulgaria – Whilst some limited data was supplied, the original TSO data corresponded solely to quantities associated with balancing services but without any prices being included or any indication of any TSO balancing activity associated with a trading platform. The market data provided monthly price formation and no evidence of a properly formed daily price. It is therefore unclear that any meaningful information can be derived from the submission, although a commentary on the Bulgarian national system data is provided in a dedicated annex;
• Finland – Some late information was supplied but only from 1 January 2020 onwards. The data demonstrates tiny TSO actions (representing 0.005% of market volume) and very large network users’ imbalances (around 48% of market volumes)20. These numbers are out of line and cannot be compared with other regimes. It is unclear that any meaningful conclusion can be drawn from the data supplied.
• Latvia – Data from 1 January 2020 associated with the Latvia-Estonia merged balancing zone was supplied and has been included within the analysis. Data specific to Latvia was supplied covering the period 1 October 2019 to 31 December 2019 but it did not include any information related to TSO balancing activity. The submission only included references to balancing services and with no data to confirm their use. Imbalances were provided but implied that network users were either all long or all short on each day. It is unclear that any meaningful information can be derived from the submission. However, as aforementioned, Latvia is represented elsewhere in this report.
• Portugal – No indication of any TSO balancing action is included in the submission21.
• Austria – The supplied data indicated that there were no imbalances on any day during the analysis period. This is a consequence of the regime whereby network users are prohibited from having an imbalance because of interventions to remove that possibility. Thus, the current Austrian regime does not reflect essential features of the Balancing Code and hence, no meaningful interpretation of the Austrian regime can be made using the BAF, although the Agency notes that it is intended that Austria will have a compliant regime from 1 April 202222.
19 This covers the period 1 October 2019 to 30 September 2020. 20 See Annex 3, which displays some of the data and derivatives. 21 Presently, Portugal is phasing out the transitory measures, in place until September 2021. The TSO is buying cushion gas in the market and performing balancing actions and reserve gas lent by network users that is handed back to them by the TSO, among other measures. Despite the sti l l incomplete implementation, the NRA reports two important milestones: the MIBGAS trading platform has started operation for the Portuguese VTP on 16 March 2021, and in the same month the NRA approved a revision of the balancing rules in order to comply with Balancing Code. 22 Following a comprehensive stakeholder process (https://www.e-control.at/en/marktteilnehmer/gas/weiterentwicklung-bilanzierungsmodell), the Austrian NRA has redesigned the gas market model (https://www.e-control.at/en/recht/bundesrecht/gas/verordnungen#p_p_id_com_liferay_journal_content_web_portlet_JournalContentPortlet_INSTANCE_3Ds9EHzUKHax_ ) to make it compliant with the Balancing Code by October 2021. In this respect, the major change would be the establishment of an integrated balancing of transmission and distribution level. See page 30 of: https://www.acer.europa.eu/Official_documents/Acts_of_the_Agency/Publication/ACER%20Report%20on%20enabling%20short-term%20gas%20markets%20after%20interim%20balancing%20measures.pdf The propagation of COVID-19 in Austria has caused delays to the implementation to the new gas market model, now expected to enter into force on 1 April 2022.

A C E R B A L A N CI N G M O NI T O RI N G R E P O R T 2 0 1 9 / 20
Page 14 of 48
The Agency notes the progress that has already taken place, or is anticipated, in each of the above zones. The Agency calls upon the relevant TSOs and NRAs to ensure that the remaining shortcomings are addressed timely and looks forward to being able to include these zones in subsequent monitoring reports, where progress will be addressed.
The analysis in Chapter 4 is therefore, based on 22 balancing zones. Building upon the experience of earlier years, a selection was made of the most instructive indicators, which are presented in Chapter 4.
A full assessment requires a far more detailed consideration than has been possible within this report. Specifically we note that:
• Indicators for a single country may be connected and might need to be assessed together;
• Some indicators may signal issues, some values might only raise issues when carefully considered in the context of their interaction with other indicators;
• Indicators cannot be assessed without reference to the underlying policy decisions that have influenced the design of the regime.
The numerical values of a wider set of indicators are included in Annex 2. The abbreviated names of the zones are indicated in an Annex 1.
3.4. New balancing zones analysed This year’s analysis includes seven balancing zones that have not previously been analysed using the BAF.
These are Slovakia (SK), Romania (RO), Northern Ireland (UK-NI)23, Lithuania (LT), Greece (EL), Croatia (HR), and Latvia-Estonia joint balancing zone (LV-EE). Finland (FI) and Bulgaria (BG) sit in Annexes 3 and 4, and not in Chapter 4 of the report, where the comparative analysis is carried out, for the reasons explained in the previous paragraph and detailed in the respective annexes. In previous year’s work, the Agency has interacted with NRAs24 to ensure a good understanding of the key features of the balancing regime. This ensures that local features, which may significantly influence indicators, are well understood to facilitate interpretation. This interaction also explored the basis for data provision and helped to ensure that appropriate data was analysed.
Due to time constraints and focus on establishing the IT-system, the same interaction has not happened for the newly analysed zones and so the indicators cannot be considered as robust as in the earlier reports of the Agency. Nonetheless, some general observations have been made in the analysis section. These may be worthy of consideration by the relevant NRAs/TSOs as they progress towards delivering efficient balancing regimes. The Agency would welcome future interaction with NRAs/TSOs to explore the underlying features and operation of these balancing regimes.
23 Whilst this may be the last time that UK data is reflected in these series of reports, it is noted that UK-NI is sti l l making use of interim measures as observed in the earlier report. 24 And often TSOs and/or market operators.

A C E R B A L A N CI N G M O NI T O RI N G R E P O R T 2 0 1 9 / 20
Page 15 of 48
4. Analysis This chapter provides the main graphics and commentary about the balancing zones assessed in the comparative analysis part of this report. Tables of the numeric values of key indicators are included in Annex 2.
The analysis explores some of the key indicators and pays particular attention to the more extreme values observed. These key indicators belong to four distinctive groups:
• Firstly, four indicators appraise the residual role of the TSO and hence, describe the level, the frequency and the average price spreads concerning the TSOs’ buy and sell actions.
• Next to it, three additional indicators form an impression of the network users’ balancing activity looking at the imbalance quantities of the network users, the average imbalance prices and price spreads, in order to understand the different incentives network users might face within the different EU balancing regimes.
• The third group of indicators contains a single indicator: the net adjusted neutrality. The indicator explains the net payments charged or credited to network users, with a caution on high values.
• At last, linepack indicators could not be explored in this report absent sufficient data, but some initial findings have been still shared in Annex 5.
Insufficient time has been available to explore in depth the detailed design of some of the implementations analysed using the BAF for the first time. This is particularly important where embryonic markets are developing and all features of the anticipated balancing regimes might not be fully implemented or operational. Examples might include early days of full access to customers and the phased transition towards market and TSO use of trading platforms.
A number of indicators are normalised to facilitate comparison. For example, some indicators are expressed relative to market volumes. The underlying data input to the BAF includes market volume and domestic volume. This chapter first considers the relationship between market and domestic volumes and provides some explanation for the differences between these values.
Subsequent sub-sections provide graphical representation and commentary upon TSO balancing activity, imbalance cash-out and neutrality. The section concludes with some comments about linepack.
4.1. Market volumes versus domestic volumes Data has been gathered for both market volumes and domestic volumes.
Market volumes correspond to flows of gas coming into the relevant transmission system from all sources (for example indigenous production, injection from storage facilities, cross-border flows from other balancing zones and importation at the European border).
Domestic volumes correspond to consumers’ offtakes of gas.
On any day, the volume entering the zone (entry) would normally be expected to be greater than the domestic volume (that part of the demand associated with consumption by users within the balancing zone).
The domestic volume relative to market volume shows significant variability, with the main differences arising from storage, transit, injection of gas into distribution networks, and TSO operational gas.

A C E R B A L A N CI N G M O NI T O RI N G R E P O R T 2 0 1 9 / 20
Page 16 of 48
Figure 1: Market versus domestic volumes
The balancing rules apply to all network users’ entries to (entry) and offtakes from (exit) the system. Balancing zones can also include distribution zones. It is important to understand the cash flow redistributions that occur in neutrality, particularly when inter-balancing zone comparisons are being made. In this report, some indicators are based upon the market volume measure25, although in some circumstances similar indicators based upon domestic volumes may assist interpretation.
In some circumstances, the difference between market volumes and domestic volumes may be quite considerable. It is therefore important to understand some of the circumstances that influence the determination of these two values, e.g.:
• Transit – several different forms of transit exist:
• Entry from outside Europe to first cross-border point;
• Cross-border to cross-border flows;
• Entry from third countries to the EU to exit to third countries to EU (e.g. Lithuanian flows from Belarus to Kaliningrad);
• Export from EU gas resources (e.g. Netherlands gas export to other EU Member States);
• Export to non-EU destinations (e.g. Latvian exports from Inčukalns used as a storage vessel for non-EU sourced gas and demand);
• TSO own use – these flows can either be within or outside of the commercial arrangements of the balancing regime;
• Storage – typically injection into storage facilities is not included in domestic volumes;
• Entry within the distribution zones – gas injected within the distribution zones may not be reflected in market volumes. These quantities may be significant, particularly with increases in biogas entry26.
The size of the market may be relevant to the amount of sophistication/cost that a market can support. Sophistication rarely comes without costs and so regime design choices need to be carefully exercised.
25 This is consistent with the requirement within Article 30 of the Balancing Code, which implies that the neutrality charge shall be proportionate to the extent the network user makes use of the relevant entry or exit points. Thus, the market volume metric provides a good proxy for the volumes that will be subject to neutrality. 26 For example, in Denmark, biogas entry into the distribution zone represents approximately 20% of domestic consumption.
0
200
400
600
800
1000
1200
DE-
GP
UK-
GB NL
DE-
NCG IT
FR-T
RF SKBE
LUX-
H ES CZ HU
PL-H
RO-N
TSBE
LUX-
L IE EL LTD
K-SE HR
LV-E
E SIU
K-N
I
TWh
Market Volume Domestic Volume

A C E R B A L A N CI N G M O NI T O RI N G R E P O R T 2 0 1 9 / 20
Page 17 of 48
4.2. TSO balancing 4.2.1. Product ranges
The data indicates that there are several balancing zones that still appear to have access to, or make extensive use of, balancing services. The following table captures the type of products used by the TSOs during the analysed period (built on the information available to the Agency). A detailed comparison of the share of balancing services over total balancing is out of the scope of this year’s report.
Table 1: Product types used during the analysis period
Balancing zone WD Title DA Title
Locational and/or
temporal Balancing serv ices
BELUX-H Yes BELUX-L Yes
CZ Yes Yes DE-GP Yes Yes Yes
DE-NCG Yes Yes Yes Yes DK-SE Yes
ES Yes FR-TRF Yes
GR Yes Yes HR Yes HU Yes IE Yes IT Yes LT Yes Yes
LV-EE Yes Yes NL Yes Yes
PL-H Yes Yes RO Yes SI Yes Yes SK Yes Yes Yes
UK-GB Yes UK-NI Yes
Some balancing zones have a very extensive range of product types declared in the information supplied. For example, the German NCG zone has 31 different products defined (although eight were unused and the overall share of TSO’s balancing system via balancing service is only 0.07%). Polish H-cal zone has six different products with within-day (WD) and day-ahead (DA) products being distinguished as separate. Its product range includes access to trading platforms in both the Czech (Net4Gas) and German (GASPOOL) zones. It uses a tiny amount of balancing services to supply a discrete part of the network with a dedicated supply obtained from an adjacent zone.
Whilst, superficially, regimes relying mainly on WD title products might be assessed as favourable, it is important to recognise that a more sophisticated range of products might be necessary in some networks. Furthermore, it is important that the WD title market delivers for both network users and the TSOs. For example, in Spain, the TSO is allowed to rely on the market when there is a risk that the network operation can be compromised, that is, when the linepack (or its forecast) enters into the ‘surveillance range’ or ‘alert range’. In the surveillance range, the TSO may decide not to resort to WD

A C E R B A L A N CI N G M O NI T O RI N G R E P O R T 2 0 1 9 / 20
Page 18 of 48
products 27 if their prices are not deemed convenient. This happened on 26 August, when indeed the TSO decided not to buy the WD gas product it had initially requested.
The Agency notes that specific aspects of the TSOs’ balancing policy shall evolve over time, also depending on market liquidity and information provision: for example, whether the TSO must notify the market before taking action or not28, up until to the point where the TSO’s activity becomes residual and fully blends into the network users’ trades without endangering network stability. The Agency highlights this example to encourage policy learning across the EU balancing systems.
It is notable that the supplied data implies that trading platforms are not operational, or at least not used for TSO balancing in all zones. This is the case in United Kingdom-Northern Ireland. Greece is in a similar position and used both a balancing platform and balancing services during the year and often on the same day. Whilst balancing actions are rare in Slovakia, it is notable that TSO balancing actions have been split across trading platform, balancing platform, and balancing services. In the aforementioned cases, urgent attention needs to be applied to foster liquidity on relevant trading platforms and for the TSO to learn how best to use that tool.
Hungary appears to have two different platforms for TSO balancing, which may fragment liquidity and have consequences in respect of price formation.
4.2.2. Key indicators
The following indicator seeks to compare the relative level of TSO balancing actions.
Figure 2: Total balancing action quantities as a share of market volume
From this graph, the following can be observed:
• NCG has the highest level of balancing action against this indicator. The German regime features the variant 2 information model option, where users are balanced against a DA forecast of NDM demand. This may be a contributory factor. However, the higher balancing action quantities
27 When the linepack enters into these ranges during the gas day, DA actions would not be effective to modify the network balance. The TSO can otherwise use DA or locational products, and balancing services (as a last resort), which are all available in its merit order. 28 It is preferable that the TSO remains anonymous, which is easier when markets become liquid. However, in the early stages of the balancing market development, it may be meaningful that the TSO announces when it trades to ensure that the market can respond with the requested volumes.
0
1
2
3
4
5
6
BELU
X-H
BELU
X-L CZ
DE-
GPL
DE-
NCG
DK-
SE EL ESFR
-TRF H
RH
U IE IT LTLV
-EE NL
PL-H RO SI SK
UK-
GB
UK-
NI
%

A C E R B A L A N CI N G M O NI T O RI N G R E P O R T 2 0 1 9 / 20
Page 19 of 48
percentage in DE-NCG is notably higher than the DE-GP (GASPOOL) value and may warrant further analysis.
• IT – The indicator here only captures balancing action quantities transacted on the trading platform. The TSO continues to have rights to nominate on storage with the sourcing of such gas priced in a storage market, where both users and the TSO can exchange gas29. The pricing is defined after the day via an auction clearing process, although network users have to bid prices on the relevant gas day, in which the TSO uses the service. The activity of the TSO in the storage market is small compared to its activity in the title market 30, however, this implies a fragmentation of the market between WD trading platform and the separate ‘in store’ market.
• Some of the zones new to the BAF display significantly high (Croatia (HR), Slovenia (SI) and Greece (EL)) or low (Lithuania (LT)) values. Whilst this may be partly attributable to emerging markets in these zones, further analysis is warranted.
The following indicator captures the extent to which TSO actions are asymmetric between buys and sells.
Figure 3: Total balancing buy action quantities as a share of total buy & sell quantities
From this graph, the following observations stand out:
• Lithuania (LT) has only TSO balancing buy actions. The underlying reasons warrants analysis. The TSO has taken balancing buy actions on 205 days, although the total quantities are exceptionally small when compared to the market and domestic volume information supplied in the data received.
29 Other balancing zones may have been less than transparent about their full range of tools that the TSO can access to procure gas outside the title market (e.g. storage, operational balancing agreements with other zones, l inepack, etc.). The Agency could not investigate further in the timeframe of this year’s report. Thus, the case of Italy might not be the only one, but simply the one on which the NRA and TSO have provided higher transparency allowing regulatory assessment. In all these cases, it is worth reminding recital (5) of the Balancing Code: “The merit order is constructed so that transmission system operators will procure gas taking account of both economical and operational considerations, using products that can be delivered from the widest range of sources, including products sourced from LNG and storage facilities. The transmission system operators should aim to maximise the amount of their gas balancing needs through the purchase and sale of short term standardised products on the
short term wholesale gas market.” Hence, the Agency encourages Italy as well as other countries to closely monitor and assess how the various sources may decrease balancing through STSPs on the wholesale market. In this respect, ARERA has set up a system of incentives, which it periodically monitors and fine-tunes, along the needs. 30 Just over 11% of the TSOs activities on the trading platform.
0
50
100
BELU
X-H
BELU
X-L CZ
DE-
GPL
DE-
NCG
DK-
SE EL ESFR
-TRF H
RH
U IE IT LTLV
-EE NL
PL-H RO SI SK
UK-
GB
UK-
NI
%

A C E R B A L A N CI N G M O NI T O RI N G R E P O R T 2 0 1 9 / 20
Page 20 of 48
• Italy (IT), Romania (RO) and Great Britain (UK-GB) have buys representing more than 2/3 of balancing action activities. This might warrant further analysis, given that a modest propensity towards slightly more sells than buys might imply a greater security of supply;
• The balancing actions of Ireland (IE) and Latvia/Estonia (LV-EE) are heavily biased towards sells and it warrants further scrutiny why the system might be so consistently long. The bias is so large that it might imply some dysfunctionality within the balancing incentive for network users.
Figure 4: Number of days when balancing actions took place
This indicator provides insight as to the number of days in which the TSO was active in its residual balancing role.
From this graph, the following can be observed:
• Several zones indicate that balancing actions are taken on every day. Whilst this should not necessarily be automatically considered to be a poor outcome, such instances warrant consideration. Actions on every day may be a natural consequence of the regime design rather than as an absolute requirement to take actions because of the state of the system. Additionally, TSO actions taken every day have a merit as far as they generate market based transactions that might help ensure that the cash-out prices are set by reference to a value associated with short term flexibility value on the day.
• For Belgium and Luxembourg, the Belux-H and Belux-L zone outcomes are a natural outcome of the regime design. The imbalance associated with the network users’ community aggregated commercial position arising on one day is corrected early in the following day by a balancing action to offset the previous days’ imbalance. So, if yesterday in aggregate the user community was 50 GWh long, then today a balancing action would be taken to sell 50 GWh to offset yesterday’s imbalance. The Belgian regime features a WD obligation and so balancing actions are also taken for WD purposes when the users in aggregate exceed an acceptable imbalance (defined by a ‘green zone’). The Belux-H and Belux-L WD actions occurred on 33 and 44 days respectively.
• For the Netherlands, which incorporates a continuous balancing regime with no daily cash-out, WD balancing actions were taken on 159 days31.
• Poland (PL-H) displays balancing actions every day. The balancing policy applied seeks to remedy the aggregate commercial balance of network users from the previous day and so one action per day is taken in the WD title market to offset the previous day’s imbalance. Additionally, there is a
31 More details on the Dutch balancing zones are explained in the dedicated case exploration at page 27.
0
122
244
366BE
LUX-
HBE
LUX-
L CZD
E-G
PLD
E-N
CGD
K-SE EL ES
FR-T
RF HR
HU IE IT LT
LV-E
E NL
PL-H RO SI SK
UK-
GB
UK-
NI
n°da
ys

A C E R B A L A N CI N G M O NI T O RI N G R E P O R T 2 0 1 9 / 20
Page 21 of 48
tiny use of balancing services on every day in the year (in total 3 GWh for the full 2019/20 gas year) to supply a small and entirely separate part of the network from an adjacent balancing zone.
• This is the first time Slovakia (SK) has featured in the BAF analysis. It displays rare balancing actions, but this may well reflect that there is tiny domestic demand and that most of the other flows are associated with transit, which, as a requirement derived from legacy arrangements, ensures that nominations at entry to and exit from the system are matched. The actions are spread across a balancing platform, a trading platform, and balancing services. This may not be consistent with focussing liquidity in one single place accessible to both network users and the TSO.
Figure 5: Average buy-sell price spread of TSO balancing gas
The indicator is designed to provide a comparison of pricing levels associated with TSO balancing actions. A separate graphic is shown to illustrate the difference between the average buy and average sell price calculated over the analysis period32.
32 The average spread is calculated by subtracting the yearly weighted averages daily prices of TSO balancing buys minus averages daily prices of TSO balancing sells. This methodology has been selected because the TSO does not buys or sells each day: therefore, a daily spread calculation is not possible. Thus, the spread showed might be determined by seasonal pricing and system balancing needs’ patterns. The weighting reflects the energy content of the relevant transactions on each day.
0
2
4
6
8
10
12
14
16
18
BELU
X-H
BELU
X-L CZ
DE-
GPL
DE-
NCG
DK-
SE EL ESFR
-TRF H
RH
U IE IT LTLV
-EE NL
PL-H RO SI SK
UK-
GB
UK-
NI
EUR/
MW
h

A C E R B A L A N CI N G M O NI T O RI N G R E P O R T 2 0 1 9 / 20
Page 22 of 48
Figure 6: Average TSO balancing gas buy-sell spread
From these two graphs, the following observations stand out:
• Greece (EL) is analysed for the first time and it displays a remarkable variation in price between balancing action buys and sells. Its prices may be heavily influenced by balancing services prices (with an average price of 26.25 EUR/MWh) compared with an average balancing platform price of 19.54 EUR/MWh). The average price for DA balancing platform sales is 5.83 EUR/MWh, against a WD value of 5.18 EUR/MWh. The outcomes may reflect an emergent but still highly illiquid short-term market dependent upon a balancing platform rather than a trading platform;
• Croatia (HR) is also being analysed for the first time. The prices here display significant differences between buys and sells. This may reflect an underlying lack of liquidity on the trading platform with extreme prices observed (e.g. 35.38 EUR/MWh buy on 23 March and sell prices several times less than 5 EUR/MWh);
• Germany GASPOOL (DE-GP) also displays a wide buy-sell spread. Much of this is associated with a strong seasonal pattern to the TSO balancing actions with mostly buys occurring in the winter (higher price periods) and sells in the summer (lower price periods). This might suggest an issue elsewhere in the regime, perhaps an inherent seasonal bias associated with NDM allocations, given that the variant 2 model is applicable;
• Slovenia (SI) also displays a wide differential. The DA buy average is 15.24 EUR/MWh, whereas the WD buy average is 12.60 EUR/MWh. This counter intuitive outcome may warrant further analysis. The pattern of actions is also rather skewed with far more sell days than buy days and long periods within the analysis period associated with only buy actions or only sell actions.
4.2.3. TSO Balancing action conclusions
Some regimes are still reliant on balancing platforms or balancing services. Many regimes make substantial use of balancing services, although those that have been able to establish and subsequently use trading platforms have generally found them to be adequate to support the TSO’s balancing requirements. The data also suggests that many TSOs are now using little more than the WD title market for their balancing actions, which could be interpreted as a good sign.
4.3. Imbalance User imbalances will be closely related to their ability to forecast demands and their ability to respond to demand changes. The Balancing Code contemplates three types of NDM information model and the extent of imbalances should be assessed accordingly.
0
5
10
15
20
25
BELU
X-H
BELU
X-L CZ
DE-
GPL
DE-
NCG
DK-
SE EL ESFR
-TRF H
RH
U IE IT LTLV
-EE NL
PL-H RO SI SK
UK-
GB
UK-
NI
EUR/
MW
h
Average Price of Buys Average Price of Sells

A C E R B A L A N CI N G M O NI T O RI N G R E P O R T 2 0 1 9 / 20
Page 23 of 48
For example, the use of variant 2 (whereby NDM allocations are fixed at DA) should be expected to lead to lower levels of imbalance, but a likely consequence is increased TSO balancing. This demonstrates why some of the elements of the regime cannot be considered in isolation.
Inaccurate demand forecasts will create higher network user imbalance exposures. Demand forecasting was a focus of the 2018 Agency’s activity 33. The availability of accurate and timely information to support network user risk management needs to be considered when comparing observed imbalance levels in different zones.
4.3.1. Key indicators
The following indicator is designed to provide a normalised metric for the scale of network users’ imbalance.
Figure 7: Total imbalance quantities as a share of market volume
From this graph, the following can be observed:
• Denmark/Sweden (DK/SE) is a joint balancing zone across the two countries, although the Swedish component is relatively small. The imbalance performance here of more than 10% is larger than seen in earlier analyses, where imbalance levels around 4.7% in 2015/16 and 7.1% in 2016/17 were observed in the Danish zone. According to the Danish NRA, the reason may be related to a temporary decrease in domestic gas production, which makes the imbalances relative to the market volumes higher.
• Italy (IT) looks to be the only outlier amongst the bigger gas countries and may warrant analysis. There may, for example, be merit in trying to better understand the extent of network user imbalance that might be attributable to NDM forecasting errors.
• Croatia (HR), Romania (RO-NTS) and Greece (EL) are new to this year’s analysis. The underlying features of their regimes have not thoroughly been researched and assessed in the context of the BAF. Some scrutiny from, or dialogue with, the NRAs would be appropriate to better understand what might be going on.
33 See June 2018 Workshop material: https://www.acer.europa.eu/Events/3rd-joint-ENTSOGACER-workshop-on-Gas-Balancing/default.aspx
0
2
4
6
8
10
12
BELU
X-H
BELU
X-L CZ
DE-
GPL
DE-
NCG
DK-
SE EL ESFR
-TRF H
RH
U IE IT LTLV
-EE NL
PL-H RO SI SK
UK-
GB
UK-
NI
%

A C E R B A L A N CI N G M O NI T O RI N G R E P O R T 2 0 1 9 / 20
Page 24 of 48
• Spanish (ES) imbalances were revised downwards in a second data submission in response to a question raised by the Agency. The original data submission had been based on individual shippers, whereas the subsequent submission was reflecting balancing groups.
• Lithuania (LT) has minimal imbalances, although it is understood that this has been influenced by the existence of opportunities to trade ‘after the day’ and so to eliminate user imbalance exposure. This is expected to continue into 2021, although it is contrary to gas trading principles established by the Balancing Code.
• Netherlands has zero imbalances reflecting its continuous balancing regime, whereby users carry over imbalance from one day to the next but have a responsibility to manage their cumulative imbalance on a continuous basis.
The following indicators consider the average prices for imbalance gas paid by network users.
Figure 8: Average imbalance cash out prices
Figure 9: Average buy-sell spread on imbalance cash out prices
0
2
4
6
8
10
12
BELU
X-H
BELU
X-L CZ
DE-
GPL
DE-
NCG
DK-
SE EL ESFR
-TRF H
RH
U IE IT LTLV
-EE NL
PL-H RO SI SK
UK-
GB
UK-
NI
EUR/
MW
h
0
2
4
6
8
10
12
14
16
18
BELU
X-H
BELU
X-L CZ
DE-
GPL
DE-
NCG
DK-
SE EL ESFR
-TRF H
RH
U IE IT LTLV
-EE NL
PL-H RO SI SK
UK-
GB
UK-
NI
EUR/
MW
h
Average Price Short Positions Average Price Long Positions

A C E R B A L A N CI N G M O NI T O RI N G R E P O R T 2 0 1 9 / 20
Page 25 of 48
From these two graphs, the following observations stand out:
• Greece (EL) displays the highest and lowest average imbalance cash-out prices for short and long positions. This is likely to be a consequence of the prices of the TSO’s balancing actions. As has been mentioned earlier, these may be related to unreliable prices associated with the TSO’s distress rather than being properly formed on a trading platform.
• Slovenia (SI) indicates a wide differential between short and long position cash-out average prices. An explanation is provided in Case Exploration 1.
• In some zones, for example Poland (PL-H) and Lithuania (LT), the wide differential may be associated with the use of a large ‘small adjustment’ (in the case of these two countries 10%).
• The Croatian (HR) imbalance cash-out prices are notably high and may warrant further analysis. The data implies price inversions taking place on several days. For example, the period 20 to 23 July yielded some remarkable price inversion effects, whereby the cash-out price for long positions was significantly higher than the cash-out price for short positions. For example, network users were paid 16.15 EUR/MWh for long positions, whereas those that were short only had to pay 9.15 EUR/MWh. Such extraordinary pricing could lead to physical instability in the system. It is likely that these effects arise from days when the market does not trade and so there is no reference point to use in the cash-out price determination. Thus, a method is needed, often referred to as default cash-out pricing rule. The default price setting rules may warrant review. Furthermore, the reasons for the underlying lack of liquidity on the trading platform needs to be assessed and, if appropriate and to the extent possible, remedies developed.
• Czech Republic (CZ) exhibits a very low differential that may be attributable to generally lower cash-out price differentials and the scope for network users to use after the day adjustments to mitigate cash-out exposures.
• Denmark/Sweden (DK-SE) exhibits very low daily price differentials, which may be a reason for very small average price short/long position differential in that zone and which may also be a cause of the large imbalance volumes identified earlier in this report.
• Netherlands (NL) regime involves continuous imbalance for users. It features no cash-out. Thus, the BAF cannot identify any costs or revenues associated with imbalance cash-out. This, however, should not be interpreted as saying users have no imbalance costs; rather that those costs that would otherwise be associated with daily imbalance cash-out are internalised within the network users’ businesses. Some remarks on the Dutch approach is provided in Case Exploration 2.
4.3.2. Imbalance conclusions
Analysis of imbalances needs to consider key underlying features of the balancing regime, particularly the information provision model, the timing and accuracy of forecast information available to network users and the rules associated with the calculation of imbalance cash-out prices.
The imbalance cash-out prices deliver the primary incentive on network users to balance. The incentive needs to be sufficiently large to drive behaviours but not so strong that it drives unwarranted costs and risks into network users’ businesses.
High imbalance price spreads warrant analysis: when they are not determined by the seasonal price variation of wholesale markets, they may indicate a too high small adjustment or not liquid enough markets.

A C E R B A L A N CI N G M O NI T O RI N G R E P O R T 2 0 1 9 / 20
Page 26 of 48
4.3.3. Case exploration 1 – Slovenian high cash out price differential
The following graphics might provide some insight into the Slovenian (SI) situation:
Figure 10: Slovenia - Network users’ imbalance cash out
This shows asymmetry between long and short positions with greater proportional long positions in the summer.
Additionally, the information supplied implies that cash-out price differentials are large (by comparison with many other counties). This is attributable to both relatively high levels of ‘small adjustment’ and balancing action prices far away from the market.
The cash-out prices are illustrated in the following graph:
Figure 11: Slovenia - Daily imbalance cash out pricing
The combined effect of imbalance quantities and cash-out prices investigated at a daily granularity explains the large variation between the average prices paid and received for imbalance short and long positions.

A C E R B A L A N CI N G M O NI T O RI N G R E P O R T 2 0 1 9 / 20
Page 27 of 48
Table 2: Slovenia - Network users’ imbalance cash out
SI Annual
Quantity Share of annual market
Min daily
quantity
Av erage daily
quantity
Max daily
quantity
Share of activ ity
Av erage price
MWh % MWh MWh MWh % EUR/MWh
Shipper long 331,431 1.82 0 906 3,632 65.3 7.36
Shipper short 176,505 0.97 0 482 2,433 34.7 15.11
Total 507,936 2.79
4.3.4. Case exploration 2 – The Netherlands ‘continuous imbalance’ regime
Whilst the Netherlands ‘continuous imbalance’ regime appears fundamentally different to that envisaged under the Balancing Code, its treatment of the end-of-day linepack mirrors the intent of the daily balancing cash-out.
The linepack service charge applied to the user’s continuous imbalance position at the end of each gas day has an analogous effect to the cash-out price differential within the standard regime cash-out mechanism. Whilst no gas is cashed out in the Dutch regime, the incentive properties of the linepack service match those associated with the Balancing Code’s imbalance cash-out. A charge is levied for each unit of imbalance position regardless of direction. In the Netherlands, this is defined by the linepack flexibility service (LFS) charge. The LFS charge is equivalent to the difference between the marginal buy price and the weighted average price (for short positions) and to the weighted average price and the marginal sell price (for long positions) used in the standard balancing model.
The balancing regime is characterised by a WD obligation that encourages network users to track a WD programme during the 24-hour gas day. The observed TSO balancing interventions are summarised in the following table and graphics.
Table 3: The Netherlands - TSO balancing actions
NL
Annual quantity
Share of annual market
Number of days
Av erage daily
quantity
Max daily quantity
Share of activ ity
Av erage price
MWh % days MWh MWh % EUR/MWh System buys 1,651,868 0.19 96 17,207 101,246 52.0 12.66
System sells 1,526,954 0.17 78 19,576 221,396 48.0 8.04
Total 3,178,822 0.36 159
Figure 12: The Netherlands -TSO balancing actions

A C E R B A L A N CI N G M O NI T O RI N G R E P O R T 2 0 1 9 / 20
Page 28 of 48
The above demonstrates close to symmetric balancing requirements measured in quantities of buy and sell over the analysed period. The quantities are relatively small and generate low apparent costs, although some of the cost of the WD obligations may be internalised within the network users’ businesses.
The usual format of the imbalance analysis under the BAF is replaced by the following analysis of the linepack flexibility service34. As mentioned above, the LFS charges can be interpreted as analogous to the differential prices applicable within a daily balancing cash-out regime.
Table 4: The Netherlands - Linepack flexibility service
NL Annual
Quantity Share of annual market
Min daily
quantity
Av erage daily
quantity
Max daily
quantity
Share of activ ity
Av erage LFS charge
rate
MWh % MWh MWh MWh % EUR/MWh
Shipper LFS long 10,064,966 1.14 7579 27,500 78,643 63.1 0.0370
Shipper LFS short 5,883,728 0.67 1810 16,076 54,919 36.9 0.0347
Total 15,948,694 1.81
Figure 13: The Netherlands - Network users’ linepack flexibility service volumes
The data suggests a modest tendency for network users to be more frequently long than short.
4.4. Neutrality Both quantities and cash flows associated with TSO balancing and user imbalance are interrelated. The BAF therefore uses a range of indicators associated with neutrality that may yield insights into these interactions and to the overall financial effects of balancing regime functioning.
In this report, the net adjusted neutrality indicator35 has been selected for consideration. It indicates the net financial value per unit of market volume associated with all of the contributing cash flows arising from TSO balancing actions and user imbalance cash-outs. The value is adjusted to reflect the net
34 The linepack flexibility service (referred to as LFS in the table) charges network users a price which is charged on the quantity associated with the network user’s cumulative imbalance position at the end of each day. 35 A full description of this indicator is available in ACER’s Second Balancing Implementation Report, p. 78: https://acer.europa.eu/Official_documents/Acts_of_the_Agency/Publication/ACER%20Report%20on%20the%20implementation%20of%20the%20Balancing%20Network%20Code%20%28Second%20edition%29%20Volume%20I.pdf

A C E R B A L A N CI N G M O NI T O RI N G R E P O R T 2 0 1 9 / 20
Page 29 of 48
acquisition or disposal of gas over the year. It therefore provides an indication of the credit or cost accruing to network users associated with the operation of the balancing regime over the year.
Negative values imply that users face a cost. Positive values imply users receive a credit. Both high and low net adjusted neutrality might warrant further study. However, it is far too simplistic to assess high credits as being good, or that higher costs are necessarily bad. Outliers warrant particular attention to ensure that the reasons for the outcome are known. Outcomes should be consistent with policy objectives, otherwise it might be desirable to contemplate the reform of the regime.
4.4.1. Key neutrality indicator
The interactions within the balancing regime manifest in net costs or revenues that are either charged or credited to network users via neutrality. The following graph considers the key neutrality indicator, which indicates the net revenue per unit of throughput in the system. Thus, outcomes ‘above the line’ imply revenues (i.e. cash generation) within the system, whereas ‘below the line’ implies net costs that will be charged to network users.
Figure 14: Net adjusted neutrality as a share of market volume
From this graph, the following can be observed:
• Greece (EL) has been included in the analysis for the first time and has not been subject of any detailed analysis. The net adjusted neutrality indicator looks higher than might have been expected and this effect might be connected with the early days of market development, although greater scrutiny by the NRA/TSO in response to this report and its findings might be helpful.
• Slovenia (SI) has a substantial neutrality credit, implying a refund to network users. This may be attributable to exceptionally wide differentials between imbalance cash-out long and short positions and major price differentials associated with TSO purchases and disposals associated with its balancing actions. The interactions and consequences warrant further consideration.
• Romania (RO) sees an indicator value that might warrant further study. Both TSO balancing and imbalance cash-outs display more purchases by the settlement agent than sells, which leads to a net neutrality cost and cost to network users. The net adjusted neutrality indicator already reflects a revenue when the correction for the net volume has been taken into account.
• United Kingdom-Northern Ireland (UK-NI) also displays an apparent credit but this may be a consequence of the high price associated with balancing services gas buys, which may unduly influence the net adjusted neutrality calculation.
-0.08
-0.04
0.00
0.04
0.08
0.12
BELU
X-H
BELU
X-L CZ
DE-
GPL
DE-
NCG
DK-
SE EL ESFR
-TRF H
RH
U IE IT LTLV
-EE NL
PL-H RO SI SK
UK-
GB
UK-
NI
EUR/
MW
h
A C E R B A L A N CI N G M O NI T O RI N G R E P O R T 2 0 1 9 / 20
Page 30 of 48
• The two largest costs identified relate to the two German zones. The costs identified here represent an understatement of the costs of more than EUR 40 million in each zone, because the fixed costs of some balancing services costs are not included in the analysis. However, it would be wrong to conclude that the performance is poor without considering wider factors. The German balancing model uses the variant 2 NDM option, whereby that load is balanced against a DA target. This reduces burden on network users, who do not need to track these demands in any way during the gas day. Thus, the approach reduces costs and risks for network users but with an inevitable cost that is apparent via the neutrality charge, which results in a much higher market activity of the market area manager, which includes the costs associated with the balancing of the NDM sector. Such an approach is justified if the benefits of it are larger than the additional costs generated by the increase of the market area manager’s costs embedded in the neutrality costs.
4.4.2. Neutrality conclusions
The full set of neutrality indicators inform assessment of the overall interactions and resultant cash flows in the balancing regime. Neutrality provides a useful start point to analyse visible costs in the regime. Excessively high or low net adjusted neutrality rates warrant particular attention.
Analysis of the net neutrality and net adjusted neutrality are likely to point at issues with the interactions between prices and quantities associated with TSO balancing actions and imbalance cash-out.
However, any analysis of these visible costs does not inform of the underlying costs of balancing, which might be internalised within network users’ businesses.
NRAs and TSOs should be aware that these hidden costs exist. These are likely to exist where balancing regimes feature WD obligations that imply a very tight management of flows or where there are large imbalance cash-out exposures. These might drive unwarranted costs into network users’ businesses unless the WD obligations or high cash-out differentials are duly justified.
This links to the amount of linepack flexibility that might be available and how this is made available to network users to access. Thus, NRAs and the market need to understand, to what extent network users have access to the inherent flexibility of the market and whether that is reasonably and efficiently made available to users within the operational limits of the transmission system.
4.5. Linepack The BAF features a number of indicators associated with physical linepack positions. The operation of the commercial regime and physical system are interlinked. These matters have been explored in earlier reports and in interactions with wider stakeholders, including at workshops associated with the Agency’s Balancing Code monitoring. A key idea within the Balancing Code is that users should have access to system flexibility where it is economically reasonable to provide that flexibility.
Many TSOs/NRAs have been reluctant to provide linepack data to support the BAF. Less than half of the respondents delivered linepack information to support this year’s work. Furthermore, some data submissions were incomplete and included missing values, making their processing and interpretation difficult.
Data should be compared with the outcomes implied by the indicators associated with TSO balancing buys/sells and imbalance cash-out of network user long/short positions. These comparisons are vital to understand whether network users have appropriate access to system flexibility and how the TSO might be using network flexibility behind the scenes.
The Agency has provided a limited linepack analysis in Annex 5.

A C E R B A L A N CI N G M O NI T O RI N G R E P O R T 2 0 1 9 / 20
Page 31 of 48
4.5.1. Linepack conclusions
Understanding linepack variation and its relationship with commercial balancing regime functioning is important to assess the efficiency of the balancing regime. In future years, this warrants a more careful consideration and we request that NRAs and TSOs prepare in time to supply the data to support this endeavour.

A C E R B A L A N CI N G M O NI T O RI N G R E P O R T 2 0 1 9 / 20
Page 32 of 48
5. Conclusions and next steps This report captures efforts to systematise the BAF to better facilitate assessment of individual balancing regime performance and cross-balancing regime comparison.
The work and insights depend on consistency and accuracy of underlying data inputs. A meaningful interpretation requires robust underlying data inputs and an understanding of the choices made in the balancing regime implementation.
The analysis of indicators exposed many underlying issues, particularly with the new zones being assessed for the first time. However, a deeper understanding would require exploration with NRAs/TSOs.
The application of the BAF may help NRAs consider whether the national balancing regimes require refinement. It should not be assumed that key regime parameters (e.g. small adjustment in imbalance cash-out pricing, the performance of the information systems) should remain unchanged. As the market evolves, there may be opportunities to refine the design and/or certain parameters to deliver more efficient outcomes.
There may be merit in considering a more comprehensive review of individual balancing regime effectiveness in future years. This may involve three critical elements:
• Providing the full range of data inputs, including linepack;
• Ensuring the accuracy of the underlying data;
• Interacting with NRAs/TSOs to ensure a full understanding of the local market status and the specificities of individual regime implementations.
The Agency welcomes feedback on this report and solicits views about what next steps should be considered within its upcoming work programme.

A C E R B A L A N CI N G M O NI T O RI N G R E P O R T 2 0 1 9 / 20
Page 33 of 48
Annex 1: Balancing zones analysed Table 5: Balancing zones analysed
Balancing zone list Description Comments
BELUX-H Belgium-Luxembourg high-calorific High-calorific part of the Belgium/Luxembourg system
BELUX-L Belgium-Luxembourg low-calorific Low-calorific part of the Belgium/Luxembourg system
CZ Czech Republic
DE-GP Germany - GasPool
DE-NCG German - NetConnectGermany
DK-SE Denmark-Sweden Denmark and Sweden's integrated balancing zone analysed
ES Spain
FR-TRF France - Trading Region France The full French balancing zone has been considered
GR Greece
HR Croatia
HU Hungary
IE Ireland
IT Italy
LT Lithuania
LV-EE Latvia-Estonia Joint balancing created on 1 January 2020
NL Netherlands
PL-H Poland high-calorific For GY 2019/20 only the Polish high-calorific balancing zone is being analysed
RO Romania Only data relating to Romanian national transmission system balancing zone has been considered
SI Slovenia
SK Slovakia
UK-GB United Kingdom - Great Britain
UK-NI United Kingdom - Northern Ireland

A C E R B A L A N CI N G M O NI T O RI N G R E P O R T 2 0 1 9 / 20
Page 34 of 48
Annex 2: Indicator values Table 6: TSO balancing actions
BELUX-H BELUX-L CZ DE-GPL DE-NCG DK-SE EL ES FR-TRF HR HU IE IT LT LV-EE NL PL-H RO SI SK UK-GB UK-NI
Total balancing
action quantities
GW h 1,604 408 1,488 11,812 40,332 123 1,329 2,410 1,920 416 1,243 348 16,600 15 361 3,179 1,673 1,131 314 223 5,025 83
Total balancing
action quantities
% of Zone Entry 0.36 0.35 0.52 1.12 4.95 0.30 1.91 0.63 0.27 1.18 0.52 0.45 2.26 0.03 1.07 0.36 0.71 0.85 1.73 0.03 0.55 0.52
Total balancing buy action quantities
% of Buy & Sell
Quantities 49.5 60.9 45.5 46.9 52.6 54.2 55.4 56.5 26.6 40.3 38.4 5.3 71.5 100.0 6.6 52.0 44.9 78.0 23.8 24.5 73.9 61.4
Balancing action days
Sum of Buy and Sell
Days 386 367 159 284 693 39 217 89 106 111 100 121 187 205 109 174 563 305 129 14 200 51
Balancing action days
Number of days 366 366 152 264 364 39 213 89 95 111 100 120 186 205 109 159 366 277 129 13 199 51
Average price of
buys EUR/MWh 9.88 11.52 8.85 12.55 12.04 11.55 21.89 13.10 9.43 16.14 13.88 14.20 11.40 14.55 9.28 12.66 13.60 14.79 13.38 11.52 10.80 11.46
Average price of
sells EUR/MWh 8.35 8.56 8.29 6.12 8.46 9.80 5.28 8.45 7.42 9.02 10.39 8.69 9.88 0.00 7.58 8.04 10.30 10.98 7.80 11.58 8.77 8.41
TSO buy-sell spread EUR/MWh 1.53 2.96 0.56 6.43 3.58 1.75 16.61 4.65 2.01 7.12 3.49 5.50 1.52 1.70 4.62 3.29 3.82 5.58 -0.06 2.03 3.05

A C E R B A L A N CI N G M O NI T O RI N G R E P O R T 2 0 1 9 / 20
Page 35 of 48
Table 7: Network users’ imbalance cash out
BELUX-H BELUX-L CZ DE-GPL DE-NCG DK-SE EL ES FR-TRF HR HU IE IT LT LV-EE NL PL-H RO SI SK UK-GB UK-NI
Total imbalance quantities
GW h 3,762 829 1,939 5,507 6,066 4,356 3,706 11,315 13,090 1,371 3,992 1,392 67,231 54 451 0 3,227 6,100 508 218 27,350 390
Total imbalance quantities
% of Zone Entry 0.85 0.72 0.67 0.52 0.74 10.54 5.33 2.96 1.86 3.88 1.68 1.81 9.16 0.09 1.34 0.00 1.38 4.60 2.79 0.03 2.99 2.41
Total short positions
% of Short and Long Quantities
47.2 53.4 46.5 48.8 56.9 49.9 51.5 51.8 49.4 46.8 46.8 29.8 55.5 46.3 17.5 0.0 48.2 49.1 34.7 23.0 50.0 47.0
Average price short positions EUR/MWh 9.05 10.31 8.92 10.49 11.27 9.99 15.81 10.42 9.72 15.55 12.11 9.61 11.01 15.42 9.47 0.00 13.38 13.95 15.11 11.50 9.81 10.47
Average price long positions EUR/MWh 8.33 8.67 8.74 7.81 7.70 9.92 6.15 9.42 8.85 13.13 10.57 8.63 10.37 11.32 8.03 0.00 9.95 11.62 7.36 11.28 9.17 8.19
Imbalance buy-sell spread
EUR/MWh 0.72 1.64 0.18 2.69 3.57 0.07 9.66 1.00 0.86 2.42 1.54 0.98 0.65 4.10 1.44 0.00 3.42 2.33 7.75 0.21 0.64 2.28

A C E R B A L A N CI N G M O NI T O RI N G R E P O R T 2 0 1 9 / 20
Page 36 of 48
Table 8: Neutrality
BELUX-H BELUX-L CZ DE-GPL DE-NCG DK-SE EL ES FR-TRF HR HU IE IT LT LV-EE NL PL-H RO SI SK UK-GB UK-NI
Gross energy
transacted GW h 5,366 1,238 3,427 17,319 46,399 4,479 5,035 13,725 15,011 1,787 5,235 1,740 83,831 70 812 3,179 4,900 7,230 822 441 32,375 473
Net neutrality
Expressed as
EUR/MWh over
market volume
-0.0036 -0.0025 -0.0010 -0.0237 -0.0916 -0.0034 0.0876 0.0017 0.0141 -0.0018 0.0062 -0.0240 0.0158 -0.0028 0.0028 -0.0098 0.0146 -0.0353 0.0602 0.0000 -0.0216 -0.0055
Net adjusted neutrality
EUR/MWh over
market volume
0.0004 0.0003 -0.0010 -0.0289 -0.0762 0.0010 0.0937 -0.0006 0.0044 0.0009 0.0047 0.0052 0.0128 0.0016 -0.0020 -0.0083 0.0120 0.0377 0.0550 0.0001 0.0035 0.0191
Maximum cumulative neutrality position
kEUR 157 66 329 384 0 1,290 6,096 1,448 10,031 621 2,221 173 13,169 5 93 0 3,763 0 1,140 372 0 110
Minimum cumulative neutrality position
kEUR -1,905 -380 -457 -57,765 -102,298 -836 -144 -3,697 0 -205 -377 -1,877 -10,030 -164 -302 -9,291 -116 -10,221 -57 -22 -24,868 -177

Page 37 of 48
Annex 3: Finnish data submission The following depicts the data received in respect of the Finnish balancing zone.
Figure 15: Finland - TSO balancing actions
Table 9: Finland - TSO balancing actions
FI Annual quantity
Share of annual market
Number of days
Av erage daily
quantity
Max daily
quantity
Share of activ ity
Av erage price
MWh % days MWh MWh % EUR/MWh
System buys 360 0.002 27 13 100 38.8 15.31
System sells 568 0.003 29 20 100 61.2 7.82
Total 928 0.005 56
Figure 16: Finland - Network users’ imbalance cash out
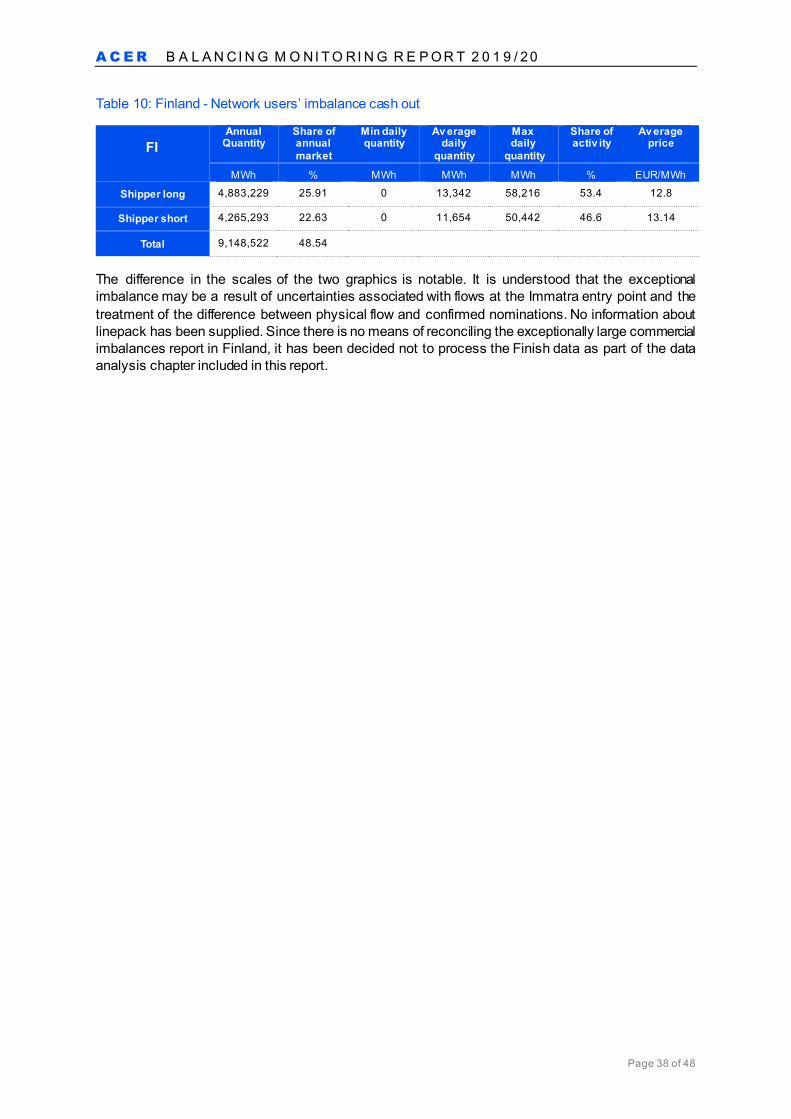
A C E R B A L A N CI N G M O NI T O RI N G R E P O R T 2 0 1 9 / 20
Page 38 of 48
Table 10: Finland - Network users’ imbalance cash out
FI Annual
Quantity Share of annual market
Min daily quantity
Av erage daily
quantity
Max daily
quantity
Share of activ ity
Av erage price
MWh % MWh MWh MWh % EUR/MWh
Shipper long 4,883,229 25.91 0 13,342 58,216 53.4 12.8
Shipper short 4,265,293 22.63 0 11,654 50,442 46.6 13.14
Total 9,148,522 48.54
The difference in the scales of the two graphics is notable. It is understood that the exceptional imbalance may be a result of uncertainties associated with flows at the Immatra entry point and the treatment of the difference between physical flow and confirmed nominations. No information about linepack has been supplied. Since there is no means of reconciling the exceptionally large commercial imbalances report in Finland, it has been decided not to process the Finish data as part of the data analysis chapter included in this report.

A C E R B A L A N CI N G M O NI T O RI N G R E P O R T 2 0 1 9 / 20
Page 39 of 48
Annex 4: Bulgarian data submission The following explores some issues associated with the Bulgarian data submission. The Bulgarian TSO wanted to be featured in the report and so this appendix is used to provide some insights into the Bulgarian case. It is also used to highlight some general issues associated with underlying data quality and that poor quality information provision may diminish the value of comparators based on BAF indicators.
Bulgaria’s first data submission included information about TSO balancing actions, although no prices were included. Without price information, the BAF cannot be meaningfully applied.
In a later submission, pricing information was received.
Data processing Background: data processing
It is essential that accurate information is available to support the derivation of the indicators. Thus, it is essential that the data inputs are standardised. Values submitted should be based on a common definition for each data item, shall be submitted in the same units to be then processed internally within ZEN using a consistent approach to derive quantities, prices and cash flows.
Quantities (referred to as volumes measured in MWh) can only have positive values. Whilst normally prices would be expected to have positive values, it is conceivable that prices could go negative. Indeed, we have that circumstance this year in the Netherlands data, where the value of gas went negative in respect of some balancing actions.
The processing of data within the ZEN upload may amend data as part of initial processing. For example, data submissions for imbalance short position quantities are generally declared as negative values. The ZEN processing will reset full data sets, where all values are negative by resetting them to positive values. This approach has been implemented to avoid the risks of manually processing data and inadvertently introducing errors into the database. The calculation logic reflects the direction of cash flows into or out of neutrality when it is calculating indicators.
Bulgarian data
The Bulgarian TSO balancing data has been supplied in a number of blocks representing the tools available to the TSO and transactions available for the national system, and separately the transit, system. For both balancing zones WD title products are identified and of two distinct types (public tender and trading platform). All TSO sell volumes (expressed in MWh/day) associated with public tender transactions have been identified as negative. However, TSO sell volumes associated with the trading platform have been identified as positive. For TSO buy, most volumes are expressed as positive but the series features a negative element. There were no TSO transactions involving buys on the trading platform.
It is presumed that the data has been supplied on an inconsistent basis and so all negative values including those that are inconsistent within the subset, e.g., the negative quantity associated with 21 July of -972.065 MWh, have been converted to positives. Not to intervene would likely mean error in the indicators, but to intervene means that there is risk that perhaps the positive/negative quantity delineation might have a meaning in Bulgaria, that has not been understood and hence reflected in the underlying data.

A C E R B A L A N CI N G M O NI T O RI N G R E P O R T 2 0 1 9 / 20
Page 40 of 48
ZEN indicators derived from national balancing zone data
The basic ZEN indicators are displayed in tabular form:
Table 11: Bulgarian national zone – TSO balancing actions
BG-N
Annual quantity
Share of annual market
Number of days
Av erage daily
quantity
Max daily
quantity
Share of activ ity
Av erage price
MWh % days MWh MWh % EUR/MWh
System buys 475,788 0.96 291 1,635 12,932 79.2 16.67
System sells 125,229 0.25 116 1,080 9,510 20.8 11.00
Total 601,017 1.21 366
Table 12: Bulgarian national zone – Network users’ imbalances
BG-N
Annual quantity
Share of annual market
Min daily quantity
Av erage daily
quantity
Max daily
quantity
Share of activ ity
Av erage price
MWh % MWh MWh MWh % EUR/MWh
Shipper long 625,892 1.26 33 1,710 13,105 72.4 13.91
Shipper short 238,835 0.48 0 653 10,022 27.6 14.56
Total 864,727 1.74
Table 13: Bulgarian national zone – Neutrality
BG-N Quantities Cash flows Relativ e share
MWh kEUR %
Financial credits to neutrality
TSO system sells 125,229 1,378 28
Network user imbalance shorts 238,835 3,478 72
Sub-total 364,065 4,856
Financial debits to neutrality
TSO system buys 475,788 7,930 48
Network user imbalance longs 625,892 8,705 52
Sub-total 1,101,680 16,635
Net -737,615 -11,779
Net neutrality per unit of market v olume -0.2373 EUR/MWh
Net adjusted neutrality per unit of market v olume -0.0194 EUR/MWh

A C E R B A L A N CI N G M O NI T O RI N G R E P O R T 2 0 1 9 / 20
Page 41 of 48
Understanding the above may be assisted by looking at daily summary data as illustrated in the following:
Figure 17: Bulgarian national zone – TSO balancing actions by day
This graphic confirms the considerable asymmetry with far more buys than sells. It also indicates rare occasions, associated with a few days, where atypical volumes are required by the TSO.
The following provides further insight into the imbalance quantities of all network users:
Figure 18: Bulgarian national zone – Network users’ imbalance cash out
The above graphics imply that on 1 January the system buys (i.e. purchases of gas that would be expected to increase linepack in the system) were 12,932 MWh, whereas the aggregate position of network users was long to an extent of 13,107 MWh. Furthermore, on 26 June, system sells (which would be expected to reduce linepack) amounted to 9,510 MWh, whereas the aggregate position of network users was short to the extent of 10,022 MWh. It is unclear whether the data relating to quantities can therefore, be considered robust.
The aspiration of the Balancing Code is that the commercial framework is designed to provide an incentive each day to ensure that network users are close to a balanced position on each day. The idea is that a daily average price will set a marker about which imbalances will be settled. The short positions should attract a cash-out at slightly higher than the daily market value of flexible gas, whereas long positions would attract a cash-out at slightly less than the daily market value of flexible gas. This way, network users are incentivised financially to achieve a daily balance.

A C E R B A L A N CI N G M O NI T O RI N G R E P O R T 2 0 1 9 / 20
Page 42 of 48
To understand effectiveness it is therefore important to look a little deeper at the regime functioning.
In the case of the Bulgarian national zone, cash-out price levels are illustrated in the following graphic:
Figure 19: Bulgarian national zone – weighted average prices and cash-out prices
The graphic indicates that generally imbalance cash-out prices seem to be derived on a monthly basis rather than on a daily basis. Furthermore, the weighted average price (WAP) supplied in the dataset, is expected to be the daily reference price used for cash-out price determination. It is expected to be the average price of gas traded on the day. It is unclear how the cash-out prices are formed. The data does not suggest that supply/demand fundamentals are generating a market based price. However, the same cash-out prices seem to be reflected in both the national and transit zones. Curiously, both zones have substantial domestic volumes and for each zone the market volume is broadly consistent with the domestic volumes.
Inspection of the TSO balancing action data indicates that the trading platform was used for the first time on 24 July and that only sells are observed in the data. Throughout the year, including after use of the trading platform started, public tenders have been used for both TSO balancing action sell and buy activity. However, it is clear that whilst some of these transactions are being used to set the marginal prices for cash-out, this is not always the case.
Having completed this analysis, it was decided to exclude Bulgaria from the detailed comparators in Chapter 4.

A C E R B A L A N CI N G M O NI T O RI N G R E P O R T 2 0 1 9 / 20
Page 43 of 48
Annex 5: Linepack The following depicts some of the linepack indicators derived under the BAF for the 10 zones36 covered in Chapter 4.
Table 14: Linepack indicators
CZ DE-NCG DK-SE ES FR-TRF HU IT RO SI UK-GB
Average linepack GWh 1,658 3,339 244 2,848 3,311 731 5,702 560 16 3,855
Max linepack GWh 1,771 3,912 265 2,978 3,603 804 6,144 628 26 4,041
Min linepack GWh 1,503 0 204 2,719 3,067 675 5,249 404 0 3,660
Average absolute daily
charge GWh 17.7 118.5 4.6 18.5 28.0 7.7 37.6 7.6 1.2 16.5
Average absolute
% of average 1.1 3.6 1.9 0.7 0.8 1.0 0.7 1.4 7.9 0.4
Range/ Average % 16.1 117.2 25.0 9.1 16.2 17.7 15.7 39.9 166.
4 9.9
Whilst no detailed analysis has been completed, the following comments are offered:
• Linepack levels will be heavily influenced by a combination of the size of the network and its topography;
• Linepack in the system represents the amount of gas in the system and will be a function of operating pressures applying at any time;
• Linepack levels must be maintained within an acceptable operational envelope. Sufficient gas must be available in the system to support the delivery of offtake pressures out of the system. However, too much gas can give rise to an over-pressurised system;
• From a balancing perspective, the critical issue is to maintain the system within an acceptable and efficient operational envelope37 whilst not imposing any undue flow matching requirement on the network user community;
• The linepack data captured relates to opening linepack at the start of each gas day and so provides some indication of the variability observed within current operation of the balancing regime; it does not offer any insights into how linepack levels might vary within the day;
• Missing data can distort the calculation of indicators;
• Daily linepack changes can be compared with the differences between the net position arising from the four aggregated daily quantities associated with TSO balancing action buys and sells and network users long and short imbalance positions. However, such comparisons will not take account of other changes which might arise from other sources, e.g., other TSO activities that might impact linepack levels, or the effects of other stock changes (e.g. distribution system stock changes that are not captured within the linepack value);
36 ACER notes that many NRAs and TSOs are reluctant to supply l inepack data and that less than half of the zones considered in Chapter 4 included linepack data. 37 See explanation provided in https://www.acer.europa.eu/Events/ACER-Workshop-on-Within-Day-Obligations-In-the-context-of-Gas-Balancing-Code-implementation/Documents/slides.pdf

A C E R B A L A N CI N G M O NI T O RI N G R E P O R T 2 0 1 9 / 20
Page 44 of 48
• The Agency remains of the view that there is merit in gathering linepack data for analysis and continues to encourage NRAs and TSOs to compare the differences between the commercial flows associated with the operation of the balancing implementation and the actual physical changes that take place in the system, as seen within the linepack.

A C E R B A L A N CI N G M O NI T O RI N G R E P O R T 2 0 1 9 / 20
Page 45 of 48
Annex 6: List of abbreviations Table 15: List of abbreviations
Abbreviation Meaning
ACER European Union Agency for the Cooperation of Energy Regulators
BAF Balancing Analytical Framew ork
BAL NC Balancing Netw ork Code
COVID-19 Severe acute respiratory syndrome coronavirus 2 (SARS-CoV-2)
DA Day-ahead
ENTSOG European Netw ork of Transmission System Operators for Gas
EU European Union
EUR Euro
GWh Gigaw att hour
IMB Imbalance
IT Information Technology
kEUR Thousands of Euros
LFS Linepack f lexibility service
LNG Liquefied natural gas
MAX Maximum
MIN Minimum
MWh Megaw att hour
NDM Non-daily metered
NRA(s) National Regulatory Authority(ies)
STSP(s) Short-term standardised product(s)
TSO(s) Transmission System Operator(s)
TWh Teraw att hour
VOL Volume
VTP Virtual trading point
WAP Weighted average price
WD Within day
ZEN Central Information Technology System for hosting daily balancing data

A C E R B A L A N CI N G M O NI T O RI N G R E P O R T 2 0 1 9 / 20
Page 46 of 48
List of Figures Figure 1: Market versus domestic volumes ..............................................................................16 Figure 2: Total balancing action quantities as a share of market volume .......................................18 Figure 3: Total balancing buy action quantities as a share of total buy & sell quantities ...................19 Figure 4: Number of days when balancing actions took place .....................................................20 Figure 5: Average buy-sell price spread of TSO balancing gas....................................................21 Figure 6: Average TSO balancing gas buy-sell spread ...............................................................22 Figure 7: Total imbalance quantities as a share of market volume ...............................................23 Figure 8: Average imbalance cash out prices ...........................................................................24 Figure 9: Average buy-sell spread on imbalance cash out prices .................................................24 Figure 10: Slovenia - Network users’ imbalance cash out ...........................................................26 Figure 11: Slovenia - Daily imbalance cash out pricing...............................................................26 Figure 12: The Netherlands -TSO balancing actions..................................................................27 Figure 13: The Netherlands - Network users’ linepack flexibility service volumes ...........................28 Figure 14: Net adjusted neutrality as a share of market volume ...................................................29 Figure 15: Finland - TSO balancing actions..............................................................................37 Figure 16: Finland - Network users’ imbalance cash out.............................................................37 Figure 17: Bulgarian national zone – TSO balancing actions by day.............................................41 Figure 18: Bulgarian national zone – Network users’ imbalance cash out......................................41 Figure 19: Bulgarian national zone – weighted average prices and cash-out prices ........................42

A C E R B A L A N CI N G M O NI T O RI N G R E P O R T 2 0 1 9 / 20
Page 47 of 48
List of Tables Table 1: Product types used during the analysis period..............................................................17 Table 2: Slovenia - Network users’ imbalance cash out .............................................................27 Table 3: The Netherlands - TSO balancing actions....................................................................27 Table 4: The Netherlands - Linepack flexibility service ...............................................................28 Table 5: Balancing zones analysed.........................................................................................33 Table 6: TSO balancing actions..............................................................................................34 Table 7: Network users’ imbalance cash out.............................................................................35 Table 8: Neutrality ................................................................................................................36 Table 9: Finland - TSO balancing actions ................................................................................37 Table 10: Finland - Network users’ imbalance cash out..............................................................38 Table 11: Bulgarian national zone – TSO balancing actions........................................................40 Table 12: Bulgarian national zone – Network users’ imbalances ..................................................40 Table 13: Bulgarian national zone – Neutrality ..........................................................................40 Table 14: Linepack indicators ................................................................................................43 Table 15: List of abbreviations ...............................................................................................45

A C E R B A L A N CI N G M O NI T O RI N G R E P O R T 2 0 1 9 / 20
Page 48 of 48