ACCELERATING MDGs ACHIEVEMENT IN ACEH (2011- 2015) PEMERINTAH ACEH.
ACEH PUBLICEXPENDITURE ANALYSIS SPENDING FOR RECONSTRUCTION AND POVERTY REDUCTION
38417P
ublic
Dis
clos
ure
Aut
horiz
edP
ublic
Dis
clos
ure
Aut
horiz
edP
ublic
Dis
clos
ure
Aut
horiz
edP
ublic
Dis
clos
ure
Aut
horiz
edP
ublic
Dis
clos
ure
Aut
horiz
edP
ublic
Dis
clos
ure
Aut
horiz
edP
ublic
Dis
clos
ure
Aut
horiz
edP
ublic
Dis
clos
ure
Aut
horiz
ed
THE WORLD BANK OFFICE JAKARTAJakarta Stock Exchange Building Tower II/12th Fl.Jl. Jend. Sudirman Kav. 52-53Jakarta 12910Tel: (6221) 5299-3000Fax: (6221) 5299-3111Website: http://www.worldbank.org/id
THE WORLD BANK 1818 H Street N.W.Washington, D.C. 20433, U.S.A.Tel: (202) 458-1876Fax: (202) 522-1557/1560Email: [email protected]: http://www.worldbank.org

ACEH PUBLIC EXPENDITURE ANALYSISSPENDING FOR RECONSTRUCTION AND POVERTY REDUCTION

ACEH PUBLIC EXPENDITURE ANALYSISSPENDING FOR RECONSTRUCTION AND POVERTY REDUCTION
iii
Acknowledgments
This Aceh Public Expenditure Analysis (APEA) is a collaboration between the World Bank and four Acehnese universities: Syiah Kuala University and IAIN Ar-Raniry (Banda Aceh), Malikul Saleh University, and Politeknik University (Lhokseumawe). This report was prepared by a core team led by Oleksiy Ivaschenko, Ahya Ihsan, and Enrique Blanco Armas, together with Cut Dian Rahmi and Eleonora Suk Mei Tan. The core team also included Patrick Barron, Cliff Burkley, John Cameron, Taufi q C. Dawood, Guy Janssen, Rehan Kausar, Harry Masyrafah, Sylvia Njotomihardjo, Peter Rooney, and Chairani Triasdewi. Syamsul Rizal (Syiah Kuala University) coordinated local partners, and Djakfar Ahmad provided outreach to members of provincial and local governments. Wolfgang Fengler supervised the APEA process and production of this report.
Andrew Steer (Country Director), together with Victor Bottini (Resident Representative in Aceh), Joel Hellman (Chief Governance Advisor and Aceh Coordinator), and Scott Guggenheim (Lead Social Development Specialist), provided overall guidance throughout the process.
The larger team contributing to the preparation of this report consisted of Nasruddin Daud and Ir. Sufi i; valuable comments were provided by Owen Podger; from the World Bank: Francisco Javier Arze del Granado, Andre Bald, Maulina Cahyaningrum, Ahmad Zaki Fahmi, Alicia J. Hetzner, Indra Irnawan, Bambang Suharnoko, Juliana Wilson, Bastian Zaini, Sabine Joukes; and the following university teams:
Syiah Kuala University (Banda Aceh). Razali Abdullah, Zinatul Hayati, Teuku M. Iqbalsyah, Fadrial Karmil, Yahya Kobat, Jeliteng Pribadi, Yanis Rinaldi, Agus Sabti, Yunus Usman, and Teuku ZulhamIAIN Ar-Raniry (Banda Aceh). Fakhri YacobMalikul Saleh University (Lhokseumawe). Wahyudin Albra, Jullimursyida Ganto, and Andria Zulfa Polytechnic Lhokseumawe (Lhokseumawe). Riswandi and Indra Widjaya
Photographs taken by Kristin Thompson except ‘Polindes in Kecamatan Padang Tiji, Kab. Pidie’ by World Bank staff .
The APBD (regional budget) data was gathered and processed by Nova Idea, Sidra Muntahari, Ridwan Nurdin, Cut Yenizar, Miftachuddin, and Akhiruddin (GeRAK). The Public Financial Management (PFM) Survey in Aceh was implemented by the the Local Government Support Program (LGSP) (USAID) team led by Philip Schwehm and Andrew Urban. Peter Rooney coordinated this work for the World Bank. The Governance and Decentralization Survey (GDS) in 10 districts in Aceh was implemented by the World Bank and coordinated by Daan Pattinasarany. Peer reviewers are Islahuddin and Raja Masbar (Syiah Kuala University); and John Clark and Kai Kaiser (World Bank).
Last, but not least, the team thanks the acting Governor of Aceh Government, Dr. Ir. Mustafa Abubakar, M.Si, his staff , as well as staff at the Rehabilitation and Reconstruction Agency (BRR), led by Amin Subekti for their support of the APEA initiative. The team of advisors to the Governor as well as staff of the BRR provided valuable comments during the process. Financial support was provided by the Decentralization Support Facility and the Singapore Trust Fund.
ACEH PUBLIC EXPENDITURE ANALYSISSPENDING FOR RECONSTRUCTION AND POVERTY REDUCTION
iv
Acronyms, Abbreviations, and Non-English TermsAdat Social custom or tradition
ADB Asian Development Bank
AMDAL (Analisis Mengenai Dampak Lingkungan) Environment Impact Permit
AMM Aceh Monitoring Mission
APBD (Anggaran Pendapatan dan Belanja Daerah) Regional Government Budget
APBN (Anggaran Pendapatan dan Belanja Negara) State Budget
APEA Aceh Public Expenditure Analysis
ARI Acute Respiratory Infection
AusAid Australian Agency for International Development
Bappeda (Badan Perencanaan Pembangunan Daerah) Regional Development Planning Agency
Bappenas (Badan Perencanaan Pembangunan Nasional) National Development Planning Agency
BAKORNAS (Badan Koordinasi Nasional) National Disaster Management Board
BCG Bacillus of Calmette and Guerin
BKN (Badan Kepegawaian Negara) National Personnel Agency
BOS (Biaya Operasional Sekolah) Block grant from central government to schools to cover primary and junior school operational costs
BPD (Bank Pembangunan Daerah) regional Development Bank
BPHTB (Bea Perolehan Hak atas Tanah dan Bangunan) Land and Building Transfer Fee
BPK (Badan Pemeriksa Keuangan) National Auditing Agency
BPN (Badan Pertanahan Nasional) National Land Agency
BPR (Bank Perkreditan Rakyat) Rural Credit Bank
BPS-SK (Statistik Keuangan) Financial statistics from Indonesian National Statistics Offi ce
BQ (Baitul Qiradh) Syariah Financial Cooperative
BRA (Badan Reintegasi Aceh) Reintegration Agency for Aceh
BRR (Badan Rehabilitasi dan Rekonstruksi) Rehabilitation and Reconstruction Agency
Bupati Head of District
Camat Head of Subdistrict
CDA Community-driven adjudication
CDD Community-driven development
CFAN Coordination Forum for Aceh and Nias
CoHA Cessation of Hostilities Framework Agreement
CoSA Committee on Security Arrangements
CPI Consumer price index
CSO Civil society organization
Dana otsus (Dana Otonomi Khusus) special autonomy fund
DAK (Dana Alokasi Khusus) earmarked grant
D&L Damage and Loss
DAU (Dana Alokasi Umum) general allocation grants
DBH Revenue-Sharing
DBHDR Revenue-Sharing Reforestation Fund
DDR Disarmament Demobilization and Reintegration
ACEH PUBLIC EXPENDITURE ANALYSISSPENDING FOR RECONSTRUCTION AND POVERTY REDUCTION
v
Decon Deconcentration funds
Desa Village
Dinas Regional Sector Offi ce
DIPA (Daftar Isian Proyek Anggaran) issuance of spending authority
DOM (Daerah Operasi Militer) military operational area
DPRD (Dewan Perwakilan Rakyat Daerah) Provincial House of Representatives (regional parliaments)
DPT3 Combined vaccination against diphtheria: pertussis-whooping cough-tetanus
DSCR Debt Service Coverage Ratio
EEZ Exclusive Economic Zone
ERTR Emergency Response and Transitional Recovery
ETESP Earthquake and Tsunami Emergency Support Project
FGD Focus Group Discussions
FIRM Financial Intermediation and Mobilization
FM Financial Management
GAM (Gerakan Aceh Merdeka) Free Aceh Movement
GCF Gross Capital Formation
GDP Gross Domestic Product
GDS Governance and Decentralization Survey
GER Gross Enrollment Rate
GeRAK (Gerakan Rakyat Anti Korupsi) People’s Movement for Anti Corruption
GOI Government of Indonesia
GRDP Gross Regional Domestic Product
ha Hectare(s)
HDI Human Development Index
HH Households
IAIN (Institut Agama Islam Negeri) Public Islamic Institute
IDHS Indonesian Demographic and Health Survey
IDP Internally displaced person
ILO International Labour Organisation
IMR Infant Mortality Rate
INPRES (Instruksi Presiden) Presidential Instruction
IOM International Organization for Migration
IPTEK (Ilmu Pengetahuan dan Teknologi) Science and Technology
IRD International Relief and Development
JPK–Gakin (Jaminan Pemeliharaan Kesehatan-Keluarga Miskin) government health insurance for poor households
JPK-MM (Jaminan Pemeliharaan Kesehatan-Masyarakat Miskin) government health insurance for the poor
Kabupaten District (regency)
KDK (Komite Darurat Kemiskinan) emergency humanitarian committee
Kecamatan Subdistrict
Kelurahan Urban Village
Kepmen (Keputusan Menteri) Ministerial Decree
ACEH PUBLIC EXPENDITURE ANALYSISSPENDING FOR RECONSTRUCTION AND POVERTY REDUCTION
vi
Keppres (Keputusan Presiden) Presidential Decision
KERAP Elected local committee that is in charge of and monitors reconstruction
Kesbanglimas (Kesatuan Kebangsaan dan Perlindungan Masyarakat) regional agency in charge of social and political life in the community
Km Kilometer
Kota City (urban district)
LG Local Government
LGSP Local Government Support Program
LOGA Law on Government in Aceh
M&E Monitoring and Evaluation
MCFD Million Cubic Feet per Day
MDF Multi-Donor Fund
Mesjid Mosque
MoE Ministry of Environment
MoF Ministry of Finance
MoNE Ministry of National Education
MoRA Ministry of Religious Aff airs
MoU Memorandum of Understanding
MPW Ministry of Public Works
NAD (Nangroe Aceh Darussalam) Province of Aceh (formal name)
NBFI Nonbank fi nancial institution
NGO Nongovernmental Organization
O&M operations and maintenance
OCHA Offi ce for the Coordinator of Humanitarian Aff airs
PAD (Pendapatan Asli Daerah) Own-source revenue
PBB (Pajak Bumi dan Bangunan) Land and Building Tax
PDAM (Perusahaan Daerah Air Minum) Local water supply enterprise
PEACH Public Expenditure Analysis Capacity Harmonization
Perpu (Peraturan Pemerintah Penggati Undang-undang) regulation in lieu of law
Perda (Peraturan Daerah) Regional Regulation
Pesantren Islamic school
PFM Public Financial Management
PLN (Perusahaan Listrik Negara) the national electricity company
PMU Program Management Unit
PODES (Potensi Desa) BPS village potential statistics
Polindes (Pos Persalinan Desa) village maternity post
Posko (Pos Kordinasi) coordination post
PPS Proportional to Size
Puskesmas (Pusat Kesehatan Masyarakat) community health center at subdistrict level
Posyandu (Pusat Pelayanan Terpadu) integrated health services unit
Pustu (Puskesmas Pembantu) Subcommunity Health Center
Qanun Islamic Regional Regulation (term used only in Aceh)
ACEH PUBLIC EXPENDITURE ANALYSISSPENDING FOR RECONSTRUCTION AND POVERTY REDUCTION
vii
RALAS Reconstruction for Aceh Land Administration Project
Renja KL (Rencana Kerja Kementrian/Lembaga) ministry work plan
Renstra (Rencana Strategis) strategic plan
Renstra KL (Rencana Strategi Kementrian/Lembaga) ministry strategic plan
Renstra SKPD (Rencana strategis Satuan Kerja Perangkat Daerah) dinas work plan budget
RGPD Regional GDP
RKP (Rencana Kerja Pemerintah) government annual work plan
RKP-D (Rencana Kerja Pemerintah Daerah) regional government annual work plan
SD (Sekolah Dasar) primary school
SDI Surface Distress Index
SDO (Subsidi untuk Daerah Otonom) Subsidy for Autonomous Region
SE Small Enterprise
SIKD (Sistem Informasi Keuangan Daerah) Regional Finance Information System
SME Small/medium enterprise
SMP Junior high school
SPADA Support for Poor and Disadvantage Area
STR Student teacher ratio
Susenas (Survei Sosial Ekonomi Nasional) BPS national socioeconomic survey
Syariah Islamic law (Shari’a)TA Technical AssistanceUGM Universitas Gajah MadaUNDP United Nations Development ProgrammeUNICEF United Nations Children’s FundUSAID United States Agency for International DevelopmentWB World BankWBOJ World Bank Offi ce JakartaWUA Water Users Association
ACEH PUBLIC EXPENDITURE ANALYSISSPENDING FOR RECONSTRUCTION AND POVERTY REDUCTION
viii
Table of Contents
Executive Summary xiii
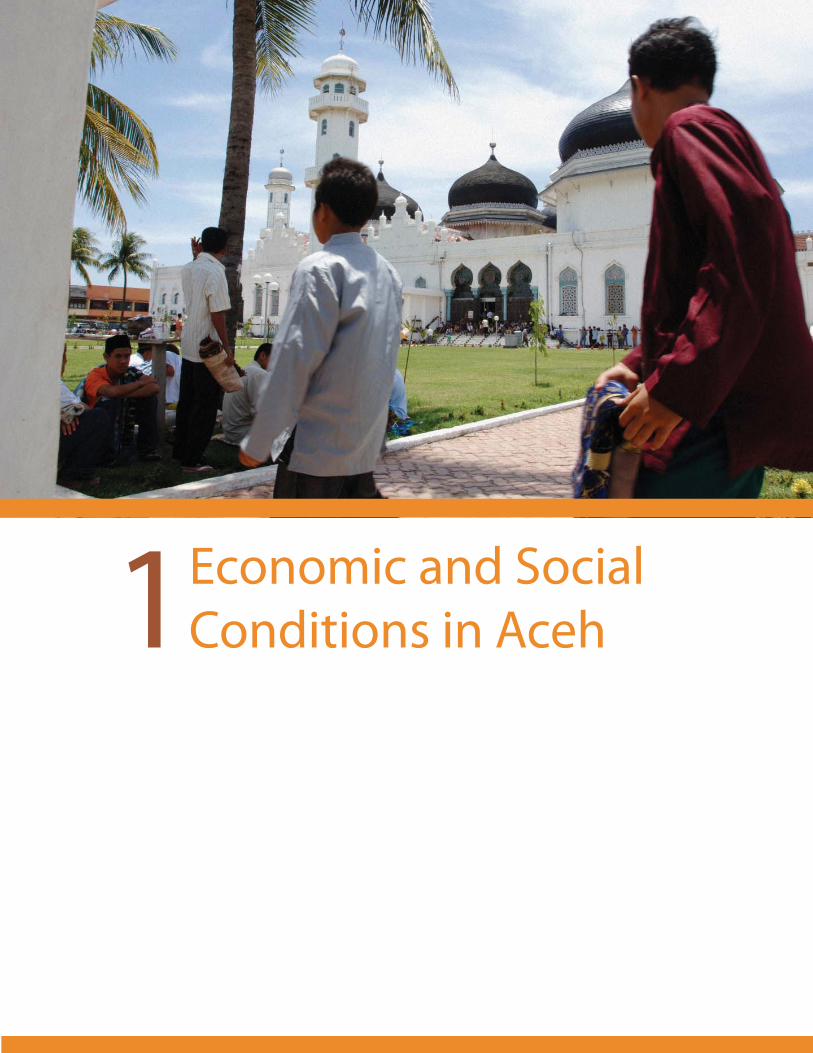
1. Economic and Social Conditions in Aceh 1
Historical Context 2
Confl ict and Its Impact on Development 3
Impact of the December 26, 2004 Tsunami 5
Aceh’s Economy 7
Poverty and Social Conditions 10
2. Fund Flows and Budget Processes 13
Budget Process 19
New Budget Format 20
3. Revenue and Financing 23
Revenue 24
Financing and Borrowing 43
Recommendations 45
4. Expenditures 47
Overview of Aceh’s expenditures 48
Routine vs. Development Expenditure 50
Expenditure on the Reconstruction Program 54
Recommendations 59
5. Sectoral Analyses with Recommendations 61
Health 62
Education 71
Infrastructure 82
6 . Local Governments’ Capacity to Manage Budget Funds 89
Decentralization: Local government’s workloads have increased in quantity and quality 90
Impact of the Confl ict and Tsunami on District Administrations 90
Administrative Capacity is Weak in General 91
Local Governments are not investing in increasing local capacities 94
District Leaders’ and Community Perceptions of the Key Issues in the Budget Process 95
Recommendations 96
Appendix A. Key Issues and Recommendations 98
Appendix B. Figures and Tables 101
Appendix C. Methodological Notes 109
Appendix D. Statistical Appendix 114
Boxes
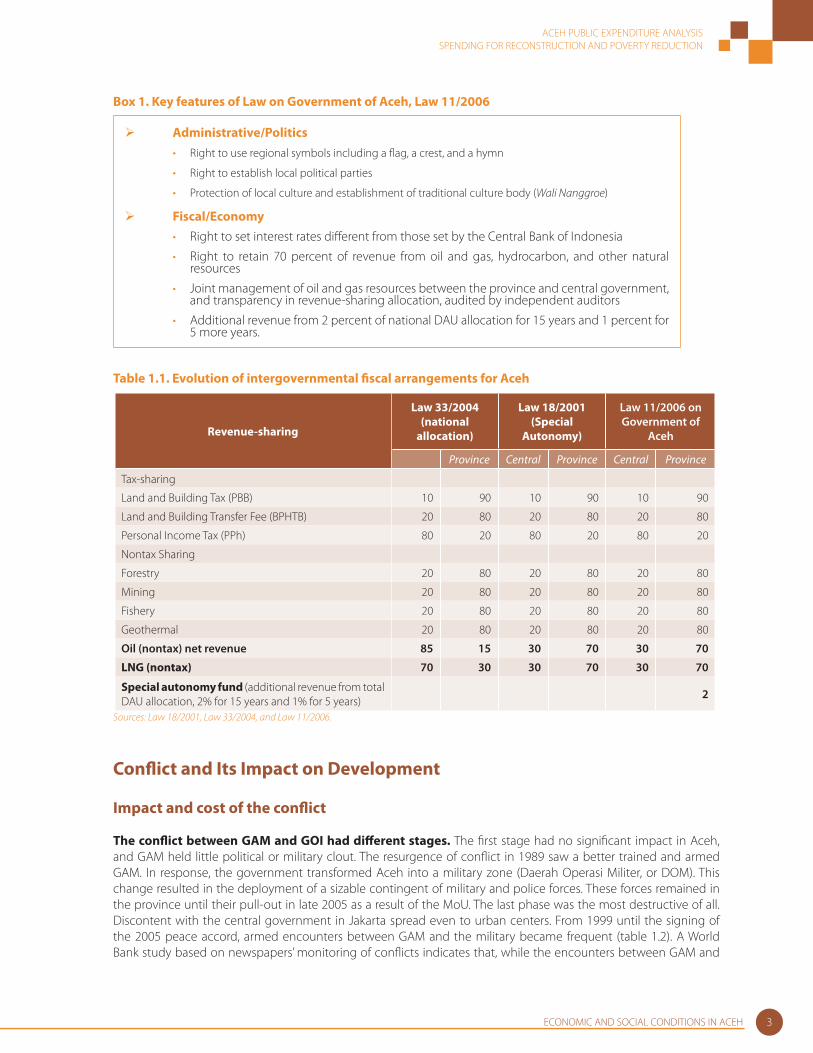
Box 1. Key features of Law on Government of Aceh, Law 11/2006 3
Box 2. Management and allocation of the Special Autonomy Fund from Law 18/2001 37

ACEH PUBLIC EXPENDITURE ANALYSISSPENDING FOR RECONSTRUCTION AND POVERTY REDUCTION
ix
Figures
Figure 1. Aceh’s fi scal resources have increased substantially, 1999–2006 xiii
Figure 2. Aceh has the third highest revenue per capita xiii
Figure 3. Aceh ranks fourth in poverty levels, and likely higher after the tsunami xiv
Figure 4. Reconstruction needs and commitments (US$ billion, end-June 2006) xv
Figure 5. New Aceh law provides substantial gains despite declining gas production xvi
Figure 6. Local governments have weak public fi nancial management capacity xvii
Figure 1.1. Structure of Aceh’s economy, 2004 7
Figure 1.2. Per capita GDP and poverty in oil/gas producing districts, 2004 7
Figure 1.3. Aceh’s economic growth vs. national average 8
Figure 1.4. Per capita GDP, public spending, and poverty headcount by province, 2004 8
Figure 1.5. Per capita GDP, public expenditure and poverty in Aceh’s districts, 2004 9
Figure 1.6. Poverty trend in Aceh province, 1990–2004 (%) 11
Figure 1.7. CPI trends in Banda Aceh and other sites 11
Figure 2.1. Flow of funds in Aceh 15
Figure 2.2. Nontax revenue-sharing arrangement for province and local government 17
Figure 2.3. Special Autonomy Allocation 18
Figure 2.4. Old vs. new budget format 20
Figure 3.1. Aceh revenue pre- and post-decentralization, and after tsunami, 1999–2006 24
Figure 3.2. Regional government revenue in Aceh increased rapidly after decentralization, 1994-2006 24
Figure 3.3. Aceh’s per capita revenue is among the highest in Indonesia 25
Figure 3.4. Aceh has the third largest allocation from natural resources sharing, 2004 27
Figure 3.5. Aceh’s districts have great disparity in revenue per capita, 2004 27
Figure 3.6. Oil/gas allocation per capita among local government in Aceh, 2004 28
Figure 3.7. Relationship between DAU per capita and poverty rates among Aceh’s districts, 2004–05 28
Figure 3.8. Aceh’s projected revenue in 2008 with and without new 2% DAU allocation 29
Figure 3.9. Sensitivity of oil price to natural resources revenue-sharing (Rp. trillion) 29
Figure 3.10. Per capita PAD across local governments in Aceh, 2004 32
Figure 3.11. Provincial and local government tax-sharing in Aceh 32
Figure 3.12. Composition of province’s 33
Figure 3.13. Composition of local government’s tax-sharing, 1999–2004 33
Figure 3.14. Per capita tax revenue-sharing across local government in Aceh, 2004 34
Figure 3.15. Trend of natural resources revenue-sharing in Aceh, 1994–2005 34
Figure 3.16. Per capita natural resources across kab/kota in Aceh, 2004 35
Figure 3.17. Aceh’s Special autonomy fund as % of total revenue 35
Figure 3.18. Gas production of PT. Arun LNG in Aceh 36
Figure 3.19. DAU allocation trend for NAD (constant 2006 prices) 37
Figure 3.20. DAU per capita for provinces in Indonesia, 2006 38
Figure 3.21. DAU allocations to local government in Aceh, 2006 39
Figure 3.22. Per capita DAU allocation across local government in Aceh, 2006 39
Figure 3.23. Trend of DAK allocation to Aceh, 2001–06 40
Figure 3.24. DAK per capita across local governments in Aceh, 2006 40
ACEH PUBLIC EXPENDITURE ANALYSISSPENDING FOR RECONSTRUCTION AND POVERTY REDUCTION
x
Figure 3.25. Spatial allocation of local government deconcentration spending in Aceh, 2004 41
Figure 3.26. Composition of Aceh reintegration funds, 2005–07 42
Figure 3.27. Regional government surplus/defi cit in Aceh, 1994–2005 (% of total expenditure) 43
Figure 3.28 Borrowing limitation with and without arrears’ restriction for Aceh 45
Figure 4.1 Aceh public spending pre- and post-decentralization, and after tsunami 48
Figure 4.2 Shares of central, provincial, and local government spending in Aceh 49
Figure 4.3 Sectoral and institutional composition of development spending in Aceh, 2004 (Rp billions) 50
Figure 4.4. Share of province’s expenditure 51
Figure 4.5. Share of local government’s expenditure 51
Figure 4.6. Reconstruction needs vs. allocated and committed resources in Aceh 55
Figure 4.7. Sectoral distribution of reconstruction funds (US$ million) 55
Figure 4.8. Allocation of funds compared to core minimum needs, by sector, June 2006 (US$ million) 56
Figure 4.9. Financing compared to geographic needs 56
Figure 4.10. BRR budgets and disbursements, 2005 and 2006 57
Figure 4.11. Disbursement of BRR 2005 and 2006 budget (Rp. billion) 58
Figure 4.12. BRR budget disbursements in Aceh by district, 2005 and 2006 58
Figure 5.1. Polindes in Kecamatan Padang Tiji, Kab. Pidie 62
Figure 5.2. Public and private midwife workforce per 10,000 population and square km served 63
Figure 5.3. Urban vs. rural midwife and doctor supply per 10,000 population 63
Figure 5.4. Sources of health expenditures 65
Figure 5.5. Regional governments’ share of health expenditures, 2004 66
Figure 5.6. Regional per capita health expenditures by province, 2004 67
Figure 5.7. Health expenditures as a share of total regional expenditures, 2001–05 67
Figure 5.8. District (right) and provincial (left) government development and routine expenditures 68
Figure 5.9. Total routine health expenditures broken down for personnel or salaries, goods, and other (shares and Rp billion)
69
Figure 5.10. District health expenditures per capita and share of total expenditures, 2004 and 2005 69
Figure 5.11. Gross enrollment rate trends for primary, junior, and senior high school in Aceh, 1999–2006 72
Figure 5.12. Junior high school GER and distance to schools per local government, 2005 72
Figure 5.13. Number of students per education level, public vs. private, 2004–05 73
Figure 5.14. Classroom condition, 2005 74
Figure 5.15. District variation, teacher: class ratio (public SD), 2005–06 74
Figure 5.16. Composition of education expenditures in Aceh, 2005 (%) 76
Figure 5.17. Regional government per capita education expenditures per province, 2004 77
Figure 5.18. Projection of Aceh resources for education, 2006–11 77
Figure 5.19. Share of regional education expenditure in total regional expenditures (2006 constant prices) 78
Figure 5.20. Province (left) and district (right) government routine and development expenditures (billion Rp, constant 2006 prices)
79
Figure 5.21. Specifi ed routine education expenditures (Rp. billions) (constant 2006 prices) 79
Figure 5.22. Trends in regional development infrastructure spending in Aceh, 1994–2005 (constant 2006 prices) 85
Figure 5.23. Average development spending in subsectors, 2003–05 86
Figure 5.24. Regional (province and local government) infrastructure spending (Rp billion) 86
ACEH PUBLIC EXPENDITURE ANALYSISSPENDING FOR RECONSTRUCTION AND POVERTY REDUCTION
xi
Figure 5.25. Average composition of routine expenditure, 2001–04 (%) 86
Figure 6.1. Routine expenditures and number of local government in Aceh, 1994–2004 94
Table
Table 1.1. Evolution of intergovernmental fi scal arrangements for Aceh 3
Table 1.2. Stages of the confl ict and casualities 4
Table 1.3. Reconstruction progress indicators (as of April 2006) 6
Table 2.1. Revenue-sharing arrangements and the Aced special autonomy fund 16
Table 3.1. Composition of provincial and local government revenue in Aceh, 1999–2006 (Rp. billion) 25
Table 3.2. Share of various revenue sources of total regional revenue in Aceh, 1997–2005 26
Table 3.3. Composition of provincial PAD in Aceh 30
Table 3.4. Composition of local government PAD in Aceh 31
Table 3.5. Tax-sharing of province and local governments in Aceh (Rp. billion) 33
Table 3.6. Share of special autonomy fund to total revenue and total transfers in Aceh Utara, 2003–05 (Rp billion) 36
Table 3.7. Share of deconcentration fund to total regional revenue, 1999–2005 41
Table 3.8 Aceh’s regional government has accumulated signifi cant reserves (Rp. billions) 43
Table 3.9 Borrowing record of regional government and PDAM in Aceh, 2004 (Rp. billions) 44
Table 4.1 Aceh overall public expenditure pre- and post-decentralization 49
Table 4.2. Structure of regional routine expenditure in Aceh, 1999–2005 51
Table 4.3. Regional development expenditure by sector in Aceh, 1999–2005 52
Table 4.4. Composition of regional spending based on new budget format (apparatus and public services) in Aceh, 2003–05
53
Table 4.5. Planned vs. actual spending in Aceh, 2002–03 54
Table 5.1. Immunization coverage comparison (%) 64
Table 5.2 Household monthly average health expenses across income quintiles (%) 66
Table 5.3. Central, provincial, and district health expenditures, 2005 68
Table 5.4. Teacher qualifi cations in Aceh province, 2005–06 (%) 73
Table 5.5. Number of schools destroyed per district, August 1998–June 2003 75
Table 5.6. Central, provincial, and district education spending, 2005 (constant 2006 prices) 78
Table 5.7. Allocation of the education fund resources (real expenditures, Rp billions) 80
Table 5.8. Provincial spending breakdown, 2002–06 80
Table 5.9. Enrollment levels per income quintile, 2004 81
Table 5.10. Aceh infrastructure indicators compared to national averages, various years (%) 83
Table 5.11. Road network in Aceh, 2004 84
Table 5.12. Aceh infrastructure spending: Province vs. Kab/Kota, 2001–05 (constant 2006 prices) 85
Table 6.1. Results of the PFM survey in 9 sites in Aceh (%) 92
Table 6.2. Educational attainment of government employees in Aceh, 2003 (%) 93
Table 6.3. Share of capital investments for buildings, equipment, and vehicles, 2003–06 95
Table 6.4. Expenditures to develop human resources out of total local government budget, 2003–06 (%) 95 9

ACEH PUBLIC EXPENDITURE ANALYSISSPENDING FOR RECONSTRUCTION AND POVERTY REDUCTION
EXECUTIVE SUMMARYxii
ACEH PUBLIC EXPENDITURE ANALYSISSPENDING FOR RECONSTRUCTION AND POVERTY REDUCTION
EXECUTIVE SUMMARY xiii
Executive Summary
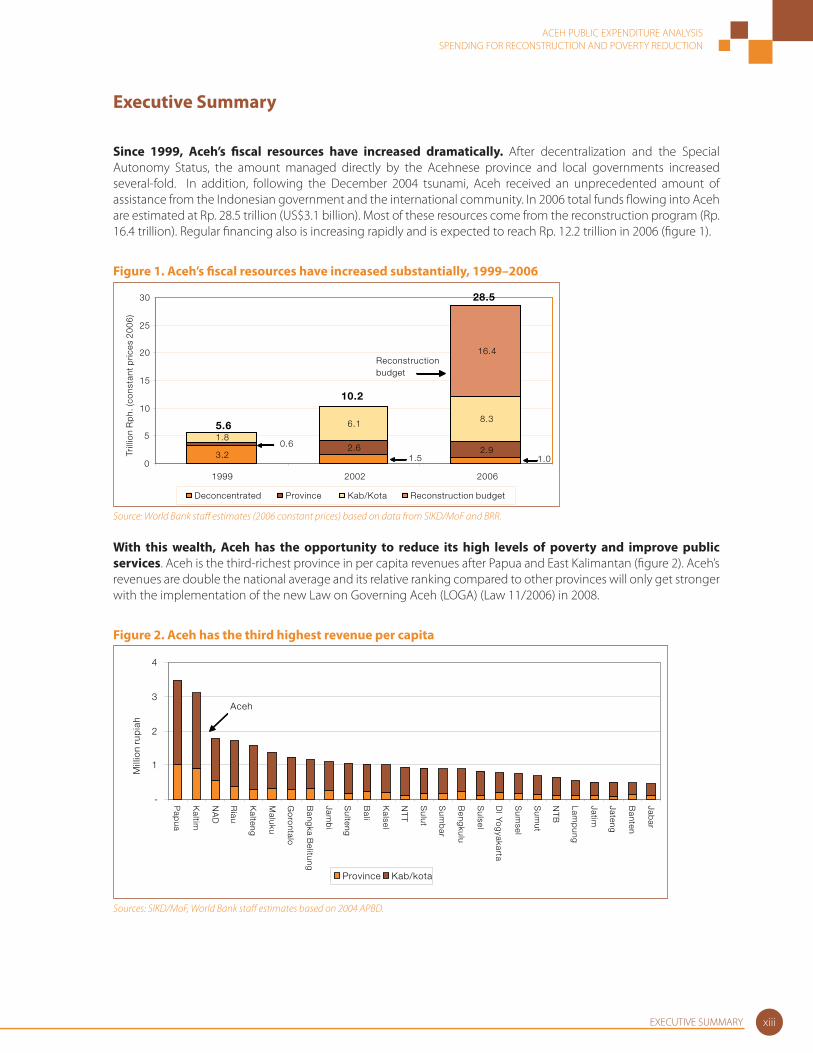
Since 1999, Aceh’s fi scal resources have increased dramatically. After decentralization and the Special Autonomy Status, the amount managed directly by the Acehnese province and local governments increased several-fold. In addition, following the December 2004 tsunami, Aceh received an unprecedented amount of assistance from the Indonesian government and the international community. In 2006 total funds fl owing into Aceh are estimated at Rp. 28.5 trillion (US$3.1 billion). Most of these resources come from the reconstruction program (Rp. 16.4 trillion). Regular fi nancing also is increasing rapidly and is expected to reach Rp. 12.2 trillion in 2006 (fi gure 1).
Figure 1. Aceh’s fi scal resources have increased substantially, 1999–2006
3.22.6 2.9
1.8
6.1 8.3
1.0
16.4
0
5
10
15
20
25
30
1999 2002 2006
Trill
ion
Rp
h.(c
ons
tant
pri
ces
20
06
)
Deconcentrated Province Kab/Kota Reconstruction budget
Reconstructionbudget
0.6
1.5
Source: World Bank staff estimates (2006 constant prices) based on data from SIKD/MoF and BRR.
With this wealth, Aceh has the opportunity to reduce its high levels of poverty and improve public services. Aceh is the third-richest province in per capita revenues after Papua and East Kalimantan (fi gure 2). Aceh’s revenues are double the national average and its relative ranking compared to other provinces will only get stronger with the implementation of the new Law on Governing Aceh (LOGA) (Law 11/2006) in 2008.
Figure 2. Aceh has the third highest revenue per capita
-
1
2
3
4
Pap
ua
Kaltim
NA
D
Riau
Kalteng
Maluku
Go
rontalo
Bang
ka Belitung
Jamb
i
Sulteng
Bali
Kalsel
NT
T
Sulut
Sum
bar
Beng
kulu
Sulsel
DI Yo
gyakarta
Sum
sel
Sum
ut
NT
B
Lamp
ung
Jatim
Jateng
Banten
Jabar
Mill
ion
rup
iah
Province Kab/kota
Aceh
Sources: SIKD/MoF, World Bank staff estimates based on 2004 APBD.
ACEH PUBLIC EXPENDITURE ANALYSISSPENDING FOR RECONSTRUCTION AND POVERTY REDUCTION
EXECUTIVE SUMMARYxiv
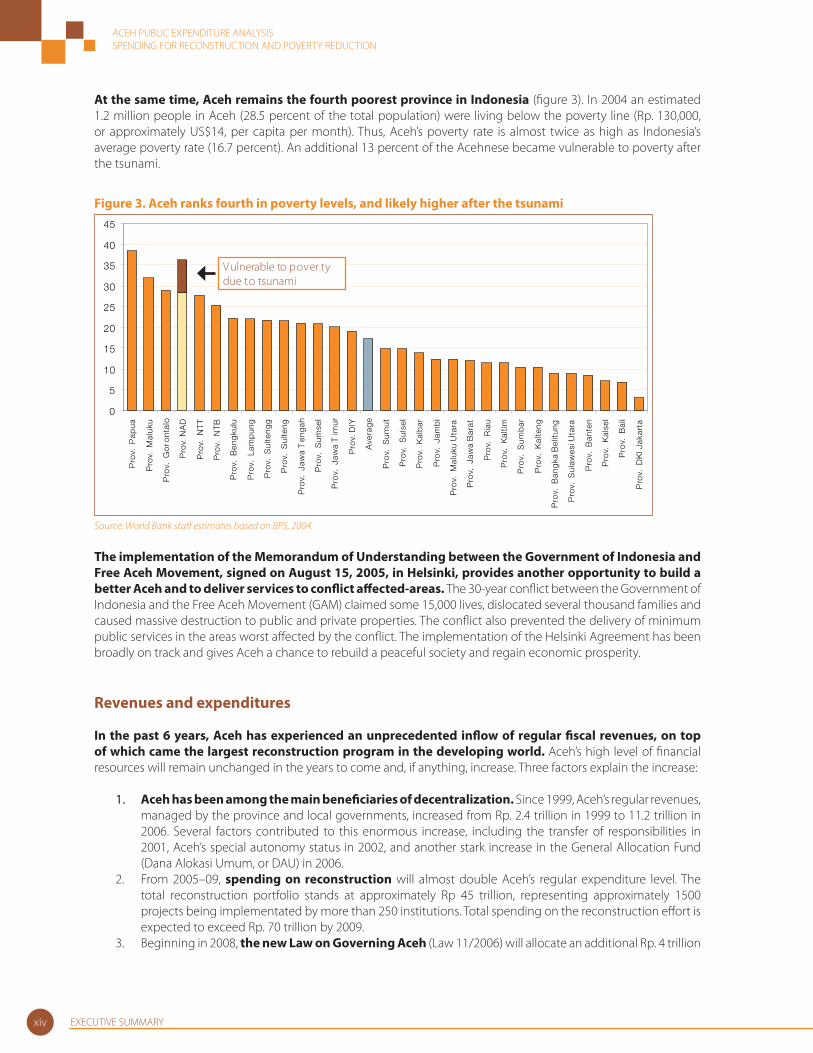
At the same time, Aceh remains the fourth poorest province in Indonesia (fi gure 3). In 2004 an estimated 1.2 million people in Aceh (28.5 percent of the total population) were living below the poverty line (Rp. 130,000, or approximately US$14, per capita per month). Thus, Aceh’s poverty rate is almost twice as high as Indonesia’s average poverty rate (16.7 percent). An additional 13 percent of the Acehnese became vulnerable to poverty after the tsunami.
Figure 3. Aceh ranks fourth in poverty levels, and likely higher after the tsunami
0
5
10
15
20
25
30
35
40
45
Pro
v. P
apua
Pro
v. M
aluk
u
Pro
v. G
oro
ntal
o
Pro
v. N
AD
Pro
v. N
TT
Pro
v. N
TB
Pro
v. B
eng
kulu
Pro
v. L
amp
ung
Pro
v. S
ulte
ngg
Pro
v. S
ulte
ng
Pro
v. J
awa
Ten
gah
Pro
v. S
umse
l
Pro
v. J
awa
Tim
ur
Pro
v. D
IY
Ave
rag
e
Pro
v. S
umut
Pro
v. S
ulse
l
Pro
v. K
alb
ar
Pro
v. J
amb
i
Pro
v. M
aluk
u U
tara
Pro
v. J
awa
Bar
at
Pro
v. R
iau
Pro
v. K
altim
Pro
v. S
umb
ar
Pro
v. K
alte
ng
Pro
v. B
ang
ka B
elitu
ng
Pro
v. S
ulaw
esi U
tara
Pro
v. B
ante
n
Pro
v. K
alse
l
Pro
v. B
ali
Pro
v. D
KI J
akar
ta
Vulnerable to pover ty due to tsunami
Source: World Bank staff estimates based on BPS, 2004.
The implementation of the Memorandum of Understanding between the Government of Indonesia and Free Aceh Movement, signed on August 15, 2005, in Helsinki, provides another opportunity to build a better Aceh and to deliver services to confl ict aff ected-areas. The 30-year confl ict between the Government of Indonesia and the Free Aceh Movement (GAM) claimed some 15,000 lives, dislocated several thousand families and caused massive destruction to public and private properties. The confl ict also prevented the delivery of minimum public services in the areas worst aff ected by the confl ict. The implementation of the Helsinki Agreement has been broadly on track and gives Aceh a chance to rebuild a peaceful society and regain economic prosperity.
Revenues and expenditures
In the past 6 years, Aceh has experienced an unprecedented infl ow of regular fi scal revenues, on top of which came the largest reconstruction program in the developing world. Aceh’s high level of fi nancial resources will remain unchanged in the years to come and, if anything, increase. Three factors explain the increase:
1. Aceh has been among the main benefi ciaries of decentralization. Since 1999, Aceh’s regular revenues, managed by the province and local governments, increased from Rp. 2.4 trillion in 1999 to 11.2 trillion in 2006. Several factors contributed to this enormous increase, including the transfer of responsibilities in 2001, Aceh’s special autonomy status in 2002, and another stark increase in the General Allocation Fund (Dana Alokasi Umum, or DAU) in 2006.
2. From 2005–09, spending on reconstruction will almost double Aceh’s regular expenditure level. The total reconstruction portfolio stands at approximately Rp 45 trillion, representing approximately 1500 projects being implementated by more than 250 institutions. Total spending on the reconstruction eff ort is expected to exceed Rp. 70 trillion by 2009.
3. Beginning in 2008, the new Law on Governing Aceh (Law 11/2006) will allocate an additional Rp. 4 trillion
ACEH PUBLIC EXPENDITURE ANALYSISSPENDING FOR RECONSTRUCTION AND POVERTY REDUCTION
EXECUTIVE SUMMARY xv
through a “special autonomy fund” (dana otsus), which will total Rp. 5 trillion by 2011. With declining oil and gas revenues, the dana otsus is likely to become the second most important source of Aceh’s revenues, similar to the importance of special autonomy funds in Papua.
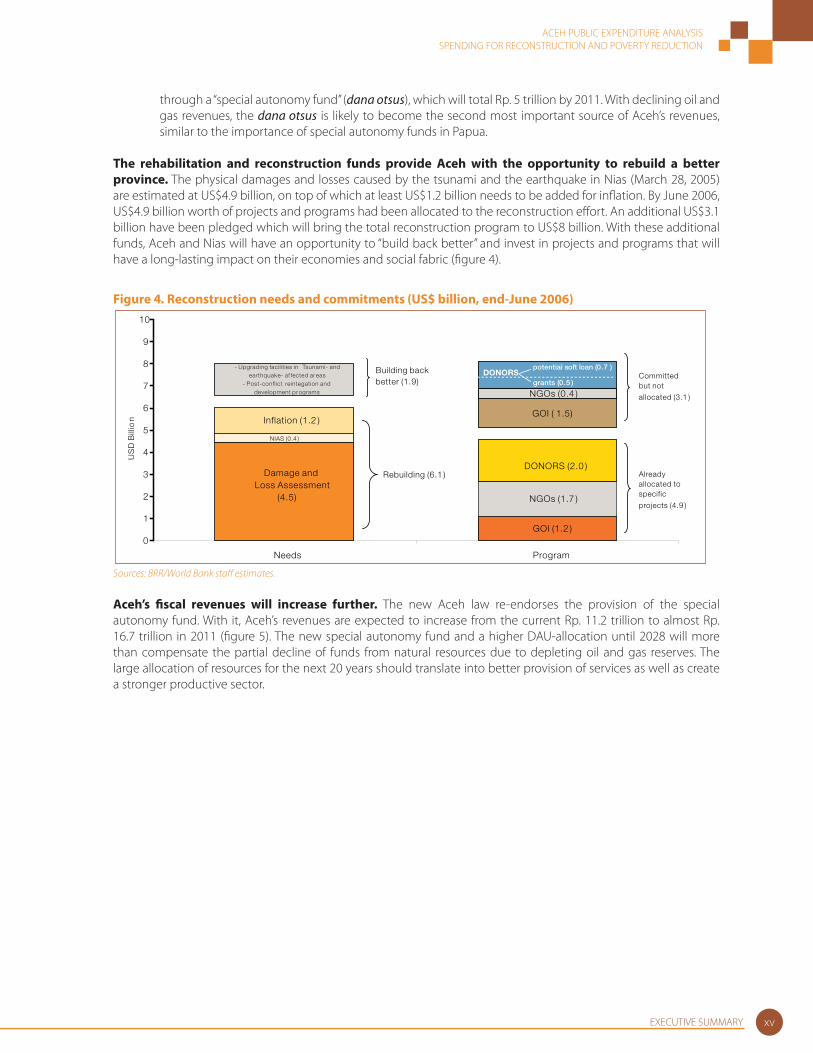
The rehabilitation and reconstruction funds provide Aceh with the opportunity to rebuild a better province. The physical damages and losses caused by the tsunami and the earthquake in Nias (March 28, 2005) are estimated at US$4.9 billion, on top of which at least US$1.2 billion needs to be added for infl ation. By June 2006, US$4.9 billion worth of projects and programs had been allocated to the reconstruction eff ort. An additional US$3.1 billion have been pledged which will bring the total reconstruction program to US$8 billion. With these additional funds, Aceh and Nias will have an opportunity to “build back better” and invest in projects and programs that will have a long-lasting impact on their economies and social fabric (fi gure 4).
Figure 4. Reconstruction needs and commitments (US$ billion, end-June 2006)
GOI (1.2 )
Damage and Loss Assessment
(4.5) NGOs (1.7 )
NIAS (0.4 )
DONORS (2.0 )
Inflation (1.2 )GOI ( 1.5)
- Upgrading facilities in Tsunami- and earthquake- af fected areas
- Post-conflict reintegation and development programs NGOs (0.4 )
potential soft loan (0.7 )
0
1
2
3
4
5
6
7
8
9
10
Needs Program
US
D B
illio
n
Committed but not
allocated (3.1 )
Already allocated to specific
projects (4.9 )
Rebuilding (6.1 )
Building back better (1.9) grants (0.5 )
DONORS
Sources: BRR/World Bank staff estimates.
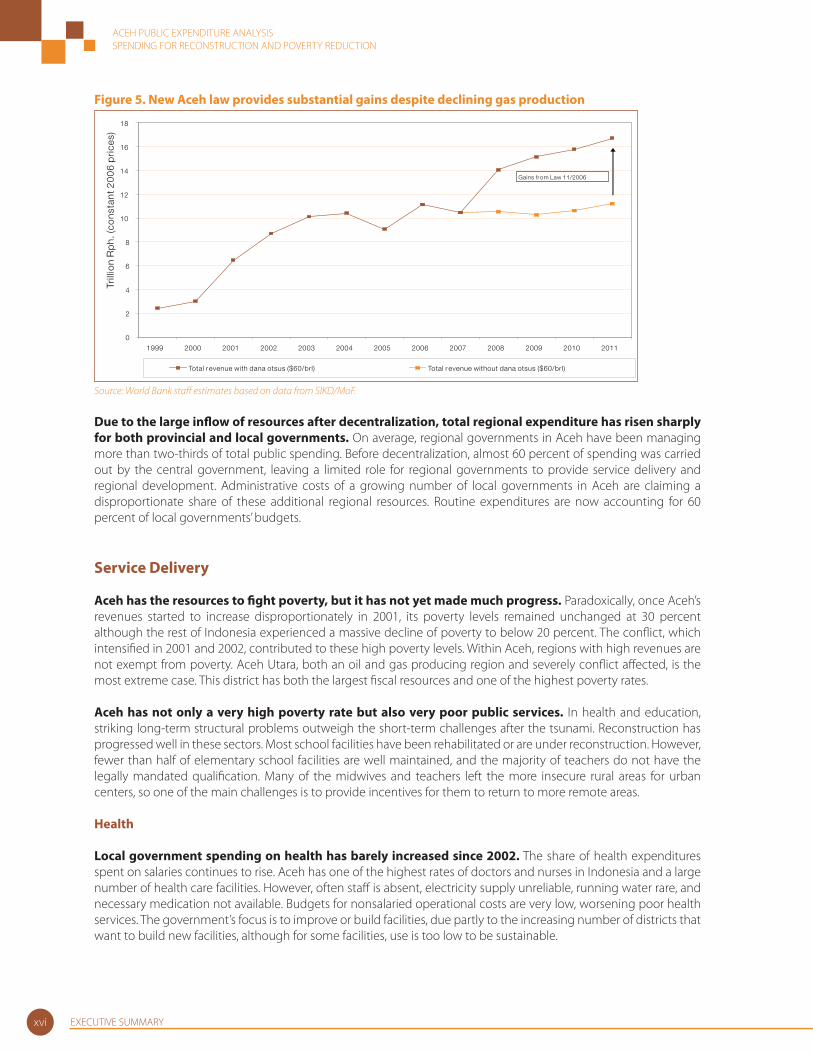
Aceh’s fi scal revenues will increase further. The new Aceh law re-endorses the provision of the special autonomy fund. With it, Aceh’s revenues are expected to increase from the current Rp. 11.2 trillion to almost Rp. 16.7 trillion in 2011 (fi gure 5). The new special autonomy fund and a higher DAU-allocation until 2028 will more than compensate the partial decline of funds from natural resources due to depleting oil and gas reserves. The large allocation of resources for the next 20 years should translate into better provision of services as well as create a stronger productive sector.
ACEH PUBLIC EXPENDITURE ANALYSISSPENDING FOR RECONSTRUCTION AND POVERTY REDUCTION
EXECUTIVE SUMMARYxvi
Figure 5. New Aceh law provides substantial gains despite declining gas production
0
2
4
6
8
10
12
14
16
18
1999 2000 2001 2002 2003 2004 2005 2006 2007 2008 2009 2010 2011
Trill
ion
Rp
h. (c
ons
tant
20
06
pri
ces)
Total r evenue with dana otsus ($60/brl) Total r evenue without dana otsus ($60/brl)
Gains fr om Law 11/2006
Source: World Bank staff estimates based on data from SIKD/MoF.
Due to the large infl ow of resources after decentralization, total regional expenditure has risen sharply for both provincial and local governments. On average, regional governments in Aceh have been managing more than two-thirds of total public spending. Before decentralization, almost 60 percent of spending was carried out by the central government, leaving a limited role for regional governments to provide service delivery and regional development. Administrative costs of a growing number of local governments in Aceh are claiming a disproportionate share of these additional regional resources. Routine expenditures are now accounting for 60 percent of local governments’ budgets.
Service Delivery
Aceh has the resources to fi ght poverty, but it has not yet made much progress. Paradoxically, once Aceh’s revenues started to increase disproportionately in 2001, its poverty levels remained unchanged at 30 percent although the rest of Indonesia experienced a massive decline of poverty to below 20 percent. The confl ict, which intensifi ed in 2001 and 2002, contributed to these high poverty levels. Within Aceh, regions with high revenues are not exempt from poverty. Aceh Utara, both an oil and gas producing region and severely confl ict aff ected, is the most extreme case. This district has both the largest fi scal resources and one of the highest poverty rates.
Aceh has not only a very high poverty rate but also very poor public services. In health and education, striking long-term structural problems outweigh the short-term challenges after the tsunami. Reconstruction has progressed well in these sectors. Most school facilities have been rehabilitated or are under reconstruction. However, fewer than half of elementary school facilities are well maintained, and the majority of teachers do not have the legally mandated qualifi cation. Many of the midwives and teachers left the more insecure rural areas for urban centers, so one of the main challenges is to provide incentives for them to return to more remote areas.
Health
Local government spending on health has barely increased since 2002. The share of health expenditures spent on salaries continues to rise. Aceh has one of the highest rates of doctors and nurses in Indonesia and a large number of health care facilities. However, often staff is absent, electricity supply unreliable, running water rare, and necessary medication not available. Budgets for nonsalaried operational costs are very low, worsening poor health services. The government’s focus is to improve or build facilities, due partly to the increasing number of districts that want to build new facilities, although for some facilities, use is too low to be sustainable.
ACEH PUBLIC EXPENDITURE ANALYSISSPENDING FOR RECONSTRUCTION AND POVERTY REDUCTION
EXECUTIVE SUMMARY xvii
Education
Aceh has suffi cient teachers, but the gaps in coverage remain huge. Teachers favor urban over rural regions, creating serious gaps in rural regions. Rather than increasing the number of teachers, local governments should develop an appropriate system of incentives and sanctions that will place quality education within reach of all Acehnese. Although regional spending on education quadrupled in 2002, it has been falling since then. Most of it was consumed by routine expenditures (primarily teacher’s salaries), which account for 63 percent of total education expenditure. The poor state of education facilities and lack of materials in schools are the main problems. Aceh has the highest per capita education expenditures in Indonesia (Rp. 457,000 vs. national average of Rp. 196,000), making the focus on quality even more urgent.
In infrastructure, the 2005 tsunami compounded the diffi culties that had existed for a long time. However, in some subsectors, Aceh is almost on par with the national average. The household electrifi cation rate and road density are higher than the national average, but household water connections, private sanitation, and irrigation infrastructure are well below national levels. Two- thirds of Acehnese households are connected to electricity, but blackouts are frequent in many areas in the province.
Infrastructure spending rose signifi cantly after decentralization but has been declining since 2002. Salaries account for a large share of routine expenditure in the infrastructure budget, while operational and maintenance expenses represent only a marginal share. After the tsunami, many local governments further lowered their infrastructure investments in the expectation that reconstruction projects from central government, donors, and NGOs would take the lead.
Local Government Capacity to manage budget funds
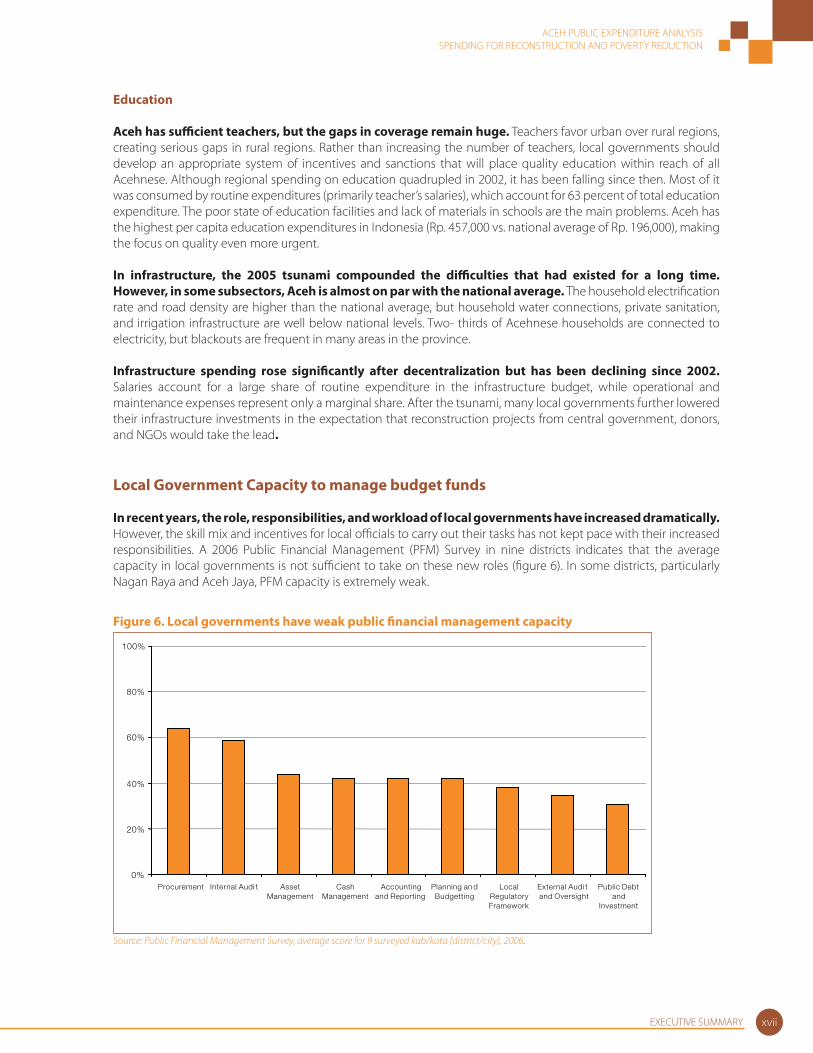
In recent years, the role, responsibilities, and workload of local governments have increased dramatically. However, the skill mix and incentives for local offi cials to carry out their tasks has not kept pace with their increased responsibilities. A 2006 Public Financial Management (PFM) Survey in nine districts indicates that the average capacity in local governments is not suffi cient to take on these new roles (fi gure 6). In some districts, particularly Nagan Raya and Aceh Jaya, PFM capacity is extremely weak.
Figure 6. Local governments have weak public fi nancial management capacity
0%
20%
40%
60%
80%
100%
Procurement Internal Audi t AssetManagement
CashManagement
Accountingand Reporting
Planning an dBudgetting
LocalRegulatoryFramework
External Audi tand Oversight
Public Debtand
Investment
Source: Public Financial Management Survey, average score for 9 surveyed kab/kota (district/city), 2006.
ACEH PUBLIC EXPENDITURE ANALYSISSPENDING FOR RECONSTRUCTION AND POVERTY REDUCTION
EXECUTIVE SUMMARYxviii
Most local governments have diffi culty managing the increasing fl ow of funds. Since decentralization, personnel spending has crowded out capital investment in public services. Development expenditures are concentrated on government apparatus, to the detriment of other areas for which it is more urgently needed. Contrary to the needs identifi ed, local governments spend little on training, while a major share of their capital investment goes to buildings, vehicles, and equipment. The allocation of funds for general public administration needs to be scrutinized. A reorientation of expenditure toward building the capacity of existing staff is urgently needed.
Agenda for Implementation
Aceh’s policy-makers can make many changes to better manage its vast resources. The three most important reforms relate to a (a) better allocation of resources, (b) better management of resources, and (c) better data analysis to inform allocation and management of resources.
1. Better Allocation of Resources
Development spending needs to be increased––not reduced. Provincial and local governments’ abundant resources are the key to improve the lives of the Acehnese. Aceh’s local and provincial governments have been among the main benefi ciaries of decentralization and special autonomy. However, these governments have yet to fully participate in building a better future for Acehnese people. In 2005 most local governments cut the share of their development expenditures in response to additional funds from the Rehabilitation and Reconstruction Agency (BRR) and donors.
Spending on the government apparatus is too high. Local governments are devoting an increasing amount of their resources to bureaucracy, at the expense of development spending. Spending on government apparatus continued to increase even after the number of districts stabilized. This trend must be scrutinized. There is no indication that increased spending on government bureaucracy has resulted in better management of fi scal resources. Public spending should be devoted to development-related activities that improve service delivery and social welfare, and yield long-term economic and social benefi ts rather than bureaucracy.
Future spending by the central government on largely decentralized functions should be minimized. Even excluding reconstruction fi nancing, the central government still contributes more than 30 percent to Aceh’s investments. Most of these investments are on largely decentralized functions. Central government spending can be well targeted through earmarked grants (DAK). The focus can be lagging regions and activities related to national priorities and having large economies of scale.
Strategic (re-) allocation decisions with respect to the reconstruction funds should be made now. By June 2006, US$4.9 billion reconstruction funds were allocated. At this still rather early stage of the reconstruction, the main sources of large-scale programmable funds are limited. The remaining fi nancing gaps need to be urgently addressed. BRR will have the largest amount of fl exible funds to address these gaps. The gaps are most signifi cant in transport as well in the regions south of Moelaboh (Aceh Barat Daya, Aceh Selatan), around Lhoksumawe (Aceh Timur, Aceh Tamiang) and Nias.
2. Better Management of Resources
The capacity of local governments to manage their fi nances needs to be enhanced. According to the PFM survey, the capacity of local governments to manage fi scal resources is lowest in the areas of planning and budgeting, accounting and reporting, external audit, public debt management, and investments. Moreover, there are signifi cant gaps in local government capacity across districts. For several indicators, some districts are shown to have an extremely low level of capacity. If the Acehnese are to benefi t from increased fi nancial resources in the region, the issue of capacity must be urgently addressed.
ACEH PUBLIC EXPENDITURE ANALYSISSPENDING FOR RECONSTRUCTION AND POVERTY REDUCTION
EXECUTIVE SUMMARY xix
Local government planning and budgeting processes require signifi cant improvement. Most local governments approve their budgets very late, often up to six months into the fi scal year. This delay in turn delays project implementation. To start implementing their projects at the beginning of each fi scal year, local governments must accelerate their budget approval processes. In addition, actual budgets often do not correspond to actual needs, particularly in the education and health sectors.
3. Better data Quality
There is an urgent need to improve data collection and processing. The lack of data and its low quality makes any programming and budgeting very diffi cult. Accurate data also is required for evidence-based policy-making, monitoring, and evaluation. Data collection and processing should be combined with identifying appropriate indicators, which can in turn inform policy-making and programming.
For reconstruction monitoring, labor intensive monitoring systems have proven superior to high-techology, self-entry-based information systems. The Recovery Aceh-Nias (RAN) Database system has not yet delivered any signifi cant results, even on its key promise to track the money. The main reasons have been a lack of methodology to categorize funds, limited quality control and data analysis, and a too-sophisticated IT system that made it diffi cult to enter and to fi nd core data. The only workable tracking system has a much more “low-tech” approach, based on a systematic follow-up with key institutions coupled with a strong emphasis on data analysis.

ACEH PUBLIC EXPENDITURE ANALYSISSPENDING FOR RECONSTRUCTION AND POVERTY REDUCTION
EXECUTIVE SUMMARYxx
1Economic and Social Conditions in Aceh
ACEH PUBLIC EXPENDITURE ANALYSISSPENDING FOR RECONSTRUCTION AND POVERTY REDUCTION
ECONOMIC AND SOCIAL CONDITIONS IN ACEH2
Historical Context
The Province of Aceh, known formally as Nanggroe Aceh Darussalam (NAD), is on the northern tip of Sumatera. Aceh is surrounded by a crucial trade route, the Malacca Strait, to the north and east, the Province of North Sumatera in the south, and Indian Ocean in the west. The province covers an area of 57,365 km2 and has a population of approximately 4 million. At present, Aceh consists of 17 municipalities (kabupatens) and 4 cities (kotas). Banda Aceh is the capital.
Islam came to Aceh as early as the ninth century and has remained the dominant religion. The population is 98.7 percent Muslim (BPS 2002). Indonesia’s fi rst Islamic kingdoms were powerful Acehnese trading states. By the 1300s, the great kingdom of Samudra, located near present-day Lhokseumawe, was renowned as a center for trade and Islamic study. Aceh’s stature as a center of Islamic learning led to its nickname, the Veranda of Mecca. Syariah has been used as the basis of law for kingdoms in Aceh and is implemented in Aceh’s administration system.
The Kingdom of Aceh was founded in the early sixteenth century and rose to prominence after the 1511 conquest of Malacca by the Portuguese. The kingdom’s golden age came in the early seventeenth century under Sultan Iskandar Mudah, who made Aceh one of the most important military and trading powers in the region. By 1820, Aceh supplied half the world’s pepper. A powerful and wealthy kingdom, it maintained relations with foreign powers including the Ottoman Empire, France, Great Britain, and the United States. When the Dutch appended Aceh in 1874, the Acehnese started a guerilla war that continued until 1912.
Left unoccupied after World War II, Aceh played a pivotal role supplying funds to the republican government of Indonesia during the struggle for independence. In recognition of its contributions to the Indonesian independence struggle, Aceh was made an autonomous region in 1949. Turbulence followed for the remainder of the Soekarno regime. In 1950 the newly autonomous region was incorporated in the province of North Sumatera leading to the fi rst Acehnese rebellion. Led by Daud Beureueh, the rebellion resulted in Aceh’s reinstatement as a province (1957) and autonomous region status in 1959. Greater autonomy, however, did not protect Aceh from the severe economic privation of the last years of Soekarno’s reign.
Under the New Order, conditions in Aceh did not improve.1 The obvious richness of the province’s natural resources on the one hand and persistent poverty on the other hand exacerbated the population’s feelings of unequal treatment by the central government. The government did not address the prolonged social and economic imbalances, and another rebellion/separatist movement known as the Free Aceh Movement (GAM) started in 1976 under the leadership of Hasan Tiro. This struggle between GOI and GAM continued until 2005.
Partially in response to these developments, in addition to nationwide decentralization, Aceh was granted Special Autonomy status under Law 18/2001. This law seeks to address crucial issues relating to inequality and the poor economic situation in Aceh and to off er Aceh greater autonomy in managing its resources and governance functions. The three key features of Aceh’s special autonomy are:
1. Large share of retained revenue from oil and gas2. Direct election of governor and head of local government (bupati/walikota)2
3. Implementation of Syari’ah/(Sharia)Islamic law.
The 2005 Helsinki memorandum of understanding (MoU) was the latest attempt to end this 30-year confl ict. It off ers great opportunity for Acehnese to improve their communities’ economic performance, attain better living standards, and move toward a good governance system. The main point of the agreement is that Aceh is allowed to establish local political parties that are in line with national regulations. The central government also agreed to provide Aceh with a larger share of revenue from natural resources and special allocation from DAU (Box 1). Law 11/2006 implementing these provisions was passed in August 2006. Fiscal arrangements under the previous and the new law are presented in table 1.1.
1 The New Order was a governmental period under the leadership of President Soeharto from 1966–98.
2 This was envisioned to be the fi rst direct election at the local level in Indonesia before Law 32/2004 concerning local governance was passed. The law specifi es that the direct election of head of local government is to be implemented nationally.
ACEH PUBLIC EXPENDITURE ANALYSISSPENDING FOR RECONSTRUCTION AND POVERTY REDUCTION
ECONOMIC AND SOCIAL CONDITIONS IN ACEH 3
Box 1. Key features of Law on Government of Aceh, Law 11/2006
Administrative/PoliticsRight to use regional symbols including a fl ag, a crest, and a hymn
Right to establish local political parties
Protection of local culture and establishment of traditional culture body (Wali Nanggroe)
Fiscal/EconomyRight to set interest rates diff erent from those set by the Central Bank of Indonesia
Right to retain 70 percent of revenue from oil and gas, hydrocarbon, and other natural resources
Joint management of oil and gas resources between the province and central government, and transparency in revenue-sharing allocation, audited by independent auditors
Additional revenue from 2 percent of national DAU allocation for 15 years and 1 percent for 5 more years.
•
•
•
•
•
•
•
Table 1.1. Evolution of intergovernmental fi scal arrangements for Aceh
Revenue-sharing
Law 33/2004 (national
allocation)
Law 18/2001 (Special
Autonomy)
Law 11/2006 on Government of
Aceh
Province Central Province Central Province
Tax-sharing
Land and Building Tax (PBB) 10 90 10 90 10 90
Land and Building Transfer Fee (BPHTB) 20 80 20 80 20 80
Personal Income Tax (PPh) 80 20 80 20 80 20
Nontax Sharing
Forestry 20 80 20 80 20 80
Mining 20 80 20 80 20 80
Fishery 20 80 20 80 20 80
Geothermal 20 80 20 80 20 80
Oil (nontax) net revenue 85 15 30 70 30 70
LNG (nontax) 70 30 30 70 30 70
Special autonomy fund (additional revenue from total DAU allocation, 2% for 15 years and 1% for 5 years)
2
Sources: Law 18/2001, Law 33/2004, and Law 11/2006.
Confl ict and Its Impact on Development
Impact and cost of the confl ict
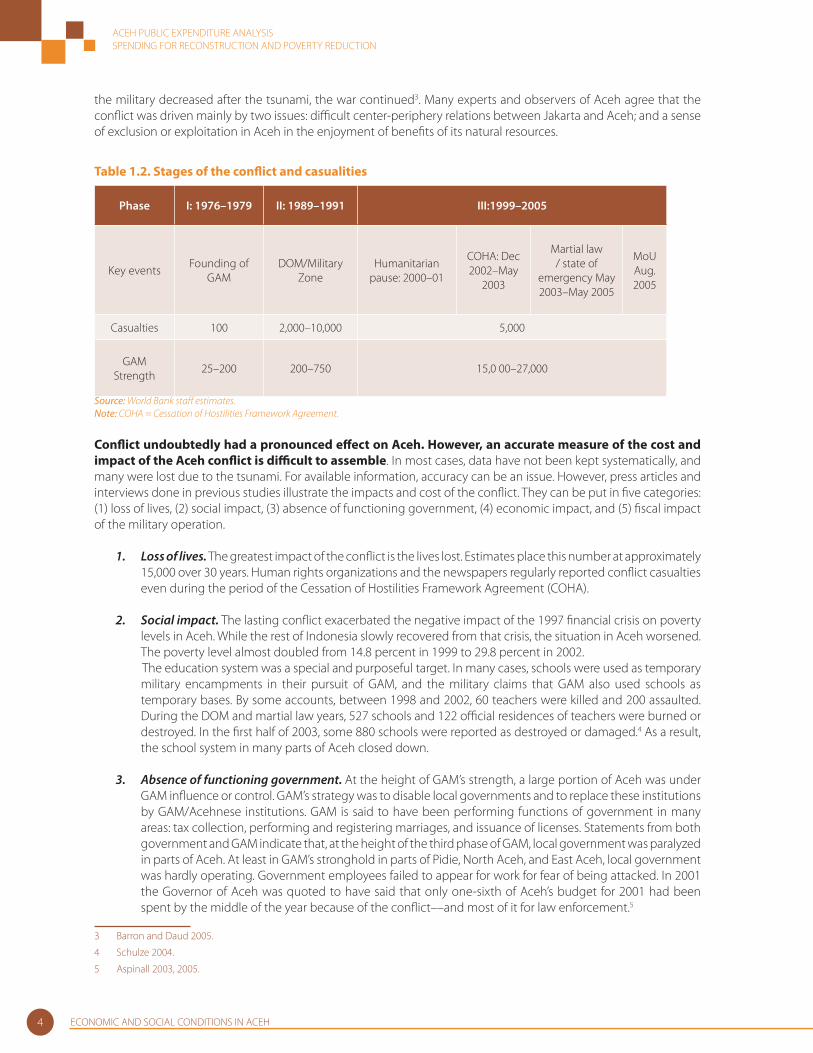
The confl ict between GAM and GOI had diff erent stages. The fi rst stage had no signifi cant impact in Aceh, and GAM held little political or military clout. The resurgence of confl ict in 1989 saw a better trained and armed GAM. In response, the government transformed Aceh into a military zone (Daerah Operasi Militer, or DOM). This change resulted in the deployment of a sizable contingent of military and police forces. These forces remained in the province until their pull-out in late 2005 as a result of the MoU. The last phase was the most destructive of all. Discontent with the central government in Jakarta spread even to urban centers. From 1999 until the signing of the 2005 peace accord, armed encounters between GAM and the military became frequent (table 1.2). A World Bank study based on newspapers’ monitoring of confl icts indicates that, while the encounters between GAM and
ACEH PUBLIC EXPENDITURE ANALYSISSPENDING FOR RECONSTRUCTION AND POVERTY REDUCTION
ECONOMIC AND SOCIAL CONDITIONS IN ACEH4
the military decreased after the tsunami, the war continued3. Many experts and observers of Aceh agree that the confl ict was driven mainly by two issues: diffi cult center-periphery relations between Jakarta and Aceh; and a sense of exclusion or exploitation in Aceh in the enjoyment of benefi ts of its natural resources.
Table 1.2. Stages of the confl ict and casualities
Phase I: 1976–1979 II: 1989–1991 III:1999–2005
Key eventsFounding of
GAMDOM/Military
ZoneHumanitarian
pause: 2000–01
COHA: Dec 2002–May
2003
Martial law / state of
emergency May 2003–May 2005
MoU Aug. 2005
Casualties 100 2,000–10,000 5,000
GAM Strength
25–200 200–750 15,0 00–27,000
Source: World Bank staff estimates.Note: COHA = Cessation of Hostilities Framework Agreement.
Confl ict undoubtedly had a pronounced eff ect on Aceh. However, an accurate measure of the cost and impact of the Aceh confl ict is diffi cult to assemble. In most cases, data have not been kept systematically, and many were lost due to the tsunami. For available information, accuracy can be an issue. However, press articles and interviews done in previous studies illustrate the impacts and cost of the confl ict. They can be put in fi ve categories: (1) loss of lives, (2) social impact, (3) absence of functioning government, (4) economic impact, and (5) fi scal impact of the military operation.
1. Loss of lives. The greatest impact of the confl ict is the lives lost. Estimates place this number at approximately 15,000 over 30 years. Human rights organizations and the newspapers regularly reported confl ict casualties even during the period of the Cessation of Hostilities Framework Agreement (COHA).
2. Social impact. The lasting confl ict exacerbated the negative impact of the 1997 fi nancial crisis on poverty levels in Aceh. While the rest of Indonesia slowly recovered from that crisis, the situation in Aceh worsened. The poverty level almost doubled from 14.8 percent in 1999 to 29.8 percent in 2002.
The education system was a special and purposeful target. In many cases, schools were used as temporary military encampments in their pursuit of GAM, and the military claims that GAM also used schools as temporary bases. By some accounts, between 1998 and 2002, 60 teachers were killed and 200 assaulted. During the DOM and martial law years, 527 schools and 122 offi cial residences of teachers were burned or destroyed. In the fi rst half of 2003, some 880 schools were reported as destroyed or damaged.4 As a result, the school system in many parts of Aceh closed down.
3. Absence of functioning government. At the height of GAM’s strength, a large portion of Aceh was under GAM infl uence or control. GAM’s strategy was to disable local governments and to replace these institutions by GAM/Acehnese institutions. GAM is said to have been performing functions of government in many areas: tax collection, performing and registering marriages, and issuance of licenses. Statements from both government and GAM indicate that, at the height of the third phase of GAM, local government was paralyzed in parts of Aceh. At least in GAM’s stronghold in parts of Pidie, North Aceh, and East Aceh, local government was hardly operating. Government employees failed to appear for work for fear of being attacked. In 2001 the Governor of Aceh was quoted to have said that only one-sixth of Aceh’s budget for 2001 had been spent by the middle of the year because of the confl ict––and most of it for law enforcement.5
3 Barron and Daud 2005.
4 Schulze 2004.
5 Aspinall 2003, 2005.
ACEH PUBLIC EXPENDITURE ANALYSISSPENDING FOR RECONSTRUCTION AND POVERTY REDUCTION
ECONOMIC AND SOCIAL CONDITIONS IN ACEH 5
4. Economic impact. The impact on the provincial economy was immense: the economy overall was stagnant. During the last phase of the confl ict, economic hardship heightened with the worsening of security. Investors withdrew; and businesses, especially around gas fi elds, closed down or reduced production. In East and North Aceh, palm oil plantations stopped operations in 2003.6 Fishers were not allowed to go to sea without a government permit. In 1990 Aceh contributed 3.6 percent to Indonesia’s GDP. This contribution fell to 2.2 percent in 2001 at the height of the confl ict, due mainly to the drop in contribution from the oil and gas fi elds.
5. Fiscal impact of the military operation Several accounts of the confl ict point to substantial government fi scal outlays, especially during the martial law years. Weeks before the talks between GOI and GAM broke down, from only 6,000 troops in the early 1990s, the army’s strength in Aceh had been increased to approximately 30,000 and the police to 12,000. The ratio of military personnel to population increased from 1:570 in the early 1990s to 1:80, or 12.5 for every 1,000 population at the height of the confl ict. The national ratio is 1:1,000. Data on the number of troops withdrawn after the MoU suggest there were over 50,000 troops and police in Aceh at the time of the peace agreement.
Government fi nanced the operations largely from Central government funds. Provincial funds were used to augment national government resources and to fund the social welfare requirements (temporary shelter, food, for evacuated populations). Between 2002 and 2005, some 55,000 persons were assisted by the government in the form of social payments (diyat) as victims of the confl ict. The government spent close to US$12 million to cover these expenses. In February 2006, the Governor of Aceh established the Badan Reintegrasi Aceh (BRA). BRA is expected to become the main body to coordinate government and donor post-confl ict programs. The agency has begun processing proposals from GAM and confl ict aff ected persons.
Impact of the December 26, 2004 Tsunami
On December 26, 2004, an earthquake struck 150 km off the coast of Aceh.7 Shortly afterward, a tsunami hit, and within minutes it had swept clean an 800-km coastal strip of Aceh. Some 170,000 people perished, and approximately 500,000 were displaced from their homes.
The natural disaster caused immense social, economic, and environmental devastation to areas that were already poor. The calamity also unleashed an unprecedented national and international response for emergency needs, with NGOs and donors making record reconstruction funding contributions. Even before the tsunami, approximately one-third of the population of Aceh lived in poverty. After the disaster, hundreds of thousands more became vulnerable to poverty and dependent on food aid.
The physical damage and losses have been estimated at US$4.9 billion. Productive sectors alone suff ered losses estimated at US$1.2 billion. More than half of the latter was in the fi sheries sector; the rest was divided between farming and manufacturing. Cash-for-work, fi nanced by many donors and NGOs, has played a vital role in providing safety nets and revitalizing the economy. As more housing construction projects and other regular employment activities are being launched, these programs are being phased out. Due to the pressure exerted on prices by the reconstruction eff ort, post-tsunami, prices have increased more sharply in the province than nationwide. The price hike was particularly noticeable in Banda Aceh, where year-on-year infl ation in December 2005 reached 41 percent.
After a slow start, since September 2005, the pace of reconstruction has picked up markedly. Faster than expected progress has been achieved in getting children back to school, restoring the health care network, replacing fi shing boats, and restoring farmland and fi shing ponds. Progress also is visible in the crucial housing sector. Approximately 47,500 houses are reported to have been completed or nearing completion by end-April
6 R. Sukma 2004.
7 This section is based on the report, “Aceh and Nias One Year after the Tsunami: The Recovery Eff ort and Way Forward” (BRR and international partners), December 2005.
ACEH PUBLIC EXPENDITURE ANALYSISSPENDING FOR RECONSTRUCTION AND POVERTY REDUCTION
ECONOMIC AND SOCIAL CONDITIONS IN ACEH6
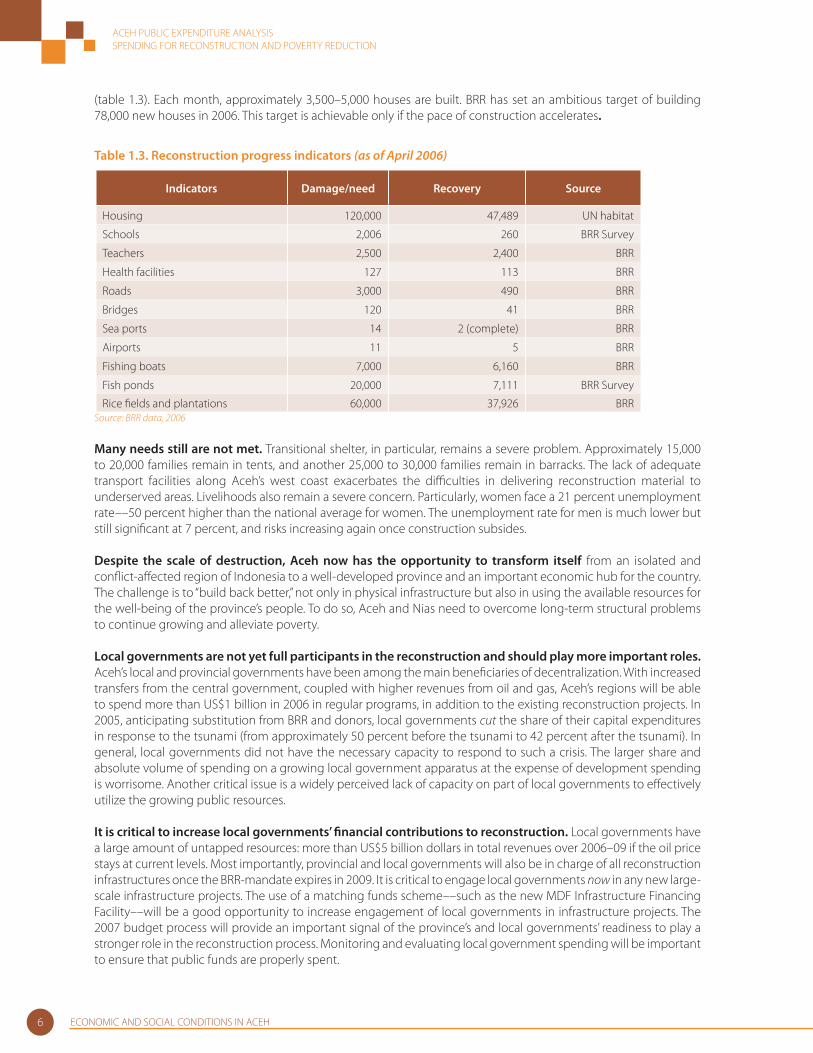
(table 1.3). Each month, approximately 3,500–5,000 houses are built. BRR has set an ambitious target of building 78,000 new houses in 2006. This target is achievable only if the pace of construction accelerates.
Table 1.3. Reconstruction progress indicators (as of April 2006)
Indicators Damage/need Recovery Source
Housing 120,000 47,489 UN habitat
Schools 2,006 260 BRR Survey
Teachers 2,500 2,400 BRR
Health facilities 127 113 BRR
Roads 3,000 490 BRR
Bridges 120 41 BRR
Sea ports 14 2 (complete) BRR
Airports 11 5 BRR
Fishing boats 7,000 6,160 BRR
Fish ponds 20,000 7,111 BRR Survey
Rice fi elds and plantations 60,000 37,926 BRRSource: BRR data, 2006
Many needs still are not met. Transitional shelter, in particular, remains a severe problem. Approximately 15,000 to 20,000 families remain in tents, and another 25,000 to 30,000 families remain in barracks. The lack of adequate transport facilities along Aceh’s west coast exacerbates the diffi culties in delivering reconstruction material to underserved areas. Livelihoods also remain a severe concern. Particularly, women face a 21 percent unemployment rate––50 percent higher than the national average for women. The unemployment rate for men is much lower but still signifi cant at 7 percent, and risks increasing again once construction subsides.
Despite the scale of destruction, Aceh now has the opportunity to transform itself from an isolated and confl ict-aff ected region of Indonesia to a well-developed province and an important economic hub for the country. The challenge is to “build back better,” not only in physical infrastructure but also in using the available resources for the well-being of the province’s people. To do so, Aceh and Nias need to overcome long-term structural problems to continue growing and alleviate poverty.
Local governments are not yet full participants in the reconstruction and should play more important roles. Aceh’s local and provincial governments have been among the main benefi ciaries of decentralization. With increased transfers from the central government, coupled with higher revenues from oil and gas, Aceh’s regions will be able to spend more than US$1 billion in 2006 in regular programs, in addition to the existing reconstruction projects. In 2005, anticipating substitution from BRR and donors, local governments cut the share of their capital expenditures in response to the tsunami (from approximately 50 percent before the tsunami to 42 percent after the tsunami). In general, local governments did not have the necessary capacity to respond to such a crisis. The larger share and absolute volume of spending on a growing local government apparatus at the expense of development spending is worrisome. Another critical issue is a widely perceived lack of capacity on part of local governments to eff ectively utilize the growing public resources.
It is critical to increase local governments’ fi nancial contributions to reconstruction. Local governments have a large amount of untapped resources: more than US$5 billion dollars in total revenues over 2006–09 if the oil price stays at current levels. Most importantly, provincial and local governments will also be in charge of all reconstruction infrastructures once the BRR-mandate expires in 2009. It is critical to engage local governments now in any new large-scale infrastructure projects. The use of a matching funds scheme––such as the new MDF Infrastructure Financing Facility––will be a good opportunity to increase engagement of local governments in infrastructure projects. The 2007 budget process will provide an important signal of the province’s and local governments’ readiness to play a stronger role in the reconstruction process. Monitoring and evaluating local government spending will be important to ensure that public funds are properly spent.

ACEH PUBLIC EXPENDITURE ANALYSISSPENDING FOR RECONSTRUCTION AND POVERTY REDUCTION
ECONOMIC AND SOCIAL CONDITIONS IN ACEH 7
Aceh’s Economy
Structure of Aceh’s Economy
Aceh’s economy relies heavily on the production of oil and natural gas, which accounts for approximately 40 percent of the province’s GDP. However, this production employs less than 10 percent of the workforce. The oil/gas producing kabupatens are Aceh Timur, Aceh Utara, and Aceh Tamiang. Aceh Utara contributes 80 percent of the overall oil and gas production. Agriculture, in contrast, accounts for 24 percent of the province’s GDP (fi gure 1.1) but employs more than half of the workforce.
Figure 1.1. Structure of Aceh’s economy, 2004
Services10%
Transport&Communication5%
Trade,Restaurant&Hotel12%
Construction4%
Manufacturing (Non-Oil&Gas)
4%
Electric ity,Gas&Water0%
Manufacturing (Oil&Gas)14%
Mining (Oil)26%
Quarry ing1%
Agriculture 24%
Source: BPS 2004.
Historically, the oil/gas sector had little positive impact on the economic well-being of ordinary Acehnese. In the past, the majority of proceeds from natural resources revenue-sharing were retained by the central government. Available resources were allocated far from optimally. For example, oil-rich Aceh Utara, with a per capita GDP 2.6 times the national average, had a poverty headcount of 34.2 percent, twice the national average (fi gure 1.2).
Figure 1.2. Per capita GDP and poverty in oil/gas producing districts, 2004
0.0
0.5
1.0
1.5
2.0
2.5
3.0
Indonesia AcehTamiang
Aceh province Aceh Timur Aceh Utar a0.05.010.015.020.025.030.035.040.0
0.0
0.5
1.0
1.5
2.0
2.5
3.0
0.05.010.015.020.025.030.035.040.0
0.0
0.5
1.0
1.5
2.0
2.5
3.0
0.05.010.015.020.025.030.035.040.0
Per capita GDP (times the national average)Poverty headcount, %
Source: BPS, World Bank Staff calculations.
ACEH PUBLIC EXPENDITURE ANALYSISSPENDING FOR RECONSTRUCTION AND POVERTY REDUCTION
ECONOMIC AND SOCIAL CONDITIONS IN ACEH8
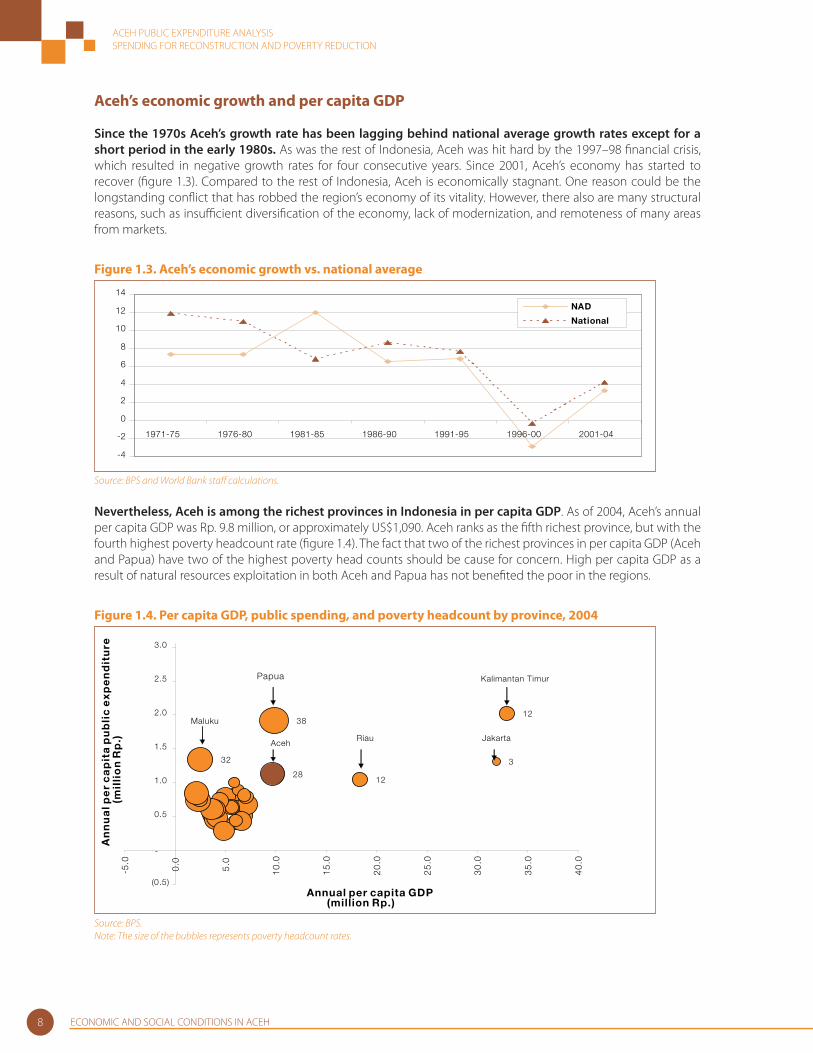
Aceh’s economic growth and per capita GDP
Since the 1970s Aceh’s growth rate has been lagging behind national average growth rates except for a short period in the early 1980s. As was the rest of Indonesia, Aceh was hit hard by the 1997–98 fi nancial crisis, which resulted in negative growth rates for four consecutive years. Since 2001, Aceh’s economy has started to recover (fi gure 1.3). Compared to the rest of Indonesia, Aceh is economically stagnant. One reason could be the longstanding confl ict that has robbed the region’s economy of its vitality. However, there also are many structural reasons, such as insuffi cient diversifi cation of the economy, lack of modernization, and remoteness of many areas from markets.
Figure 1.3. Aceh’s economic growth vs. national average
-4
-2
0
2
4
6
8
10
12
14
1971-75 1976-80 1981-85 1986-90 1991-95 1996-00 2001-04
NAD
National
Source: BPS and World Bank staff calculations.
Nevertheless, Aceh is among the richest provinces in Indonesia in per capita GDP. As of 2004, Aceh’s annual per capita GDP was Rp. 9.8 million, or approximately US$1,090. Aceh ranks as the fi fth richest province, but with the fourth highest poverty headcount rate (fi gure 1.4). The fact that two of the richest provinces in per capita GDP (Aceh and Papua) have two of the highest poverty head counts should be cause for concern. High per capita GDP as a result of natural resources exploitation in both Aceh and Papua has not benefi ted the poor in the regions.
Figure 1.4. Per capita GDP, public spending, and poverty headcount by province, 2004
38
28
3
12
12
32
(0.5)
-
0.5
1.0
1.5
2.0
2.5
3.0
-5.0
0.0
5.0
10
.0
15
.0
20
.0
25
.0
30
.0
35
.0
40
.0
Annual per capita GDP(million Rp.)
An
nu
al p
er
ca
pit
a p
ub
lic
ex
pe
nd
itu
re(m
illi
on
Rp
.)
Papua
Aceh
Maluku
Kalimantan Timur
JakartaRiau
Source: BPS.Note: The size of the bubbles represents poverty headcount rates.
ACEH PUBLIC EXPENDITURE ANALYSISSPENDING FOR RECONSTRUCTION AND POVERTY REDUCTION
ECONOMIC AND SOCIAL CONDITIONS IN ACEH 9
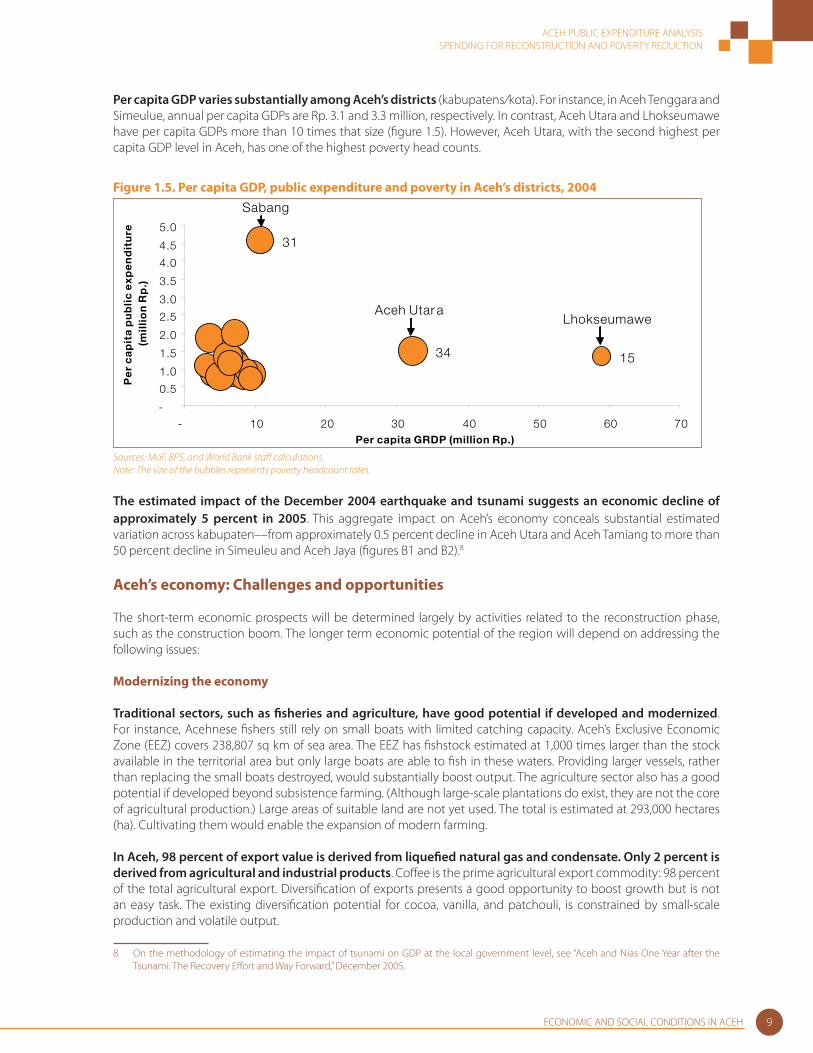
Per capita GDP varies substantially among Aceh’s districts (kabupatens/kota). For instance, in Aceh Tenggara and Simeulue, annual per capita GDPs are Rp. 3.1 and 3.3 million, respectively. In contrast, Aceh Utara and Lhokseumawe have per capita GDPs more than 10 times that size (fi gure 1.5). However, Aceh Utara, with the second highest per capita GDP level in Aceh, has one of the highest poverty head counts.
Figure 1.5. Per capita GDP, public expenditure and poverty in Aceh’s districts, 2004
31
34 15
-
0.5
1.0
1.5
2.0
2.5
3.0
3.5
4.0
4.5
5.0
- 10 20 30 40 50 60 70Per capita GRDP (million Rp.)
Pe
r c
ap
ita
pu
bli
c e
xpe
nd
itu
re(m
illi
on
Rp
.)
Sabang
Aceh Utar aLhokseumawe
Sources: MoF, BPS, and World Bank staff calculations.Note: The size of the bubbles represents poverty headcount rates.
The estimated impact of the December 2004 earthquake and tsunami suggests an economic decline of approximately 5 percent in 2005. This aggregate impact on Aceh’s economy conceals substantial estimated variation across kabupaten––from approximately 0.5 percent decline in Aceh Utara and Aceh Tamiang to more than 50 percent decline in Simeuleu and Aceh Jaya (fi gures B1 and B2).8
Aceh’s economy: Challenges and opportunities
The short-term economic prospects will be determined largely by activities related to the reconstruction phase, such as the construction boom. The longer term economic potential of the region will depend on addressing the following issues:
Modernizing the economy
Traditional sectors, such as fi sheries and agriculture, have good potential if developed and modernized. For instance, Acehnese fi shers still rely on small boats with limited catching capacity. Aceh’s Exclusive Economic Zone (EEZ) covers 238,807 sq km of sea area. The EEZ has fi shstock estimated at 1,000 times larger than the stock available in the territorial area but only large boats are able to fi sh in these waters. Providing larger vessels, rather than replacing the small boats destroyed, would substantially boost output. The agriculture sector also has a good potential if developed beyond subsistence farming. (Although large-scale plantations do exist, they are not the core of agricultural production.) Large areas of suitable land are not yet used. The total is estimated at 293,000 hectares (ha). Cultivating them would enable the expansion of modern farming.
In Aceh, 98 percent of export value is derived from liquefi ed natural gas and condensate. Only 2 percent is derived from agricultural and industrial products. Coff ee is the prime agricultural export commodity: 98 percent of the total agricultural export. Diversifi cation of exports presents a good opportunity to boost growth but is not an easy task. The existing diversifi cation potential for cocoa, vanilla, and patchouli, is constrained by small-scale production and volatile output.
8 On the methodology of estimating the impact of tsunami on GDP at the local government level, see “Aceh and Nias One Year after the Tsunami: The Recovery Eff ort and Way Forward,” December 2005.

ACEH PUBLIC EXPENDITURE ANALYSISSPENDING FOR RECONSTRUCTION AND POVERTY REDUCTION
ECONOMIC AND SOCIAL CONDITIONS IN ACEH10
An estimated 318,000 people in Aceh are seeking or available for work. Large-scale construction projects are gathering steam, requiring an estimated 200,000 workers during the peak of reconstruction eff orts in mid-2006. To maximize the employment gains for Aceh’s population, several policies are needed. According to the International Labour Organisation (ILO), these include9:
1. Organize the labor market (brokering demand and supply for employment)2. Enhance people’s employability by providing skills and vocational training3. Employ people through labor-intensive infrastructure investments. This policy should be complemented
by strategies to promote self-employment and enterprise development.
Small farmers in Aceh usually sell raw products, because local processing facilities do not yet exist. Thus, small farmers do not benefi t from sharing the substantial value added that usually results from processing. Local producers also are poorly organized and are not informed about the full market potential of their products. The development of the local processing businesses would benefi t local producers.
Economic development must include sound environmental policies. Forestry areas in Aceh comprise 74.6 percent of total territory size. These tropical rainforests, rich with wood and wildlife, are severely endangered. Twenty companies have been granted licenses to exploit approximately 1.6 million ha of what has been classifi ed as production forest. The increased demand for wood, driven by tsunami reconstruction needs, already has exacerbated illegal exploitation of forests.
A transparent and stable business climate could increase investor interest in the numerous investment opportunities in the region. Potential sectors include the free port zone Sabang, fi shing and fi sheries, tourism, hotels and restaurants, molding, animal husbandry industry, plantation development, and recreational forests.
Poverty and Social Conditions
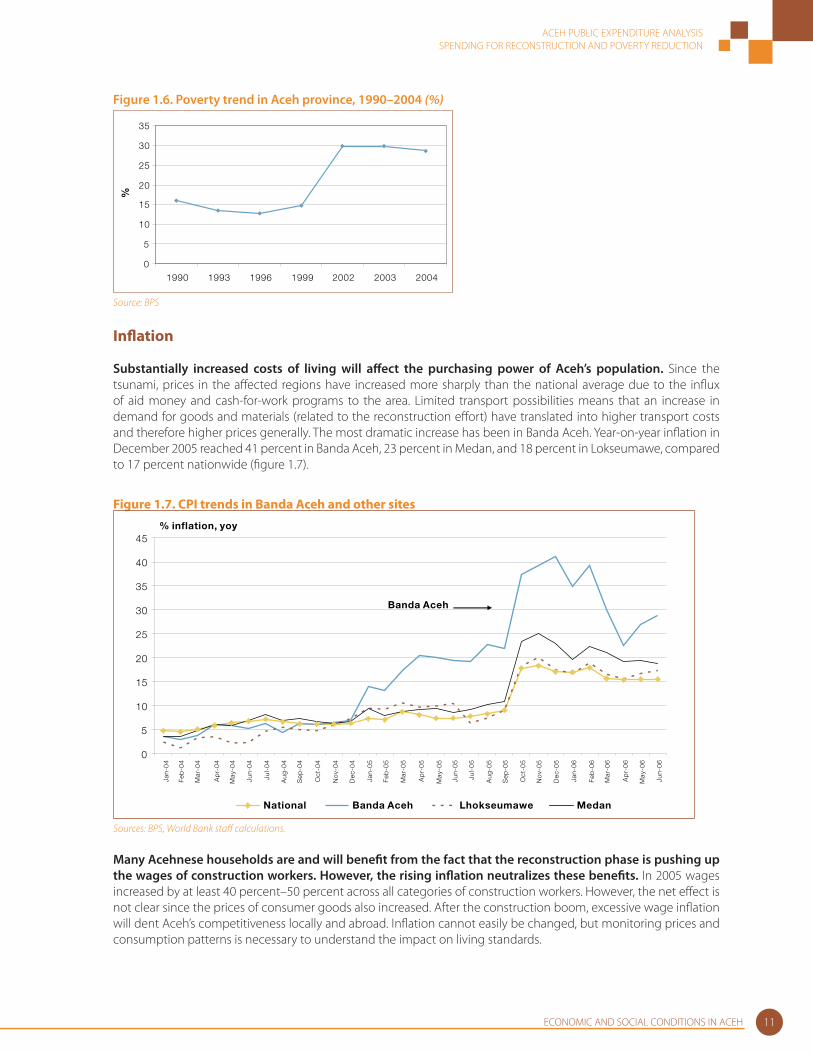
Poverty was widespread in the Aceh Province even before the December 26, 2004 earthquake and tsunami. In 2004 an estimated 1.2 million people (28.5 percent of total population) in Aceh were living below the poverty line: Rp. 129,615, or approximately US$14, per capita per month.10 In fact, the share of people living in absolute poverty in the region has been almost twice as high as that in Indonesia overall (16.7 percent), making Aceh one of the poorest provinces (fi gure 1.6). The December 26, 2004 tsunami exacerbated poverty in the region. An estimated additional 325,000 people in Aceh now are vulnerable to poverty. However, it is important to bear in mind that the estimated increase in poverty does not take into account the mitigating impact of food aid, cash-for-work programs, and other mechanisms of lifting people’s welfare.11 There has been a signifi cant spatial variation in poverty rates across districts in Aceh. This variation has become even more pronounced due to the impact of the tsunami. In the most aff ected districts, more than 50 percent of the population is likely to be living in poverty (fi gure B3).
9 International Labour Organization, 2005.
10 The poverty line represents the monetary value of the typical food basket that provides 2100 calories per capita per day plus the necessary nonfood expenditures.
11 On the methodology of estimating the poverty impact of tsunami, see “Aceh and Nias One Year after the Tsunami: The Recovery Eff ort and Way Forward” 2005.
ACEH PUBLIC EXPENDITURE ANALYSISSPENDING FOR RECONSTRUCTION AND POVERTY REDUCTION
ECONOMIC AND SOCIAL CONDITIONS IN ACEH 11
Figure 1.6. Poverty trend in Aceh province, 1990–2004 (%)
0
5
10
15
20
25
30
35
1990 1993 1996 1999 2002 2003 2004
%
Source: BPS
Infl ation
Substantially increased costs of living will aff ect the purchasing power of Aceh’s population. Since the tsunami, prices in the aff ected regions have increased more sharply than the national average due to the infl ux of aid money and cash-for-work programs to the area. Limited transport possibilities means that an increase in demand for goods and materials (related to the reconstruction eff ort) have translated into higher transport costs and therefore higher prices generally. The most dramatic increase has been in Banda Aceh. Year-on-year infl ation in December 2005 reached 41 percent in Banda Aceh, 23 percent in Medan, and 18 percent in Lokseumawe, compared to 17 percent nationwide (fi gure 1.7).
Figure 1.7. CPI trends in Banda Aceh and other sites
0
5
10
15
20
25
30
35
40
45
Jan-
04
Feb
- 04
Ma r
- 04
Ap
r -0
4
Ma y
- 04
J un -
04
J ul -
04
Au g
- 04
Se p
- 04
Oc t
- 04
No
v -0
4
De c
- 04
J an -
05
F eb
- 05
Ma r
- 05
Ap
r -0
5
Ma y
- 05
J un -
05
J ul -
05
Au g
- 05
Se p
- 05
Oc t
- 05
No
v -0
5
De c
- 05
J an -
06
F eb
- 06
Ma r
- 06
Ap
r -0
6
Ma y
- 06
J un -
06
National Banda Aceh Lhokseumawe Medan
% inflation, yoy
Banda Aceh
Sources: BPS, World Bank staff calculations.
Many Acehnese households are and will benefi t from the fact that the reconstruction phase is pushing up the wages of construction workers. However, the rising infl ation neutralizes these benefi ts. In 2005 wages increased by at least 40 percent–50 percent across all categories of construction workers. However, the net eff ect is not clear since the prices of consumer goods also increased. After the construction boom, excessive wage infl ation will dent Aceh’s competitiveness locally and abroad. Infl ation cannot easily be changed, but monitoring prices and consumption patterns is necessary to understand the impact on living standards.
ACEH PUBLIC EXPENDITURE ANALYSISSPENDING FOR RECONSTRUCTION AND POVERTY REDUCTION
ECONOMIC AND SOCIAL CONDITIONS IN ACEH12
Livelihoods
Fisheries, agriculture, and small enterprises traditionally have been the key pillars supporting the livelihoods of the Achenese. However, these sectors are facing a number of challenges related to the impact of natural disasters and the changing structure of the economy. Importantly, restoring livelihoods is more than rebuilding physical assets. While the replacement of assets is of high importance, the priority challenge is to provide comprehensive livelihood support for sustainable recovery of the aff ected communities. The restoration and development of livelihoods should take place with an understanding of the current and future needs and resource base. During the years prior to the tsunami, as urban and service-based industries declined, the Acehnese workforce had made a signifi cant shift back to the agriculture and fi sheries sectors. If the underlying factors that caused the sectoral composition of the economy to change are not addressed, household incomes will drop signifi cantly once resources allocated to reconstruction start to decline.
Pressure to quickly restore the asset base resulted in inadequate attention to quality. As an example, in the fi sheries sector, aid providers have aimed to deliver as many boats as soon as possible, resulting in the delivery of many low-cost, smaller boats. Lack of consultation and coordination with local fi shers and poor quality construction, has resulted in many of the delivered boats’ being abandoned due to their unsuitability to local conditions.
Agriculture and fi sheries urgently need to be modernized. Even before the disaster, both sectors were characterized by a large number of small farmers and fi shers producing mainly for their own consumption or for the immediate local markets. Processing and packaging was done primarily outside the region. There is a need to modernize both sectors through new technologies, fi nance, and business development services; and increasing the scale of production.
Creating Jobs
The impact of the tsunami on employment has been less severe than initially expected, but it has led to major changes in the composition and structure of the workforce. While unemployment rose in the immediate aftermath of the disaster, labor force participation has recovered rapidly. The participation of adult males in the labor force has returned to pre-tsunami levels, and the participation of women and youths (aged 15–24) has grown substantially. These previously untapped labor sources could contribute to faster economic growth and recovery. The increasing number of adolescents seeking work instead of enrolling in schools decreases their opportunities for training and education, which would enable them to get better paid jobs in the long term.
Reconstruction needs have resulted in a construction boom. Construction work in Aceh will be valued in the range of US$100–$150 million per month for the next 2 years, compared to less than US$10 million per month in 2003. To meet this demand, ILO estimates that approximately 200,000 skilled workers (carpenters, bricklayers) will be required, as well as a signifi cant number of unskilled workers. In addition, the construction boom will create a large secondary demand for goods and services. Nonetheless, the construction boom will not provide suffi cient jobs for all unemployed. The latest post-disaster census shows that nearly 20 percent of the labor force (more than 300,000 people) is actively seeking work or are available for work. The highest rates are in the 15–24 age group, in which nearly 25 percent is searching for work. Upgrading the employability of the local people through skills training is a key priority. Skills training must be demand-driven and linked to jobs in the market, with a focus on short-cycle training for workers certain to be engaged.
2Fund Flows and Budget Processes
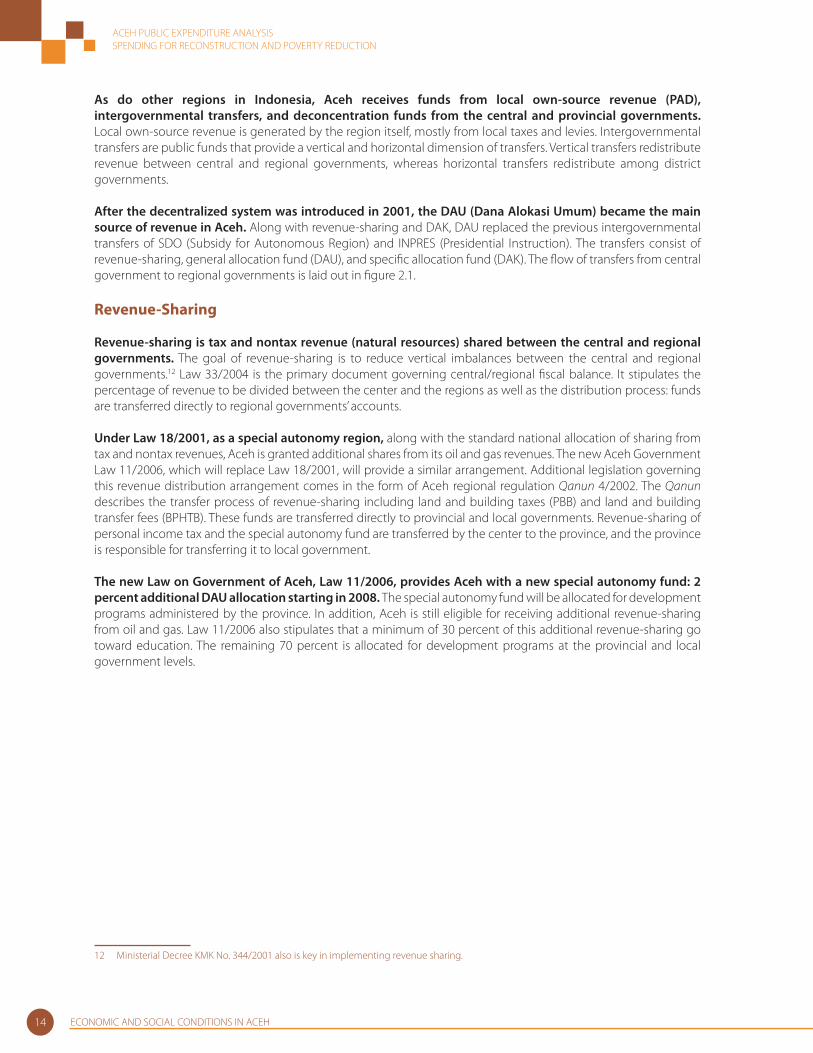
ACEH PUBLIC EXPENDITURE ANALYSISSPENDING FOR RECONSTRUCTION AND POVERTY REDUCTION
ECONOMIC AND SOCIAL CONDITIONS IN ACEH14
As do other regions in Indonesia, Aceh receives funds from local own-source revenue (PAD), intergovernmental transfers, and deconcentration funds from the central and provincial governments. Local own-source revenue is generated by the region itself, mostly from local taxes and levies. Intergovernmental transfers are public funds that provide a vertical and horizontal dimension of transfers. Vertical transfers redistribute revenue between central and regional governments, whereas horizontal transfers redistribute among district governments.
After the decentralized system was introduced in 2001, the DAU (Dana Alokasi Umum) became the main source of revenue in Aceh. Along with revenue-sharing and DAK, DAU replaced the previous intergovernmental transfers of SDO (Subsidy for Autonomous Region) and INPRES (Presidential Instruction). The transfers consist of revenue-sharing, general allocation fund (DAU), and specifi c allocation fund (DAK). The fl ow of transfers from central government to regional governments is laid out in fi gure 2.1.
Revenue-Sharing
Revenue-sharing is tax and nontax revenue (natural resources) shared between the central and regional governments. The goal of revenue-sharing is to reduce vertical imbalances between the central and regional governments.12 Law 33/2004 is the primary document governing central/regional fi scal balance. It stipulates the percentage of revenue to be divided between the center and the regions as well as the distribution process: funds are transferred directly to regional governments’ accounts.
Under Law 18/2001, as a special autonomy region, along with the standard national allocation of sharing from tax and nontax revenues, Aceh is granted additional shares from its oil and gas revenues. The new Aceh Government Law 11/2006, which will replace Law 18/2001, will provide a similar arrangement. Additional legislation governing this revenue distribution arrangement comes in the form of Aceh regional regulation Qanun 4/2002. The Qanun describes the transfer process of revenue-sharing including land and building taxes (PBB) and land and building transfer fees (BPHTB). These funds are transferred directly to provincial and local governments. Revenue-sharing of personal income tax and the special autonomy fund are transferred by the center to the province, and the province is responsible for transferring it to local government.
The new Law on Government of Aceh, Law 11/2006, provides Aceh with a new special autonomy fund: 2 percent additional DAU allocation starting in 2008. The special autonomy fund will be allocated for development programs administered by the province. In addition, Aceh is still eligible for receiving additional revenue-sharing from oil and gas. Law 11/2006 also stipulates that a minimum of 30 percent of this additional revenue-sharing go toward education. The remaining 70 percent is allocated for development programs at the provincial and local government levels.
12 Ministerial Decree KMK No. 344/2001 also is key in implementing revenue sharing.
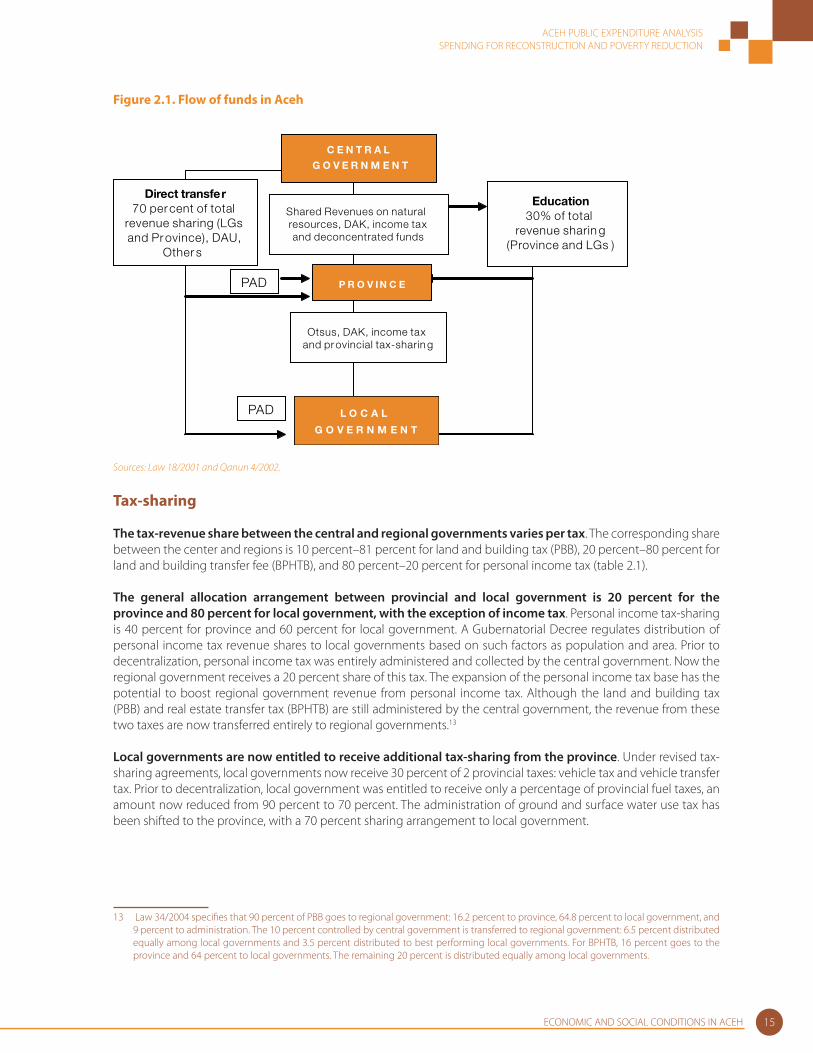
ACEH PUBLIC EXPENDITURE ANALYSISSPENDING FOR RECONSTRUCTION AND POVERTY REDUCTION
ECONOMIC AND SOCIAL CONDITIONS IN ACEH 15
Figure 2.1. Flow of funds in Aceh
C E N T R A L
G O V E R N M E N T
PAD
Direct transfer70 percent of total
revenue sharing (LGsand Province), DAU,
Other s
Shared Revenues on natural resources, DAK, income taxand deconcentrated funds
L O C A L
G O V E R N M E N T
Otsus, DAK, income taxand provincial tax-sharin g
P R O V IN C E
Education30% of total
revenue sharin g(Province and LGs )
PAD
Sources: Law 18/2001 and Qanun 4/2002.
Tax-sharing
The tax-revenue share between the central and regional governments varies per tax. The corresponding share between the center and regions is 10 percent–81 percent for land and building tax (PBB), 20 percent–80 percent for land and building transfer fee (BPHTB), and 80 percent–20 percent for personal income tax (table 2.1).
The general allocation arrangement between provincial and local government is 20 percent for the province and 80 percent for local government, with the exception of income tax. Personal income tax-sharing is 40 percent for province and 60 percent for local government. A Gubernatorial Decree regulates distribution of personal income tax revenue shares to local governments based on such factors as population and area. Prior to decentralization, personal income tax was entirely administered and collected by the central government. Now the regional government receives a 20 percent share of this tax. The expansion of the personal income tax base has the potential to boost regional government revenue from personal income tax. Although the land and building tax (PBB) and real estate transfer tax (BPHTB) are still administered by the central government, the revenue from these two taxes are now transferred entirely to regional governments.13
Local governments are now entitled to receive additional tax-sharing from the province. Under revised tax-sharing agreements, local governments now receive 30 percent of 2 provincial taxes: vehicle tax and vehicle transfer tax. Prior to decentralization, local government was entitled to receive only a percentage of provincial fuel taxes, an amount now reduced from 90 percent to 70 percent. The administration of ground and surface water use tax has been shifted to the province, with a 70 percent sharing arrangement to local government.
13 Law 34/2004 specifi es that 90 percent of PBB goes to regional government: 16.2 percent to province, 64.8 percent to local government, and 9 percent to administration. The 10 percent controlled by central government is transferred to regional government: 6.5 percent distributed equally among local governments and 3.5 percent distributed to best performing local governments. For BPHTB, 16 percent goes to the province and 64 percent to local governments. The remaining 20 percent is distributed equally among local governments.

ACEH PUBLIC EXPENDITURE ANALYSISSPENDING FOR RECONSTRUCTION AND POVERTY REDUCTION
FUND FLOWS AND BUDGET PROCESSES16
Nontax (natural resources) sharing
Law 33/2004 provides for more types of natural resources revenue-sharing between the national and regional governments. Previously, natural resources revenue-sharing included only forestry and mining. Under Law 33/2004, fi sheries, oil, and gas also are included under the revenue-sharing arrangement. The general allocation of the central and regional government for nontax revenue is 20 percent-80 percent. Oil and gas revenues are two important exceptions. Regions receive diff erent percentages of oil, gas and reforestation revenues. Most signifi cant for Aceh are oil and gas allocation, which are 85-15 and 70-30, respectively. The special autonomy legislation gives Aceh an additional 55 percent for oil and 40 percent for gas. Thus, Aceh receives 70 percent of oil and gas revenues generated in Aceh.14
Table 2.1. Revenue-sharing arrangements and the Aced special autonomy fund
Revenue-sharing Central government Subnational Province
All kabupaten
/kota
Producing kabupaten/
kota
Nonproducing local
government
Tax-sharing
Land and Building Tax (PBB) 10 81 16.2 64.8Land and Building Transfer Fee (BPHTB)
20 80 16 64
Personal Income Tax (PPh) 80 20 8 12
(provide the list of m ajor taxes)
Nontax-sharing
Forestry: Land-rent (IHPH) 20 80 16 64
Forestry: Resource-rent (PSDH) 20 80 16 64 32 32
Reforestation 60 40 40
Mining: Land-rent 20 80 16 64
Mining: Royalty 20 80 16 64 32 32
Fishery 20 80 80
Oil (nontax) net revenue** 30 15 3 12 6 6
Special autonomy fund 55 22 33 13.75 19.25
LNG (nontax) 30 30 6 24 12 12
Special autonomy fund 40 16 24 10 14
Geothermal 20 80 16 64 32 32
Other tax-sharing (province’s tax revenue)
Motor vehicle tax, water vehicle tax, motor/water vehicle ownership charges
100 70 30
Motor vehicle fuel tax, water (ground and surface) use tax
100 30 70
Sources: Law 18/2001, Law 33/2004, and Qanun 4/2002 compiled by World Bank staff . Notes: ** = Distribution between provincial and local governments is stipulated by Qanun.
The allocation of the natural resources sharing between province and local government also follows the 20-80 formula. For revenue generated from the forestry-resource rent, mining, oil, and gas, another 50-50 allocation from the 80 percent allocation for local government is provided for producing and nonproducing districts (local government), in which the nonproducing local governments have to equally distribute the 50 percent share among them. As for revenues that do not follow the 50-50 allocation from the 80 percent allocation, resources must be
14 Law 33/2004 stipulates that, until 2009, oil and gas revenue shares between the center and regions are 85-15 and 70-30 for oil and gas, respectively. Starting in 2009, the shares of oil and gas retained by the center will be 84.5 and 69.5 percent, and for regions 15.5 and 30.5 percent (in which 0.5 percent will be allocated to the education sector).
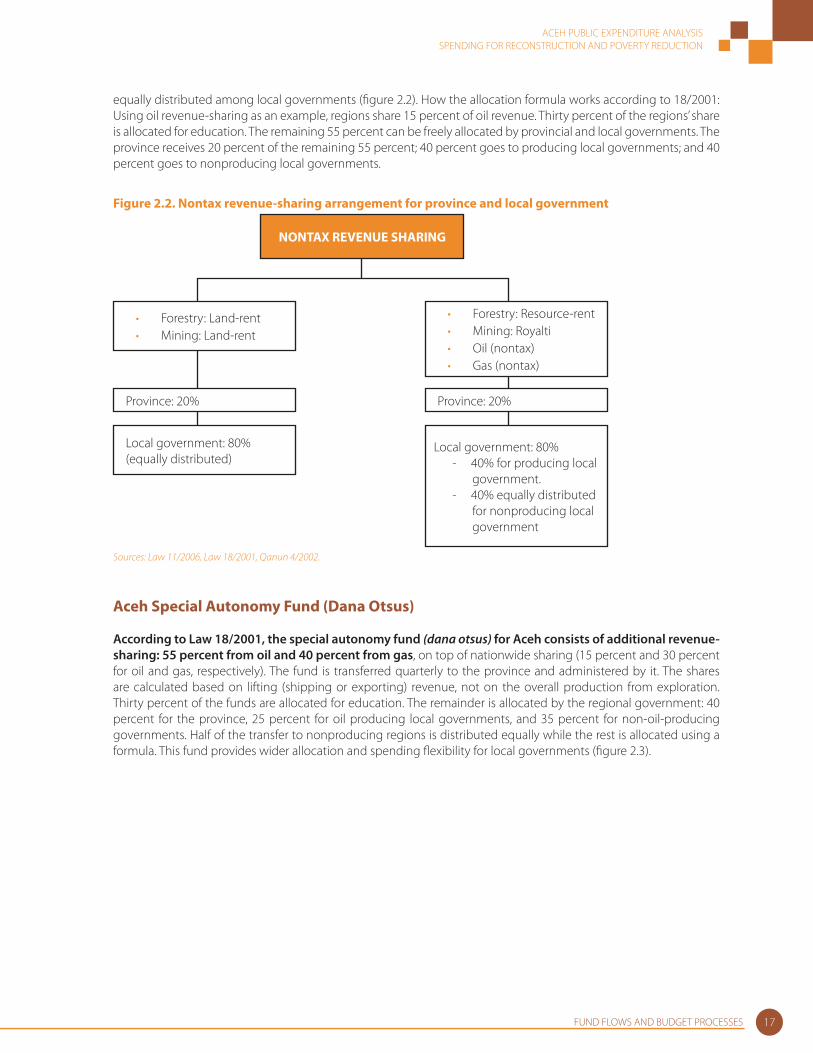
ACEH PUBLIC EXPENDITURE ANALYSISSPENDING FOR RECONSTRUCTION AND POVERTY REDUCTION
FUND FLOWS AND BUDGET PROCESSES 17
equally distributed among local governments (fi gure 2.2). How the allocation formula works according to 18/2001: Using oil revenue-sharing as an example, regions share 15 percent of oil revenue. Thirty percent of the regions’ share is allocated for education. The remaining 55 percent can be freely allocated by provincial and local governments. The province receives 20 percent of the remaining 55 percent; 40 percent goes to producing local governments; and 40 percent goes to nonproducing local governments.
Figure 2.2. Nontax revenue-sharing arrangement for province and local government
NONTAX REVENUE SHARING
Forestry: Land-rentMining: Land-rent
••
Local government: 80% (equally distributed)
Province: 20%
Forestry: Resource-rentMining: RoyaltiOil (nontax)Gas (nontax)
••••
Local government: 80% - 40% for producing local
government.- 40% equally distributed
for nonproducing local government
Province: 20%
Sources: Law 11/2006, Law 18/2001, Qanun 4/2002.
Aceh Special Autonomy Fund (Dana Otsus)
According to Law 18/2001, the special autonomy fund (dana otsus) for Aceh consists of additional revenue-sharing: 55 percent from oil and 40 percent from gas, on top of nationwide sharing (15 percent and 30 percent for oil and gas, respectively). The fund is transferred quarterly to the province and administered by it. The shares are calculated based on lifting (shipping or exporting) revenue, not on the overall production from exploration. Thirty percent of the funds are allocated for education. The remainder is allocated by the regional government: 40 percent for the province, 25 percent for oil producing local governments, and 35 percent for non-oil-producing governments. Half of the transfer to nonproducing regions is distributed equally while the rest is allocated using a formula. This fund provides wider allocation and spending fl exibility for local governments (fi gure 2.3).
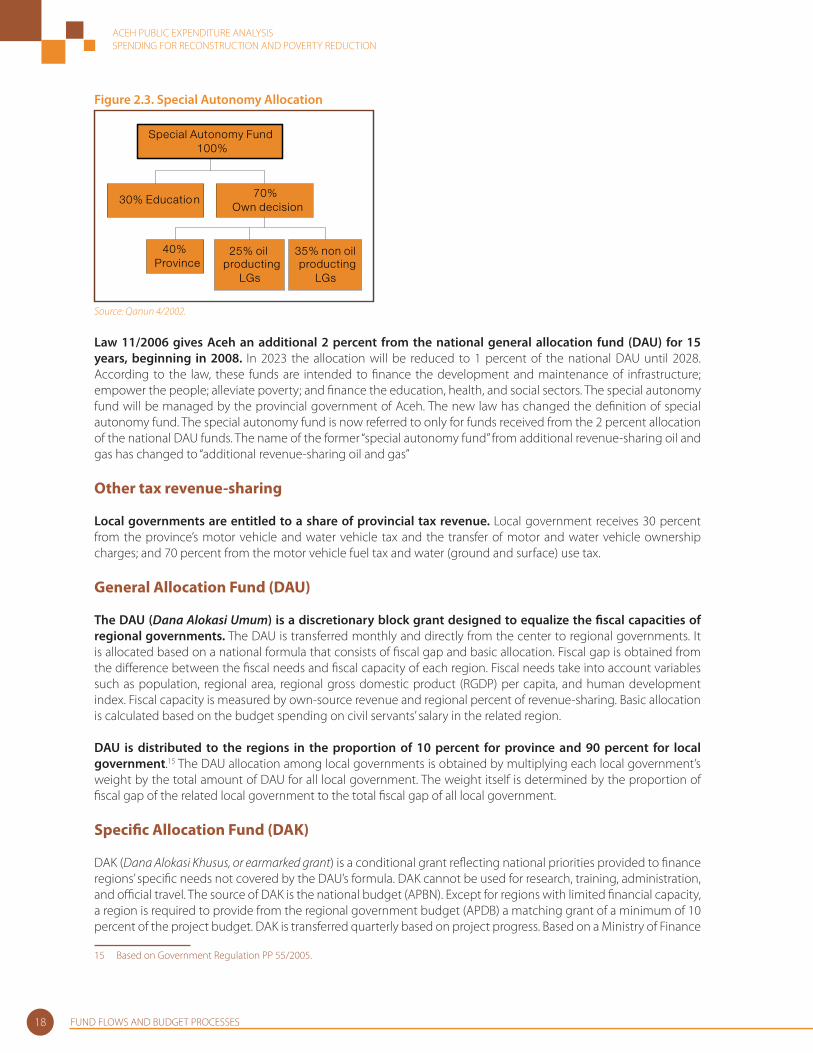
ACEH PUBLIC EXPENDITURE ANALYSISSPENDING FOR RECONSTRUCTION AND POVERTY REDUCTION
FUND FLOWS AND BUDGET PROCESSES18
Figure 2.3. Special Autonomy Allocation
Special Autonomy Fund100%
30% Educatio n
40% Province
25% oil producting
LGs
35% non oil producting
LGs
70%Own decision
Source: Qanun 4/2002.
Law 11/2006 gives Aceh an additional 2 percent from the national general allocation fund (DAU) for 15 years, beginning in 2008. In 2023 the allocation will be reduced to 1 percent of the national DAU until 2028. According to the law, these funds are intended to fi nance the development and maintenance of infrastructure; empower the people; alleviate poverty; and fi nance the education, health, and social sectors. The special autonomy fund will be managed by the provincial government of Aceh. The new law has changed the defi nition of special autonomy fund. The special autonomy fund is now referred to only for funds received from the 2 percent allocation of the national DAU funds. The name of the former “special autonomy fund” from additional revenue-sharing oil and gas has changed to “additional revenue-sharing oil and gas”
Other tax revenue-sharing
Local governments are entitled to a share of provincial tax revenue. Local government receives 30 percent from the province’s motor vehicle and water vehicle tax and the transfer of motor and water vehicle ownership charges; and 70 percent from the motor vehicle fuel tax and water (ground and surface) use tax.
General Allocation Fund (DAU)
The DAU (Dana Alokasi Umum) is a discretionary block grant designed to equalize the fi scal capacities of regional governments. The DAU is transferred monthly and directly from the center to regional governments. It is allocated based on a national formula that consists of fi scal gap and basic allocation. Fiscal gap is obtained from the diff erence between the fi scal needs and fi scal capacity of each region. Fiscal needs take into account variables such as population, regional area, regional gross domestic product (RGDP) per capita, and human development index. Fiscal capacity is measured by own-source revenue and regional percent of revenue-sharing. Basic allocation is calculated based on the budget spending on civil servants’ salary in the related region.
DAU is distributed to the regions in the proportion of 10 percent for province and 90 percent for local government.15 The DAU allocation among local governments is obtained by multiplying each local government’s weight by the total amount of DAU for all local government. The weight itself is determined by the proportion of fi scal gap of the related local government to the total fi scal gap of all local government.
Specifi c Allocation Fund (DAK)
DAK (Dana Alokasi Khusus, or earmarked grant) is a conditional grant refl ecting national priorities provided to fi nance regions’ specifi c needs not covered by the DAU’s formula. DAK cannot be used for research, training, administration, and offi cial travel. The source of DAK is the national budget (APBN). Except for regions with limited fi nancial capacity, a region is required to provide from the regional government budget (APDB) a matching grant of a minimum of 10 percent of the project budget. DAK is transferred quarterly based on project progress. Based on a Ministry of Finance
15 Based on Government Regulation PP 55/2005.
ACEH PUBLIC EXPENDITURE ANALYSISSPENDING FOR RECONSTRUCTION AND POVERTY REDUCTION
FUND FLOWS AND BUDGET PROCESSES 19
(MoF) decree, DAK is transferred directly to provincial and local government. In Aceh, Qanun 4/2002 stipulates that DAK is transferred by the central government to the province, which then is responsible for distributing it to local governments. Starting in 2003, DAK covers several sectors such as education, health, infrastructure, and government facilities (for new local governments). Deconcentrated and Emergency Funds
Besides the three types of transfer mentioned above, regions also receive the deconcentration fund (Decon) from central government.16 Decon can be considered revenue for the province and local government since the actual implementation is in the region.17 The fund is transferred to the province based on central government priorities in the form of development expenditures that do not cover routine/recurrent spending of vertical agencies in the region for nonphysical projects. Law 33/2004 specifi es that provinces can request emergency funds from the central government to fi nance extraordinary and urgent needs, such as natural disasters, that cannot be covered by regional government budget (APBD). Although the program is implemented by the province and local government, decon is not recorded in the provincial and local government budget (APBD). Instead, decon is recorded in the national budget (APBN). The province and local government report their spending, and are accountable directly, to central government.
Own-Source Revenue (PAD)
The revised decentralization law has given local governments the opportunity to expand their revenue base, particularly from taxes. Law 33/2004 allows for local taxes, local levies, revenues from local state-owned enterprises, and other eligible local revenues. In Aceh, Law 18/2001 adds another component, zakat or alms, as one of the revenue sources.18 By and large, arrangements on local taxes are based on Law 34/2000 and government regulations (PP 65/2001 and 66/2001) on regional tax and levies.
Budget Process
Five pieces of legislation govern budget processes and accountability: Law 17/2003, Law 15/2004, Law 32/2004, Law 33/2004, and Ministerial Decree 29/2002. The budget process starts in January of the preceding year with the formulation of a regional work plan (RKPD) by the regional government to serve as the basis for the general policy of the regional budget (APBD). Mid-June, the regional government presents the APBD’s general policy to Regional Parliament (DPRD). In the fi rst week of October, the regional government submits a draft of the APBD to the DPRD in the form of a local government regulation, or Perda. The DPRD together with regional government should agree on the proposed APBD at least one month before the start of the fi scal year (fi gure B4).
Budget evaluation begins with the presentation of the fi rst semester budget realization and estimates of the second semester to the DPRD at the end of July of the fi scal year concerned. As the fi scal year ends, the realization of APBD is audited by BPK (National Auditing Agency) and the audit report should be submitted to DPRD within two months after the APBD is received. Finally, the head of the region submits a draft Perda and an accountability report to the DPRD for approval, at the latest six months after the end of the fi scal year concerned (fi gure B5).
In practice, the budget process often does not follow the timeline set by the laws and regulations. A 2005 study on district governments’ capacity in 10 tsunami-aff ected districts shows that to receive budget approval by local parliament takes an average of 4 months. According to regulations, the budget should be submitted to the regional parliament in October and approved by the parliament before the new fi scal year begins. In a few districts, the budget was submitted after the new fi scal year had begun and was approved as late as June. Simeulue and
16 The detailed arrangement of the deconcentration fund is stipulated in Law 33/2004.
17 The deconcentration fund is central government development spending in the region carried out by the province or local government as a part of line ministries’ responsibilities. The main objective is to fi nance central government functions and activities related to national priorities by fi nancing nonphysical assets (dekonsentrasi) and physical assets (tugas pembantuan).
18 Zakat is the amount of money that every adult, mentally stable, free, and fi nancially able Muslim, male and female, must pay to support specifi c categories of people (poor and needy). The amount of money that needs to be paid is 2.5 percent of the person’s income, which can be done monthly or annually.
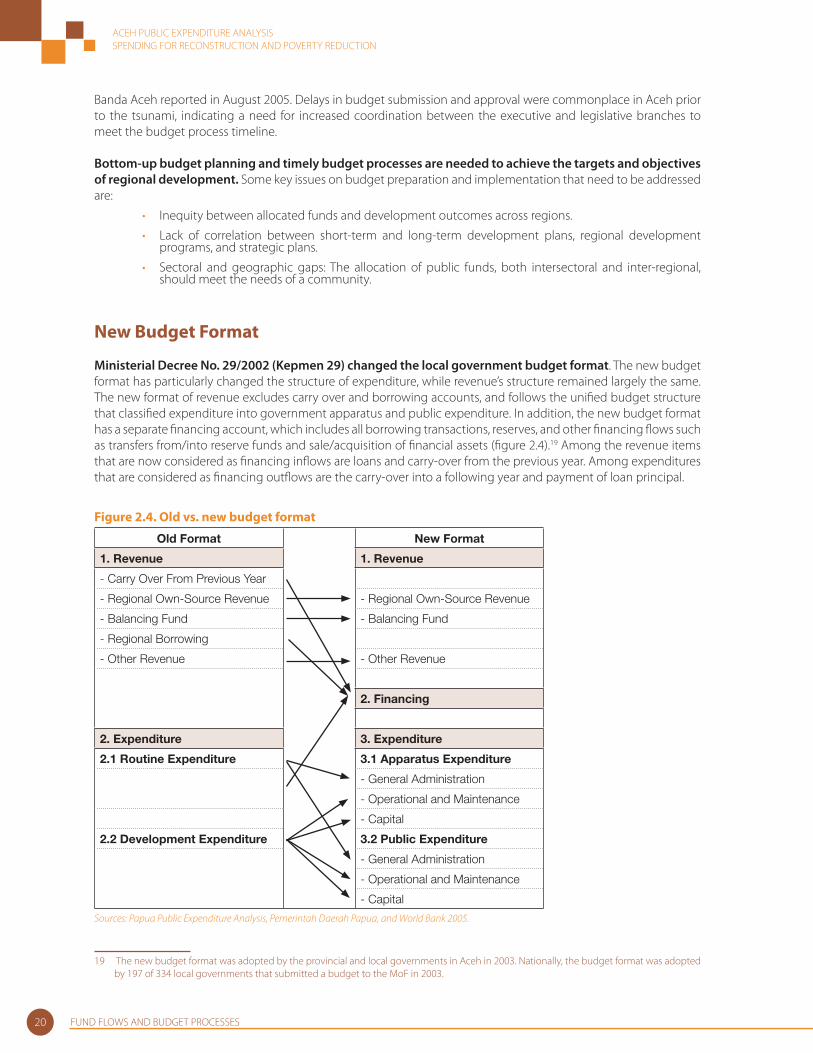
ACEH PUBLIC EXPENDITURE ANALYSISSPENDING FOR RECONSTRUCTION AND POVERTY REDUCTION
FUND FLOWS AND BUDGET PROCESSES20
Banda Aceh reported in August 2005. Delays in budget submission and approval were commonplace in Aceh prior to the tsunami, indicating a need for increased coordination between the executive and legislative branches to meet the budget process timeline.
Bottom-up budget planning and timely budget processes are needed to achieve the targets and objectives of regional development. Some key issues on budget preparation and implementation that need to be addressed are:
Inequity between allocated funds and development outcomes across regions.
Lack of correlation between short-term and long-term development plans, regional development programs, and strategic plans.
Sectoral and geographic gaps: The allocation of public funds, both intersectoral and inter-regional, should meet the needs of a community.
New Budget Format
Ministerial Decree No. 29/2002 (Kepmen 29) changed the local government budget format. The new budget format has particularly changed the structure of expenditure, while revenue’s structure remained largely the same. The new format of revenue excludes carry over and borrowing accounts, and follows the unifi ed budget structure that classifi ed expenditure into government apparatus and public expenditure. In addition, the new budget format has a separate fi nancing account, which includes all borrowing transactions, reserves, and other fi nancing fl ows such as transfers from/into reserve funds and sale/acquisition of fi nancial assets (fi gure 2.4).19 Among the revenue items that are now considered as fi nancing infl ows are loans and carry-over from the previous year. Among expenditures that are considered as fi nancing outfl ows are the carry-over into a following year and payment of loan principal.
Figure 2.4. Old vs. new budget format
Old Format New Format
1. Revenue 1. Revenue
- Carry Over From Previous Year
- Regional Own-Source Revenue - Regional Own-Source Revenue
- Balancing Fund - Balancing Fund
- Regional Borrowing
- Other Revenue - Other Revenue
2. Financing
2. Expenditure 3. Expenditure
2.1 Routine Expenditure 3.1 Apparatus Expenditure
- General Administration
- Operational and Maintenance
- Capital
2.2 Development Expenditure 3.2 Public Expenditure
- General Administration
- Operational and Maintenance
- Capital
Sources: Papua Public Expenditure Analysis, Pemerintah Daerah Papua, and World Bank 2005.
19 The new budget format was adopted by the provincial and local governments in Aceh in 2003. Nationally, the budget format was adopted by 197 of 334 local governments that submitted a budget to the MoF in 2003.
•
•
•
ACEH PUBLIC EXPENDITURE ANALYSISSPENDING FOR RECONSTRUCTION AND POVERTY REDUCTION
FUND FLOWS AND BUDGET PROCESSES 21
The new format of expenditure aff ects the structure of local budgets signifi cantly because it increases focus on benefi ciaries rather than programs/projects. Under the new structure, spending on activities/programs that benefi t the general public will be reported under public expenditure, while spending on programs earmarked for the government apparatus will be reported under apparatus expenditure. It is expected that, with the new format, duplication of the activities’ or projects’ budgets can be avoided and better analysis can be carried out. Nevertheless, if no clear guidance is given to local governments on how to classify items under the new budget format, an analysis of public fi nances and expenditures may become problematic, and optimal results may not be reached.

ACEH PUBLIC EXPENDITURE ANALYSISSPENDING FOR RECONSTRUCTION AND POVERTY REDUCTION
FUND FLOWS AND BUDGET PROCESSES22

3Revenue and Financing
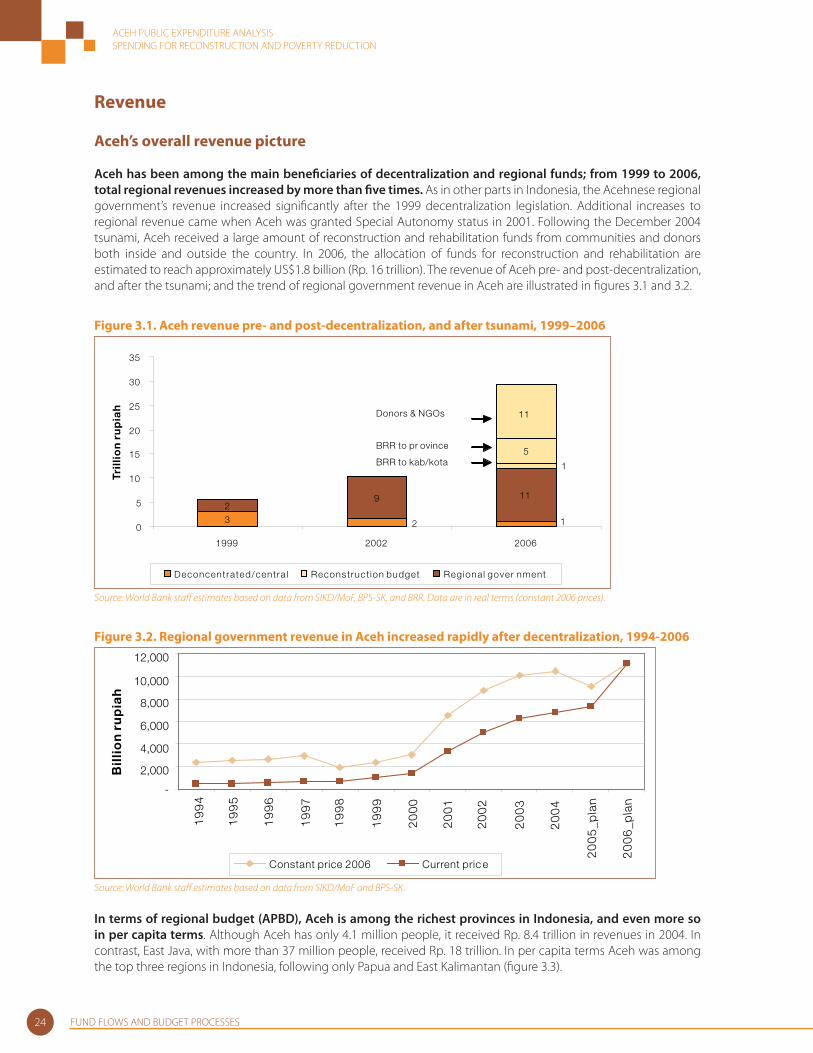
ACEH PUBLIC EXPENDITURE ANALYSISSPENDING FOR RECONSTRUCTION AND POVERTY REDUCTION
FUND FLOWS AND BUDGET PROCESSES24
Revenue
Aceh’s overall revenue picture
Aceh has been among the main benefi ciaries of decentralization and regional funds; from 1999 to 2006, total regional revenues increased by more than fi ve times. As in other parts in Indonesia, the Acehnese regional government’s revenue increased signifi cantly after the 1999 decentralization legislation. Additional increases to regional revenue came when Aceh was granted Special Autonomy status in 2001. Following the December 2004 tsunami, Aceh received a large amount of reconstruction and rehabilitation funds from communities and donors both inside and outside the country. In 2006, the allocation of funds for reconstruction and rehabilitation are estimated to reach approximately US$1.8 billion (Rp. 16 trillion). The revenue of Aceh pre- and post-decentralization, and after the tsunami; and the trend of regional government revenue in Aceh are illustrated in fi gures 3.1 and 3.2.
Figure 3.1. Aceh revenue pre- and post-decentralization, and after tsunami, 1999–2006
3
9 11
5
11
2 1
2
1
0
5
10
15
20
25
30
35
1999 2002 2006
Tril
lio
n ru
pia
h
Deconcentrated/centra l Reconstruct ion budget Regional gover nment
Donors & NGOs
BRR to pr ovince
BRR to kab/kota
Source: World Bank staff estimates based on data from SIKD/MoF, BPS-SK, and BRR. Data are in real terms (constant 2006 prices).
Figure 3.2. Regional government revenue in Aceh increased rapidly after decentralization, 1994-2006
-
2,000
4,000
6,000
8,000
10,000
12,000
19
94
19
95
19
96
19
97
19
98
19
99
20
00
20
01
20
02
20
03
20
04
20
05
_pla
n
20
06
_pla
n
Bil
lio
n ru
pia
h
Constant price 2006 Current pric e
Source: World Bank staff estimates based on data from SIKD/MoF and BPS-SK.
In terms of regional budget (APBD), Aceh is among the richest provinces in Indonesia, and even more so in per capita terms. Although Aceh has only 4.1 million people, it received Rp. 8.4 trillion in revenues in 2004. In contrast, East Java, with more than 37 million people, received Rp. 18 trillion. In per capita terms Aceh was among the top three regions in Indonesia, following only Papua and East Kalimantan (fi gure 3.3).
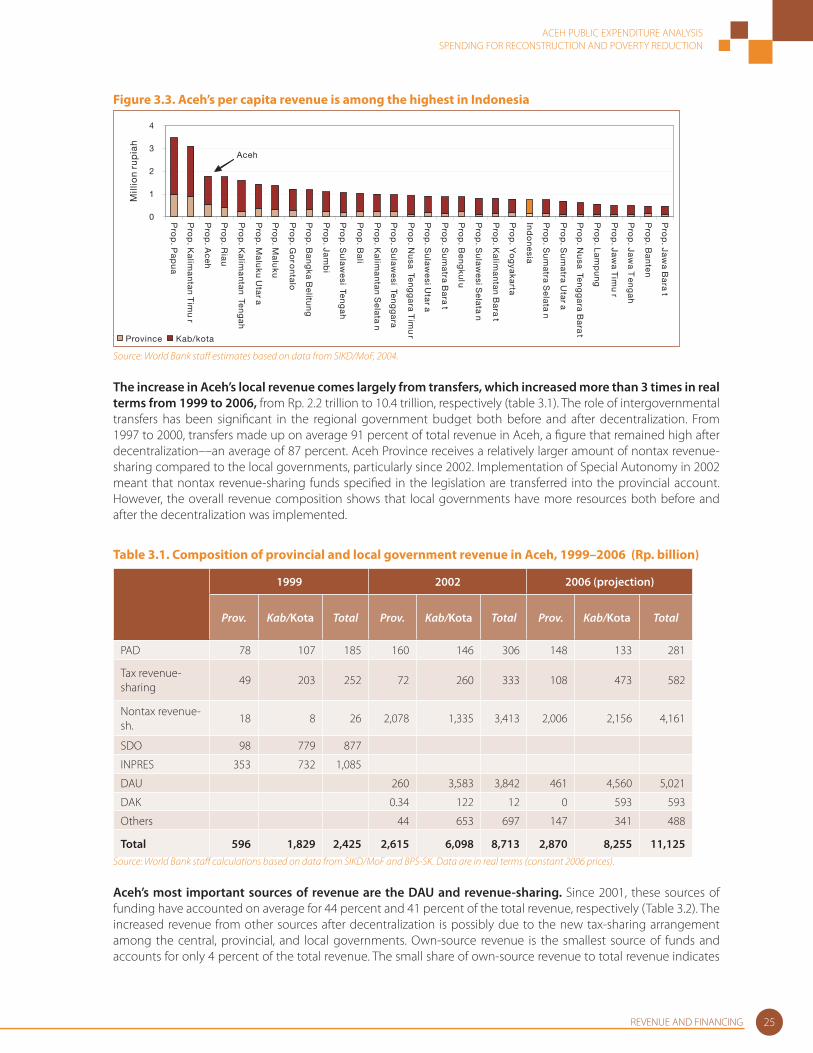
ACEH PUBLIC EXPENDITURE ANALYSISSPENDING FOR RECONSTRUCTION AND POVERTY REDUCTION
REVENUE AND FINANCING 25
Figure 3.3. Aceh’s per capita revenue is among the highest in Indonesia
0
1
2
3
4
Pro
p. P
ap
ua
Pro
p. K
alim
an
tan T
imu
r
Pro
p. A
ce
h
Pro
p. R
iau
Pro
p. K
alim
an
tan Te
ng
ah
Pro
p. M
alu
ku Uta
ra
Pro
p. M
alu
ku
Pro
p. G
oro
nta
lo
Pro
p. B
an
gka B
elitu
ng
Pro
p. Ja
mb
i
Pro
p. S
ula
we
si Ten
ga
h
Pro
p. B
ali
Pro
p. K
alim
an
tan S
ela
tan
Pro
p. S
ula
we
si Ten
gg
ara
Pro
p. N
usa Te
ng
ga
ra Tim
ur
Pro
p. S
ula
we
si Uta
ra
Pro
p. S
um
atra B
ara
t
Pro
p. B
en
gku
lu
Pro
p. S
ula
we
si Se
lata
n
Pro
p. K
alim
an
tan B
ara
t
Pro
p. Y
og
yaka
rta
Ind
on
esia
Pro
p. S
um
atra S
ela
tan
Pro
p. S
um
atra U
tara
Pro
p. N
usa Te
ng
ga
ra Ba
rat
Pro
p. L
am
pu
ng
Pro
p. Ja
wa T
imu
r
Pro
p. Ja
wa T
en
ga
h
Pro
p. B
an
ten
Pro
p. Ja
wa B
ara
t
Mill
ion
rup
iah
Province Kab/kota
Aceh
Source: World Bank staff estimates based on data from SIKD/MoF, 2004.
The increase in Aceh’s local revenue comes largely from transfers, which increased more than 3 times in real terms from 1999 to 2006, from Rp. 2.2 trillion to 10.4 trillion, respectively (table 3.1). The role of intergovernmental transfers has been signifi cant in the regional government budget both before and after decentralization. From 1997 to 2000, transfers made up on average 91 percent of total revenue in Aceh, a fi gure that remained high after decentralization––an average of 87 percent. Aceh Province receives a relatively larger amount of nontax revenue-sharing compared to the local governments, particularly since 2002. Implementation of Special Autonomy in 2002 meant that nontax revenue-sharing funds specifi ed in the legislation are transferred into the provincial account. However, the overall revenue composition shows that local governments have more resources both before and after the decentralization was implemented.
Table 3.1. Composition of provincial and local government revenue in Aceh, 1999–2006 (Rp. billion)
1999 2002 2006 (projection)
Prov. Kab/Kota Total Prov. Kab/Kota Total Prov. Kab/Kota Total
PAD 78 107 185 160 146 306 148 133 281
Tax revenue-sharing
49 203 252 72 260 333 108 473 582
Nontax revenue-sh.
18 8 26 2,078 1,335 3,413 2,006 2,156 4,161
SDO 98 779 877
INPRES 353 732 1,085
DAU 260 3,583 3,842 461 4,560 5,021
DAK 0.34 122 12 0 593 593
Others 44 653 697 147 341 488
Total 596 1,829 2,425 2,615 6,098 8,713 2,870 8,255 11,125Source: World Bank staff calculations based on data from SIKD/MoF and BPS-SK. Data are in real terms (constant 2006 prices).
Aceh’s most important sources of revenue are the DAU and revenue-sharing. Since 2001, these sources of funding have accounted on average for 44 percent and 41 percent of the total revenue, respectively (Table 3.2). The increased revenue from other sources after decentralization is possibly due to the new tax-sharing arrangement among the central, provincial, and local governments. Own-source revenue is the smallest source of funds and accounts for only 4 percent of the total revenue. The small share of own-source revenue to total revenue indicates
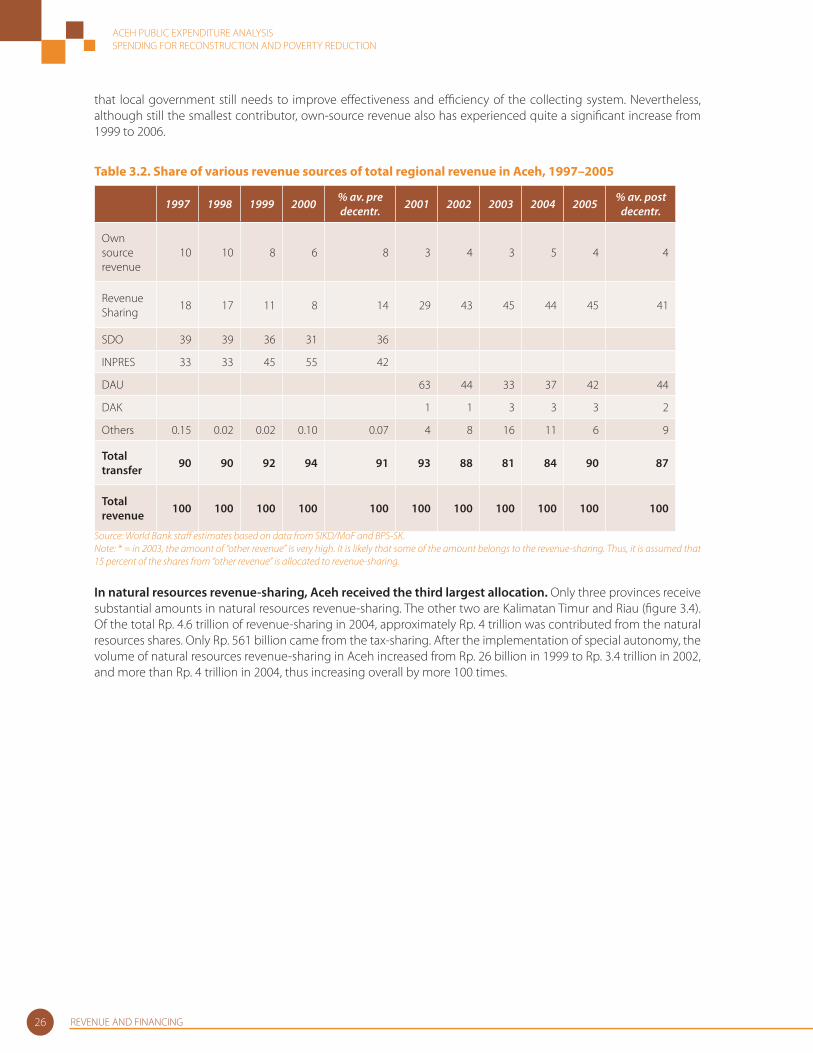
ACEH PUBLIC EXPENDITURE ANALYSISSPENDING FOR RECONSTRUCTION AND POVERTY REDUCTION
REVENUE AND FINANCING26
that local government still needs to improve eff ectiveness and effi ciency of the collecting system. Nevertheless, although still the smallest contributor, own-source revenue also has experienced quite a signifi cant increase from 1999 to 2006.
Table 3.2. Share of various revenue sources of total regional revenue in Aceh, 1997–2005
1997 1998 1999 2000 % av. pre decentr. 2001 2002 2003 2004 2005 % av. post
decentr.
Own source revenue
10 10 8 6 8 3 4 3 5 4 4
Revenue Sharing
18 17 11 8 14 29 43 45 44 45 41
SDO 39 39 36 31 36
INPRES 33 33 45 55 42
DAU 63 44 33 37 42 44
DAK 1 1 3 3 3 2
Others 0.15 0.02 0.02 0.10 0.07 4 8 16 11 6 9
Total transfer 90 90 92 94 91 93 88 81 84 90 87
Total revenue 100 100 100 100 100 100 100 100 100 100 100
Source: World Bank staff estimates based on data from SIKD/MoF and BPS-SK.Note: * = in 2003, the amount of “other revenue” is very high. It is likely that some of the amount belongs to the revenue-sharing. Thus, it is assumed that 15 percent of the shares from “other revenue” is allocated to revenue-sharing.
In natural resources revenue-sharing, Aceh received the third largest allocation. Only three provinces receive substantial amounts in natural resources revenue-sharing. The other two are Kalimatan Timur and Riau (fi gure 3.4). Of the total Rp. 4.6 trillion of revenue-sharing in 2004, approximately Rp. 4 trillion was contributed from the natural resources shares. Only Rp. 561 billion came from the tax-sharing. After the implementation of special autonomy, the volume of natural resources revenue-sharing in Aceh increased from Rp. 26 billion in 1999 to Rp. 3.4 trillion in 2002, and more than Rp. 4 trillion in 2004, thus increasing overall by more 100 times.
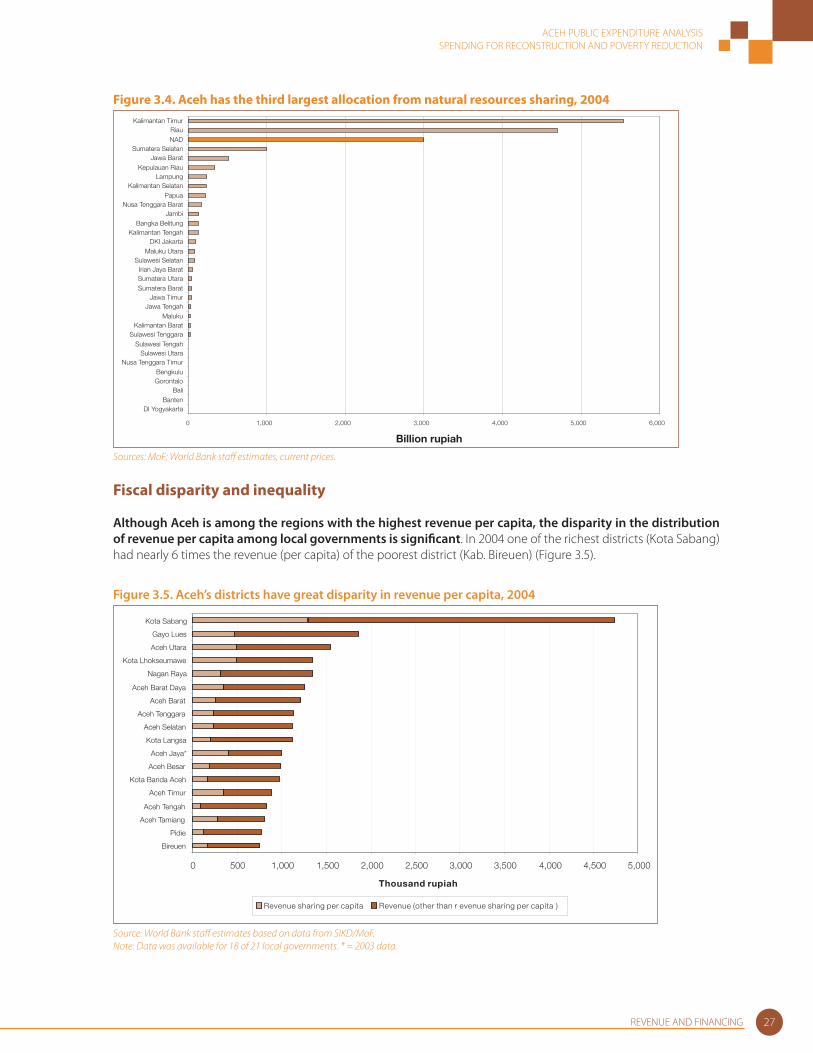
ACEH PUBLIC EXPENDITURE ANALYSISSPENDING FOR RECONSTRUCTION AND POVERTY REDUCTION
REVENUE AND FINANCING 27
Figure 3.4. Aceh has the third largest allocation from natural resources sharing, 2004
0 1,000 2,000 3,000 4,000 5,000 6,000
DI YogyakartaBanten
BaliGorontaloBengkulu
Nusa Tenggara TimurSulawesi Utara
Sulawesi TengahSulawesi Tenggara
Kalimantan BaratMaluku
Jawa TengahJawa Timur
Sumatera BaratSumatera UtaraIrian Jaya Barat
Sulawesi SelatanMaluku Utara
DKI JakartaKalimantan Tengah
Bangka BelitungJambi
Nusa Tenggara BaratPapua
Kalimantan SelatanLampung
Kepulauan RiauJawa Barat
Sumatera SelatanNADRiau
Kalimantan Timur
Billion rupiah
Sources: MoF; World Bank staff estimates, current prices.
Fiscal disparity and inequality
Although Aceh is among the regions with the highest revenue per capita, the disparity in the distribution of revenue per capita among local governments is signifi cant. In 2004 one of the richest districts (Kota Sabang) had nearly 6 times the revenue (per capita) of the poorest district (Kab. Bireuen) (Figure 3.5).
Figure 3.5. Aceh’s districts have great disparity in revenue per capita, 2004
0 500 1,000 1,500 2,000 2,500 3,000 3,500 4,000 4,500 5,000
Bireuen
Pidie
Aceh Tamiang
Aceh Tengah
Aceh Timur
Kota Banda Aceh
Aceh Besar
Aceh Jaya*
Kota Langsa
Aceh Selatan
Aceh Tenggara
Aceh Barat
Aceh Barat Daya
Nagan Raya
Kota Lhokseumawe
Aceh Utara
Gayo Lues
Kota Sabang
Thousand rupiah
Revenue sharing per capita Revenue (other than r evenue sharing per capita )
Source: World Bank staff estimates based on data from SIKD/MoF.Note: Data was available for 18 of 21 local governments. * = 2003 data.
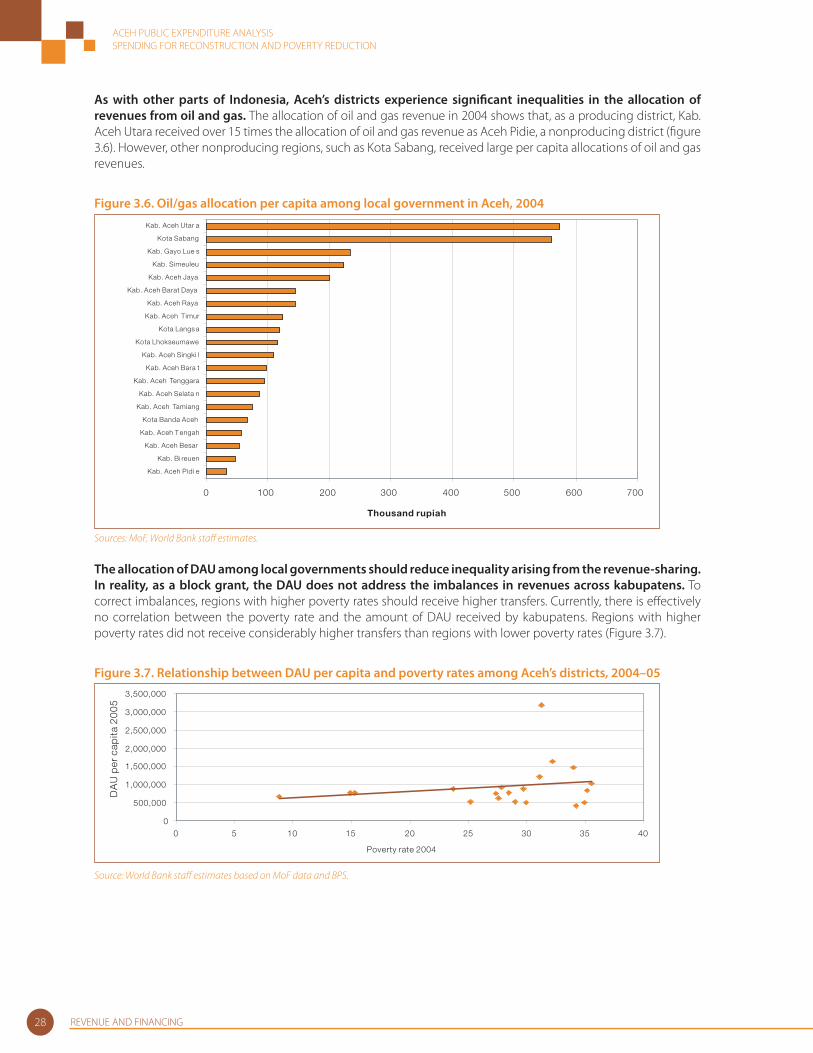
ACEH PUBLIC EXPENDITURE ANALYSISSPENDING FOR RECONSTRUCTION AND POVERTY REDUCTION
REVENUE AND FINANCING28
As with other parts of Indonesia, Aceh’s districts experience signifi cant inequalities in the allocation of revenues from oil and gas. The allocation of oil and gas revenue in 2004 shows that, as a producing district, Kab. Aceh Utara received over 15 times the allocation of oil and gas revenue as Aceh Pidie, a nonproducing district (fi gure 3.6). However, other nonproducing regions, such as Kota Sabang, received large per capita allocations of oil and gas revenues.
Figure 3.6. Oil/gas allocation per capita among local government in Aceh, 2004
0 100 200 300 400 500 600 700
Kab. Aceh Pidi e
Kab. Bi reuen
Kab. Aceh Besar
Kab. Aceh Tengah
Kota Banda Aceh
Kab. Aceh Tamiang
Kab. Aceh Selata n
Kab. Aceh Tenggara
Kab. Aceh Bara t
Kab. Aceh Singki l
Kota Lhokseumawe
Kota Langs a
Kab. Aceh Timur
Kab. Aceh Raya
Kab. Aceh Barat Daya
Kab. Aceh Jaya
Kab. Simeuleu
Kab. Gayo Lue s
Kota Sabang
Kab. Aceh Utar a
Thousand rupiah
Sources: MoF, World Bank staff estimates.
The allocation of DAU among local governments should reduce inequality arising from the revenue-sharing. In reality, as a block grant, the DAU does not address the imbalances in revenues across kabupatens. To correct imbalances, regions with higher poverty rates should receive higher transfers. Currently, there is eff ectively no correlation between the poverty rate and the amount of DAU received by kabupatens. Regions with higher poverty rates did not receive considerably higher transfers than regions with lower poverty rates (Figure 3.7).
Figure 3.7. Relationship between DAU per capita and poverty rates among Aceh’s districts, 2004–05
0
500,000
1,000,000
1,500,000
2,000,000
2,500,000
3,000,000
3,500,000
0 5 10 15 20 25 30 35 40
Poverty rate 2004
DA
U p
er c
apita
20
05
Source: World Bank staff estimates based on MoF data and BPS.
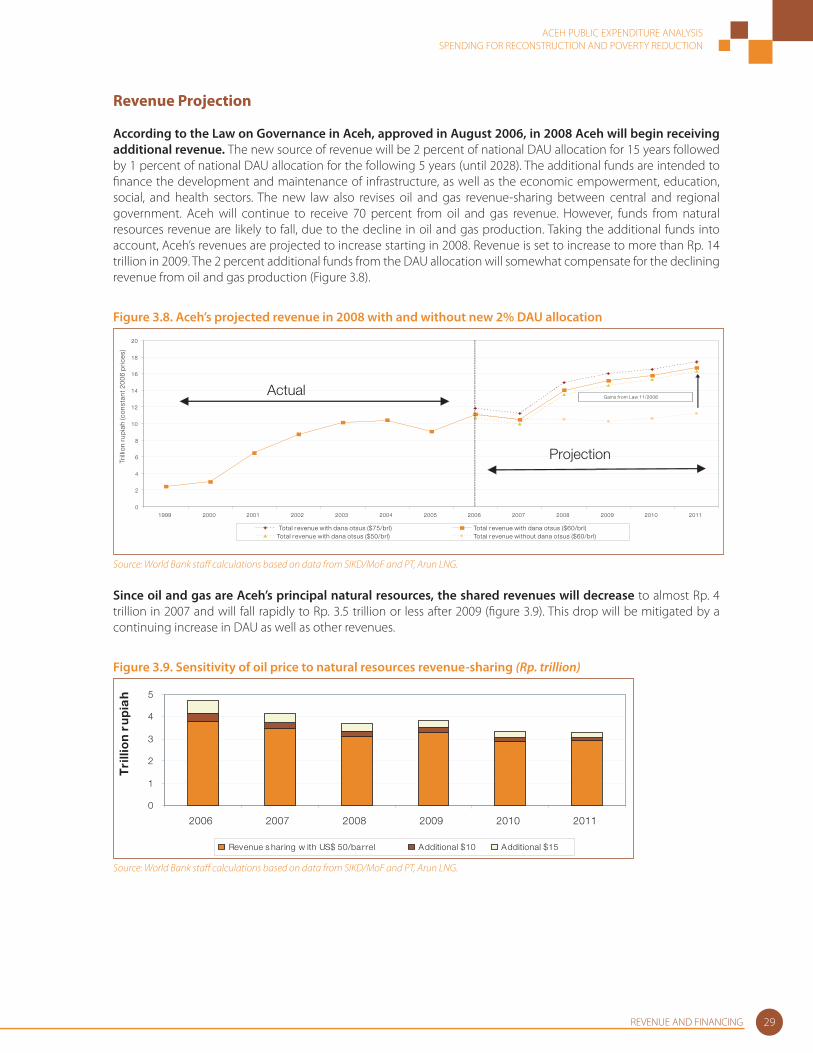
ACEH PUBLIC EXPENDITURE ANALYSISSPENDING FOR RECONSTRUCTION AND POVERTY REDUCTION
REVENUE AND FINANCING 29
Revenue Projection
According to the Law on Governance in Aceh, approved in August 2006, in 2008 Aceh will begin receiving additional revenue. The new source of revenue will be 2 percent of national DAU allocation for 15 years followed by 1 percent of national DAU allocation for the following 5 years (until 2028). The additional funds are intended to fi nance the development and maintenance of infrastructure, as well as the economic empowerment, education, social, and health sectors. The new law also revises oil and gas revenue-sharing between central and regional government. Aceh will continue to receive 70 percent from oil and gas revenue. However, funds from natural resources revenue are likely to fall, due to the decline in oil and gas production. Taking the additional funds into account, Aceh’s revenues are projected to increase starting in 2008. Revenue is set to increase to more than Rp. 14 trillion in 2009. The 2 percent additional funds from the DAU allocation will somewhat compensate for the declining revenue from oil and gas production (Figure 3.8).
Figure 3.8. Aceh’s projected revenue in 2008 with and without new 2% DAU allocation
0
2
4
6
8
10
12
14
16
18
20
1999 2000 2001 2002 2003 2004 2005 2006 2007 2008 2009 2010 2011
Trill
ion
rup
iah
(co
nsta
nt 2
00
6 p
rice
s)
Total r evenue with dana otsus ($75/brl) Total r evenue with dana otsus ($60/brl)Total r evenue with dana otsus ($50/brl) Total r evenue without dana otsus ($60/brl)
Gains fr om Law 11/2006
Projection
Actual
Source: World Bank staff calculations based on data from SIKD/MoF and PT, Arun LNG.
Since oil and gas are Aceh’s principal natural resources, the shared revenues will decrease to almost Rp. 4 trillion in 2007 and will fall rapidly to Rp. 3.5 trillion or less after 2009 (fi gure 3.9). This drop will be mitigated by a continuing increase in DAU as well as other revenues.
Figure 3.9. Sensitivity of oil price to natural resources revenue-sharing (Rp. trillion)
0
1
2
3
4
5
2006 2007 2008 2009 2010 2011
Tri
llio
n ru
pia
h
Revenue s haring w ith US$ 50/ba rrel Additional $10 Additional $15
Source: World Bank staff calculations based on data from SIKD/MoF and PT, Arun LNG.

ACEH PUBLIC EXPENDITURE ANALYSISSPENDING FOR RECONSTRUCTION AND POVERTY REDUCTION
REVENUE AND FINANCING30
Own-Source Revenue (PAD)
Similar to other regions in Indonesia, Aceh has not experienced improved local government PAD due to fi scal decentralization. Major taxes remain the purview of the central government. For example, land and property taxes (PBB), which have been largely decentralized in other countries, still are collected by the Indonesian government and then transferred to the provinces. Prior to decentralization, PAD contributed less than 6 percent of total local government revenue and 19 percent of total provincial revenue.
The provincial PAD increased after decentralization but experienced a sharp decrease in 2005. The shrinking of PAD in 2005 was the consequence of the tsunami, which aff ected many potential tax bases and hampered tax collection. The increase in PAD after decentralization was driven mainly by the expansion of the tax base by the motor vehicle tax and the addition of the surface and ground water use tax. Among provincial PAD, provincial taxes have steadily been the major contributor, equaling more than two-thirds of the total PAD. The category “other eligible PAD” (giro services and third-party contributions)–the second largest contributor—has increased substantially since decentralization (table 3.3).20
Table 3.3. Composition of provincial PAD in Aceh
Own source revenue
1999 2002 2003 2004 2005
Rp mio % Rp mio % Rp mio % Rp mio % Rp mio %
Provincial Taxes 70,216 90 125,400 78 141,322 84 212,663 70 132,673 81
Retributions 4,017 5 5,615 4 5,349 3 5,929 2 3,249 2
Profi t from Reg. Owned Enterp.
171 0 2,388 1 2,545 2 2,818 1 2,610 2
Other Own Source Revenues
3,563 5 26,585 17 19,155 11 83,807 27 24,527 15
Total 77,967 100 159,988 100 168,371 100 305,207 100 163,060 100Source: World Bank Staff calculations based on data from SIKD/MoF and World Bank Decentralization database. Note: Data are in real terms (constant 2006 prices).
The motor vehicle ownership transfer tax is the main contributor to provincial taxes. In 2004 the motor vehicle ownership transfer tax contributed 46 percent to total provincial taxes. It was followed by the motor vehicle tax (31 percent) and motor vehicle fuel tax (20 percent). The street lighting tax played the major role in local government tax in Aceh. The street lighting tax contributed over 70 percent of local taxes. It was followed by the hotel and restaurant tax, and the extracting and processing of mining resources type C tax.
Local government PAD increased after decentralization, but declined in 2004 and 2005 as the result of confl ict and the tsunami. The composition of local government PAD also changed after decentralization. Before decentralization, local taxes contributed more than 70 percent of total local government PAD. The role of local taxes in the total tax collection decreased after decentralization as “other eligible PAD” gained importance (table 3.4).
20 Third-party donations may come in the form of grants from donors, NGOs, or private individual(s) that are donated directly to local government; and contributions from the contractors in the amount of 5 percent of the project. Giro service may include tax on bank transactions and bank interest from local government deposits.
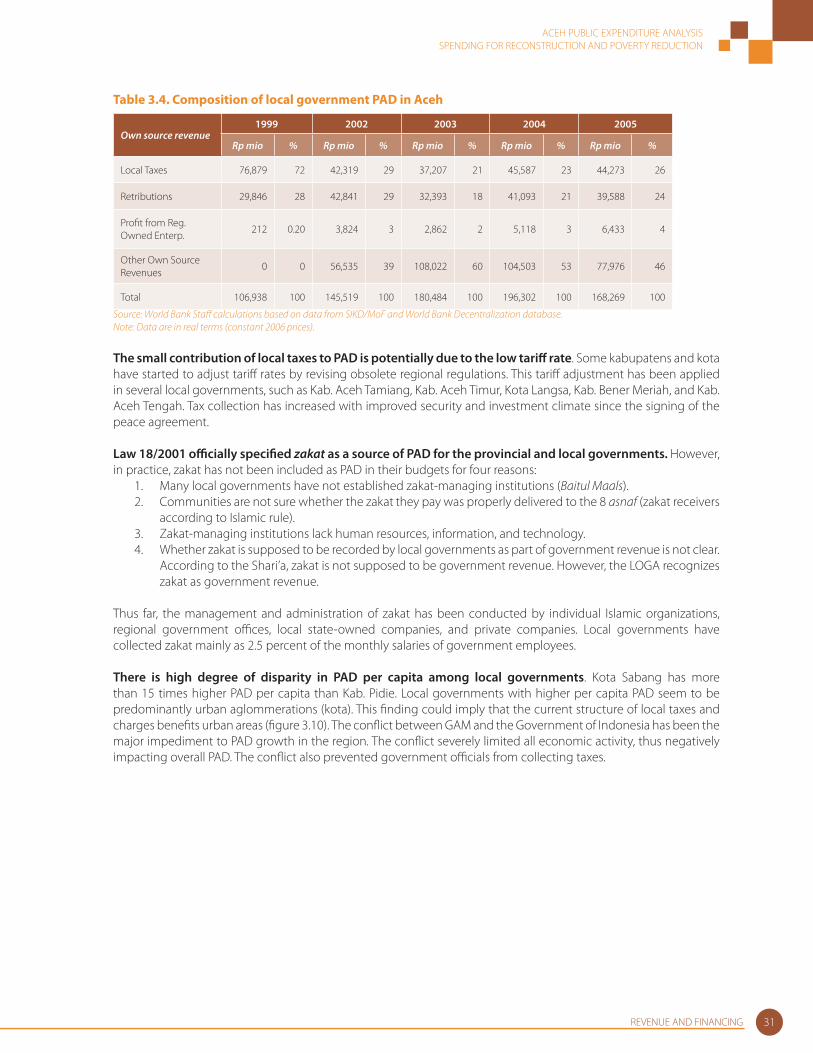
ACEH PUBLIC EXPENDITURE ANALYSISSPENDING FOR RECONSTRUCTION AND POVERTY REDUCTION
REVENUE AND FINANCING 31
Table 3.4. Composition of local government PAD in Aceh
Own source revenue1999 2002 2003 2004 2005
Rp mio % Rp mio % Rp mio % Rp mio % Rp mio %
Local Taxes 76,879 72 42,319 29 37,207 21 45,587 23 44,273 26
Retributions 29,846 28 42,841 29 32,393 18 41,093 21 39,588 24
Profi t from Reg. Owned Enterp.
212 0.20 3,824 3 2,862 2 5,118 3 6,433 4
Other Own Source Revenues
0 0 56,535 39 108,022 60 104,503 53 77,976 46
Total 106,938 100 145,519 100 180,484 100 196,302 100 168,269 100
Source: World Bank Staff calculations based on data from SIKD/MoF and World Bank Decentralization database. Note: Data are in real terms (constant 2006 prices).
The small contribution of local taxes to PAD is potentially due to the low tariff rate. Some kabupatens and kota have started to adjust tariff rates by revising obsolete regional regulations. This tariff adjustment has been applied in several local governments, such as Kab. Aceh Tamiang, Kab. Aceh Timur, Kota Langsa, Kab. Bener Meriah, and Kab. Aceh Tengah. Tax collection has increased with improved security and investment climate since the signing of the peace agreement.
Law 18/2001 offi cially specifi ed zakat as a source of PAD for the provincial and local governments. However, in practice, zakat has not been included as PAD in their budgets for four reasons:
1. Many local governments have not established zakat-managing institutions (Baitul Maals).2. Communities are not sure whether the zakat they pay was properly delivered to the 8 asnaf (zakat receivers
according to Islamic rule). 3. Zakat-managing institutions lack human resources, information, and technology.4. Whether zakat is supposed to be recorded by local governments as part of government revenue is not clear.
According to the Shari’a, zakat is not supposed to be government revenue. However, the LOGA recognizes zakat as government revenue.
Thus far, the management and administration of zakat has been conducted by individual Islamic organizations, regional government offi ces, local state-owned companies, and private companies. Local governments have collected zakat mainly as 2.5 percent of the monthly salaries of government employees.
There is high degree of disparity in PAD per capita among local governments. Kota Sabang has more than 15 times higher PAD per capita than Kab. Pidie. Local governments with higher per capita PAD seem to be predominantly urban aglommerations (kota). This fi nding could imply that the current structure of local taxes and charges benefi ts urban areas (fi gure 3.10). The confl ict between GAM and the Government of Indonesia has been the major impediment to PAD growth in the region. The confl ict severely limited all economic activity, thus negatively impacting overall PAD. The confl ict also prevented government offi cials from collecting taxes.
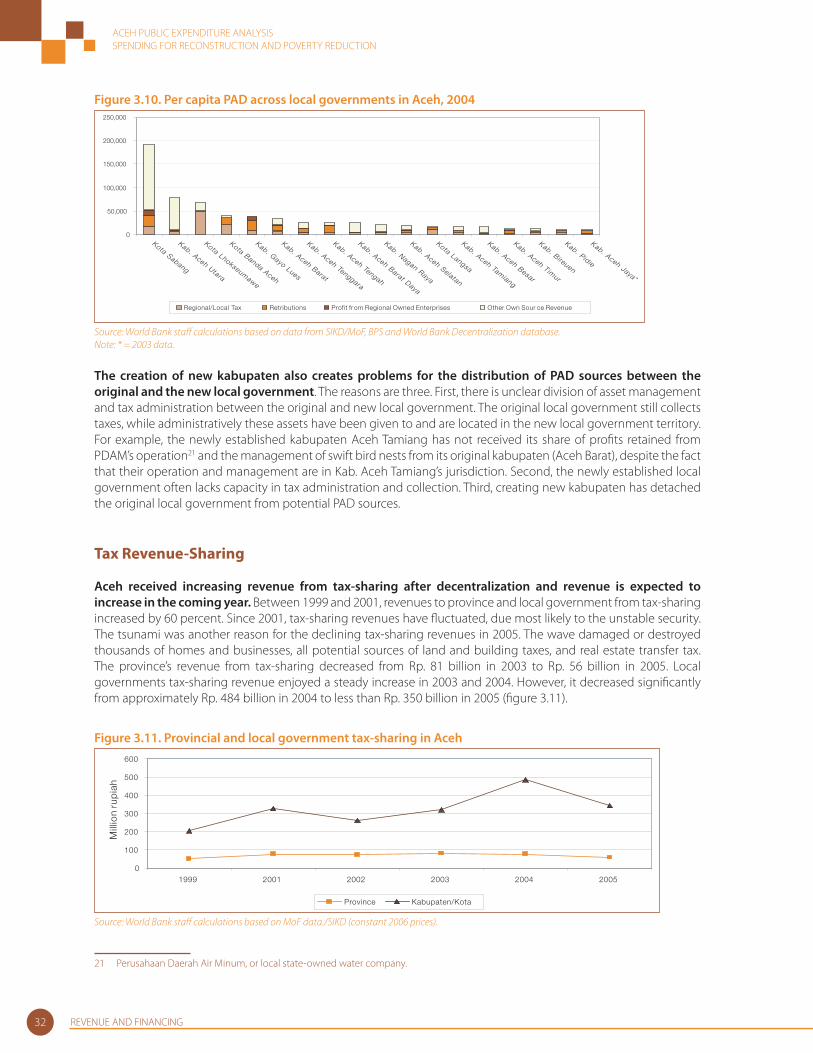
ACEH PUBLIC EXPENDITURE ANALYSISSPENDING FOR RECONSTRUCTION AND POVERTY REDUCTION
REVENUE AND FINANCING32
Figure 3.10. Per capita PAD across local governments in Aceh, 2004
0
50,000
100,000
150,000
200,000
250,000
Kota Sabang
Kab. Aceh
Utara
Kota Lhokseumawe
Kota Banda
Aceh
Kab. Gayo
Lues
Kab. Aceh Barat
Kab. Aceh Tenggara
Kab. Aceh Tengah
Kab. Aceh Barat Daya
Kab. Nagan Raya
Kab. Aceh Selatan
Kota Langsa
Kab. Aceh Tamiang
Kab. Aceh Besar
Kab. Aceh Timur
Kab. Bireuen
Kab. Pidie
Kab. Aceh
Jaya*
Regional/Local Tax Retributions Profit fr om Regional Owned Enterprises Other Own Sour ce Revenue
Source: World Bank staff calculations based on data from SIKD/MoF, BPS and World Bank Decentralization database. Note: * = 2003 data.
The creation of new kabupaten also creates problems for the distribution of PAD sources between the original and the new local government. The reasons are three. First, there is unclear division of asset management and tax administration between the original and new local government. The original local government still collects taxes, while administratively these assets have been given to and are located in the new local government territory. For example, the newly established kabupaten Aceh Tamiang has not received its share of profi ts retained from PDAM’s operation21 and the management of swift bird nests from its original kabupaten (Aceh Barat), despite the fact that their operation and management are in Kab. Aceh Tamiang’s jurisdiction. Second, the newly established local government often lacks capacity in tax administration and collection. Third, creating new kabupaten has detached the original local government from potential PAD sources.
Tax Revenue-Sharing
Aceh received increasing revenue from tax-sharing after decentralization and revenue is expected to increase in the coming year. Between 1999 and 2001, revenues to province and local government from tax-sharing increased by 60 percent. Since 2001, tax-sharing revenues have fl uctuated, due most likely to the unstable security. The tsunami was another reason for the declining tax-sharing revenues in 2005. The wave damaged or destroyed thousands of homes and businesses, all potential sources of land and building taxes, and real estate transfer tax. The province’s revenue from tax-sharing decreased from Rp. 81 billion in 2003 to Rp. 56 billion in 2005. Local governments tax-sharing revenue enjoyed a steady increase in 2003 and 2004. However, it decreased signifi cantly from approximately Rp. 484 billion in 2004 to less than Rp. 350 billion in 2005 (fi gure 3.11).
Figure 3.11. Provincial and local government tax-sharing in Aceh
0
100
200
300
400
500
600
1999 2001 2002 2003 2004 2005
Mill
ion
rup
iah
Province Kabupaten/Kota
Source: World Bank staff calculations based on MoF data./SIKD (constant 2006 prices).
21 Perusahaan Daerah Air Minum, or local state-owned water company.
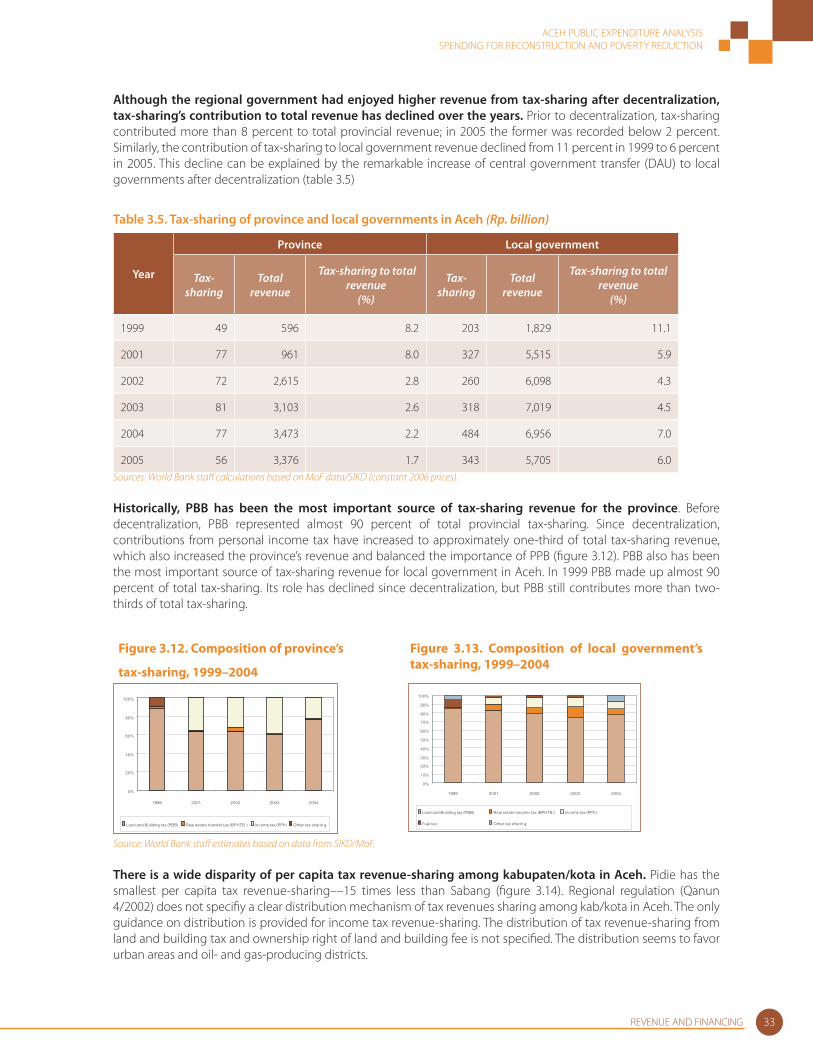
ACEH PUBLIC EXPENDITURE ANALYSISSPENDING FOR RECONSTRUCTION AND POVERTY REDUCTION
REVENUE AND FINANCING 33
Although the regional government had enjoyed higher revenue from tax-sharing after decentralization, tax-sharing’s contribution to total revenue has declined over the years. Prior to decentralization, tax-sharing contributed more than 8 percent to total provincial revenue; in 2005 the former was recorded below 2 percent. Similarly, the contribution of tax-sharing to local government revenue declined from 11 percent in 1999 to 6 percent in 2005. This decline can be explained by the remarkable increase of central government transfer (DAU) to local governments after decentralization (table 3.5)
Table 3.5. Tax-sharing of province and local governments in Aceh (Rp. billion)
Year
Province Local government
Tax-sharing
Total revenue
Tax-sharing to total revenue
(%)
Tax-sharing
Total revenue
Tax-sharing to total revenue
(%)
1999 49 596 8.2 203 1,829 11.1
2001 77 961 8.0 327 5,515 5.9
2002 72 2,615 2.8 260 6,098 4.3
2003 81 3,103 2.6 318 7,019 4.5
2004 77 3,473 2.2 484 6,956 7.0
2005 56 3,376 1.7 343 5,705 6.0Sources: World Bank staff calculations based on MoF data/SIKD (constant 2006 prices).
Historically, PBB has been the most important source of tax-sharing revenue for the province. Before decentralization, PBB represented almost 90 percent of total provincial tax-sharing. Since decentralization, contributions from personal income tax have increased to approximately one-third of total tax-sharing revenue, which also increased the province’s revenue and balanced the importance of PPB (fi gure 3.12). PBB also has been the most important source of tax-sharing revenue for local government in Aceh. In 1999 PBB made up almost 90 percent of total tax-sharing. Its role has declined since decentralization, but PBB still contributes more than two-thirds of total tax-sharing.
Figure 3.12. Composition of province’s
tax-sharing, 1999–2004
Figure 3.13. Composition of local government’s tax-sharing, 1999–2004
0%
20%
40%
60%
80%
100%
1999 2001 2002 2003 2004
Land and Building tax (PBB) Real estate transfer tax (BPHTB ) Income tax (PPh ) Other tax sharin g
0%
10%
20%
30%
40%
50%
60%
70%
80%
90%
100%
1999 2001 2002 2003 2004
Land and Building tax (PBB) Real estate transfer tax (BPHTB ) Income tax (PPh )
Fuel ta x Other tax sharin g
Source: World Bank staff estimates based on data from SIKD/MoF.
There is a wide disparity of per capita tax revenue-sharing among kabupaten/kota in Aceh. Pidie has the smallest per capita tax revenue-sharing––15 times less than Sabang (fi gure 3.14). Regional regulation (Qanun 4/2002) does not specifi y a clear distribution mechanism of tax revenues sharing among kab/kota in Aceh. The only guidance on distribution is provided for income tax revenue-sharing. The distribution of tax revenue-sharing from land and building tax and ownership right of land and building fee is not specifi ed. The distribution seems to favor urban areas and oil- and gas-producing districts.
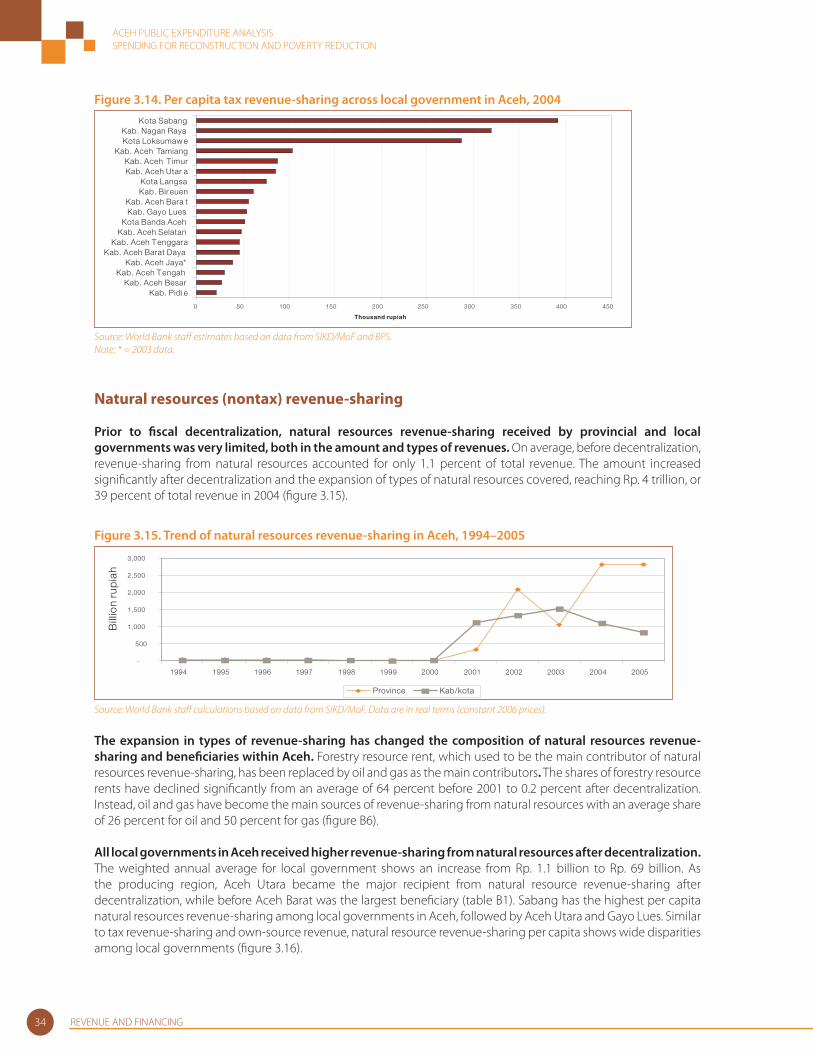
ACEH PUBLIC EXPENDITURE ANALYSISSPENDING FOR RECONSTRUCTION AND POVERTY REDUCTION
REVENUE AND FINANCING34
Figure 3.14. Per capita tax revenue-sharing across local government in Aceh, 2004
0 50 100 150 200 250 300 350 400 450
Kab. Pidi eKab. Aceh Besar
Kab. Aceh Tengah Kab. Aceh Jaya*
Kab. Aceh Barat DayaKab. Aceh Tenggara
Kab. Aceh SelatanKota Banda Aceh
Kab. Gayo LuesKab. Aceh Bara t
Kab. Bir euenKota Langsa
Kab. Aceh Utar aKab. Aceh Timur
Kab. Aceh TamiangKota Loksumaw eKab. Nagan Raya
Kota Sabang
Thousand rupiah
Source: World Bank staff estimates based on data from SIKD/MoF and BPS.Note: * = 2003 data.
Natural resources (nontax) revenue-sharing
Prior to fi scal decentralization, natural resources revenue-sharing received by provincial and local governments was very limited, both in the amount and types of revenues. On average, before decentralization, revenue-sharing from natural resources accounted for only 1.1 percent of total revenue. The amount increased signifi cantly after decentralization and the expansion of types of natural resources covered, reaching Rp. 4 trillion, or 39 percent of total revenue in 2004 (fi gure 3.15).
Figure 3.15. Trend of natural resources revenue-sharing in Aceh, 1994–2005
-
500
1,000
1,500
2,000
2,500
3,000
1994 1995 1996 1997 1998 1999 2000 2001 2002 2003 2004 2005
Bill
ion
rup
iah
Province Kab/kota
Source: World Bank staff calculations based on data from SIKD/MoF. Data are in real terms (constant 2006 prices).
The expansion in types of revenue-sharing has changed the composition of natural resources revenue-sharing and benefi ciaries within Aceh. Forestry resource rent, which used to be the main contributor of natural resources revenue-sharing, has been replaced by oil and gas as the main contributors. The shares of forestry resource rents have declined signifi cantly from an average of 64 percent before 2001 to 0.2 percent after decentralization. Instead, oil and gas have become the main sources of revenue-sharing from natural resources with an average share of 26 percent for oil and 50 percent for gas (fi gure B6).
All local governments in Aceh received higher revenue-sharing from natural resources after decentralization. The weighted annual average for local government shows an increase from Rp. 1.1 billion to Rp. 69 billion. As the producing region, Aceh Utara became the major recipient from natural resource revenue-sharing after decentralization, while before Aceh Barat was the largest benefi ciary (table B1). Sabang has the highest per capita natural resources revenue-sharing among local governments in Aceh, followed by Aceh Utara and Gayo Lues. Similar to tax revenue-sharing and own-source revenue, natural resource revenue-sharing per capita shows wide disparities among local governments (fi gure 3.16).
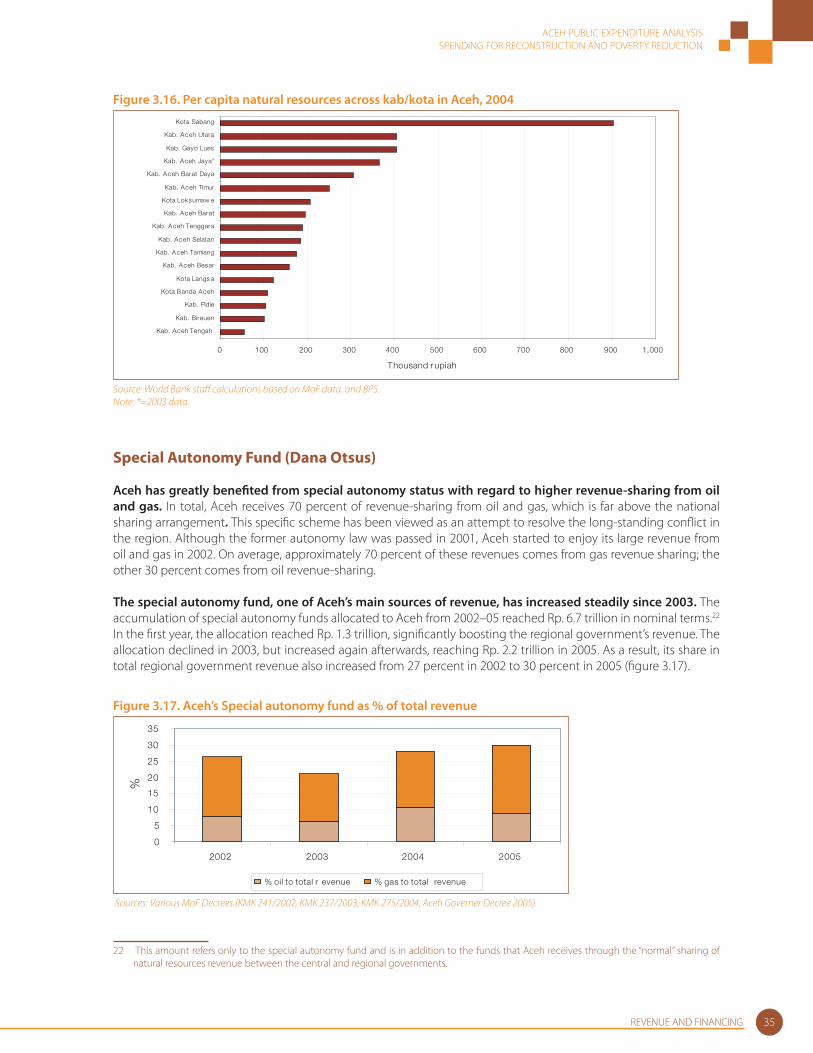
ACEH PUBLIC EXPENDITURE ANALYSISSPENDING FOR RECONSTRUCTION AND POVERTY REDUCTION
REVENUE AND FINANCING 35
Figure 3.16. Per capita natural resources across kab/kota in Aceh, 2004
0 100 200 300 400 500 600 700 800 900 1,000
Kab. Aceh Tengah
Kab. Bireuen
Kab. Pidie
Kota Banda Aceh
Kota Langs a
Kab. Aceh Besar
Kab. Aceh Tamiang
Kab. Aceh Selatan
Kab. Aceh Tenggara
Kab. Aceh Barat
Kota Loksumaw e
Kab. Aceh Timur
Kab. Aceh Barat Daya
Kab. Aceh Jaya*
Kab. Gayo Lues
Kab. Aceh Utara
Kota Sabang
Thousand r upiah
Source: World Bank staff calculations based on MoF data. and BPS.Note: *=2003 data.
Special Autonomy Fund (Dana Otsus)
Aceh has greatly benefi ted from special autonomy status with regard to higher revenue-sharing from oil and gas. In total, Aceh receives 70 percent of revenue-sharing from oil and gas, which is far above the national sharing arrangement. This specifi c scheme has been viewed as an attempt to resolve the long-standing confl ict in the region. Although the former autonomy law was passed in 2001, Aceh started to enjoy its large revenue from oil and gas in 2002. On average, approximately 70 percent of these revenues comes from gas revenue sharing; the other 30 percent comes from oil revenue-sharing.
The special autonomy fund, one of Aceh’s main sources of revenue, has increased steadily since 2003. The accumulation of special autonomy funds allocated to Aceh from 2002–05 reached Rp. 6.7 trillion in nominal terms.22 In the fi rst year, the allocation reached Rp. 1.3 trillion, signifi cantly boosting the regional government’s revenue. The allocation declined in 2003, but increased again afterwards, reaching Rp. 2.2 trillion in 2005. As a result, its share in total regional government revenue also increased from 27 percent in 2002 to 30 percent in 2005 (fi gure 3.17).
Figure 3.17. Aceh’s Special autonomy fund as % of total revenue
0
5
10
15
20
25
30
35
2002 2003 2004 2005
%
% oil to total r evenue % gas to total revenue
Sources: Various MoF Decrees (KMK 241/2002, KMK 237/2003, KMK 275/2004, Aceh Governer Decree 2005).
22 This amount refers only to the special autonomy fund and is in addition to the funds that Aceh receives through the “normal” sharing of natural resources revenue between the central and regional governments.
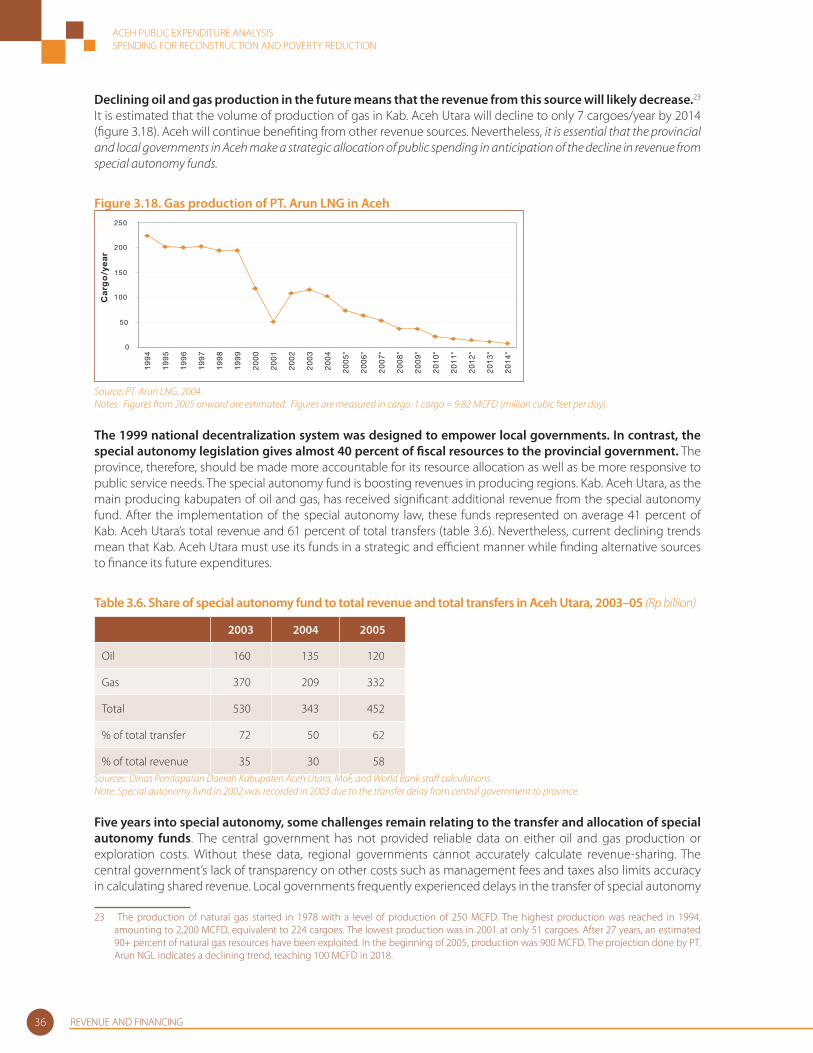
ACEH PUBLIC EXPENDITURE ANALYSISSPENDING FOR RECONSTRUCTION AND POVERTY REDUCTION
REVENUE AND FINANCING36
Declining oil and gas production in the future means that the revenue from this source will likely decrease.23 It is estimated that the volume of production of gas in Kab. Aceh Utara will decline to only 7 cargoes/year by 2014 (fi gure 3.18). Aceh will continue benefi ting from other revenue sources. Nevertheless, it is essential that the provincial and local governments in Aceh make a strategic allocation of public spending in anticipation of the decline in revenue from special autonomy funds.
Figure 3.18. Gas production of PT. Arun LNG in Aceh
0
50
100
150
200
250
19
94
19
95
19
96
19
97
19
98
19
99
20
00
20
01
20
02
20
03
20
04
20
05
*
20
06
*
20
07
*
20
08
*
20
09
*
20
10
*
20
11
*
20
12
*
20
13
*
20
14
*
Ca
rgo
/ye
ar
Source: PT. Arun LNG, 2004.Notes: Figures from 2005 onward are estimated. Figures are measured in cargo. 1 cargo = 9.82 MCFD (million cubic feet per day).
The 1999 national decentralization system was designed to empower local governments. In contrast, the special autonomy legislation gives almost 40 percent of fi scal resources to the provincial government. The province, therefore, should be made more accountable for its resource allocation as well as be more responsive to public service needs. The special autonomy fund is boosting revenues in producing regions. Kab. Aceh Utara, as the main producing kabupaten of oil and gas, has received signifi cant additional revenue from the special autonomy fund. After the implementation of the special autonomy law, these funds represented on average 41 percent of Kab. Aceh Utara’s total revenue and 61 percent of total transfers (table 3.6). Nevertheless, current declining trends mean that Kab. Aceh Utara must use its funds in a strategic and effi cient manner while fi nding alternative sources to fi nance its future expenditures.
Table 3.6. Share of special autonomy fund to total revenue and total transfers in Aceh Utara, 2003–05 (Rp billion)
2003 2004 2005
Oil 160 135 120
Gas 370 209 332
Total 530 343 452
% of total transfer 72 50 62
% of total revenue 35 30 58Sources: Dinas Pendapatan Daerah Kabupaten Aceh Utara, MoF, and World Bank staff calculations.Note: Special autonomy fund in 2002 was recorded in 2003 due to the transfer delay from central government to province.
Five years into special autonomy, some challenges remain relating to the transfer and allocation of special autonomy funds. The central government has not provided reliable data on either oil and gas production or exploration costs. Without these data, regional governments cannot accurately calculate revenue-sharing. The central government’s lack of transparency on other costs such as management fees and taxes also limits accuracy in calculating shared revenue. Local governments frequently experienced delays in the transfer of special autonomy
23 The production of natural gas started in 1978 with a level of production of 250 MCFD. The highest production was reached in 1994, amounting to 2,200 MCFD, equivalent to 224 cargoes. The lowest production was in 2001 at only 51 cargoes. After 27 years, an estimated 90+ percent of natural gas resources have been exploited. In the beginning of 2005, production was 900 MCFD. The projection done by PT. Arun NGL indicates a declining trend, reaching 100 MCFD in 2018.
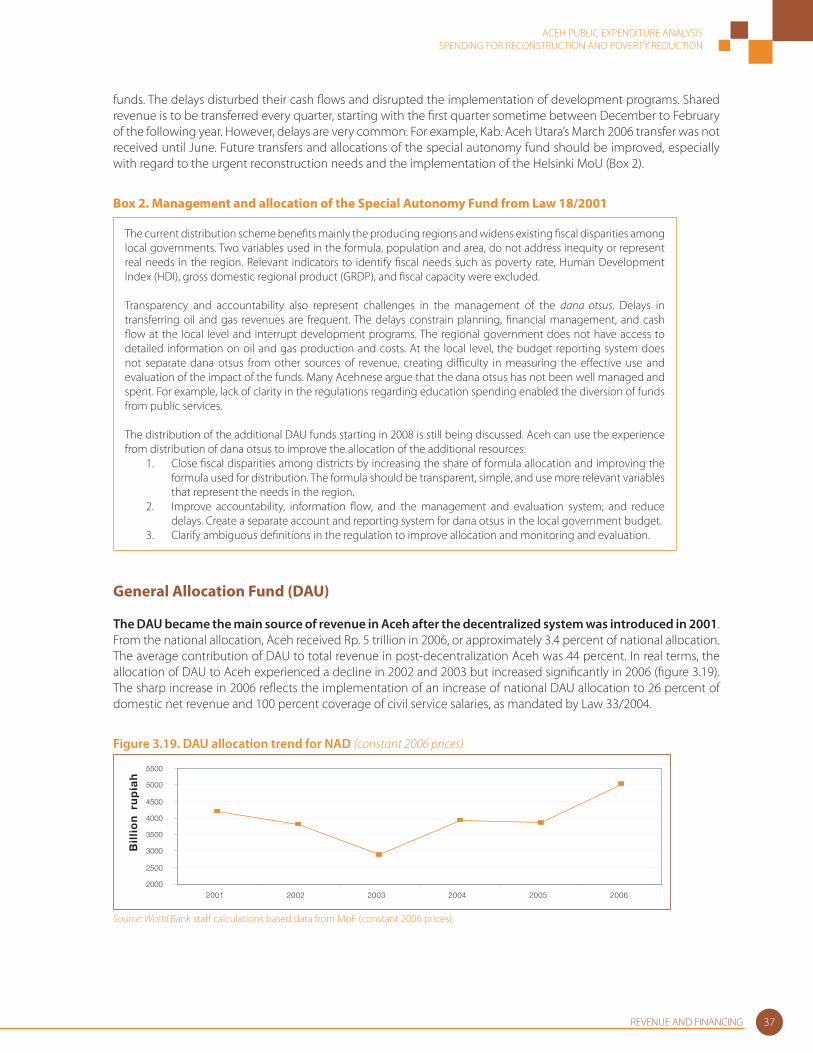
ACEH PUBLIC EXPENDITURE ANALYSISSPENDING FOR RECONSTRUCTION AND POVERTY REDUCTION
REVENUE AND FINANCING 37
funds. The delays disturbed their cash fl ows and disrupted the implementation of development programs. Shared revenue is to be transferred every quarter, starting with the fi rst quarter sometime between December to February of the following year. However, delays are very common. For example, Kab. Aceh Utara’s March 2006 transfer was not received until June. Future transfers and allocations of the special autonomy fund should be improved, especially with regard to the urgent reconstruction needs and the implementation of the Helsinki MoU (Box 2).
Box 2. Management and allocation of the Special Autonomy Fund from Law 18/2001
The current distribution scheme benefi ts mainly the producing regions and widens existing fi scal disparities among local governments. Two variables used in the formula, population and area, do not address inequity or represent real needs in the region. Relevant indicators to identify fi scal needs such as poverty rate, Human Development Index (HDI), gross domestic regional product (GRDP), and fi scal capacity were excluded.
Transparency and accountability also represent challenges in the management of the dana otsus. Delays in transferring oil and gas revenues are frequent. The delays constrain planning, fi nancial management, and cash fl ow at the local level and interrupt development programs. The regional government does not have access to detailed information on oil and gas production and costs. At the local level, the budget reporting system does not separate dana otsus from other sources of revenue, creating diffi culty in measuring the eff ective use and evaluation of the impact of the funds. Many Acehnese argue that the dana otsus has not been well managed and spent. For example, lack of clarity in the regulations regarding education spending enabled the diversion of funds from public services.
The distribution of the additional DAU funds starting in 2008 is still being discussed. Aceh can use the experience from distribution of dana otsus to improve the allocation of the additional resources:
1. Close fi scal disparities among districts by increasing the share of formula allocation and improving the formula used for distribution. The formula should be transparent, simple, and use more relevant variables that represent the needs in the region.
2. Improve accountability, information fl ow, and the management and evaluation system; and reduce delays. Create a separate account and reporting system for dana otsus in the local government budget.
3. Clarify ambiguous defi nitions in the regulation to improve allocation and monitoring and evaluation.
General Allocation Fund (DAU)
The DAU became the main source of revenue in Aceh after the decentralized system was introduced in 2001. From the national allocation, Aceh received Rp. 5 trillion in 2006, or approximately 3.4 percent of national allocation. The average contribution of DAU to total revenue in post-decentralization Aceh was 44 percent. In real terms, the allocation of DAU to Aceh experienced a decline in 2002 and 2003 but increased signifi cantly in 2006 (fi gure 3.19). The sharp increase in 2006 refl ects the implementation of an increase of national DAU allocation to 26 percent of domestic net revenue and 100 percent coverage of civil service salaries, as mandated by Law 33/2004.
Figure 3.19. DAU allocation trend for NAD (constant 2006 prices)
2000
2500
3000
3500
4000
4500
5000
5500
2001 2002 2003 2004 2005 2006
Bil
lio
n r
up
iah
Source: World Bank staff calculations based data from MoF (constant 2006 prices).
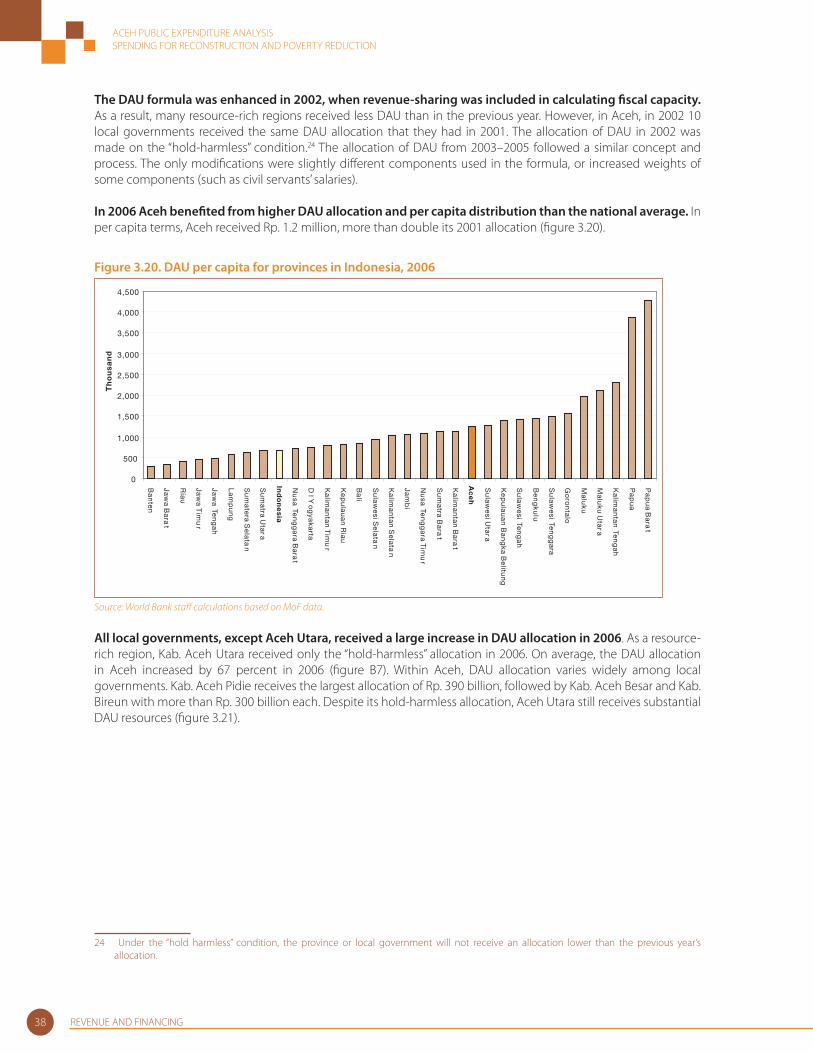
ACEH PUBLIC EXPENDITURE ANALYSISSPENDING FOR RECONSTRUCTION AND POVERTY REDUCTION
REVENUE AND FINANCING38
The DAU formula was enhanced in 2002, when revenue-sharing was included in calculating fi scal capacity. As a result, many resource-rich regions received less DAU than in the previous year. However, in Aceh, in 2002 10 local governments received the same DAU allocation that they had in 2001. The allocation of DAU in 2002 was made on the “hold-harmless” condition.24 The allocation of DAU from 2003–2005 followed a similar concept and process. The only modifi cations were slightly diff erent components used in the formula, or increased weights of some components (such as civil servants’ salaries).
In 2006 Aceh benefi ted from higher DAU allocation and per capita distribution than the national average. In per capita terms, Aceh received Rp. 1.2 million, more than double its 2001 allocation (fi gure 3.20).
Figure 3.20. DAU per capita for provinces in Indonesia, 2006
0
500
1,000
1,500
2,000
2,500
3,000
3,500
4,000
4,500
Ba
nte
n
Jaw
a Ba
rat
Ria
u
Jaw
a Tim
ur
Jaw
a Ten
ga
h
La
mp
un
g
Su
ma
tera S
ela
tan
Su
ma
tra Uta
ra
Ind
on
esia
Nu
sa Ten
gg
ara B
ara
t
D I Y
og
yaka
rta
Ka
lima
nta
n Tim
ur
Ke
pu
lau
an R
iau
Ba
li
Su
law
esi S
ela
tan
Ka
lima
nta
n Se
lata
n
Jam
bi
Nu
sa Ten
gg
ara T
imu
r
Su
ma
tra Ba
rat
Ka
lima
nta
n Ba
rat
Ac
eh
Su
law
esi U
tara
Ke
pu
lau
an B
an
gka B
elitu
ng
Su
law
esi Te
ng
ah
Be
ng
kulu
Su
law
esi Te
ng
ga
ra
Go
ron
talo
Ma
luku
Ma
luku U
tara
Ka
lima
nta
n Ten
ga
h
Pa
pu
a
Pa
pu
a Ba
rat
Th
ou
san
d
Source: World Bank staff calculations based on MoF data.
All local governments, except Aceh Utara, received a large increase in DAU allocation in 2006. As a resource-rich region, Kab. Aceh Utara received only the “hold-harmless” allocation in 2006. On average, the DAU allocation in Aceh increased by 67 percent in 2006 (fi gure B7). Within Aceh, DAU allocation varies widely among local governments. Kab. Aceh Pidie receives the largest allocation of Rp. 390 billion, followed by Kab. Aceh Besar and Kab. Bireun with more than Rp. 300 billion each. Despite its hold-harmless allocation, Aceh Utara still receives substantial DAU resources (fi gure 3.21).
24 Under the “hold harmless” condition, the province or local government will not receive an allocation lower than the previous year’s allocation.
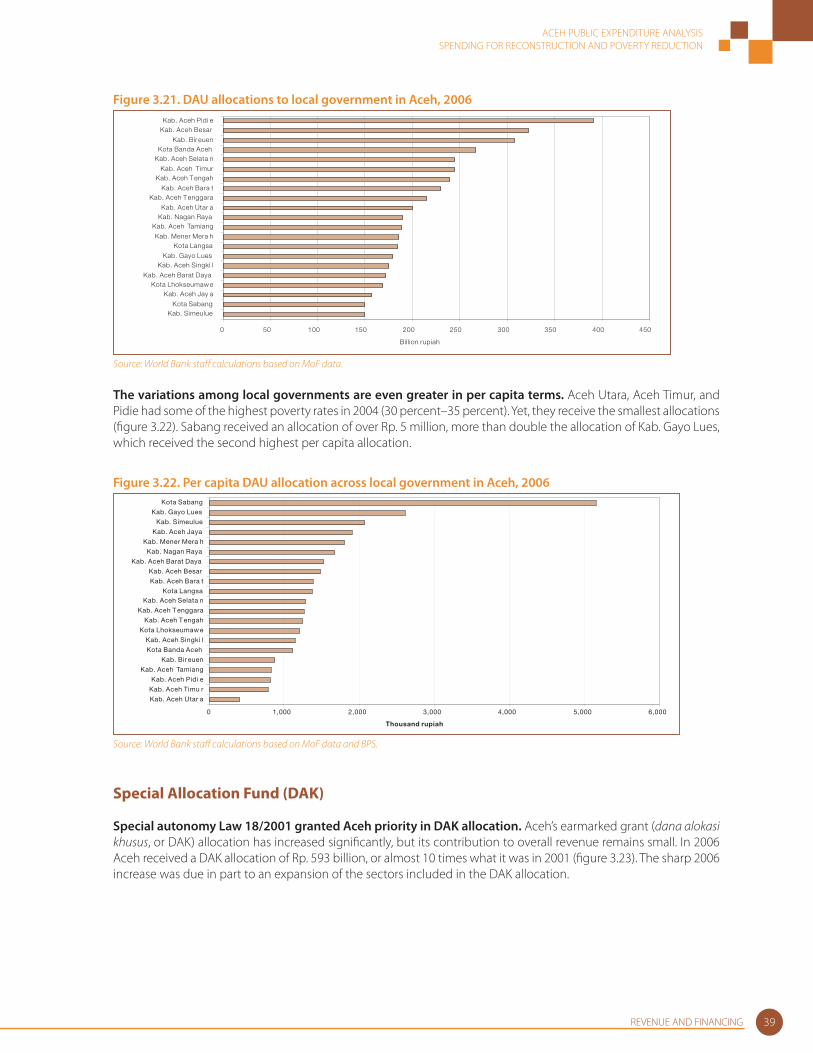
ACEH PUBLIC EXPENDITURE ANALYSISSPENDING FOR RECONSTRUCTION AND POVERTY REDUCTION
REVENUE AND FINANCING 39
Figure 3.21. DAU allocations to local government in Aceh, 2006
0 50 100 150 200 250 300 350 400 450
Kab. SimeulueKota Sabang
Kab. Aceh Jay aKota Lhokseumaw e
Kab. Aceh Barat Daya
Kab. Aceh Singki lKab. Gayo Lues
Kota LangsaKab. Mener Mera h
Kab. Aceh TamiangKab. Nagan RayaKab. Aceh Utar a
Kab. Aceh TenggaraKab. Aceh Bara t
Kab. Aceh TengahKab. Aceh Timur
Kab. Aceh Selata nKota Banda Aceh
Kab. Bir euen
Kab. Aceh BesarKab. Aceh Pidi e
Billion rupiah
Source: World Bank staff calculations based on MoF data.
The variations among local governments are even greater in per capita terms. Aceh Utara, Aceh Timur, and Pidie had some of the highest poverty rates in 2004 (30 percent–35 percent). Yet, they receive the smallest allocations (fi gure 3.22). Sabang received an allocation of over Rp. 5 million, more than double the allocation of Kab. Gayo Lues, which received the second highest per capita allocation.
Figure 3.22. Per capita DAU allocation across local government in Aceh, 2006
0 1,000 2,000 3,000 4,000 5,000 6,000
Kab. Aceh Utar a
Kab. Aceh Timu r
Kab. Aceh Pidi e
Kab. Aceh Tamiang
Kab. Bireuen
Kota Banda Aceh
Kab. Aceh Singki l
Kota Lhokseumaw e
Kab. Aceh Tengah
Kab. Aceh Tenggara
Kab. Aceh Selata nKota Langsa
Kab. Aceh Bara t
Kab. Aceh Besar
Kab. Aceh Barat Daya
Kab. Nagan Raya
Kab. Mener Mera h
Kab. Aceh Jaya
Kab. Simeulue
Kab. Gayo Lues
Kota Sabang
Thousand rupiah
Source: World Bank staff calculations based on MoF data and BPS.
Special Allocation Fund (DAK)
Special autonomy Law 18/2001 granted Aceh priority in DAK allocation. Aceh’s earmarked grant (dana alokasi khusus, or DAK) allocation has increased signifi cantly, but its contribution to overall revenue remains small. In 2006 Aceh received a DAK allocation of Rp. 593 billion, or almost 10 times what it was in 2001 (fi gure 3.23). The sharp 2006 increase was due in part to an expansion of the sectors included in the DAK allocation.
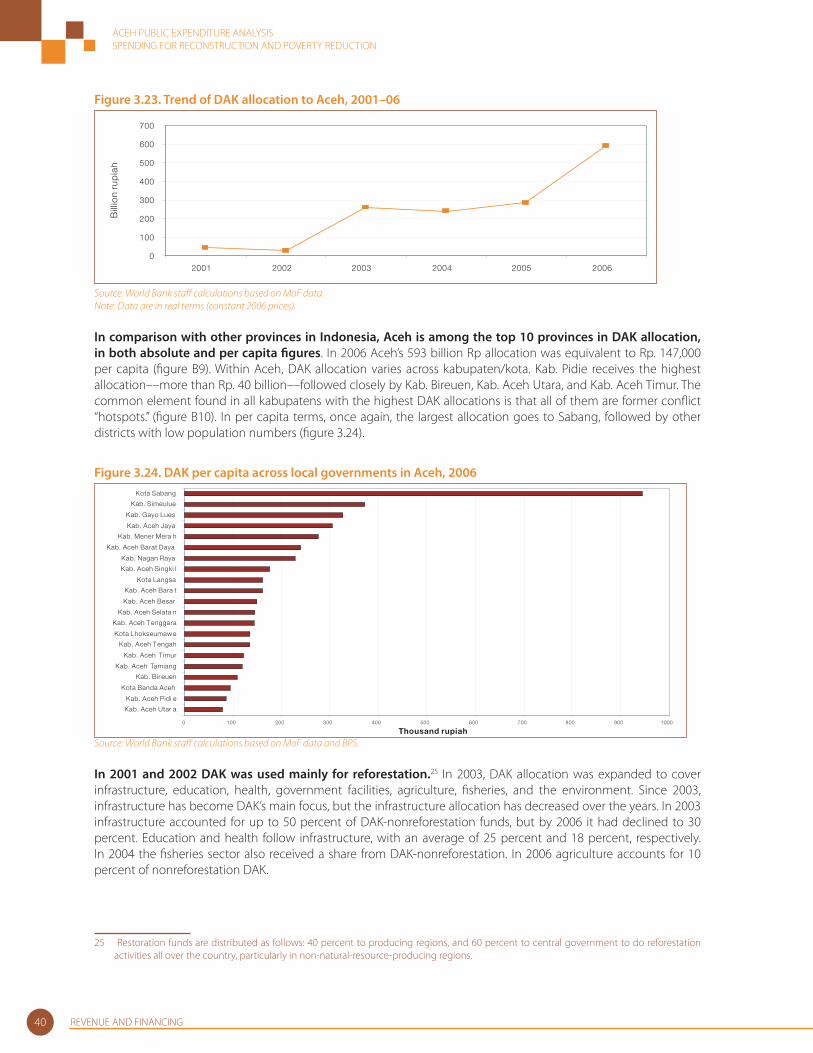
ACEH PUBLIC EXPENDITURE ANALYSISSPENDING FOR RECONSTRUCTION AND POVERTY REDUCTION
REVENUE AND FINANCING40
Figure 3.23. Trend of DAK allocation to Aceh, 2001–06
0
100
200
300
400
500
600
700
2001 2002 2003 2004 2005 2006
Bill
ion
rup
iah
Source: World Bank staff calculations based on MoF data. Note: Data are in real terms (constant 2006 prices).
In comparison with other provinces in Indonesia, Aceh is among the top 10 provinces in DAK allocation, in both absolute and per capita fi gures. In 2006 Aceh’s 593 billion Rp allocation was equivalent to Rp. 147,000 per capita (fi gure B9). Within Aceh, DAK allocation varies across kabupaten/kota. Kab. Pidie receives the highest allocation––more than Rp. 40 billion––followed closely by Kab. Bireuen, Kab. Aceh Utara, and Kab. Aceh Timur. The common element found in all kabupatens with the highest DAK allocations is that all of them are former confl ict “hotspots.” (fi gure B10). In per capita terms, once again, the largest allocation goes to Sabang, followed by other districts with low population numbers (fi gure 3.24).
Figure 3.24. DAK per capita across local governments in Aceh, 2006
0 100 200 300 400 500 600 700 800 900 1000
Kab. Aceh Utar a
Kab. Aceh Pidi e
Kota Banda Aceh
Kab. Bir euen
Kab. Aceh Tamiang
Kab. Aceh Timur
Kab. Aceh Tengah
Kota Lhokseumaw e
Kab. Aceh Tenggara
Kab. Aceh Selata n
Kab. Aceh Besar
Kab. Aceh Bara t
Kota Langsa
Kab. Aceh Singki l
Kab. Nagan Raya
Kab. Aceh Barat Daya
Kab. Mener Mera h
Kab. Aceh Jaya
Kab. Gayo Lues
Kab. Simeulue
Kota Sabang
Thousand rupiah Source: World Bank staff calculations based on MoF data and BPS.
In 2001 and 2002 DAK was used mainly for reforestation.25 In 2003, DAK allocation was expanded to cover infrastructure, education, health, government facilities, agriculture, fi sheries, and the environment. Since 2003, infrastructure has become DAK’s main focus, but the infrastructure allocation has decreased over the years. In 2003 infrastructure accounted for up to 50 percent of DAK-nonreforestation funds, but by 2006 it had declined to 30 percent. Education and health follow infrastructure, with an average of 25 percent and 18 percent, respectively. In 2004 the fi sheries sector also received a share from DAK-nonreforestation. In 2006 agriculture accounts for 10 percent of nonreforestation DAK.
25 Restoration funds are distributed as follows: 40 percent to producing regions, and 60 percent to central government to do reforestation activities all over the country, particularly in non-natural-resource-producing regions.
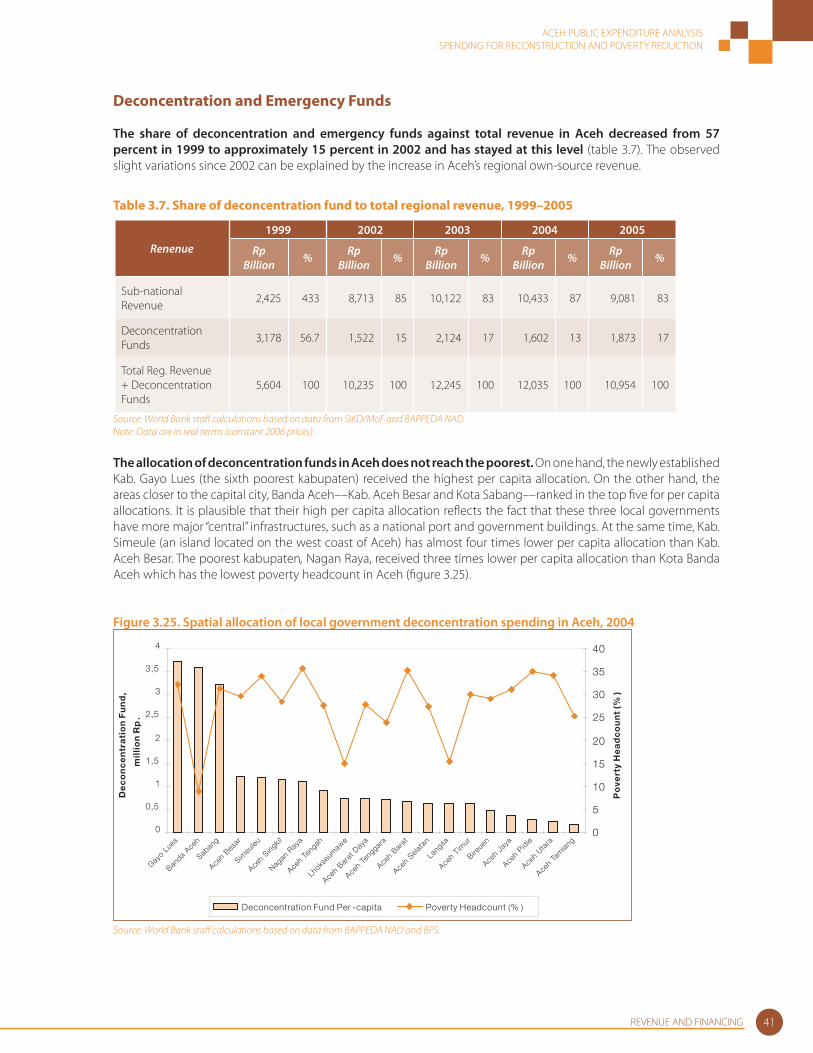
ACEH PUBLIC EXPENDITURE ANALYSISSPENDING FOR RECONSTRUCTION AND POVERTY REDUCTION
REVENUE AND FINANCING 41
Deconcentration and Emergency Funds
The share of deconcentration and emergency funds against total revenue in Aceh decreased from 57 percent in 1999 to approximately 15 percent in 2002 and has stayed at this level (table 3.7). The observed slight variations since 2002 can be explained by the increase in Aceh’s regional own-source revenue.
Table 3.7. Share of deconcentration fund to total regional revenue, 1999–2005
Renenue
1999 2002 2003 2004 2005
Rp Billion % Rp
Billion % Rp Billion % Rp
Billion % Rp Billion %
Sub-national Revenue
2,425 433 8,713 85 10,122 83 10,433 87 9,081 83
Deconcentration Funds
3,178 56.7 1,522 15 2,124 17 1,602 13 1,873 17
Total Reg. Revenue + Deconcentration Funds
5,604 100 10,235 100 12,245 100 12,035 100 10,954 100
Source: World Bank staff calculations based on data from SIKD/MoF and BAPPEDA NAD.Note: Data are in real terms (constant 2006 prices).
The allocation of deconcentration funds in Aceh does not reach the poorest. On one hand, the newly established Kab. Gayo Lues (the sixth poorest kabupaten) received the highest per capita allocation. On the other hand, the areas closer to the capital city, Banda Aceh––Kab. Aceh Besar and Kota Sabang––ranked in the top fi ve for per capita allocations. It is plausible that their high per capita allocation refl ects the fact that these three local governments have more major “central” infrastructures, such as a national port and government buildings. At the same time, Kab. Simeule (an island located on the west coast of Aceh) has almost four times lower per capita allocation than Kab. Aceh Besar. The poorest kabupaten, Nagan Raya, received three times lower per capita allocation than Kota Banda Aceh which has the lowest poverty headcount in Aceh (fi gure 3.25).
Figure 3.25. Spatial allocation of local government deconcentration spending in Aceh, 2004
0
0,5
1
1,5
2
2,5
3
3,5
4
Gayo L
ues
Banda A
ceh
Saban
g
Aceh B
esar
Simeu
leu
Aceh
Singkil
Nagan
Raya
Aceh
Teng
ah
Lhoks
eum
awe
Aceh
Barat
Daya
Aceh
Teng
gara
Aceh
Bar
at
Aceh
Sela
tan
Lang
sa
Aceh
Timur
Bireue
n
Aceh
Jaya
Aceh
Pidie
Aceh
Utara
Aceh
Tam
iang
De
co
nc
en
tra
tio
n F
un
d,
mil
lio
n R
p.
0
5
10
15
20
25
30
35
40
Po
vert
y H
ea
dc
ou
nt
(%)
Deconcentration Fund Per -capita Poverty Headcount (% )
Source: World Bank staff calculations based on data from BAPPEDA NAD and BPS.
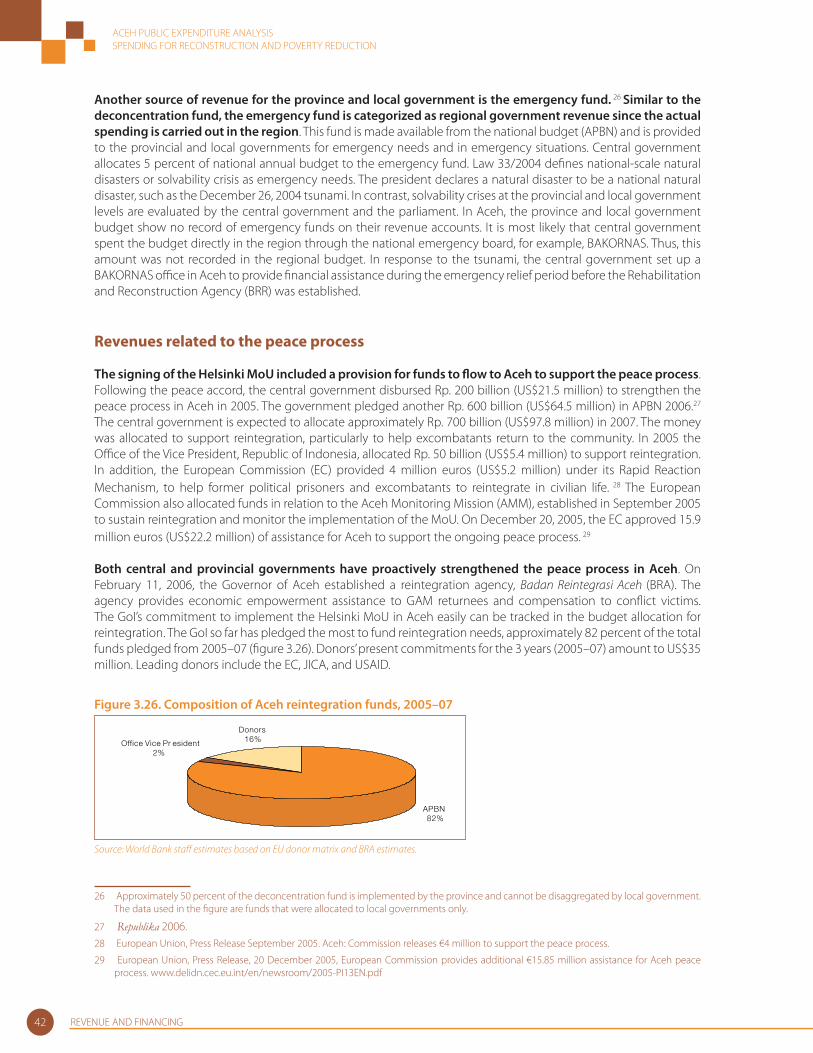
ACEH PUBLIC EXPENDITURE ANALYSISSPENDING FOR RECONSTRUCTION AND POVERTY REDUCTION
REVENUE AND FINANCING42
Another source of revenue for the province and local government is the emergency fund. 26 Similar to the deconcentration fund, the emergency fund is categorized as regional government revenue since the actual spending is carried out in the region. This fund is made available from the national budget (APBN) and is provided to the provincial and local governments for emergency needs and in emergency situations. Central government allocates 5 percent of national annual budget to the emergency fund. Law 33/2004 defi nes national-scale natural disasters or solvability crisis as emergency needs. The president declares a natural disaster to be a national natural disaster, such as the December 26, 2004 tsunami. In contrast, solvability crises at the provincial and local government levels are evaluated by the central government and the parliament. In Aceh, the province and local government budget show no record of emergency funds on their revenue accounts. It is most likely that central government spent the budget directly in the region through the national emergency board, for example, BAKORNAS. Thus, this amount was not recorded in the regional budget. In response to the tsunami, the central government set up a BAKORNAS offi ce in Aceh to provide fi nancial assistance during the emergency relief period before the Rehabilitation and Reconstruction Agency (BRR) was established.
Revenues related to the peace process
The signing of the Helsinki MoU included a provision for funds to fl ow to Aceh to support the peace process. Following the peace accord, the central government disbursed Rp. 200 billion (US$21.5 million) to strengthen the peace process in Aceh in 2005. The government pledged another Rp. 600 billion (US$64.5 million) in APBN 2006.27 The central government is expected to allocate approximately Rp. 700 billion (US$97.8 million) in 2007. The money was allocated to support reintegration, particularly to help excombatants return to the community. In 2005 the Offi ce of the Vice President, Republic of Indonesia, allocated Rp. 50 billion (US$5.4 million) to support reintegration. In addition, the European Commission (EC) provided 4 million euros (US$5.2 million) under its Rapid Reaction Mechanism, to help former political prisoners and excombatants to reintegrate in civilian life. 28 The European Commission also allocated funds in relation to the Aceh Monitoring Mission (AMM), established in September 2005 to sustain reintegration and monitor the implementation of the MoU. On December 20, 2005, the EC approved 15.9 million euros (US$22.2 million) of assistance for Aceh to support the ongoing peace process. 29
Both central and provincial governments have proactively strengthened the peace process in Aceh. On February 11, 2006, the Governor of Aceh established a reintegration agency, Badan Reintegrasi Aceh (BRA). The agency provides economic empowerment assistance to GAM returnees and compensation to confl ict victims. The GoI’s commitment to implement the Helsinki MoU in Aceh easily can be tracked in the budget allocation for reintegration. The GoI so far has pledged the most to fund reintegration needs, approximately 82 percent of the total funds pledged from 2005–07 (fi gure 3.26). Donors’ present commitments for the 3 years (2005–07) amount to US$35 million. Leading donors include the EC, JICA, and USAID.
Figure 3.26. Composition of Aceh reintegration funds, 2005–07
APBN82%
Office Vice Pr esident2%
Donors16%
Source: World Bank staff estimates based on EU donor matrix and BRA estimates.
26 Approximately 50 percent of the deconcentration fund is implemented by the province and cannot be disaggregated by local government. The data used in the fi gure are funds that were allocated to local governments only.
27 Republika 2006. 28 European Union, Press Release September 2005. Aceh: Commission releases €4 million to support the peace process.
29 European Union, Press Release, 20 December 2005, European Commission provides additional €15.85 million assistance for Aceh peace process. www.delidn.cec.eu.int/en/newsroom/2005-PI13EN.pdf
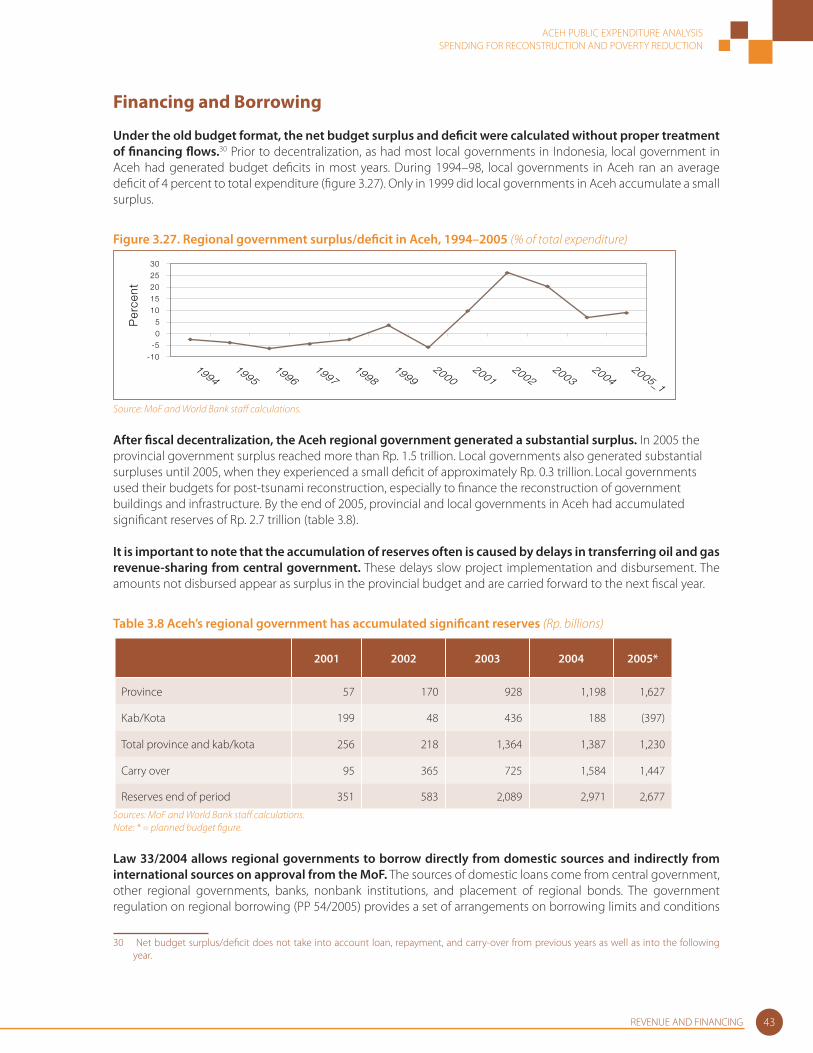
ACEH PUBLIC EXPENDITURE ANALYSISSPENDING FOR RECONSTRUCTION AND POVERTY REDUCTION
REVENUE AND FINANCING 43
Financing and Borrowing
Under the old budget format, the net budget surplus and defi cit were calculated without proper treatment of fi nancing fl ows.30 Prior to decentralization, as had most local governments in Indonesia, local government in Aceh had generated budget defi cits in most years. During 1994–98, local governments in Aceh ran an average defi cit of 4 percent to total expenditure (fi gure 3.27). Only in 1999 did local governments in Aceh accumulate a small surplus.
Figure 3.27. Regional government surplus/defi cit in Aceh, 1994–2005 (% of total expenditure)
-10
-5
0
5
10
15
20
25
30
19941995
19961997
19981999
20002001
20022003
20042005_1
Per
cent
Source: MoF and World Bank staff calculations.
After fi scal decentralization, the Aceh regional government generated a substantial surplus. In 2005 the provincial government surplus reached more than Rp. 1.5 trillion. Local governments also generated substantial surpluses until 2005, when they experienced a small defi cit of approximately Rp. 0.3 trillion. Local governments used their budgets for post-tsunami reconstruction, especially to fi nance the reconstruction of government buildings and infrastructure. By the end of 2005, provincial and local governments in Aceh had accumulated signifi cant reserves of Rp. 2.7 trillion (table 3.8).
It is important to note that the accumulation of reserves often is caused by delays in transferring oil and gas revenue-sharing from central government. These delays slow project implementation and disbursement. The amounts not disbursed appear as surplus in the provincial budget and are carried forward to the next fi scal year.
Table 3.8 Aceh’s regional government has accumulated signifi cant reserves (Rp. billions)
2001 2002 2003 2004 2005*
Province 57 170 928 1,198 1,627
Kab/Kota 199 48 436 188 (397)
Total province and kab/kota 256 218 1,364 1,387 1,230
Carry over 95 365 725 1,584 1,447
Reserves end of period 351 583 2,089 2,971 2,677Sources: MoF and World Bank staff calculations. Note: * = planned budget fi gure.
Law 33/2004 allows regional governments to borrow directly from domestic sources and indirectly from international sources on approval from the MoF. The sources of domestic loans come from central government, other regional governments, banks, nonbank institutions, and placement of regional bonds. The government regulation on regional borrowing (PP 54/2005) provides a set of arrangements on borrowing limits and conditions
30 Net budget surplus/defi cit does not take into account loan, repayment, and carry-over from previous years as well as into the following year.
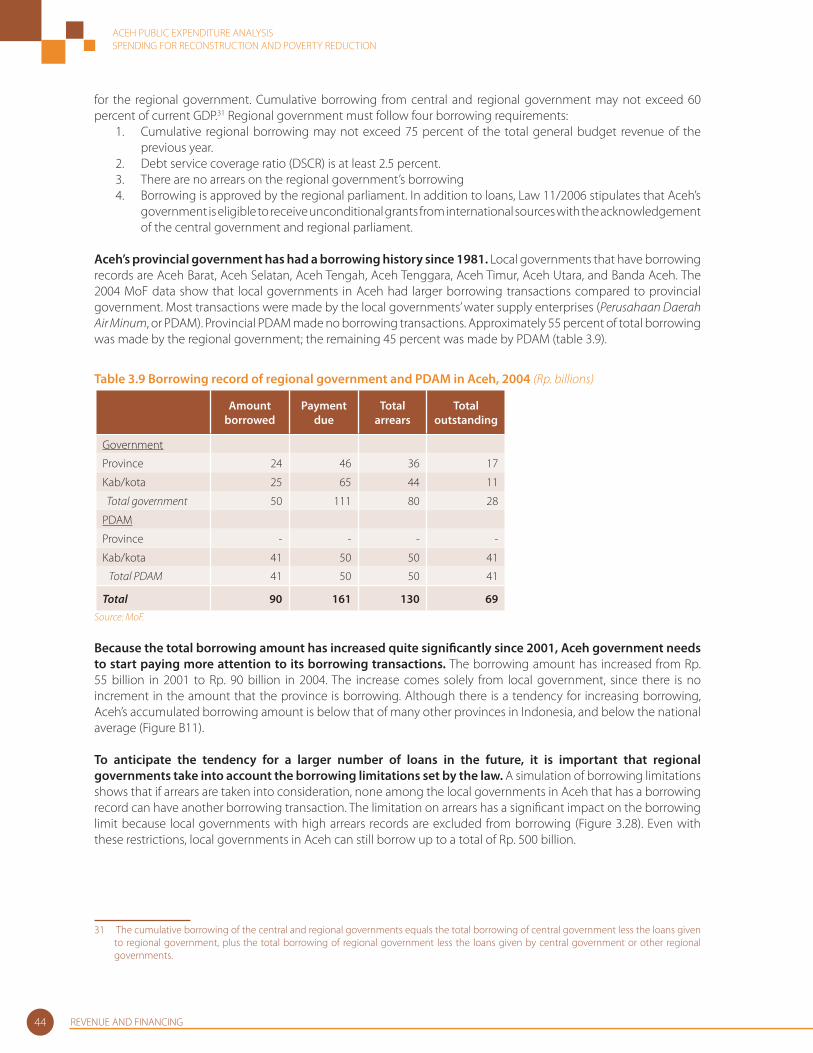
ACEH PUBLIC EXPENDITURE ANALYSISSPENDING FOR RECONSTRUCTION AND POVERTY REDUCTION
REVENUE AND FINANCING44
for the regional government. Cumulative borrowing from central and regional government may not exceed 60 percent of current GDP.31 Regional government must follow four borrowing requirements:
1. Cumulative regional borrowing may not exceed 75 percent of the total general budget revenue of the previous year.
2. Debt service coverage ratio (DSCR) is at least 2.5 percent.3. There are no arrears on the regional government’s borrowing 4. Borrowing is approved by the regional parliament. In addition to loans, Law 11/2006 stipulates that Aceh’s
government is eligible to receive unconditional grants from international sources with the acknowledgement of the central government and regional parliament.
Aceh’s provincial government has had a borrowing history since 1981. Local governments that have borrowing records are Aceh Barat, Aceh Selatan, Aceh Tengah, Aceh Tenggara, Aceh Timur, Aceh Utara, and Banda Aceh. The 2004 MoF data show that local governments in Aceh had larger borrowing transactions compared to provincial government. Most transactions were made by the local governments’ water supply enterprises (Perusahaan Daerah Air Minum, or PDAM). Provincial PDAM made no borrowing transactions. Approximately 55 percent of total borrowing was made by the regional government; the remaining 45 percent was made by PDAM (table 3.9).
Table 3.9 Borrowing record of regional government and PDAM in Aceh, 2004 (Rp. billions)
Amount borrowed
Payment due
Total arrears
Total outstanding
Government
Province 24 46 36 17
Kab/kota 25 65 44 11
Total government 50 111 80 28
PDAM
Province - - - -
Kab/kota 41 50 50 41
Total PDAM 41 50 50 41
Total 90 161 130 69Source: MoF.
Because the total borrowing amount has increased quite signifi cantly since 2001, Aceh government needs to start paying more attention to its borrowing transactions. The borrowing amount has increased from Rp. 55 billion in 2001 to Rp. 90 billion in 2004. The increase comes solely from local government, since there is no increment in the amount that the province is borrowing. Although there is a tendency for increasing borrowing, Aceh’s accumulated borrowing amount is below that of many other provinces in Indonesia, and below the national average (Figure B11).
To anticipate the tendency for a larger number of loans in the future, it is important that regional governments take into account the borrowing limitations set by the law. A simulation of borrowing limitations shows that if arrears are taken into consideration, none among the local governments in Aceh that has a borrowing record can have another borrowing transaction. The limitation on arrears has a signifi cant impact on the borrowing limit because local governments with high arrears records are excluded from borrowing (Figure 3.28). Even with these restrictions, local governments in Aceh can still borrow up to a total of Rp. 500 billion.
31 The cumulative borrowing of the central and regional governments equals the total borrowing of central government less the loans given to regional government, plus the total borrowing of regional government less the loans given by central government or other regional governments.
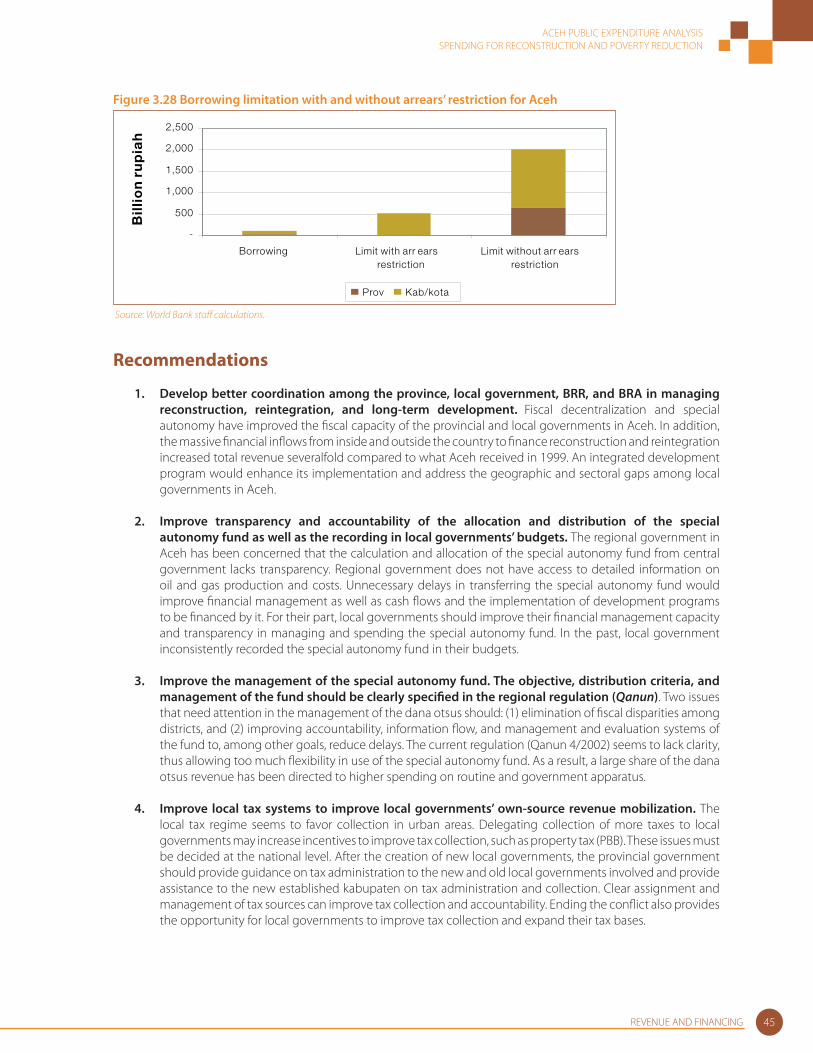
ACEH PUBLIC EXPENDITURE ANALYSISSPENDING FOR RECONSTRUCTION AND POVERTY REDUCTION
REVENUE AND FINANCING 45
Figure 3.28 Borrowing limitation with and without arrears’ restriction for Aceh
-
500
1,000
1,500
2,000
2,500
Borrowing Limit with arr earsrestriction
Limit without arr earsrestriction
Bil
lio
n ru
pia
h
Prov Kab/kota
Source: World Bank staff calculations.
Recommendations
1. Develop better coordination among the province, local government, BRR, and BRA in managing reconstruction, reintegration, and long-term development. Fiscal decentralization and special autonomy have improved the fi scal capacity of the provincial and local governments in Aceh. In addition, the massive fi nancial infl ows from inside and outside the country to fi nance reconstruction and reintegration increased total revenue severalfold compared to what Aceh received in 1999. An integrated development program would enhance its implementation and address the geographic and sectoral gaps among local governments in Aceh.
2. Improve transparency and accountability of the allocation and distribution of the special autonomy fund as well as the recording in local governments’ budgets. The regional government in Aceh has been concerned that the calculation and allocation of the special autonomy fund from central government lacks transparency. Regional government does not have access to detailed information on oil and gas production and costs. Unnecessary delays in transferring the special autonomy fund would improve fi nancial management as well as cash fl ows and the implementation of development programs to be fi nanced by it. For their part, local governments should improve their fi nancial management capacity and transparency in managing and spending the special autonomy fund. In the past, local government inconsistently recorded the special autonomy fund in their budgets.
3. Improve the management of the special autonomy fund. The objective, distribution criteria, and management of the fund should be clearly specifi ed in the regional regulation (Qanun). Two issues that need attention in the management of the dana otsus should: (1) elimination of fi scal disparities among districts, and (2) improving accountability, information fl ow, and management and evaluation systems of the fund to, among other goals, reduce delays. The current regulation (Qanun 4/2002) seems to lack clarity, thus allowing too much fl exibility in use of the special autonomy fund. As a result, a large share of the dana otsus revenue has been directed to higher spending on routine and government apparatus.
4. Improve local tax systems to improve local governments’ own-source revenue mobilization. The local tax regime seems to favor collection in urban areas. Delegating collection of more taxes to local governments may increase incentives to improve tax collection, such as property tax (PBB). These issues must be decided at the national level. After the creation of new local governments, the provincial government should provide guidance on tax administration to the new and old local governments involved and provide assistance to the new established kabupaten on tax administration and collection. Clear assignment and management of tax sources can improve tax collection and accountability. Ending the confl ict also provides the opportunity for local governments to improve tax collection and expand their tax bases.
ACEH PUBLIC EXPENDITURE ANALYSISSPENDING FOR RECONSTRUCTION AND POVERTY REDUCTION
REVENUE AND FINANCING46
5. Improve the allocation of intergovernmental transfers. Transfers from central and provincial governments (for example, DAU, DAK, dana otsus, tax-sharing) and the deconcentrated fund should address horizontal fi scal imbalances among kabupaten/kota in Aceh. There is evidence that kabupaten with small populations are receiving a disproportionate share of the funds and that indicators such as remoteness or poverty levels are not being taken suffi ciently into account.
6. Improve the planning and budgeting processes at the local level, for which provincial government and bupati (head of local government) leadership is key. It is urgent that local governments accelerate their budget approval processes to be able to start implementing their projects at the beginning of each fi scal year. The matching of actual budgets with identifi ed needs should be improved.
4Expenditures
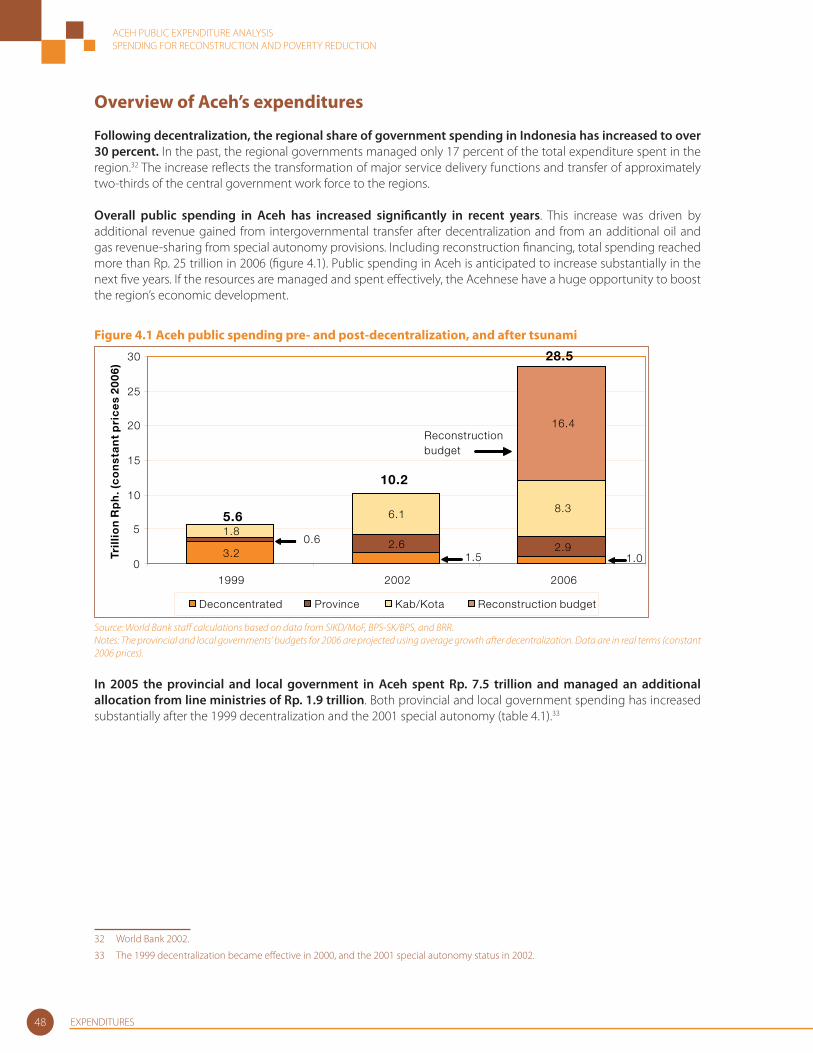
ACEH PUBLIC EXPENDITURE ANALYSISSPENDING FOR RECONSTRUCTION AND POVERTY REDUCTION
48 EXPENDITURES
Overview of Aceh’s expenditures
Following decentralization, the regional share of government spending in Indonesia has increased to over 30 percent. In the past, the regional governments managed only 17 percent of the total expenditure spent in the region.32 The increase refl ects the transformation of major service delivery functions and transfer of approximately two-thirds of the central government work force to the regions.
Overall public spending in Aceh has increased signifi cantly in recent years. This increase was driven by additional revenue gained from intergovernmental transfer after decentralization and from an additional oil and gas revenue-sharing from special autonomy provisions. Including reconstruction fi nancing, total spending reached more than Rp. 25 trillion in 2006 (fi gure 4.1). Public spending in Aceh is anticipated to increase substantially in the next fi ve years. If the resources are managed and spent eff ectively, the Acehnese have a huge opportunity to boost the region’s economic development.
Figure 4.1 Aceh public spending pre- and post-decentralization, and after tsunami
3.22.6 2.9
1.8
6.1 8.3
1.0
16.4
0
5
10
15
20
25
30
1999 2002 2006
Tril
lio
n R
ph
. (c
on
sta
nt
pri
ce
s 2
00
6)
Deconcentrated Province Kab/Kota Reconstruction budget
Reconstructionbudget
0.6
1.5
5.6
10.2
28.5
Source: World Bank staff calculations based on data from SIKD/MoF, BPS-SK/BPS, and BRR. Notes: The provincial and local governments’ budgets for 2006 are projected using average growth after decentralization. Data are in real terms (constant 2006 prices).
In 2005 the provincial and local government in Aceh spent Rp. 7.5 trillion and managed an additional allocation from line ministries of Rp. 1.9 trillion. Both provincial and local government spending has increased substantially after the 1999 decentralization and the 2001 special autonomy (table 4.1).33
32 World Bank 2002.
33 The 1999 decentralization became eff ective in 2000, and the 2001 special autonomy status in 2002.
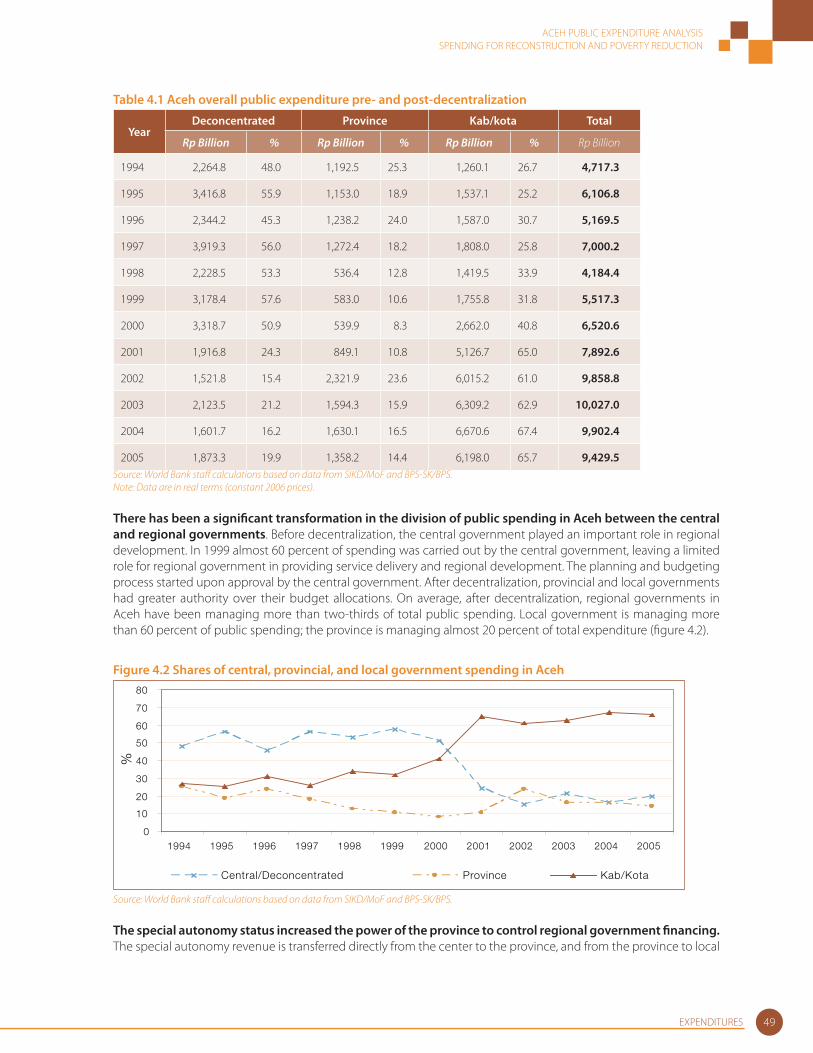
ACEH PUBLIC EXPENDITURE ANALYSISSPENDING FOR RECONSTRUCTION AND POVERTY REDUCTION
49EXPENDITURES
Table 4.1 Aceh overall public expenditure pre- and post-decentralization
YearDeconcentrated Province Kab/kota Total
Rp Billion % Rp Billion % Rp Billion % Rp Billion
1994 2,264.8 48.0 1,192.5 25.3 1,260.1 26.7 4,717.3
1995 3,416.8 55.9 1,153.0 18.9 1,537.1 25.2 6,106.8
1996 2,344.2 45.3 1,238.2 24.0 1,587.0 30.7 5,169.5
1997 3,919.3 56.0 1,272.4 18.2 1,808.0 25.8 7,000.2
1998 2,228.5 53.3 536.4 12.8 1,419.5 33.9 4,184.4
1999 3,178.4 57.6 583.0 10.6 1,755.8 31.8 5,517.3
2000 3,318.7 50.9 539.9 8.3 2,662.0 40.8 6,520.6
2001 1,916.8 24.3 849.1 10.8 5,126.7 65.0 7,892.6
2002 1,521.8 15.4 2,321.9 23.6 6,015.2 61.0 9,858.8
2003 2,123.5 21.2 1,594.3 15.9 6,309.2 62.9 10,027.0
2004 1,601.7 16.2 1,630.1 16.5 6,670.6 67.4 9,902.4
2005 1,873.3 19.9 1,358.2 14.4 6,198.0 65.7 9,429.5Source: World Bank staff calculations based on data from SIKD/MoF and BPS-SK/BPS.Note: Data are in real terms (constant 2006 prices).
There has been a signifi cant transformation in the division of public spending in Aceh between the central and regional governments. Before decentralization, the central government played an important role in regional development. In 1999 almost 60 percent of spending was carried out by the central government, leaving a limited role for regional government in providing service delivery and regional development. The planning and budgeting process started upon approval by the central government. After decentralization, provincial and local governments had greater authority over their budget allocations. On average, after decentralization, regional governments in Aceh have been managing more than two-thirds of total public spending. Local government is managing more than 60 percent of public spending; the province is managing almost 20 percent of total expenditure (fi gure 4.2).
Figure 4.2 Shares of central, provincial, and local government spending in Aceh
0
10
20
30
40
50
60
70
80
1994 1995 1996 1997 1998 1999 2000 2001 2002 2003 2004 2005
%
Central/Deconcentrated Province Kab/Kota
Source: World Bank staff calculations based on data from SIKD/MoF and BPS-SK/BPS.
The special autonomy status increased the power of the province to control regional government fi nancing. The special autonomy revenue is transferred directly from the center to the province, and from the province to local
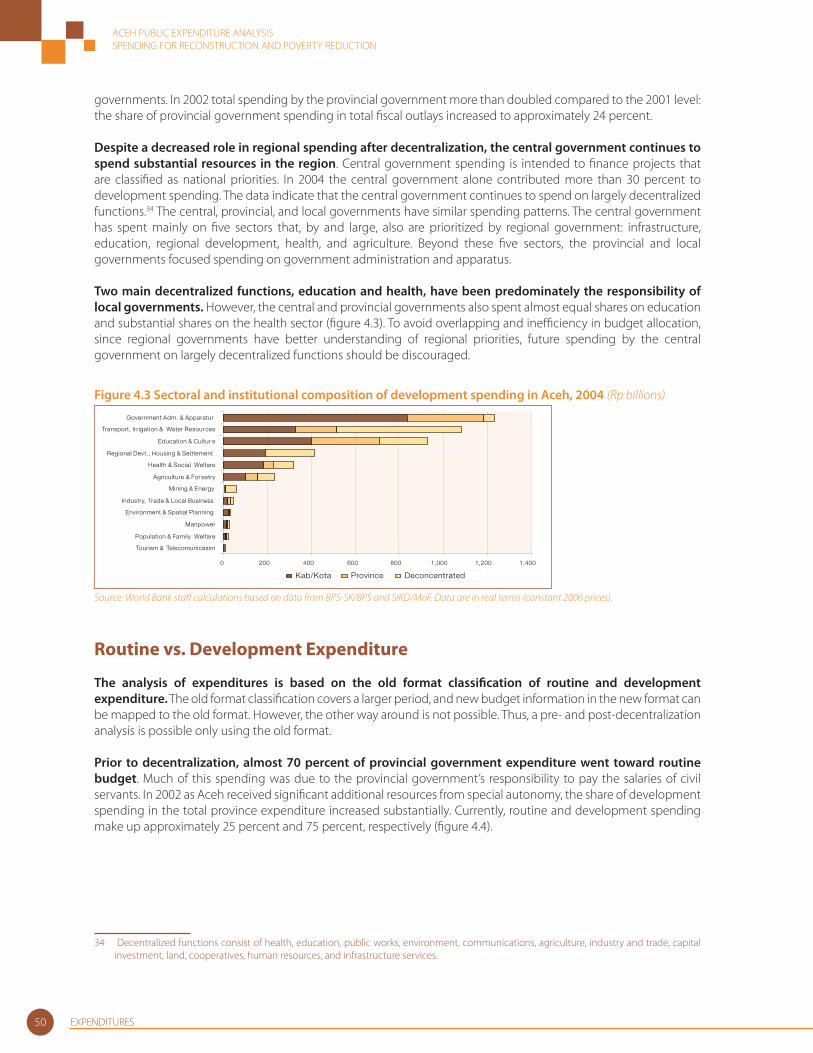
ACEH PUBLIC EXPENDITURE ANALYSISSPENDING FOR RECONSTRUCTION AND POVERTY REDUCTION
50 EXPENDITURES
governments. In 2002 total spending by the provincial government more than doubled compared to the 2001 level: the share of provincial government spending in total fi scal outlays increased to approximately 24 percent.
Despite a decreased role in regional spending after decentralization, the central government continues to spend substantial resources in the region. Central government spending is intended to fi nance projects that are classifi ed as national priorities. In 2004 the central government alone contributed more than 30 percent to development spending. The data indicate that the central government continues to spend on largely decentralized functions.34 The central, provincial, and local governments have similar spending patterns. The central government has spent mainly on fi ve sectors that, by and large, also are prioritized by regional government: infrastructure, education, regional development, health, and agriculture. Beyond these fi ve sectors, the provincial and local governments focused spending on government administration and apparatus.
Two main decentralized functions, education and health, have been predominately the responsibility of local governments. However, the central and provincial governments also spent almost equal shares on education and substantial shares on the health sector (fi gure 4.3). To avoid overlapping and ineffi ciency in budget allocation, since regional governments have better understanding of regional priorities, future spending by the central government on largely decentralized functions should be discouraged.
Figure 4.3 Sectoral and institutional composition of development spending in Aceh, 2004 (Rp billions)
0 200 400 600 800 1,000 1,200 1,400
Tourism & Telecomunicasim
Population & Family Welfare
Manpower
Environment & Spatial Planning
Industry, Trade & Local Business
Mining & Energy
Agriculture & For estry
Health & Social Welfare
Regional Devt., Housing & Settlement
Education & Cultur e
Transport, Irrigation & Water Resources
Government Adm. & Apparatur
Kab/Kota Province Deconcentrated
Source: World Bank staff calculations based on data from BPS-SK/BPS and SIKD/MoF. Data are in real terms (constant 2006 prices).
Routine vs. Development Expenditure
The analysis of expenditures is based on the old format classifi cation of routine and development expenditure. The old format classifi cation covers a larger period, and new budget information in the new format can be mapped to the old format. However, the other way around is not possible. Thus, a pre- and post-decentralization analysis is possible only using the old format.
Prior to decentralization, almost 70 percent of provincial government expenditure went toward routine budget. Much of this spending was due to the provincial government’s responsibility to pay the salaries of civil servants. In 2002 as Aceh received signifi cant additional resources from special autonomy, the share of development spending in the total province expenditure increased substantially. Currently, routine and development spending make up approximately 25 percent and 75 percent, respectively (fi gure 4.4).
34 Decentralized functions consist of health, education, public works, environment, communications, agriculture, industry and trade, capital investment, land, cooperatives, human resources, and infrastructure services.
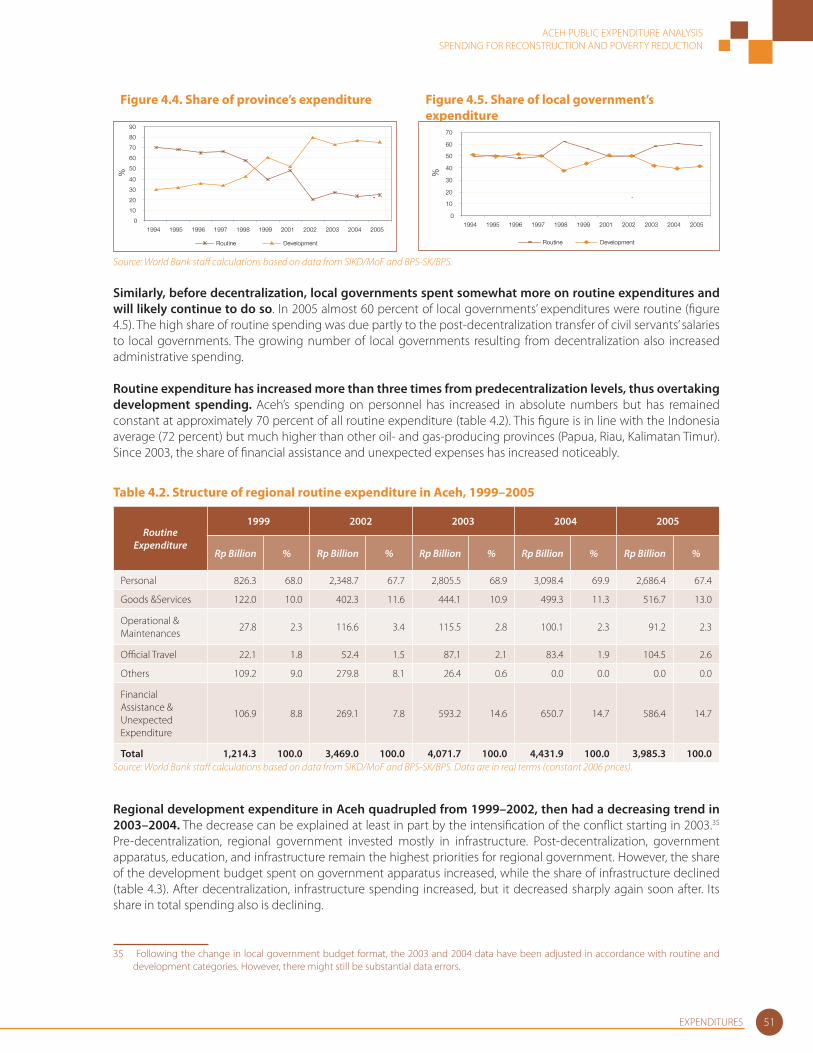
ACEH PUBLIC EXPENDITURE ANALYSISSPENDING FOR RECONSTRUCTION AND POVERTY REDUCTION
51EXPENDITURES
Figure 4.4. Share of province’s expenditure Figure 4.5. Share of local government’s expenditure
0
10
20
30
40
50
60
70
80
90
1994 1995 1996 1997 1998 1999 2001 2002 2003 2004 2005
%
Routine Development
0
10
20
30
40
50
60
70
1994 1995 1996 1997 1998 1999 2001 2002 2003 2004 2005
%
Routine Development
Source: World Bank staff calculations based on data from SIKD/MoF and BPS-SK/BPS.
Similarly, before decentralization, local governments spent somewhat more on routine expenditures and will likely continue to do so. In 2005 almost 60 percent of local governments’ expenditures were routine (fi gure 4.5). The high share of routine spending was due partly to the post-decentralization transfer of civil servants’ salaries to local governments. The growing number of local governments resulting from decentralization also increased administrative spending.
Routine expenditure has increased more than three times from predecentralization levels, thus overtaking development spending. Aceh’s spending on personnel has increased in absolute numbers but has remained constant at approximately 70 percent of all routine expenditure (table 4.2). This fi gure is in line with the Indonesia average (72 percent) but much higher than other oil- and gas-producing provinces (Papua, Riau, Kalimatan Timur). Since 2003, the share of fi nancial assistance and unexpected expenses has increased noticeably.
Table 4.2. Structure of regional routine expenditure in Aceh, 1999–2005
Routine Expenditure
1999 2002 2003 2004 2005
Rp Billion % Rp Billion % Rp Billion % Rp Billion % Rp Billion %
Personal 826.3 68.0 2,348.7 67.7 2,805.5 68.9 3,098.4 69.9 2,686.4 67.4
Goods &Services 122.0 10.0 402.3 11.6 444.1 10.9 499.3 11.3 516.7 13.0
Operational & Maintenances
27.8 2.3 116.6 3.4 115.5 2.8 100.1 2.3 91.2 2.3
Offi cial Travel 22.1 1.8 52.4 1.5 87.1 2.1 83.4 1.9 104.5 2.6
Others 109.2 9.0 279.8 8.1 26.4 0.6 0.0 0.0 0.0 0.0
Financial Assistance & Unexpected Expenditure
106.9 8.8 269.1 7.8 593.2 14.6 650.7 14.7 586.4 14.7
Total 1,214.3 100.0 3,469.0 100.0 4,071.7 100.0 4,431.9 100.0 3,985.3 100.0Source: World Bank staff calculations based on data from SIKD/MoF and BPS-SK/BPS. Data are in real terms (constant 2006 prices).
Regional development expenditure in Aceh quadrupled from 1999–2002, then had a decreasing trend in 2003–2004. The decrease can be explained at least in part by the intensifi cation of the confl ict starting in 2003.35 Pre-decentralization, regional government invested mostly in infrastructure. Post-decentralization, government apparatus, education, and infrastructure remain the highest priorities for regional government. However, the share of the development budget spent on government apparatus increased, while the share of infrastructure declined (table 4.3). After decentralization, infrastructure spending increased, but it decreased sharply again soon after. Its share in total spending also is declining.
35 Following the change in local government budget format, the 2003 and 2004 data have been adjusted in accordance with routine and development categories. However, there might still be substantial data errors.

ACEH PUBLIC EXPENDITURE ANALYSISSPENDING FOR RECONSTRUCTION AND POVERTY REDUCTION
52 EXPENDITURES
Table 4.3. Regional development expenditure by sector in Aceh, 1999–2005
Sector
1999 2001 2003 2004 2005
Rp Billion % Rp
Billion % Rp Billion % Rp
Billion % Rp Billion %
Government Apparaturs
138.9 12.4 403.9 13.3 1,142.6 29.8 1,464.9 37.9 1,239.8 34.7
Agricuture 65.2 5.8 286.8 9.5 216.8 5.7 197.8 5.1 202.5 5.7
Mineral and Energy
2.9 0.3 5.7 0.2 16.7 0.4 16.4 0.4 12.6 0.4
Industry and trade 38.7 3.4 276.9 9.1 58.5 1.5 44.2 1.1 51.6 1.4
Labor Force 0.2 0.0 4.9 0.2 16.4 0.4 27.9 0.7 24.0 0.7
Health, Social Welfare
134.9 12.0 258.8 8.5 265.9 6.9 283.1 7.3 237.8 6.7
Education and Culture
139.8 12.4 494.6 16.3 1,060.6 27.7 879.7 22.7 748.3 21.0
Environment and Spatial Planning
39.5 3.5 83.5 2.8 27.1 0.7 38.5 1.0 40.7 1.1
Family Planning and Demography
3.2 0.3 5.8 0.2 7.0 0.2 23.1 0.6 12.9 0.4
Infratructure 561.2 49.9 1,211.0 39.9 1,020.0 26.6 893.2 23.1 1,000.7 28.0
Transport, Water and Irrigation
350.8 31.2 781.3 25.8 795.5 20.8 641.2 16.6 863.3 24.2
Tourism and Telecomunication
10.4 0.9 21.6 0.7 11.1 0.3 13.0 0.3 9.7 0.3
Housing and Settlement
200.0 17.8 408.1 13.5 213.5 5.6 239.0 6.2 127.7 3.6
Total 1,124.6 100.0 3,031.9 100.0 3,831.7 100.0 3,868.7 100.0 3,570.9 100.0Source: World Bank staff calculations based on data from SIKD/MoF and BPS-SK/BPS. Data are in constant 2006 prices.
Since 2003, development spending on government apparatus has become the highest spending priority for provincial and local governments. The share of this sector in total development expenditure has increased continuously, from approximately 12 percent in 1999 to almost 40 percent in 2004. The increasing number of local governments likely increased the spending on government infrastructure and supervision.
In 2002 a new concept of performance-based budgeting was introduced, and the government budgeting format was unifi ed toward a more integrated approach to expenditure management.36 The new budget format is characterized by a shift from a program/project-based approach (distinction between routine and development spending) to a benefi ciaries approach (distinction between expenditure on the government apparatus and expenditure on public services). Regional government in Aceh had widely adopted the new budget format by 2003. The provincial and local governments reporting their budget to MoF all use the new budget format. This transformation has enabled the evaluation of how much spending the regional government has allocated to projects that benefi ted the public and government apparatus.
In 2003 the provincial and local governments allocated more than 50 percent of their budgets to public services (table 4.4). The share of, as well as the total allocation to, public services declined in 2004 and 2005. The provincial and local governments allocated approximately 35 percent to apparatus expenses in 2003 and increased it to 40 percent in 2005.
36 These changes were stipulated in Ministry of Home Aff airs Decree 29/2002 (Kepmen 29).
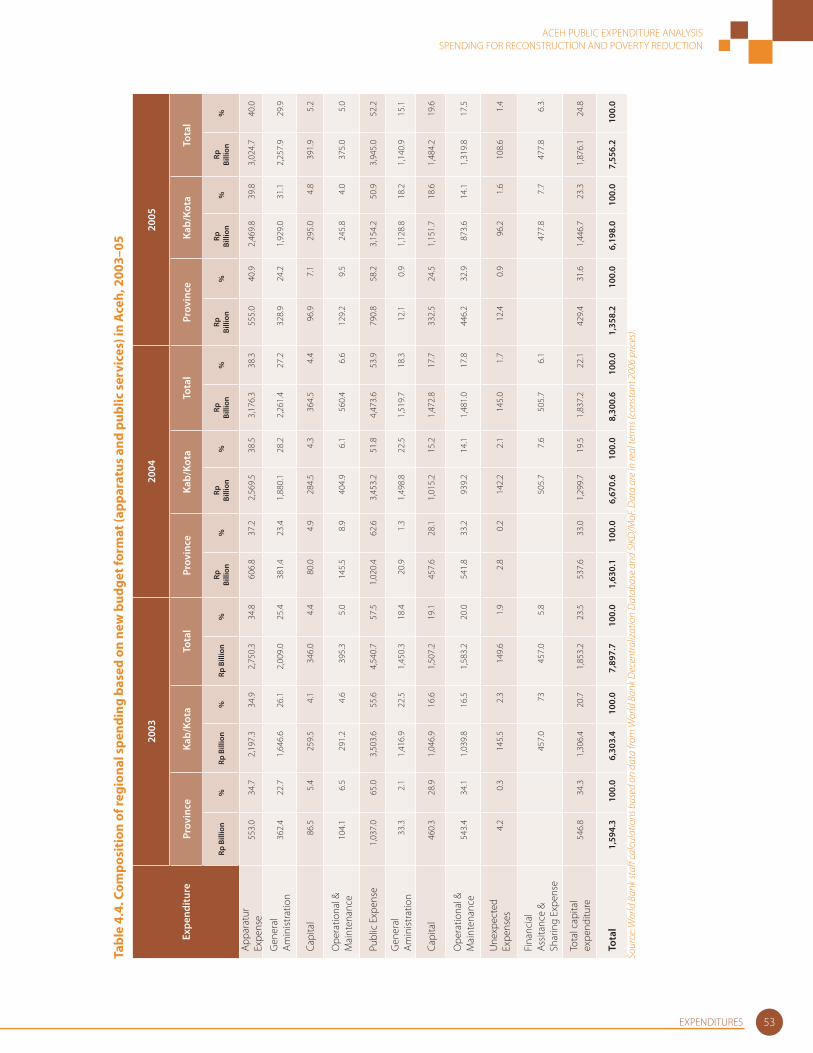
ACEH PUBLIC EXPENDITURE ANALYSISSPENDING FOR RECONSTRUCTION AND POVERTY REDUCTION
53EXPENDITURES
Tabl
e 4.
4. C
ompo
siti
on o
f reg
iona
l spe
ndin
g ba
sed
on n
ew b
udge
t for
mat
(app
arat
us a
nd p
ublic
ser
vice
s) in
Ace
h, 2
003–
05
Expe
nditu
re
2003
2004
2005
Prov
ince
Kab/
Kota
Tota
lPr
ovin
ceKa
b/Ko
taTo
tal
Prov
ince
Kab/
Kota
Tota
l
Rp B
illio
n%
Rp B
illio
n%
Rp B
illio
n%
Rp
Billi
on%
Rp
Billi
on%
Rp
Billi
on%
Rp
Billi
on%
Rp
Billi
on%
Rp
Billi
on%
Appa
ratu
r Ex
pens
e55
3.0
34.7
2,19
7.3
34.9
2,75
0.3
34.8
606.
837
.22,
569.
538
.53,
176.
338
.355
5.0
40.9
2,46
9.8
39.8
3,02
4.7
40.0
Gen
eral
Am
inist
ratio
n36
2.4
22.7
1,64
6.6
26.1
2,00
9.0
25.4
381.
423
.41,
880.
128
.22,
261.
427
.232
8.9
24.2
1,92
9.0
31.1
2,25
7.9
29.9
Capi
tal
86.5
5.4
259.
54.
134
6.0
4.4
80.0
4.9
284.
54.
336
4.5
4.4
96.9
7.1
295.
04.
839
1.9
5.2
Ope
ratio
nal &
M
aint
enan
ce10
4.1
6.5
291.
24.
639
5.3
5.0
145.
58.
940
4.9
6.1
560.
46.
612
9.2
9.5
245.
84.
037
5.0
5.0
Publ
ic E
xpen
se1,
037.
065
.03,
503.
655
.64,
540.
757
.51,
020.
462
.63,
453.
251
.84,
473.
653
.979
0.8
58.2
3,15
4.2
50.9
3,94
5.0
52.2
Gen
eral
Am
inist
ratio
n33
.32.
11,
416.
922
.51,
450.
318
.420
.91.
31,
498.
822
.51,
519.
718
.312
.10.
91,
128.
818
.21,
140.
915
.1
Capi
tal
460.
328
.91,
046.
916
.61,
507.
219
.145
7.6
28.1
1,01
5.2
15.2
1,47
2.8
17.7
332.
524
.51,
151.
718
.61,
484.
219
.6
Ope
ratio
nal &
M
aint
enan
ce54
3.4
34.1
1,03
9.8
16.5
1,58
3.2
20.0
541.
833
.293
9.2
14.1
1,48
1.0
17.8
446.
232
.987
3.6
14.1
1,31
9.8
17.5
Une
xpec
ted
Expe
nses
4.2
0.3
145.
52.
314
9.6
1.9
2.8
0.2
142.
22.
114
5.0
1.7
12.4
0.9
96.2
1.6
108.
61.
4
Fina
ncia
l As
sitan
ce &
Sh
arin
g Ex
pens
e45
7.0
7345
7.0
5.8
505.
77.
650
5.7
6.1
477.
87.
747
7.8
6.3
Tota
l cap
ital
expe
nditu
re54
6.8
34.3
1,30
6.4
20.7
1,85
3.2
23.5
537.
633
.01,
299.
719
.51,
837.
222
.142
9.4
31.6
1,44
6.7
23.3
1,87
6.1
24.8
Tota
l1,
594.
310
0.0
6,30
3.4
100.
07,
897.
710
0.0
1,63
0.1
100.
06,
670.
610
0.0
8,30
0.6
100.
01,
358.
210
0.0
6,19
8.0
100.
07,
556.
210
0.0
Sour
ce: W
orld
Ban
k sta
ff ca
lcul
atio
ns b
ased
on
data
from
Wor
ld B
ank D
ecen
traliz
atio
n D
atab
ase
and
SIKD
/MoF
. Dat
a ar
e in
real
term
s (co
nsta
nt 2
006
pric
es).
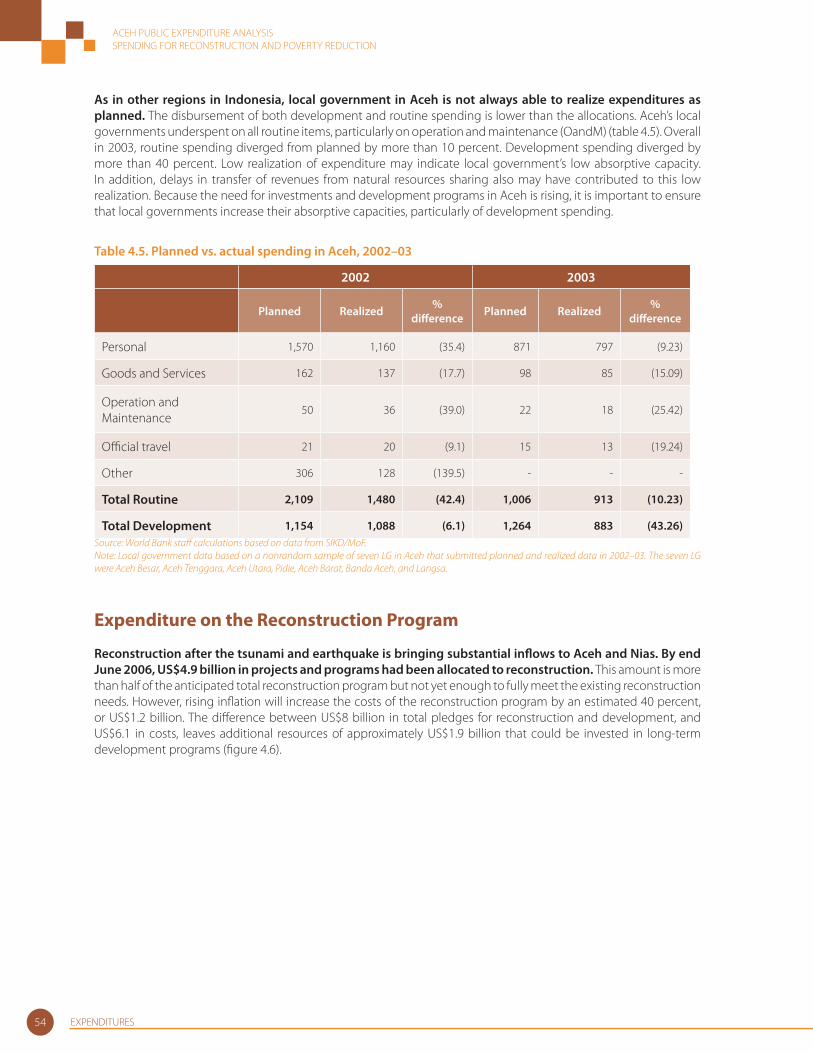
ACEH PUBLIC EXPENDITURE ANALYSISSPENDING FOR RECONSTRUCTION AND POVERTY REDUCTION
54 EXPENDITURES
As in other regions in Indonesia, local government in Aceh is not always able to realize expenditures as planned. The disbursement of both development and routine spending is lower than the allocations. Aceh’s local governments underspent on all routine items, particularly on operation and maintenance (OandM) (table 4.5). Overall in 2003, routine spending diverged from planned by more than 10 percent. Development spending diverged by more than 40 percent. Low realization of expenditure may indicate local government’s low absorptive capacity. In addition, delays in transfer of revenues from natural resources sharing also may have contributed to this low realization. Because the need for investments and development programs in Aceh is rising, it is important to ensure that local governments increase their absorptive capacities, particularly of development spending.
Table 4.5. Planned vs. actual spending in Aceh, 2002–03
2002 2003
Planned Realized % diff erence Planned Realized %
diff erence
Personal 1,570 1,160 (35.4) 871 797 (9.23)
Goods and Services 162 137 (17.7) 98 85 (15.09)
Operation and Maintenance
50 36 (39.0) 22 18 (25.42)
Offi cial travel 21 20 (9.1) 15 13 (19.24)
Other 306 128 (139.5) - - -
Total Routine 2,109 1,480 (42.4) 1,006 913 (10.23)
Total Development 1,154 1,088 (6.1) 1,264 883 (43.26)Source: World Bank staff calculations based on data from SIKD/MoF.Note: Local government data based on a nonrandom sample of seven LG in Aceh that submitted planned and realized data in 2002–03. The seven LG were Aceh Besar, Aceh Tenggara, Aceh Utara, Pidie, Aceh Barat, Banda Aceh, and Langsa.
Expenditure on the Reconstruction Program
Reconstruction after the tsunami and earthquake is bringing substantial infl ows to Aceh and Nias. By end June 2006, US$4.9 billion in projects and programs had been allocated to reconstruction. This amount is more than half of the anticipated total reconstruction program but not yet enough to fully meet the existing reconstruction needs. However, rising infl ation will increase the costs of the reconstruction program by an estimated 40 percent, or US$1.2 billion. The diff erence between US$8 billion in total pledges for reconstruction and development, and US$6.1 in costs, leaves additional resources of approximately US$1.9 billion that could be invested in long-term development programs (fi gure 4.6).
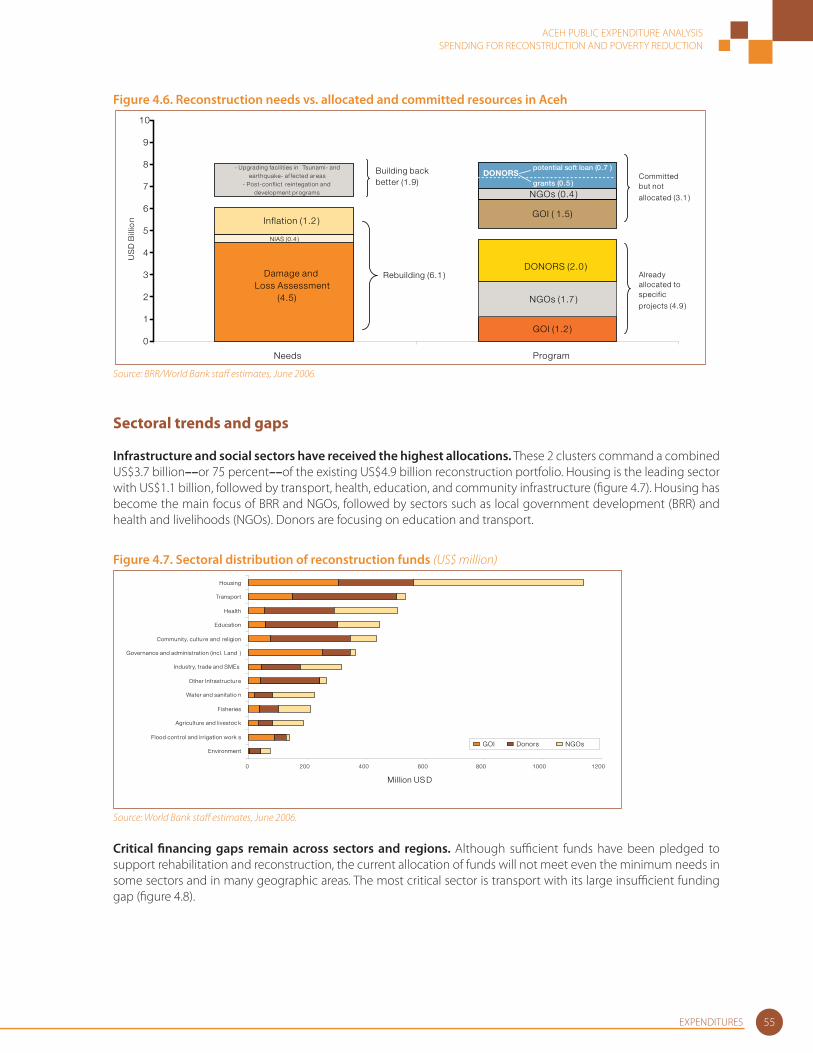
ACEH PUBLIC EXPENDITURE ANALYSISSPENDING FOR RECONSTRUCTION AND POVERTY REDUCTION
55EXPENDITURES
Figure 4.6. Reconstruction needs vs. allocated and committed resources in Aceh
GOI (1.2 )
Damage and Loss Assessment
(4.5) NGOs (1.7 )
NIAS (0.4 )
DONORS (2.0 )
Inflation (1.2 )GOI ( 1.5)
- Upgrading facilities in Tsunami- and earthquake- af fected areas
- Post-conflict reintegation and development programs NGOs (0.4 )
potential soft loan (0.7 )
0
1
2
3
4
5
6
7
8
9
10
Needs Program
US
D B
illio
n
Committed but not
allocated (3.1 )
Already allocated to specific
projects (4.9 )
Rebuilding (6.1 )
Building back better (1.9) grants (0.5 )
DONORS
Source: BRR/World Bank staff estimates, June 2006.
Sectoral trends and gaps
Infrastructure and social sectors have received the highest allocations. These 2 clusters command a combined US$3.7 billion––or 75 percent––of the existing US$4.9 billion reconstruction portfolio. Housing is the leading sector with US$1.1 billion, followed by transport, health, education, and community infrastructure (fi gure 4.7). Housing has become the main focus of BRR and NGOs, followed by sectors such as local government development (BRR) and health and livelihoods (NGOs). Donors are focusing on education and transport.
Figure 4.7. Sectoral distribution of reconstruction funds (US$ million)
0 200 400 600 800 1000 1200
Environment
Flood cont rol and irrigation work s
Agriculture and livestoc k
Fisheries
Water and sanitatio n
Other Infrastructur e
Industry, trade and SMEs
Governance and administration (incl. Land )
Community, cultu re and religion
Education
Health
Transport
Housing
Million US D
GOI Donors NGOs
Source: World Bank staff estimates, June 2006.
Critical fi nancing gaps remain across sectors and regions. Although suffi cient funds have been pledged to support rehabilitation and reconstruction, the current allocation of funds will not meet even the minimum needs in some sectors and in many geographic areas. The most critical sector is transport with its large insuffi cient funding gap (fi gure 4.8).
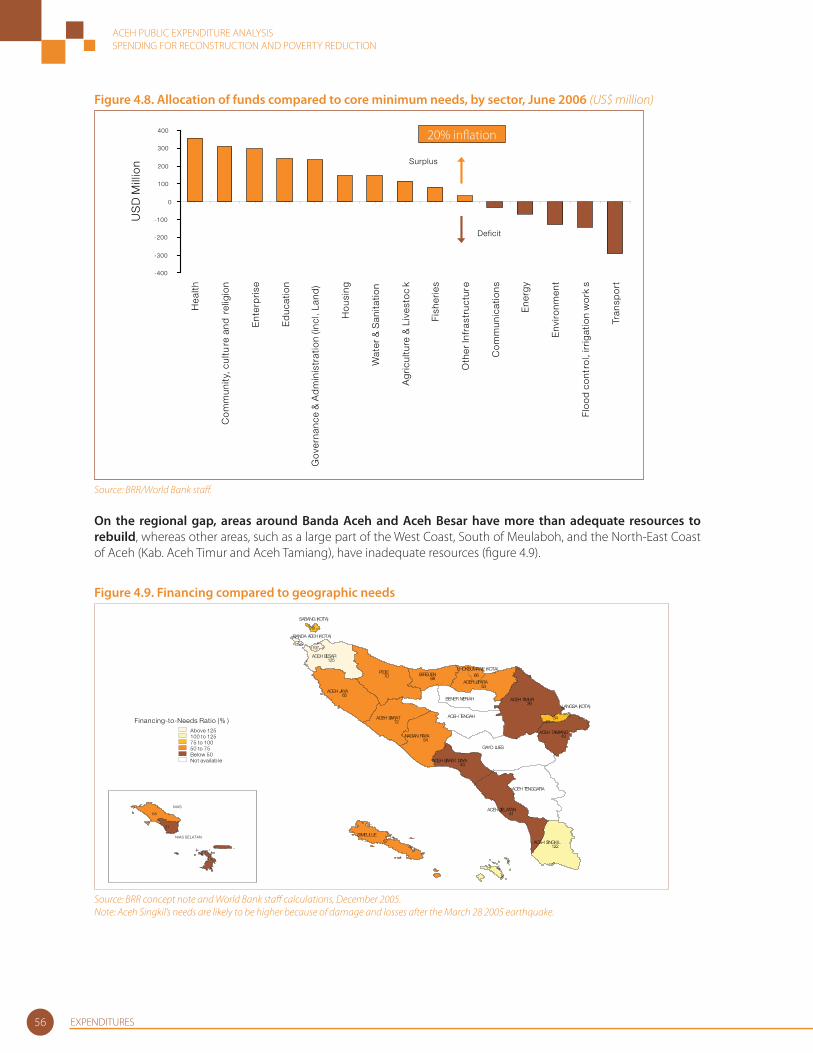
ACEH PUBLIC EXPENDITURE ANALYSISSPENDING FOR RECONSTRUCTION AND POVERTY REDUCTION
56 EXPENDITURES
Figure 4.8. Allocation of funds compared to core minimum needs, by sector, June 2006 (US$ million)
-400
-300
-200
-100
0
100
200
300
400
Hea
lth
Co
mm
unity
, cul
ture
and
rel
igio
n
Ent
erp
rise
Ed
ucat
ion
Go
vern
ance
& A
dm
inis
trat
ion
(incl
. Lan
d)
Ho
usin
g
Wat
er &
San
itatio
n
Ag
ricu
lture
& L
ives
toc
k
Fish
erie
s
Oth
er In
fras
truc
ture
Co
mm
unic
atio
ns
Ene
rgy
Env
ironm
ent
Flo
od
cont
rol,
irri
gat
ion
wo
rks
Tran
spo
rt
US
D M
illio
n
Deficit
Surplus
20% infl ation
Source: BRR/World Bank staff .
On the regional gap, areas around Banda Aceh and Aceh Besar have more than adequate resources to rebuild, whereas other areas, such as a large part of the West Coast, South of Meulaboh, and the North-East Coast of Aceh (Kab. Aceh Timur and Aceh Tamiang), have inadequate resources (fi gure 4.9).
Figure 4.9. Financing compared to geographic needs
ACEH UTARA
ACEH TENGGARA
BENER MERIAH
ACEH TENGAH
SIMEULUE
LHOKSUMAWE (KOTA)
LANGSA (KOTA)
BANDA ACEH (KOTA)
SABANG (KOTA)
67
54
43
41
122
43
84
39
53
66
72
6870
65
125
197
79
ACEH SINGKIL
ACEH SELATAN
ACEH TIMUR
ACEH BARAT
ACEH BESAR
PIDIE BIREUEN
ACEH BARAT DAYA
GAYO LUES
ACEH TAMIANGNAGAN RAYA
ACEH JAYA
NIAS SELATAN
NIAS
31
68
Financing-to-Needs Ratio (% )Above 125100 to 12575 to 10050 to 75Below 50Not availabl e
Source: BRR concept note and World Bank staff calculations, December 2005.Note: Aceh Singkil’s needs are likely to be higher because of damage and losses after the March 28 2005 earthquake.
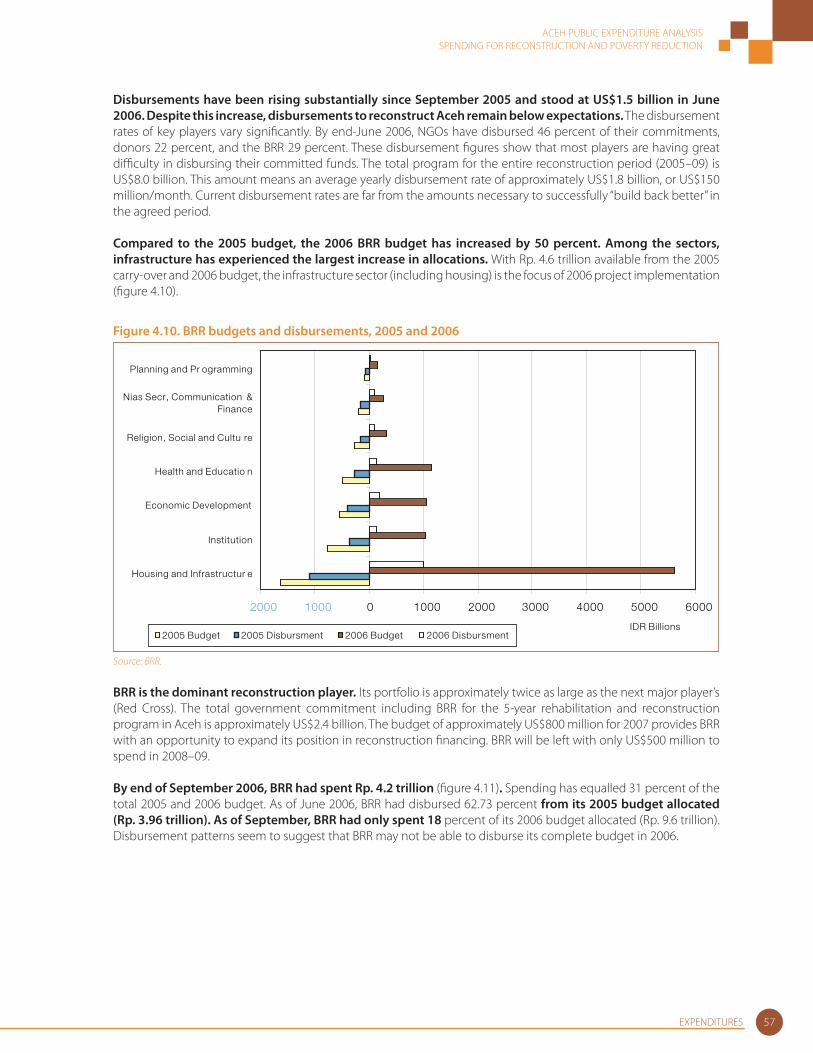
ACEH PUBLIC EXPENDITURE ANALYSISSPENDING FOR RECONSTRUCTION AND POVERTY REDUCTION
57EXPENDITURES
Disbursements have been rising substantially since September 2005 and stood at US$1.5 billion in June 2006. Despite this increase, disbursements to reconstruct Aceh remain below expectations. The disbursement rates of key players vary signifi cantly. By end-June 2006, NGOs have disbursed 46 percent of their commitments, donors 22 percent, and the BRR 29 percent. These disbursement fi gures show that most players are having great diffi culty in disbursing their committed funds. The total program for the entire reconstruction period (2005–09) is US$8.0 billion. This amount means an average yearly disbursement rate of approximately US$1.8 billion, or US$150 million/month. Current disbursement rates are far from the amounts necessary to successfully “build back better” in the agreed period.
Compared to the 2005 budget, the 2006 BRR budget has increased by 50 percent. Among the sectors, infrastructure has experienced the largest increase in allocations. With Rp. 4.6 trillion available from the 2005 carry-over and 2006 budget, the infrastructure sector (including housing) is the focus of 2006 project implementation (fi gure 4.10).
Figure 4.10. BRR budgets and disbursements, 2005 and 2006
2000 1000 0 1000 2000 3000 4000 5000 6000
Housing and Infrastructur e
Institution
Economic Development
Health and Educatio n
Religion, Social and Cultu re
Nias Secr, Communication &Finance
Planning and Pr ogramming
IDR Billions2005 Budget 2005 Disbursment 2006 Budget 2006 Disbursment
Source: BRR.
BRR is the dominant reconstruction player. Its portfolio is approximately twice as large as the next major player’s (Red Cross). The total government commitment including BRR for the 5-year rehabilitation and reconstruction program in Aceh is approximately US$2.4 billion. The budget of approximately US$800 million for 2007 provides BRR with an opportunity to expand its position in reconstruction fi nancing. BRR will be left with only US$500 million to spend in 2008–09.
By end of September 2006, BRR had spent Rp. 4.2 trillion (fi gure 4.11). Spending has equalled 31 percent of the total 2005 and 2006 budget. As of June 2006, BRR had disbursed 62.73 percent from its 2005 budget allocated (Rp. 3.96 trillion). As of September, BRR had only spent 18 percent of its 2006 budget allocated (Rp. 9.6 trillion). Disbursement patterns seem to suggest that BRR may not be able to disburse its complete budget in 2006.
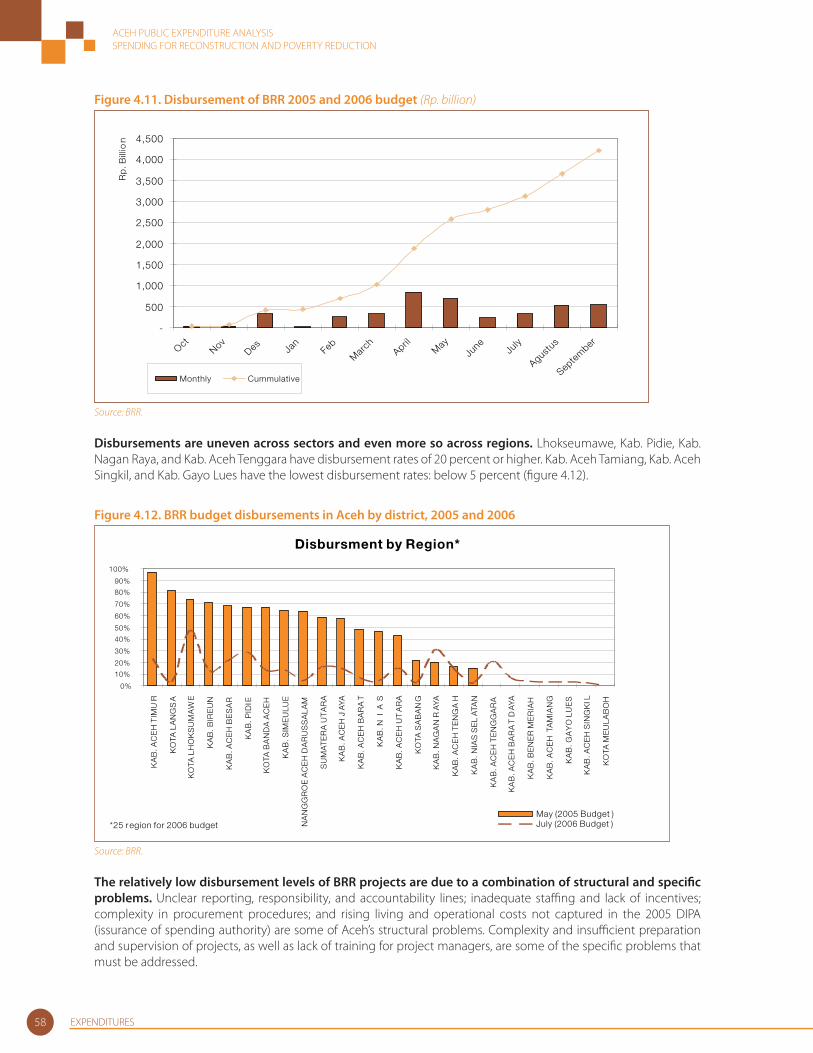
ACEH PUBLIC EXPENDITURE ANALYSISSPENDING FOR RECONSTRUCTION AND POVERTY REDUCTION
58 EXPENDITURES
Figure 4.11. Disbursement of BRR 2005 and 2006 budget (Rp. billion)
-
500
1,000
1,500
2,000
2,500
3,000
3,500
4,000
4,500
OctNov
Des Jan
Feb
Mar
chApril
May
June
July
Agustus
Septe
mber
Rp
. Bill
ion
Monthly Cummulative
Source: BRR.
Disbursements are uneven across sectors and even more so across regions. Lhokseumawe, Kab. Pidie, Kab. Nagan Raya, and Kab. Aceh Tenggara have disbursement rates of 20 percent or higher. Kab. Aceh Tamiang, Kab. Aceh Singkil, and Kab. Gayo Lues have the lowest disbursement rates: below 5 percent (fi gure 4.12).
Figure 4.12. BRR budget disbursements in Aceh by district, 2005 and 2006
Disbursment by Region*
0%
10%
20%
30%
40%
50%
60%
70%
80%
90%
100%
KA
B. A
CE
H T
IMU
R
KO
TA L
AN
GS
A
KO
TA L
HO
KS
UM
AW
E
KA
B. B
IRE
UN
KA
B. A
CE
H B
ES
AR
KA
B. P
IDIE
KO
TA B
AN
DA
AC
EH
KA
B. S
IME
ULU
E
NA
NG
GR
OE
AC
EH
DA
RU
SS
ALA
M
SU
MA
TE
RA
UT
AR
A
KA
B. A
CE
H J
AYA
KA
B. A
CE
H B
AR
AT
KA
B. N
I A
S
KA
B. A
CE
H U
TA
RA
KO
TA S
AB
AN
G
KA
B. N
AG
AN
RA
YA
KA
B. A
CE
H T
EN
GA
H
KA
B. N
IAS
SE
LA
TAN
KA
B. A
CE
H T
EN
GG
AR
A
KA
B. A
CE
H B
AR
AT
DA
YA
KA
B. B
EN
ER
ME
RIA
H
KA
B. A
CE
H T
AM
IAN
G
KA
B. G
AY
O L
UE
S
KA
B. A
CE
H S
ING
KIL
KO
TA M
EU
LAB
OH
*25 r egion for 2006 budgetMay (2005 Budget )July (2006 Budget )
Source: BRR.
The relatively low disbursement levels of BRR projects are due to a combination of structural and specifi c problems. Unclear reporting, responsibility, and accountability lines; inadequate staffi ng and lack of incentives; complexity in procurement procedures; and rising living and operational costs not captured in the 2005 DIPA (issurance of spending authority) are some of Aceh’s structural problems. Complexity and insuffi cient preparation and supervision of projects, as well as lack of training for project managers, are some of the specifi c problems that must be addressed.

ACEH PUBLIC EXPENDITURE ANALYSISSPENDING FOR RECONSTRUCTION AND POVERTY REDUCTION
59EXPENDITURES
Recommendations
Now is a great opportunity for Aceh to “build back better” after the devastating tsunami and long-standing confl ict. Large amounts of reconstruction funds, coupled with large amounts of APBD, enable Aceh to address structural poverty problems, boost the region’s economic development, and improve the quality of providing public services. However, the accountability and transparency of regional government must be enhanced to ensure that the public resources are managed and spent eff ectively.
Now is the time to make strategic (re-)allocation decisions regarding reconstruction funds. By end-2006, more than US$6 billion––approximately 75 percent of total funds––are expected to be allocated. At this still rather early stage of reconstruction, despite the large amount of available resources, very few players still have signifi cant amounts of “programmable” funds. Remaining fi nancing gaps need to be addressed urgently. Suffi cient funds have been pledged overall to support the rehabilitation and reconstruction. However, in some critical areas, the allocation of funds already programmed by the central government and the donors will not meet even the minimum needs, particularly transport. Several regions also remain severely underfunded, particularly Aceh Barat Daya, Aceh Selatan, Aceh Timur, Aceh Tamiang, and Nias.
Future spending by the central government on largely decentralized functions should be discouraged since regional governments have a better understanding of regional priorities so can avoid overlapping and ineffi ciency in budget allocation. Central government spending can be targeted well through earmarked grants (DAKs) that focus on lagging regions and activities relating to national priorities and having large economies of scale.
The diff erent government layers must scrutinize the tendency toward increased outlays on overall routine expenditure and on government apparatus development expenditure. This scrutiny is especially necessary given the indications that increased spending on government apparatus has not yet resulted in better management of fi scal resources. Public spending should be devoted to development-related activities that improve service delivery and social welfare and yield long-term economic and social benefi ts.
To improve program implementation, budget realization of local government spending should be increased. The realization of both development and routine spending is generally much lower than the budgeted expenditure. Low realization of expenditure is caused by several factors that need to be addressed, such as the local governments’ low absorptive capacity and delays in budget approvals and revenue transfers, especially natural resources sharing.
Given the complex circumstances and vast scope of work being undertaken by BRR fl exility for BRR spending cycles should be increased, enabling BRR to carry over unspent budget. This fl exibility should be combined with an improvement of BRR’s programming and oversight capacity.
1.
2.
3.
4.
5.
6.

ACEH PUBLIC EXPENDITURE ANALYSISSPENDING FOR RECONSTRUCTION AND POVERTY REDUCTION
60 EXPENDITURES
5Sectoral Analyses with Recommendations
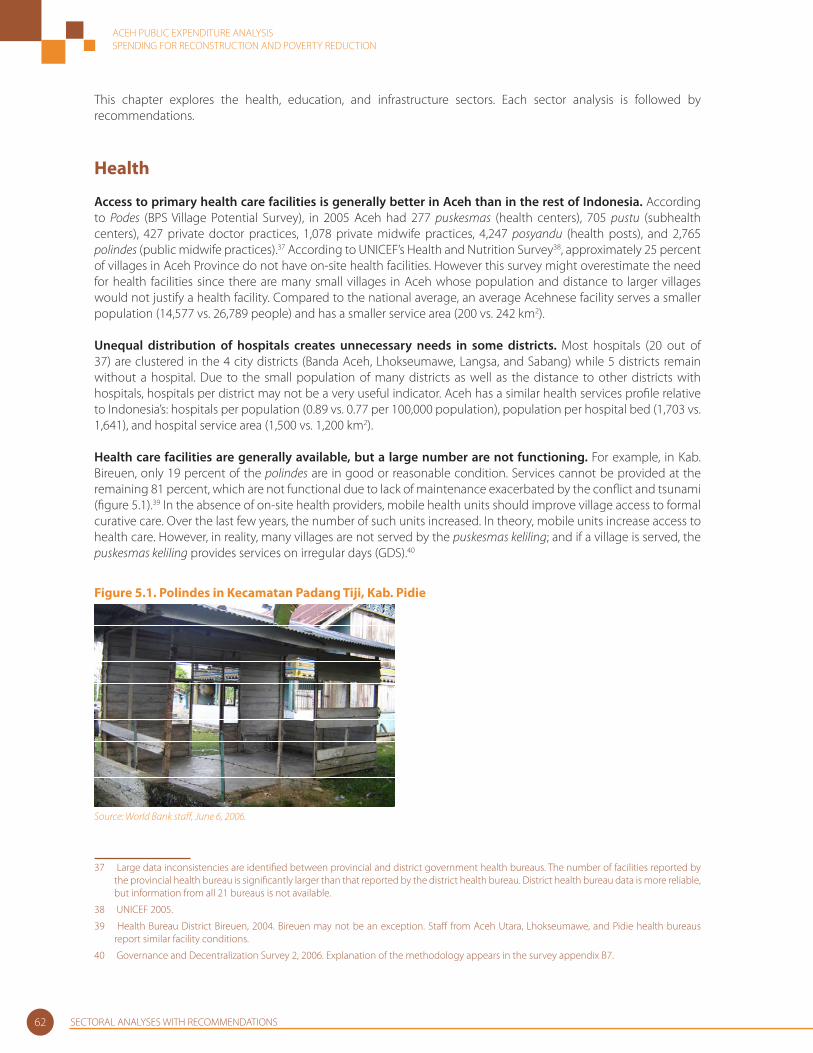
ACEH PUBLIC EXPENDITURE ANALYSISSPENDING FOR RECONSTRUCTION AND POVERTY REDUCTION
SECTORAL ANALYSES WITH RECOMMENDATIONS62
This chapter explores the health, education, and infrastructure sectors. Each sector analysis is followed by recommendations.
Health
Access to primary health care facilities is generally better in Aceh than in the rest of Indonesia. According to Podes (BPS Village Potential Survey), in 2005 Aceh had 277 puskesmas (health centers), 705 pustu (subhealth centers), 427 private doctor practices, 1,078 private midwife practices, 4,247 posyandu (health posts), and 2,765 polindes (public midwife practices).37 According to UNICEF’s Health and Nutrition Survey38, approximately 25 percent of villages in Aceh Province do not have on-site health facilities. However this survey might overestimate the need for health facilities since there are many small villages in Aceh whose population and distance to larger villages would not justify a health facility. Compared to the national average, an average Acehnese facility serves a smaller population (14,577 vs. 26,789 people) and has a smaller service area (200 vs. 242 km2).
Unequal distribution of hospitals creates unnecessary needs in some districts. Most hospitals (20 out of 37) are clustered in the 4 city districts (Banda Aceh, Lhokseumawe, Langsa, and Sabang) while 5 districts remain without a hospital. Due to the small population of many districts as well as the distance to other districts with hospitals, hospitals per district may not be a very useful indicator. Aceh has a similar health services profi le relative to Indonesia’s: hospitals per population (0.89 vs. 0.77 per 100,000 population), population per hospital bed (1,703 vs. 1,641), and hospital service area (1,500 vs. 1,200 km2).
Health care facilities are generally available, but a large number are not functioning. For example, in Kab. Bireuen, only 19 percent of the polindes are in good or reasonable condition. Services cannot be provided at the remaining 81 percent, which are not functional due to lack of maintenance exacerbated by the confl ict and tsunami (fi gure 5.1).39 In the absence of on-site health providers, mobile health units should improve village access to formal curative care. Over the last few years, the number of such units increased. In theory, mobile units increase access to health care. However, in reality, many villages are not served by the puskesmas keliling; and if a village is served, the puskesmas keliling provides services on irregular days (GDS).40
Figure 5.1. Polindes in Kecamatan Padang Tiji, Kab. Pidie
Source: World Bank staff , June 6, 2006.
37 Large data inconsistencies are identifi ed between provincial and district government health bureaus. The number of facilities reported by the provincial health bureau is signifi cantly larger than that reported by the district health bureau. District health bureau data is more reliable, but information from all 21 bureaus is not available.
38 UNICEF 2005.
39 Health Bureau District Bireuen, 2004. Bireuen may not be an exception. Staff from Aceh Utara, Lhokseumawe, and Pidie health bureaus report similar facility conditions.
40 Governance and Decentralization Survey 2, 2006. Explanation of the methodology appears in the survey appendix B7.
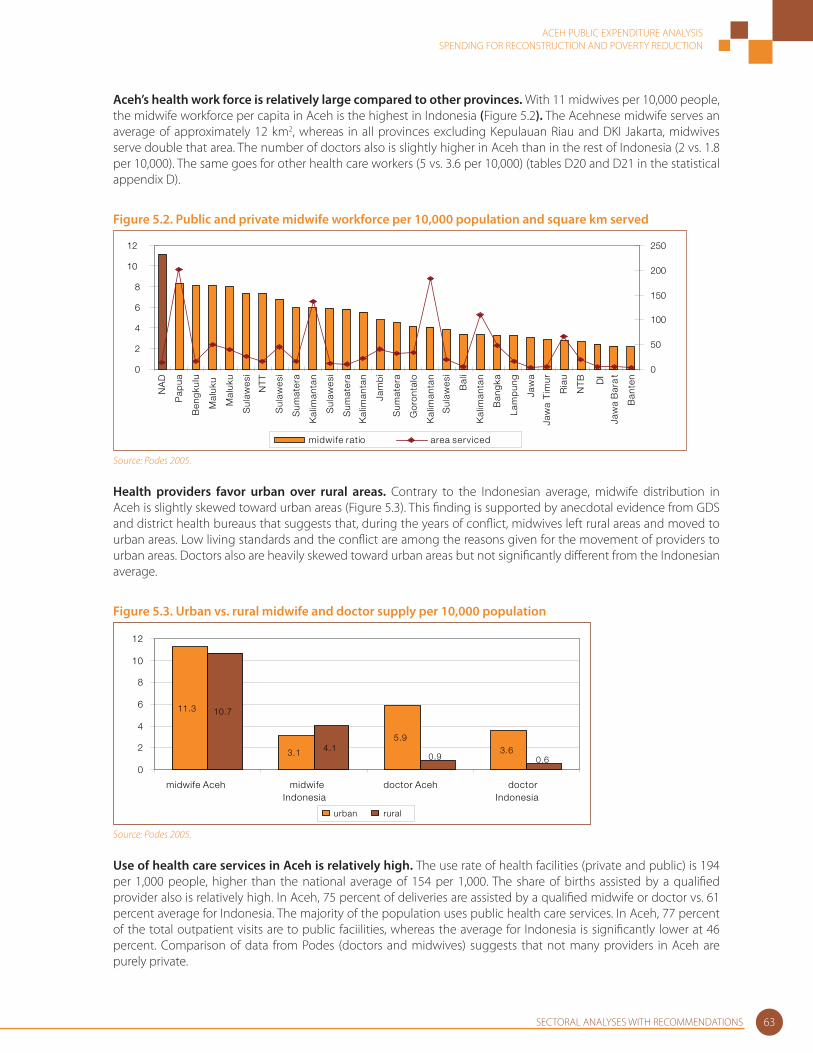
ACEH PUBLIC EXPENDITURE ANALYSISSPENDING FOR RECONSTRUCTION AND POVERTY REDUCTION
SECTORAL ANALYSES WITH RECOMMENDATIONS 63
Aceh’s health work force is relatively large compared to other provinces. With 11 midwives per 10,000 people, the midwife workforce per capita in Aceh is the highest in Indonesia (Figure 5.2). The Acehnese midwife serves an average of approximately 12 km2, whereas in all provinces excluding Kepulauan Riau and DKI Jakarta, midwives serve double that area. The number of doctors also is slightly higher in Aceh than in the rest of Indonesia (2 vs. 1.8 per 10,000). The same goes for other health care workers (5 vs. 3.6 per 10,000) (tables D20 and D21 in the statistical appendix D).
Figure 5.2. Public and private midwife workforce per 10,000 population and square km served
0
2
4
6
8
10
12
NA
D
Pap
ua
Ben
gku
lu
Mal
uku
Mal
uku
Sul
awes
i
NT
T
Sul
awes
i
Sum
ater
a
Kal
iman
tan
Sul
awes
i
Sum
ater
a
Kal
iman
tan
Jam
bi
Sum
ater
a
Go
ront
alo
Kal
iman
tan
Sul
awes
i
Bal
i
Kal
iman
tan
Ban
gka
Lam
pun
g
Jaw
a
Jaw
a T
imur
Ria
u
NT
B DI
Jaw
a B
ara
t
Ban
ten
0
50
100
150
200
250
midwife ratio area serviced
Source: Podes 2005.
Health providers favor urban over rural areas. Contrary to the Indonesian average, midwife distribution in Aceh is slightly skewed toward urban areas (Figure 5.3). This fi nding is supported by anecdotal evidence from GDS and district health bureaus that suggests that, during the years of confl ict, midwives left rural areas and moved to urban areas. Low living standards and the confl ict are among the reasons given for the movement of providers to urban areas. Doctors also are heavily skewed toward urban areas but not signifi cantly diff erent from the Indonesian average.
Figure 5.3. Urban vs. rural midwife and doctor supply per 10,000 population
11.3
3.1
5.93.6
10.7
4.10.60.9
0
2
4
6
8
10
12
midwife Aceh midwifeIndonesia
doctor Aceh doctorIndonesia
urban rural
Source: Podes 2005.
Use of health care services in Aceh is relatively high. The use rate of health facilities (private and public) is 194 per 1,000 people, higher than the national average of 154 per 1,000. The share of births assisted by a qualifi ed provider also is relatively high. In Aceh, 75 percent of deliveries are assisted by a qualifi ed midwife or doctor vs. 61 percent average for Indonesia. The majority of the population uses public health care services. In Aceh, 77 percent of the total outpatient visits are to public faciilities, whereas the average for Indonesia is signifi cantly lower at 46 percent. Comparison of data from Podes (doctors and midwives) suggests that not many providers in Aceh are purely private.
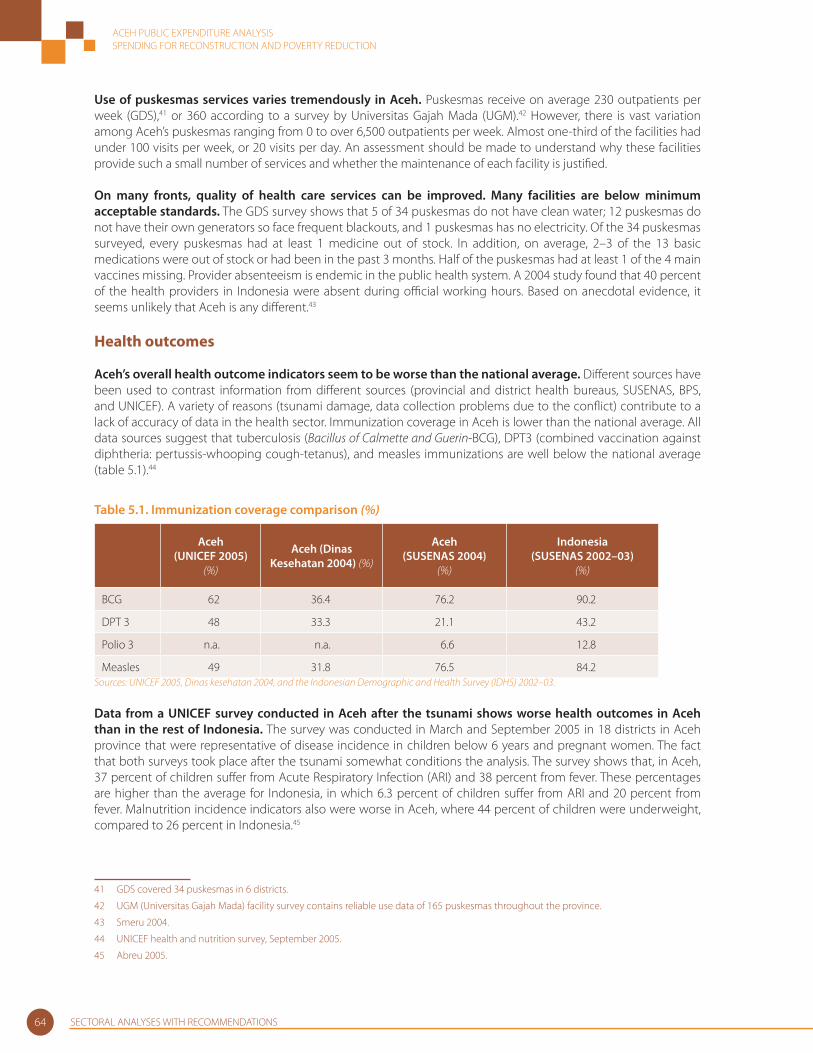
ACEH PUBLIC EXPENDITURE ANALYSISSPENDING FOR RECONSTRUCTION AND POVERTY REDUCTION
SECTORAL ANALYSES WITH RECOMMENDATIONS64
Use of puskesmas services varies tremendously in Aceh. Puskesmas receive on average 230 outpatients per week (GDS),41 or 360 according to a survey by Universitas Gajah Mada (UGM).42 However, there is vast variation among Aceh’s puskesmas ranging from 0 to over 6,500 outpatients per week. Almost one-third of the facilities had under 100 visits per week, or 20 visits per day. An assessment should be made to understand why these facilities provide such a small number of services and whether the maintenance of each facility is justifi ed.
On many fronts, quality of health care services can be improved. Many facilities are below minimum acceptable standards. The GDS survey shows that 5 of 34 puskesmas do not have clean water; 12 puskesmas do not have their own generators so face frequent blackouts, and 1 puskesmas has no electricity. Of the 34 puskesmas surveyed, every puskesmas had at least 1 medicine out of stock. In addition, on average, 2–3 of the 13 basic medications were out of stock or had been in the past 3 months. Half of the puskesmas had at least 1 of the 4 main vaccines missing. Provider absenteeism is endemic in the public health system. A 2004 study found that 40 percent of the health providers in Indonesia were absent during offi cial working hours. Based on anecdotal evidence, it seems unlikely that Aceh is any diff erent.43
Health outcomes
Aceh’s overall health outcome indicators seem to be worse than the national average. Diff erent sources have been used to contrast information from diff erent sources (provincial and district health bureaus, SUSENAS, BPS, and UNICEF). A variety of reasons (tsunami damage, data collection problems due to the confl ict) contribute to a lack of accuracy of data in the health sector. Immunization coverage in Aceh is lower than the national average. All data sources suggest that tuberculosis (Bacillus of Calmette and Guerin-BCG), DPT3 (combined vaccination against diphtheria: pertussis-whooping cough-tetanus), and measles immunizations are well below the national average (table 5.1).44
Table 5.1. Immunization coverage comparison (%)
Aceh(UNICEF 2005)
(%)
Aceh (Dinas Kesehatan 2004) (%)
Aceh(SUSENAS 2004)
(%)
Indonesia(SUSENAS 2002–03)
(%)
BCG 62 36.4 76.2 90.2
DPT 3 48 33.3 21.1 43.2
Polio 3 n.a. n.a. 6.6 12.8
Measles 49 31.8 76.5 84.2Sources: UNICEF 2005, Dinas kesehatan 2004, and the Indonesian Demographic and Health Survey (IDHS) 2002–03.
Data from a UNICEF survey conducted in Aceh after the tsunami shows worse health outcomes in Aceh than in the rest of Indonesia. The survey was conducted in March and September 2005 in 18 districts in Aceh province that were representative of disease incidence in children below 6 years and pregnant women. The fact that both surveys took place after the tsunami somewhat conditions the analysis. The survey shows that, in Aceh, 37 percent of children suff er from Acute Respiratory Infection (ARI) and 38 percent from fever. These percentages are higher than the average for Indonesia, in which 6.3 percent of children suff er from ARI and 20 percent from fever. Malnutrition incidence indicators also were worse in Aceh, where 44 percent of children were underweight, compared to 26 percent in Indonesia.45
41 GDS covered 34 puskesmas in 6 districts.
42 UGM (Universitas Gajah Mada) facility survey contains reliable use data of 165 puskesmas throughout the province.
43 Smeru 2004.
44 UNICEF health and nutrition survey, September 2005.
45 Abreu 2005.
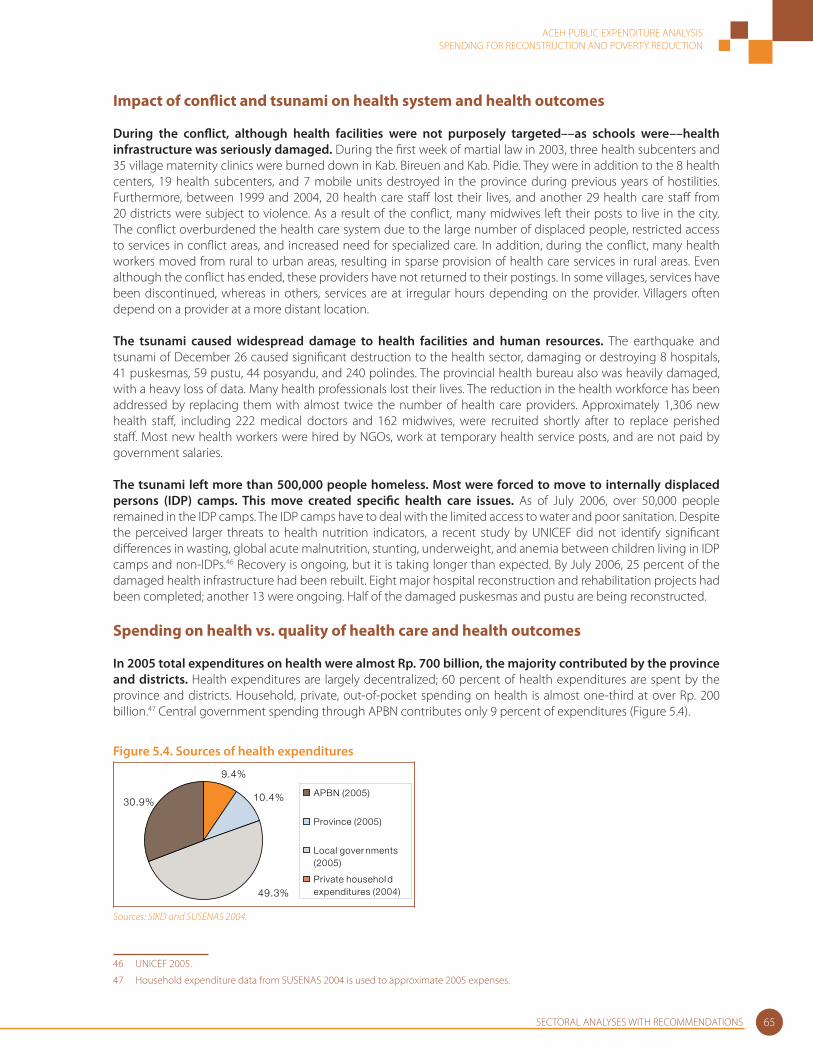
ACEH PUBLIC EXPENDITURE ANALYSISSPENDING FOR RECONSTRUCTION AND POVERTY REDUCTION
SECTORAL ANALYSES WITH RECOMMENDATIONS 65
Impact of confl ict and tsunami on health system and health outcomes
During the confl ict, although health facilities were not purposely targeted––as schools were––health infrastructure was seriously damaged. During the fi rst week of martial law in 2003, three health subcenters and 35 village maternity clinics were burned down in Kab. Bireuen and Kab. Pidie. They were in addition to the 8 health centers, 19 health subcenters, and 7 mobile units destroyed in the province during previous years of hostilities. Furthermore, between 1999 and 2004, 20 health care staff lost their lives, and another 29 health care staff from 20 districts were subject to violence. As a result of the confl ict, many midwives left their posts to live in the city. The confl ict overburdened the health care system due to the large number of displaced people, restricted access to services in confl ict areas, and increased need for specialized care. In addition, during the confl ict, many health workers moved from rural to urban areas, resulting in sparse provision of health care services in rural areas. Even although the confl ict has ended, these providers have not returned to their postings. In some villages, services have been discontinued, whereas in others, services are at irregular hours depending on the provider. Villagers often depend on a provider at a more distant location.
The tsunami caused widespread damage to health facilities and human resources. The earthquake and tsunami of December 26 caused signifi cant destruction to the health sector, damaging or destroying 8 hospitals, 41 puskesmas, 59 pustu, 44 posyandu, and 240 polindes. The provincial health bureau also was heavily damaged, with a heavy loss of data. Many health professionals lost their lives. The reduction in the health workforce has been addressed by replacing them with almost twice the number of health care providers. Approximately 1,306 new health staff , including 222 medical doctors and 162 midwives, were recruited shortly after to replace perished staff . Most new health workers were hired by NGOs, work at temporary health service posts, and are not paid by government salaries.
The tsunami left more than 500,000 people homeless. Most were forced to move to internally displaced persons (IDP) camps. This move created specifi c health care issues. As of July 2006, over 50,000 people remained in the IDP camps. The IDP camps have to deal with the limited access to water and poor sanitation. Despite the perceived larger threats to health nutrition indicators, a recent study by UNICEF did not identify signifi cant diff erences in wasting, global acute malnutrition, stunting, underweight, and anemia between children living in IDP camps and non-IDPs.46 Recovery is ongoing, but it is taking longer than expected. By July 2006, 25 percent of the damaged health infrastructure had been rebuilt. Eight major hospital reconstruction and rehabilitation projects had been completed; another 13 were ongoing. Half of the damaged puskesmas and pustu are being reconstructed.
Spending on health vs. quality of health care and health outcomes
In 2005 total expenditures on health were almost Rp. 700 billion, the majority contributed by the province and districts. Health expenditures are largely decentralized; 60 percent of health expenditures are spent by the province and districts. Household, private, out-of-pocket spending on health is almost one-third at over Rp. 200 billion.47 Central government spending through APBN contributes only 9 percent of expenditures (Figure 5.4).
Figure 5.4. Sources of health expenditures
9.4%
10.4%
49.3%
30.9%APBN (2005)
Province (2005)
Local gover nments(2005)
Private househol dexpenditures (2004)
Sources: SIKD and SUSENAS 2004.
46 UNICEF 2005.
47 Household expenditure data from SUSENAS 2004 is used to approximate 2005 expenses.
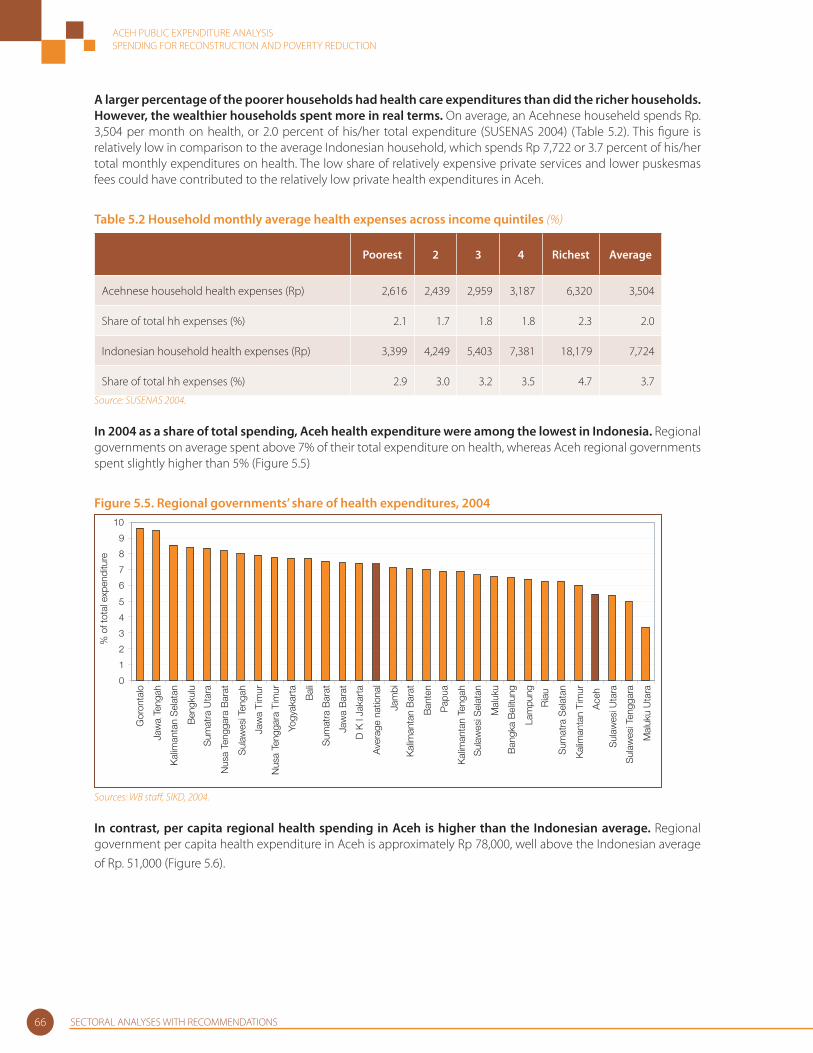
ACEH PUBLIC EXPENDITURE ANALYSISSPENDING FOR RECONSTRUCTION AND POVERTY REDUCTION
SECTORAL ANALYSES WITH RECOMMENDATIONS66
A larger percentage of the poorer households had health care expenditures than did the richer households. However, the wealthier households spent more in real terms. On average, an Acehnese househeld spends Rp. 3,504 per month on health, or 2.0 percent of his/her total expenditure (SUSENAS 2004) (Table 5.2). This fi gure is relatively low in comparison to the average Indonesian household, which spends Rp 7,722 or 3.7 percent of his/her total monthly expenditures on health. The low share of relatively expensive private services and lower puskesmas fees could have contributed to the relatively low private health expenditures in Aceh.
Table 5.2 Household monthly average health expenses across income quintiles (%)
Poorest 2 3 4 Richest Average
Acehnese household health expenses (Rp) 2,616 2,439 2,959 3,187 6,320 3,504
Share of total hh expenses (%) 2.1 1.7 1.8 1.8 2.3 2.0
Indonesian household health expenses (Rp) 3,399 4,249 5,403 7,381 18,179 7,724
Share of total hh expenses (%) 2.9 3.0 3.2 3.5 4.7 3.7
Source: SUSENAS 2004.
In 2004 as a share of total spending, Aceh health expenditure were among the lowest in Indonesia. Regional governments on average spent above 7% of their total expenditure on health, whereas Aceh regional governments spent slightly higher than 5% (Figure 5.5)
Figure 5.5. Regional governments’ share of health expenditures, 2004
0
1
2
3
4
5
6
7
8
9
10
Gor
onta
lo
Jaw
a Te
ngah
Kal
iman
tan
Sel
atan
Ben
gkul
u
Sum
atra
Uta
ra
Nus
a Te
ngga
ra B
arat
Sul
awes
i Ten
gah
Jaw
a Ti
mur
Nus
a Te
ngga
ra T
imur
Yogy
akar
ta
Bal
i
Sum
atra
Bar
at
Jaw
a B
arat
D K
I Ja
kart
a
Ave
rage
nat
iona
l
Jam
bi
Kal
iman
tan
Bar
at
Ban
ten
Pap
ua
Kal
iman
tan
Teng
ah
Sul
awes
i Sel
atan
Mal
uku
Ban
gka
Bel
itung
Lam
pung
Ria
u
Sum
atra
Sel
atan
Kal
iman
tan
Tim
ur
Ace
h
Sul
awes
i Uta
ra
Sul
awes
i Ten
ggar
a
Mal
uku
Uta
ra
% o
f tot
al e
xpen
ditu
re
Sources: WB staff , SIKD, 2004.
In contrast, per capita regional health spending in Aceh is higher than the Indonesian average. Regional government per capita health expenditure in Aceh is approximately Rp 78,000, well above the Indonesian average of Rp. 51,000 (Figure 5.6).

ACEH PUBLIC EXPENDITURE ANALYSISSPENDING FOR RECONSTRUCTION AND POVERTY REDUCTION
SECTORAL ANALYSES WITH RECOMMENDATIONS 67
Figure 5.6. Regional per capita health expenditures by province, 2004
0
50
100
150
200
250
Pap
ua
Kal
iman
tan
Tim
ur
Go
ront
alo
Kal
iman
tan
Ten
gah
DK
I Jak
arta
Ria
u
Mal
uku
Sul
awes
i Ten
gah
NA
D
Kal
iman
tan
Sel
atan Bal
i
Ben
gku
lu
Jam
bi
NT
T
Sum
ater
a B
ara
t
Ban
gka
Bel
itung
DI Y
og
yaka
rta
Kal
iman
tan
Bar
at
Sul
awes
i Sel
atan
Sum
ater
a U
tara
Nat
iona
l
NT
B
Sul
awes
i Ten
gg
ara
Sul
awes
i Uta
ra
Mal
uku
Uta
ra
Sum
ater
a S
elat
an
Jaw
a T
eng
ah
Jaw
a T
imur
Lam
pun
g
Jaw
a B
ara
t
Ban
ten
Rp
('0
00
)
Source: World Bank staff .Note: Data for DKI Jakarta is not available.
After decentralization, regional health expenditures increased in absolute terms, but the share in total regional expenses did not change much (Figure 5.7). As a result of the special autonomy status, absolute health expenditures increased by approximately 50 percent, but the share of total expenditures allocated to health stayed between 5 percent and 7 percent.
Figure 5.7. Health expenditures as a share of total regional expenditures, 2001–05
342
545 539444
508
6%
7%6%
5%
6%
0
100
200
300
400
500
600
2001 2002 2003 2004 2005
Rp
(Bln
Rp
)
0%
1%
2%
3%
4%
5%
6%
7%
Source: World Bank staff estimates based on MoF data (constant 2006 prices).
District governments spend more on health than do provincial and central governments. After decentralization, the share of province expenditures in total public health spending decreased when local government health expenditures rose. In 2005 only 15 percent of total public health expenses were contributed by the province, vs. 71 percent from districts and 14 percent from the center. A similar breakdown applies to contributions to routine and development expenditures (Table 5.3).
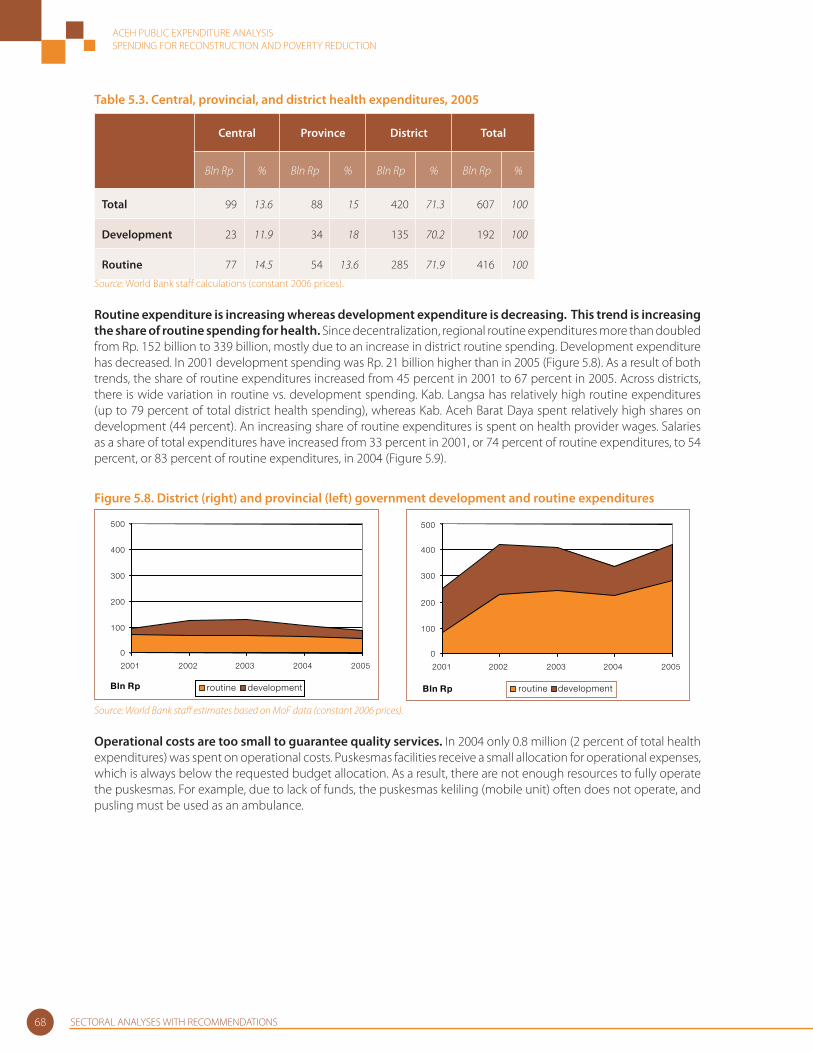
ACEH PUBLIC EXPENDITURE ANALYSISSPENDING FOR RECONSTRUCTION AND POVERTY REDUCTION
SECTORAL ANALYSES WITH RECOMMENDATIONS68
Table 5.3. Central, provincial, and district health expenditures, 2005
Central Province District Total
Bln Rp % Bln Rp % Bln Rp % Bln Rp %
Total 99 13.6 88 15 420 71.3 607 100
Development 23 11.9 34 18 135 70.2 192 100
Routine 77 14.5 54 13.6 285 71.9 416 100
Source: World Bank staff calculations (constant 2006 prices).
Routine expenditure is increasing whereas development expenditure is decreasing. This trend is increasing the share of routine spending for health. Since decentralization, regional routine expenditures more than doubled from Rp. 152 billion to 339 billion, mostly due to an increase in district routine spending. Development expenditure has decreased. In 2001 development spending was Rp. 21 billion higher than in 2005 (Figure 5.8). As a result of both trends, the share of routine expenditures increased from 45 percent in 2001 to 67 percent in 2005. Across districts, there is wide variation in routine vs. development spending. Kab. Langsa has relatively high routine expenditures (up to 79 percent of total district health spending), whereas Kab. Aceh Barat Daya spent relatively high shares on development (44 percent). An increasing share of routine expenditures is spent on health provider wages. Salaries as a share of total expenditures have increased from 33 percent in 2001, or 74 percent of routine expenditures, to 54 percent, or 83 percent of routine expenditures, in 2004 (Figure 5.9).
Figure 5.8. District (right) and provincial (left) government development and routine expenditures
0
100
200
300
400
500
2001 2002 2003 2004 2005
Bln Rp routine development
0
100
200
300
400
500
2001 2002 2003 2004 2005
Bln Rp routine development
Source: World Bank staff estimates based on MoF data (constant 2006 prices).
Operational costs are too small to guarantee quality services. In 2004 only 0.8 million (2 percent of total health expenditures) was spent on operational costs. Puskesmas facilities receive a small allocation for operational expenses, which is always below the requested budget allocation. As a result, there are not enough resources to fully operate the puskesmas. For example, due to lack of funds, the puskesmas keliling (mobile unit) often does not operate, and pusling must be used as an ambulance.
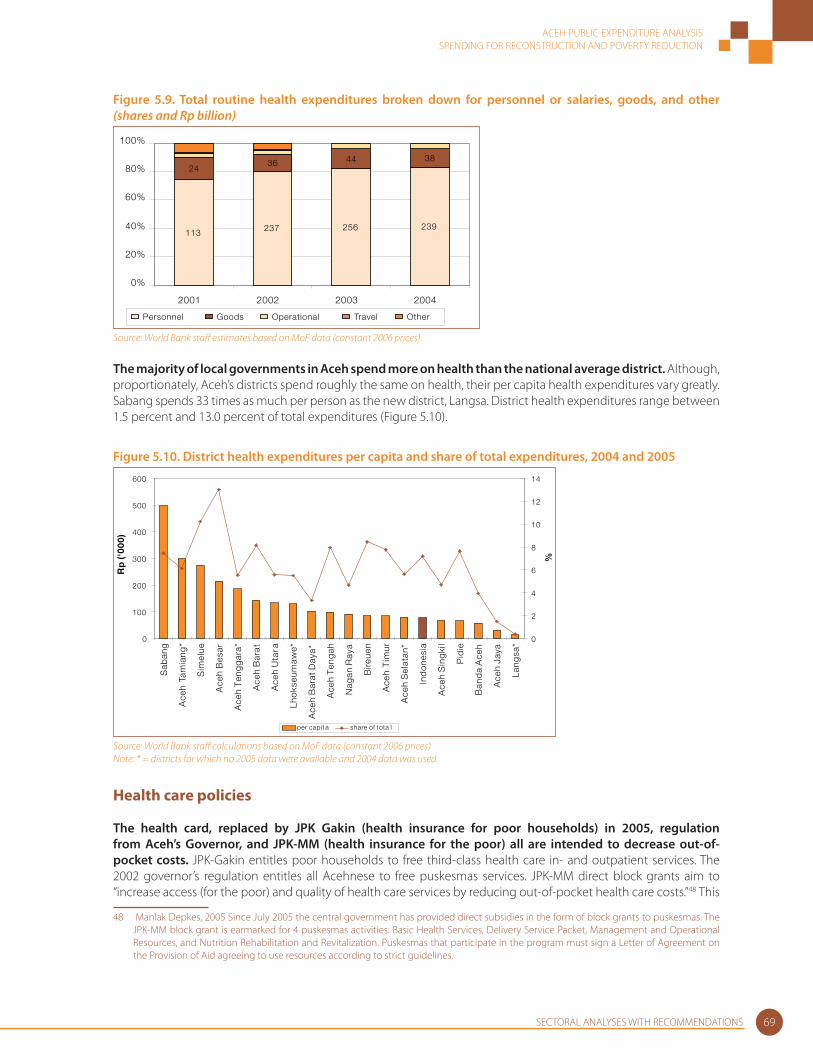
ACEH PUBLIC EXPENDITURE ANALYSISSPENDING FOR RECONSTRUCTION AND POVERTY REDUCTION
SECTORAL ANALYSES WITH RECOMMENDATIONS 69
Figure 5.9. Total routine health expenditures broken down for personnel or salaries, goods, and other (shares and Rp billion)
113 237 256 239
2436 44 38
0%
20%
40%
60%
80%
100%
2001 2002 2003 2004
Personnel Goods Operational Travel Other
Source: World Bank staff estimates based on MoF data (constant 2006 prices).
The majority of local governments in Aceh spend more on health than the national average district. Although, proportionately, Aceh’s districts spend roughly the same on health, their per capita health expenditures vary greatly. Sabang spends 33 times as much per person as the new district, Langsa. District health expenditures range between 1.5 percent and 13.0 percent of total expenditures (Figure 5.10).
Figure 5.10. District health expenditures per capita and share of total expenditures, 2004 and 2005
0
100
200
300
400
500
600
Sab
ang
Ace
h Ta
mia
ng*
Sim
elue
Ace
h B
esar
Ace
h T
eng
gar
a*
Ace
h B
arat
Ace
h U
tara
Lho
kseu
maw
e*
Ace
h B
arat
Day
a*
Ace
h T
eng
ah
Nag
an R
aya
Bire
uen
Ace
h T
imur
Ace
h S
elat
an*
Ind
one
sia
Ace
h S
ing
kil
Pid
ie
Ban
da
Ace
h
Ace
h Ja
ya
Lang
sa*
Rp
('0
00
)
0
2
4
6
8
10
12
14
%
per capit a share of tota l
Source: World Bank staff calculations based on MoF data (constant 2006 prices)Note: * = districts for which no 2005 data were available and 2004 data was used.
Health care policies
The health card, replaced by JPK Gakin (health insurance for poor households) in 2005, regulation from Aceh’s Governor, and JPK-MM (health insurance for the poor) all are intended to decrease out-of-pocket costs. JPK-Gakin entitles poor households to free third-class health care in- and outpatient services. The 2002 governor’s regulation entitles all Acehnese to free puskesmas services. JPK-MM direct block grants aim to “increase access (for the poor) and quality of health care services by reducing out-of-pocket health care costs.”48 This
48 Manlak Depkes, 2005 Since July 2005 the central government has provided direct subsidies in the form of block grants to puskesmas. The JPK-MM block grant is earmarked for 4 puskesmas activities: Basic Health Services, Delivery Service Packet, Management and Operational Resources, and Nutrition Rehabilitation and Revitalization. Puskesmas that participate in the program must sign a Letter of Agreement on the Provision of Aid agreeing to use resources according to strict guidelines.

ACEH PUBLIC EXPENDITURE ANALYSISSPENDING FOR RECONSTRUCTION AND POVERTY REDUCTION
SECTORAL ANALYSES WITH RECOMMENDATIONS70
combination of policies may contribute to the observed relatively low private health care expenditures made by Acehnese households.
The majority of puskesmas do not require puskesmas fees, but not all puskesmas are aware of the regulations. GDS 2 results suggest that 67 percent of the puskesmas patients paid no fees for the services. The remaining 33 percent spent between 1,000 and 400,000 Rp.49 Sixty-nine percent of the puskesmas report not to have any puskesmas fees for outpatient services, whereas the remainder charges between 200 Rp and 6,000 Rp. The lack of compliance with the governor’s regulation may be the result of limited dissemination of the regulation. Eighty percent of the district health bureau heads and almost 40 percent of puskesmas staff are not aware of regulations related to puskesmas tariff s. No additional funding has been provided to puskesmas to compensate for lost income, which has contributed to tight operational budgets. Before 2002, puskesmas were allowed to keep 20 percent of the collected service fees, which could be used for staff incentives and operational funds. The total revenue collected by fees varies by use: an “average” puskesmas with 350 patients per week and a fee of Rp. 1,500 would receive a yearly income through retribution of 5.2 million Rp. Lack of compensation on average could have contributed to a 10 percent loss of puskesmas income.
Block grant disbursement delays grants have aff ected service delivery. Puskesmas report major delays in the disbursement of the JPK-MM block grant. Not all puskesmas can prepay the services and, as a result, interruption in the provision of services has been reported. Once funds have fi nally arrived in puskesmas accounts, the funds remain unspent since rules are not clear about the reimbursement of puskesmas expenses. Other entitlements such as the free provision of midwifery are already paid by the patients and can thus not easily be returned. Puskesmas heads do not have the authority to reallocate funds so they remain unspent until further news from the district health bureau. Central block grants are a step back from decentralization because they supercede district authorities. Since decentralization, district governments have been responsible to maintain the public health sector. The block grant program from the central government overrules district authorities, and so contradicts the objective of decentralization. Direct block grants to maintain minimum levels of health services while enhancing local government capacity may have been the result of the central government’s realization that local governments were not able to provide minimum services. This, however, does not seem to be the intention of JPK-MM (nor BOS, the education sector equivalent). No institutional capacity enhancement programs for local government that signal this intention are in place.
Recommendations
1. Three priority areas to improve health service delivery are (1) streamlining the health information system, (2) improving expenditure allocations to maintenance and operations, and (3) assessing the human resource capacity of local government health bureau staff . Public health expenditure as a share of total expenditure is relatively low in Aceh, but per capita health care expenditure is relatively high. Relative to other districts in Indonesia, district spending on health, which contributes 71 percent of health expenditures, is low. Private contributions from households make up a large share of total health expenditures. The public resources earmarked for health and the funds provided by the reconstruction eff ort provide an opportunity to signifi cantly improve the health care system in Aceh.
2. Whereas the current focus is on the quantity of facilities and health providers, the focus should be improving the quality of services. The spending mix should be improved to address absenteeism, low incentives to work in rural areas, as well as the bad condition and lack of operational funds of many facitities. The increasing number of districts and villages has led to a false demand for health facilities. Attention should be moved from the current focus on building new facilities. Maintenance has been neglected, and operational expenditures are sometimes too small to be of use. Services would benefi t from higher maintenance and operational expenditures.
49 High costs are incurred when inpatient services are required.
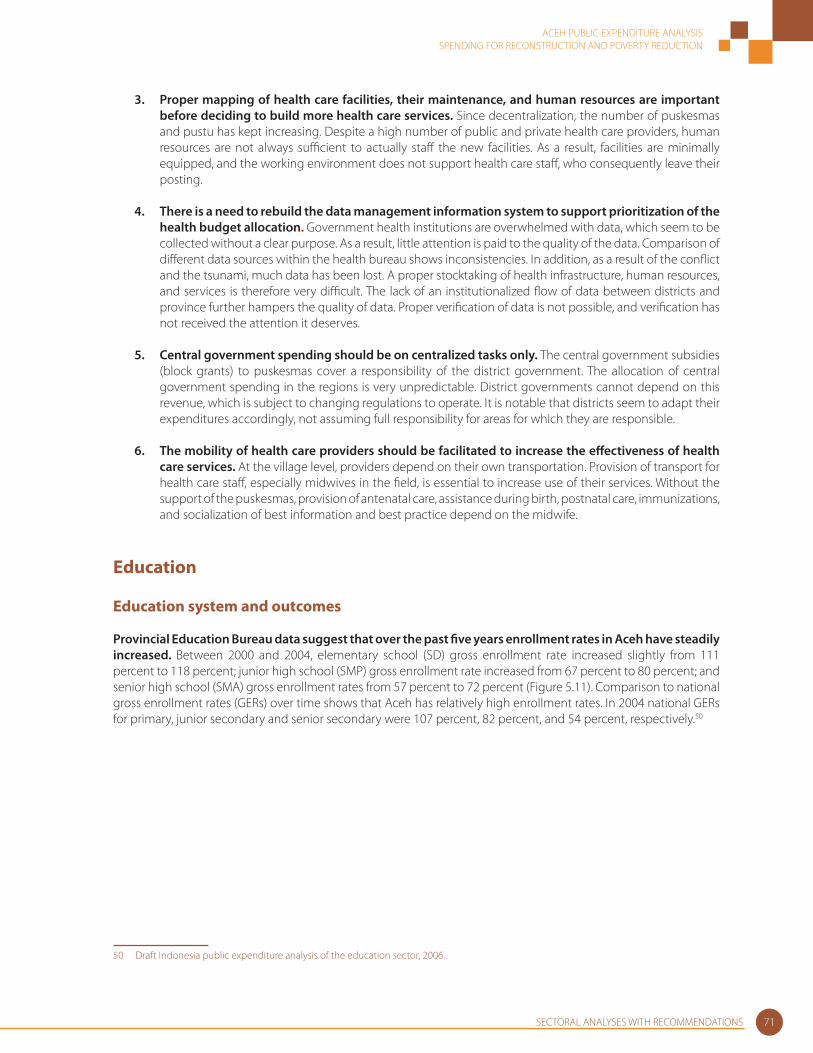
ACEH PUBLIC EXPENDITURE ANALYSISSPENDING FOR RECONSTRUCTION AND POVERTY REDUCTION
SECTORAL ANALYSES WITH RECOMMENDATIONS 71
3. Proper mapping of health care facilities, their maintenance, and human resources are important before deciding to build more health care services. Since decentralization, the number of puskesmas and pustu has kept increasing. Despite a high number of public and private health care providers, human resources are not always suffi cient to actually staff the new facilities. As a result, facilities are minimally equipped, and the working environment does not support health care staff , who consequently leave their posting.
4. There is a need to rebuild the data management information system to support prioritization of the health budget allocation. Government health institutions are overwhelmed with data, which seem to be collected without a clear purpose. As a result, little attention is paid to the quality of the data. Comparison of diff erent data sources within the health bureau shows inconsistencies. In addition, as a result of the confl ict and the tsunami, much data has been lost. A proper stocktaking of health infrastructure, human resources, and services is therefore very diffi cult. The lack of an institutionalized fl ow of data between districts and province further hampers the quality of data. Proper verifi cation of data is not possible, and verifi cation has not received the attention it deserves.
5. Central government spending should be on centralized tasks only. The central government subsidies (block grants) to puskesmas cover a responsibility of the district government. The allocation of central government spending in the regions is very unpredictable. District governments cannot depend on this revenue, which is subject to changing regulations to operate. It is notable that districts seem to adapt their expenditures accordingly, not assuming full responsibility for areas for which they are responsible.
6. The mobility of health care providers should be facilitated to increase the eff ectiveness of health care services. At the village level, providers depend on their own transportation. Provision of transport for health care staff , especially midwives in the fi eld, is essential to increase use of their services. Without the support of the puskesmas, provision of antenatal care, assistance during birth, postnatal care, immunizations, and socialization of best information and best practice depend on the midwife.
Education
Education system and outcomes
Provincial Education Bureau data suggest that over the past fi ve years enrollment rates in Aceh have steadily increased. Between 2000 and 2004, elementary school (SD) gross enrollment rate increased slightly from 111 percent to 118 percent; junior high school (SMP) gross enrollment rate increased from 67 percent to 80 percent; and senior high school (SMA) gross enrollment rates from 57 percent to 72 percent (Figure 5.11). Comparison to national gross enrollment rates (GERs) over time shows that Aceh has relatively high enrollment rates. In 2004 national GERs for primary, junior secondary and senior secondary were 107 percent, 82 percent, and 54 percent, respectively.50
50 Draft Indonesia public expenditure analysis of the education sector, 2006.
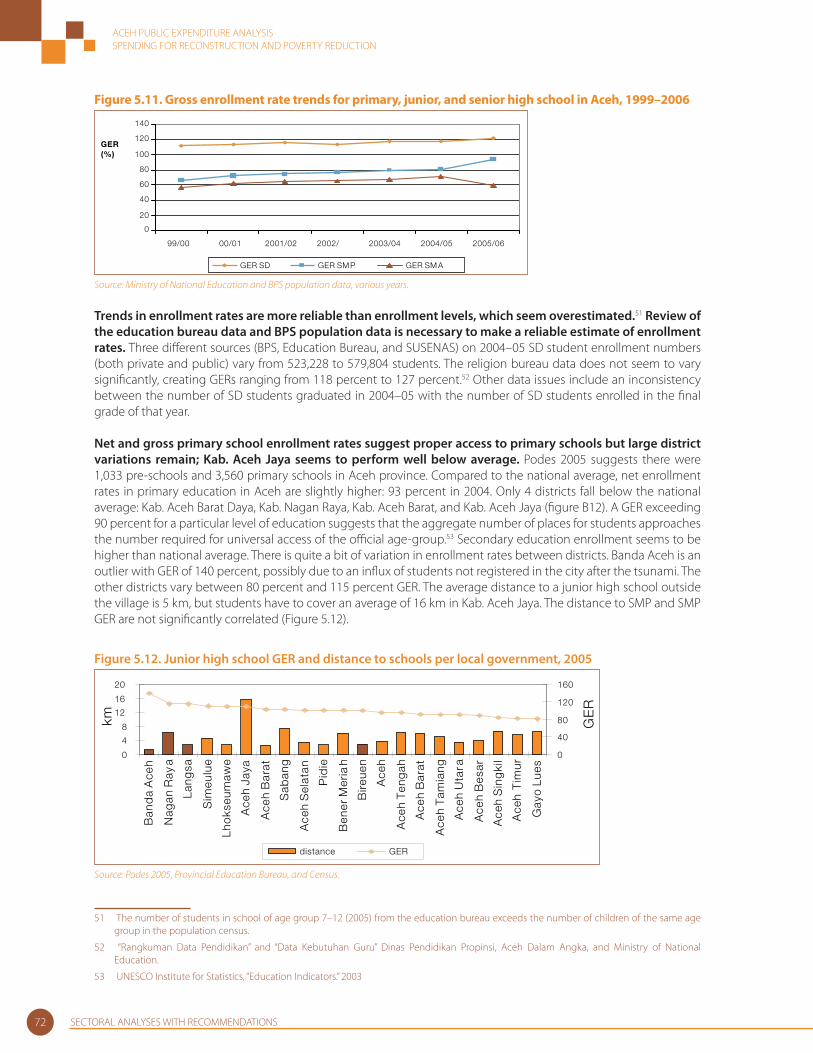
ACEH PUBLIC EXPENDITURE ANALYSISSPENDING FOR RECONSTRUCTION AND POVERTY REDUCTION
SECTORAL ANALYSES WITH RECOMMENDATIONS72
Figure 5.11. Gross enrollment rate trends for primary, junior, and senior high school in Aceh, 1999–2006
0
20
40
60
80
100
120
140
99/00 00/01 2001/02 2002/ 2003/04 2004/05 2005/06
GER (%)
GER SD GER SM P GER SM A
Source: Ministry of National Education and BPS population data, various years.
Trends in enrollment rates are more reliable than enrollment levels, which seem overestimated.51 Review of the education bureau data and BPS population data is necessary to make a reliable estimate of enrollment rates. Three diff erent sources (BPS, Education Bureau, and SUSENAS) on 2004–05 SD student enrollment numbers (both private and public) vary from 523,228 to 579,804 students. The religion bureau data does not seem to vary signifi cantly, creating GERs ranging from 118 percent to 127 percent.52 Other data issues include an inconsistency between the number of SD students graduated in 2004–05 with the number of SD students enrolled in the fi nal grade of that year.
Net and gross primary school enrollment rates suggest proper access to primary schools but large district variations remain; Kab. Aceh Jaya seems to perform well below average. Podes 2005 suggests there were 1,033 pre-schools and 3,560 primary schools in Aceh province. Compared to the national average, net enrollment rates in primary education in Aceh are slightly higher: 93 percent in 2004. Only 4 districts fall below the national average: Kab. Aceh Barat Daya, Kab. Nagan Raya, Kab. Aceh Barat, and Kab. Aceh Jaya (fi gure B12). A GER exceeding 90 percent for a particular level of education suggests that the aggregate number of places for students approaches the number required for universal access of the offi cial age-group.53 Secondary education enrollment seems to be higher than national average. There is quite a bit of variation in enrollment rates between districts. Banda Aceh is an outlier with GER of 140 percent, possibly due to an infl ux of students not registered in the city after the tsunami. The other districts vary between 80 percent and 115 percent GER. The average distance to a junior high school outside the village is 5 km, but students have to cover an average of 16 km in Kab. Aceh Jaya. The distance to SMP and SMP GER are not signifi cantly correlated (Figure 5.12).
Figure 5.12. Junior high school GER and distance to schools per local government, 2005
0
4
8
12
16
20
Ban
da
Ace
h
Nag
an R
aya
Lang
sa
Sim
eulu
e
Lho
kseu
maw
e
Ace
h Ja
ya
Ace
h B
arat
Sab
ang
Ace
h S
elat
an
Pid
ie
Ben
er M
eria
h
Bir e
uen
Ace
h
Ace
h T
eng
ah
Ace
h B
arat
Ace
h T
amia
ng
Ace
h U
tara
Ace
h B
esar
Ace
h S
ing
kil
Ace
h T
imur
Gay
o Lu
es
km
0
40
80
120
160
GE
R
distance GER
Source: Podes 2005, Provincial Education Bureau, and Census.
51 The number of students in school of age group 7–12 (2005) from the education bureau exceeds the number of children of the same age group in the population census.
52 “Rangkuman Data Pendidikan” and “Data Kebutuhan Guru” Dinas Pendidikan Propinsi, Aceh Dalam Angka, and Ministry of National Education.
53 UNESCO Institute for Statistics, “Education Indicators.” 2003

ACEH PUBLIC EXPENDITURE ANALYSISSPENDING FOR RECONSTRUCTION AND POVERTY REDUCTION
SECTORAL ANALYSES WITH RECOMMENDATIONS 73
Public schools are generally preferred because of lower costs, better equipment, and higher quality. However, some public schools have limited enrollment. Fewer than 10 percent of the students go to private schools (Figure 5.13). Public and private schools have the same curriculum, teaching hours, and national test requirements. Private schools are in demand where public schools are not available, where public schools have maximum enrollment levels, and where there are households who can aff ord expensive, better quality education. SMA Anak Bangsa Banda Aceh and SMA Yapena Lhokseumawe are examples of better quality private education. High fees enable hiring quality teachers, and buying good books and quality equipment.
Figure 5.13. Number of students per education level, public vs. private, 2004–05
0 100 200 300 400 500 600
primary school
junior highschool
senior highschool
students ('000)
public
private
Source: Dinas Pendidikan Propinsi.
The new education law No. 19/2005 requires teachers to have a bachelor’s degree, but throughout Aceh only 37 percent of teachers fulfi ll this requirement.54 At primary school level, between 13 percent and 28 percent of teachers fulfi ll this requirement (Table 5.4). Teacher qualifi cations in Aceh are lower than the national average: 55 percent and 73 percent of teachers have the minimum qualifi cations required for primary and junior secondary levels, respectively.55 Teachers at religious schools on average have higher degrees than teachers at nonreligious schools. Although teachers at religious schools have higher levels of educational attainment (58 percent–75 percent vs. 50 percent), Provincial Education Bureau data suggest that student performance on the national tests is similar. Junior high school teachers are more qualifi ed than elementary school teachers. The highest qualifi cations are found at the senior high school level.
Table 5.4. Teacher qualifi cations in Aceh province, 2005–06 (%)
SD MI SMP MTs SMA/MA
Public Private Public Private Public Private Public PrivatePublic + private
D1 44 50 26 34 13 16 5 13 2
D2 37 26 43 26 9 6 3 4 1
D3 6 8 6 12 32 27 19 26 19
Bachelors degree or higher 13 15 25 28 46 51 73 58 77
Total 100 100 100 100 100 100 100 100 100 Source: Provincial Education Bureau NAD.
Teacher absenteeism is relatively high. The GDS, which included 72 teachers in Aceh Utara, Aceh Besar, and Aceh Barat, suggests that 30 percent of the teachers were absent during school time, engaged in tasks outside school, sick, or attending to private business. A study that included 147 schools in Indonesia found that 19 percent of the teachers were absent.56 Quality teaching is further hindered by the poor condition of school buildings. Almost one-quarter (23 percent) of elementary classrooms are classifi ed as heavily damaged and require complete reconstruction. Only 44 percent of elementary classrooms in Aceh are considered in good condition, whereas 33
54 Provincial Education Bureau, NAD.
55 Ministry of National Education, Indonesia: Educational Statistics in Brief 2004/2005.
56 SMERU 2004.
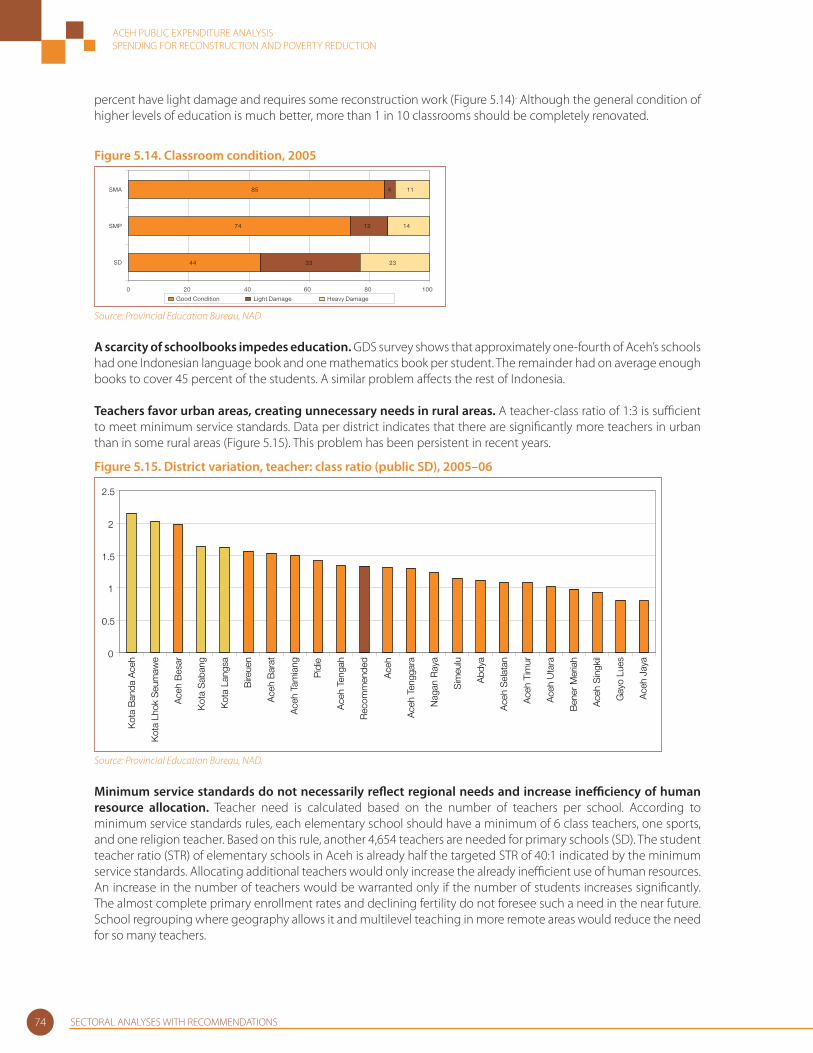
ACEH PUBLIC EXPENDITURE ANALYSISSPENDING FOR RECONSTRUCTION AND POVERTY REDUCTION
SECTORAL ANALYSES WITH RECOMMENDATIONS74
percent have light damage and requires some reconstruction work (Figure 5.14). Although the general condition of higher levels of education is much better, more than 1 in 10 classrooms should be completely renovated.
Figure 5.14. Classroom condition, 2005
44
74
85
33
12
4
23
14
11
0 20 40 60 80 100
SD
SMP
SMA
Good Condition Light Damage Heavy Damage
Source: Provincial Education Bureau, NAD.
A scarcity of schoolbooks impedes education. GDS survey shows that approximately one-fourth of Aceh’s schools had one Indonesian language book and one mathematics book per student. The remainder had on average enough books to cover 45 percent of the students. A similar problem aff ects the rest of Indonesia.
Teachers favor urban areas, creating unnecessary needs in rural areas. A teacher-class ratio of 1:3 is suffi cient to meet minimum service standards. Data per district indicates that there are signifi cantly more teachers in urban than in some rural areas (Figure 5.15). This problem has been persistent in recent years.
Figure 5.15. District variation, teacher: class ratio (public SD), 2005–06
0
0.5
1
1.5
2
2.5
Kot
a B
anda
Ace
h
Kot
a Lh
ok S
eum
awe
Ace
h B
esar
Kot
a S
aban
g
Kot
a La
ngsa
Bire
uen
Ace
h B
arat
Ace
h Ta
mia
ng
Pid
ie
Ace
h Te
ngah
Rec
omm
ende
d
Ace
h
Ace
h Te
ngga
ra
Nag
an R
aya
Sim
eulu
Abd
ya
Ace
h S
elat
an
Ace
h Ti
mur
Ace
h U
tara
Ben
er M
eria
h
Ace
h S
ingk
il
Gay
o Lu
es
Ace
h Ja
ya
Source: Provincial Education Bureau, NAD.
Minimum service standards do not necessarily refl ect regional needs and increase ineffi ciency of human resource allocation. Teacher need is calculated based on the number of teachers per school. According to minimum service standards rules, each elementary school should have a minimum of 6 class teachers, one sports, and one religion teacher. Based on this rule, another 4,654 teachers are needed for primary schools (SD). The student teacher ratio (STR) of elementary schools in Aceh is already half the targeted STR of 40:1 indicated by the minimum service standards. Allocating additional teachers would only increase the already ineffi cient use of human resources. An increase in the number of teachers would be warranted only if the number of students increases signifi cantly. The almost complete primary enrollment rates and declining fertility do not foresee such a need in the near future. School regrouping where geography allows it and multilevel teaching in more remote areas would reduce the need for so many teachers.

ACEH PUBLIC EXPENDITURE ANALYSISSPENDING FOR RECONSTRUCTION AND POVERTY REDUCTION
SECTORAL ANALYSES WITH RECOMMENDATIONS 75
Impact of the confl ict and tsunami on the education system and outcomes
The long-running confl ict has infl icted major damage on education infrastructure. Loss of human resources, temporary drop-out of students, and delays in policy implementation are all major setbacks for education services. Between August 1998 and August 2001, 369 school buildings were torched, of which 70 percent were primary schools. Even worse was the period of martial law, which began in 2003 (Table 5.5).
Table 5.5. Number of schools destroyed per district, August 1998–June 2003
District
August 1998–August 2001 Period Martial Law, 19 May–18 June 2003 Period
SD SMPSMA and
SMKSD SMP
SMA and SMK
Total
Pidie 28 15 6 219 29 4 301
Bireuen 7 1 1 119 11 5 144
North Aceh 66 26 14 3 1 1 111
East Aceh 17 5 4 37 8 7 78
Central Aceh 36 5 1 0 0 0 42
West Aceh 13 9 3 6 2 0 33
Aceh Selatan 65 18 6 0 0 0 89
Other districts 11 8 4 41 14 3 81
Total 243 87 39 425 65 20 879Source: Bappeda and NAD Department of Education.
Many children displaced to confl ict IDP camps quit school, at least temporarily. According to the NAD Department of Education, in 2003 the number of IDPs reached approximately 41,000, including 16,352 students (approximately one percent of the students). The education process was interrupted, and many students of primary and secondary schools failed to take school fi nal examinations.57 Teachers were also victims, and many of them moved to urban areas. The government showed commitment to provide temporary tents and rebuild damaged schools. In 2003 a Rp. 40 billion (approximately US$4.4 million) budget was allocated for reconstruction and other humanitarian assistance. Within the already approved 30 percent education fund budget, expenditures were adjusted to shift from nonphysical expenses to emergency education infrastructure development.
The earthquake and tsunami of December 26, 2004 took the lives of almost 2,500 teachers and tens of thousands of students. More than 2,000 schools were reported severely damaged or destroyed. However, many schools were already in bad condition due to confl ict or lack of maintenance. For example, in Kab. Bireuen, only 25 percent of the damage was due to the tsunami or earthquake. Reconstruction is on its way. Teachers have been recruited to replace the casualties, but the majority of damaged schools still need to be rebuilt. By April 2006, 2,400 of 2,500 perished teachers had been replaced. Two hundred and sixty schools had been rebuilt, and another 104 schools are in progress. Approximately 1,500 schools will still require rehabilitation after the tsunami pledges have been achieved. Unfortunately, coordination was lacking in the reconstruction eff orts. The results are overlapping reconstruction in urban areas and large gaps in rural areas.
The tsunami temporarily disturbed education, but most children ultimately went back to school. According to the October 2005 population census in Aceh, 95 percent of children aged 7–12 are attending school, which is not diff erent from the pre-tsunami enrollment levels. Impact of the tsunami on the continuance of education and passing rate of students can be made only after data issues mentioned in the beginning of this chapter have been resolved.
57 Serambi Indonesia, 26 May 2003.

ACEH PUBLIC EXPENDITURE ANALYSISSPENDING FOR RECONSTRUCTION AND POVERTY REDUCTION
SECTORAL ANALYSES WITH RECOMMENDATIONS76
Young children aged 0-4 were disproportionately casualties to the tsunami, which will cause a shift in student distribution. A basic comparison of the population census of 2005 with the population projection of 2005 indicates a 7 percent reduction in the number of children in the age group of 0–4 years, and a 3 percent reduction in the age group of 5–9 years. This means that approximately 40,000 pupils fewer than initially planned will go to primary education during the next four years. Comparison of new student enrollment numbers with projections from before the tsunami shows the decline in enrollment; 114,410 new students vs. the predicted 126,510.58 Thus, decreasing class sizes initially for SD and later for SMP need to be expected. The generous amount of funds allocated to the education sector after the tsunami can be used for programs to improve the quality of teaching and leave a legacy of better quality education in Aceh.
Spending on Education vs. Quality of Education and Education Outcomes
Education expenditures in Aceh include those by central government (APBN), regional governments (APBD I + II), and private households. In 2005 they totaled Rp. 8 trillion. Public education expenditures, if not defi ned diff erently, include expenses by the religious and culture bureaus. Local governments are the biggest spenders with approximately Rp. 1.2 trillion or 46 percent of total expenses. They are followed by Rp. 655 billion of central spending (APBN and BOS contribute to 24 percent of spending). Private contributions from households should not be neglected; they contributed Rp. 340 billion to total education spending (Figure 5.16).
Figure 5.16. Composition of education expenditures in Aceh, 2005 (%)
21
3
13
1746
APBN
BOS
APBD (P rov)
APBD (LG)
Private household expenditu res (2004)
Source: SIKD MoF, BOS MoNE, and SUSENAS 2004.
Private expenditures contribute signifi cantly to total education expenditures. Extrapolating adjusted 2004 SUSENAS to 2005 suggests that private contributions to education add another Rp. 340 billion to education spending. Analysis of the Governance and Decentralization Survey data shows that private spending for junior and senior high school goes primarily to books, writing materials, and transport when necessary, whereas enrollment and monthly fees seem to take a smaller share of spending.
Aceh has the second highest per capita education expenditures of all provinces in Indonesia. Together with Papua, Aceh province spends signifi cantly more on education relative to its population than all other provinces in Indonesia. A per capita spending of Rp. 457,000 is more than twice the national average of Rp. 198,000 (Figure 5.17).
58 Provincial Education Bureau, 2005.
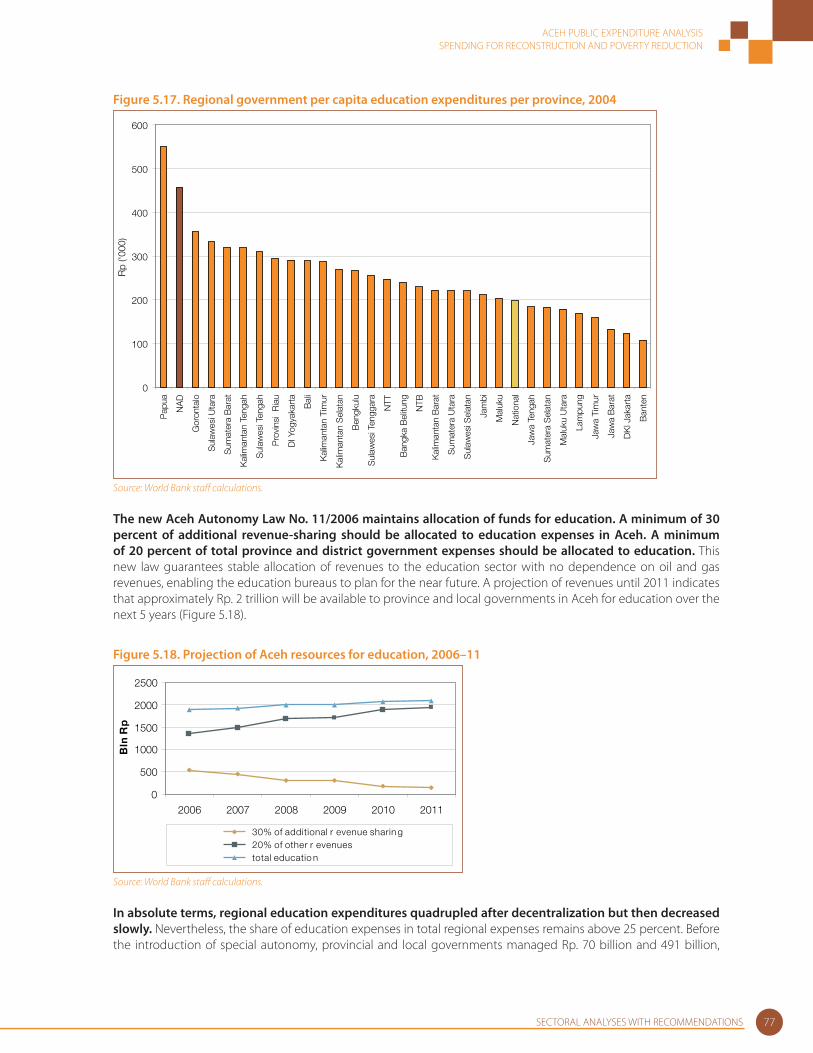
ACEH PUBLIC EXPENDITURE ANALYSISSPENDING FOR RECONSTRUCTION AND POVERTY REDUCTION
SECTORAL ANALYSES WITH RECOMMENDATIONS 77
Figure 5.17. Regional government per capita education expenditures per province, 2004
0
100
200
300
400
500
600
Pap
ua
NA
D
Gor
onta
lo
Sul
awes
i Uta
ra
Sum
ater
a B
arat
Kal
iman
tan
Teng
ah
Sul
awes
i Ten
gah
Pro
vins
i R
iau
DI Y
ogya
kart
a
Bal
i
Kal
iman
tan
Tim
ur
Kal
iman
tan
Sel
atan
Ben
gkul
u
Sul
awes
i Ten
ggar
a
NTT
Ban
gka
Bel
itung
NTB
Kal
iman
tan
Bar
at
Sum
ater
a U
tara
Sul
awes
i Sel
atan
Jam
bi
Mal
uku
Nat
iona
l
Jaw
a Te
ngah
Sum
ater
a S
elat
an
Mal
uku
Uta
ra
Lam
pung
Jaw
a Ti
mur
Jaw
a B
arat
DK
I Jak
arta
Ban
ten
Rp
('000
)
Source: World Bank staff calculations.
The new Aceh Autonomy Law No. 11/2006 maintains allocation of funds for education. A minimum of 30 percent of additional revenue-sharing should be allocated to education expenses in Aceh. A minimum of 20 percent of total province and district government expenses should be allocated to education. This new law guarantees stable allocation of revenues to the education sector with no dependence on oil and gas revenues, enabling the education bureaus to plan for the near future. A projection of revenues until 2011 indicates that approximately Rp. 2 trillion will be available to province and local governments in Aceh for education over the next 5 years (Figure 5.18).
Figure 5.18. Projection of Aceh resources for education, 2006–11
0
500
1000
1500
2000
2500
2006 2007 2008 2009 2010 2011
Bln
Rp
30% of additional r evenue sharin g20% of other r evenuestotal educatio n
Source: World Bank staff calculations.
In absolute terms, regional education expenditures quadrupled after decentralization but then decreased slowly. Nevertheless, the share of education expenses in total regional expenses remains above 25 percent. Before the introduction of special autonomy, provincial and local governments managed Rp. 70 billion and 491 billion,
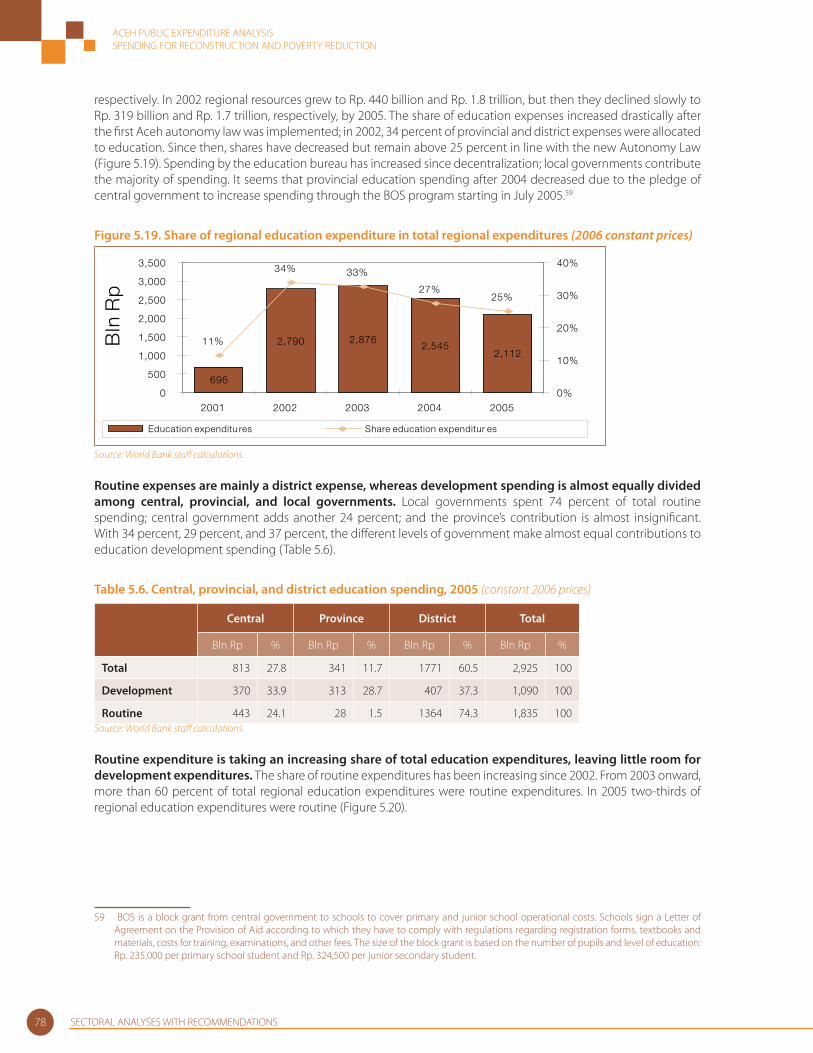
ACEH PUBLIC EXPENDITURE ANALYSISSPENDING FOR RECONSTRUCTION AND POVERTY REDUCTION
SECTORAL ANALYSES WITH RECOMMENDATIONS78
respectively. In 2002 regional resources grew to Rp. 440 billion and Rp. 1.8 trillion, but then they declined slowly to Rp. 319 billion and Rp. 1.7 trillion, respectively, by 2005. The share of education expenses increased drastically after the fi rst Aceh autonomy law was implemented; in 2002, 34 percent of provincial and district expenses were allocated to education. Since then, shares have decreased but remain above 25 percent in line with the new Autonomy Law (Figure 5.19). Spending by the education bureau has increased since decentralization; local governments contribute the majority of spending. It seems that provincial education spending after 2004 decreased due to the pledge of central government to increase spending through the BOS program starting in July 2005.59
Figure 5.19. Share of regional education expenditure in total regional expenditures (2006 constant prices)
696
2,790 2,8762,545
2,11211%
34% 33%
27%25%
0
500
1,000
1,500
2,000
2,500
3,000
3,500
2001 2002 2003 2004 2005
Bln
Rp
0%
10%
20%
30%
40%
Education expenditu res Share education expenditur es
Source: World Bank staff calculations.
Routine expenses are mainly a district expense, whereas development spending is almost equally divided among central, provincial, and local governments. Local governments spent 74 percent of total routine spending; central government adds another 24 percent; and the province’s contribution is almost insignifi cant. With 34 percent, 29 percent, and 37 percent, the diff erent levels of government make almost equal contributions to education development spending (Table 5.6).
Table 5.6. Central, provincial, and district education spending, 2005 (constant 2006 prices)
Central Province District Total
Bln Rp % Bln Rp % Bln Rp % Bln Rp %
Total 813 27.8 341 11.7 1771 60.5 2,925 100
Development 370 33.9 313 28.7 407 37.3 1,090 100
Routine 443 24.1 28 1.5 1364 74.3 1,835 100Source: World Bank staff calculations.
Routine expenditure is taking an increasing share of total education expenditures, leaving little room for development expenditures. The share of routine expenditures has been increasing since 2002. From 2003 onward, more than 60 percent of total regional education expenditures were routine expenditures. In 2005 two-thirds of regional education expenditures were routine (Figure 5.20).
59 BOS is a block grant from central government to schools to cover primary and junior school operational costs. Schools sign a Letter of Agreement on the Provision of Aid according to which they have to comply with regulations regarding registration forms, textbooks and materials, costs for training, examinations, and other fees. The size of the block grant is based on the number of pupils and level of education: Rp. 235,000 per primary school student and Rp. 324,500 per junior secondary student.
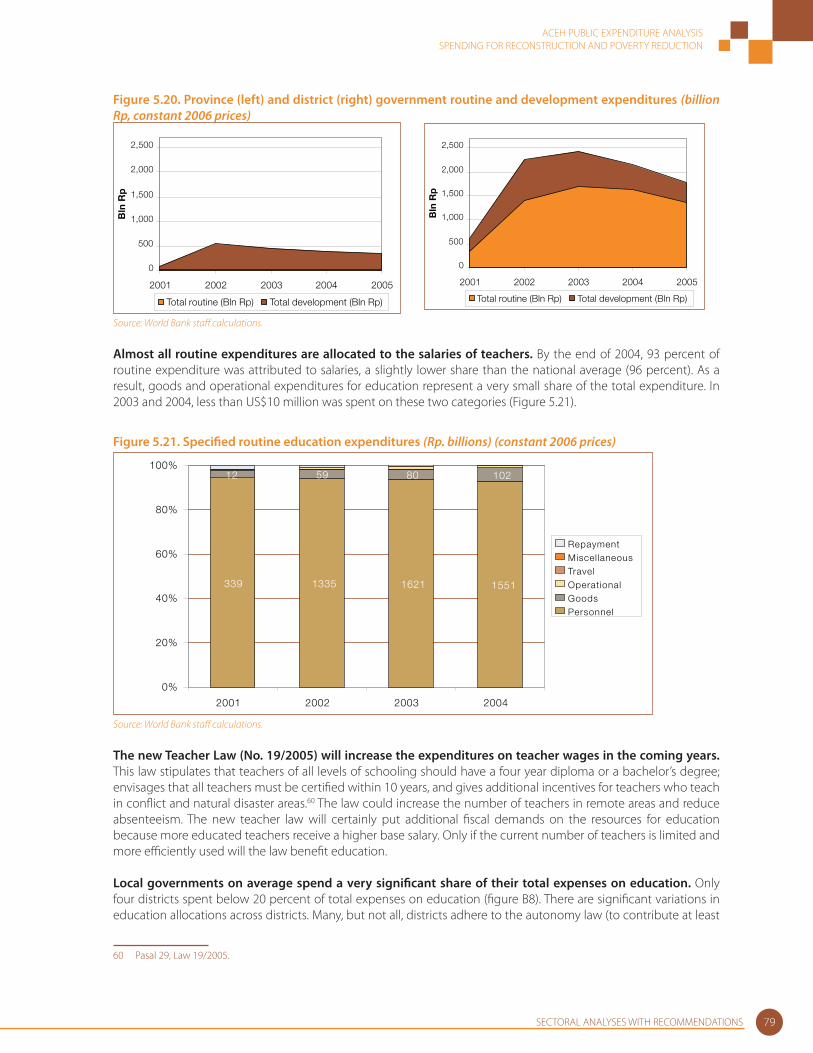
ACEH PUBLIC EXPENDITURE ANALYSISSPENDING FOR RECONSTRUCTION AND POVERTY REDUCTION
SECTORAL ANALYSES WITH RECOMMENDATIONS 79
Figure 5.20. Province (left) and district (right) government routine and development expenditures (billion Rp, constant 2006 prices)
0
500
1,000
1,500
2,000
2,500
2001 2002 2003 2004 2005
Bln
Rp
Total routine (Bln Rp) Total development (Bln Rp)
0
500
1,000
1,500
2,000
2,500
2001 2002 2003 2004 2005
Bln
Rp
Total routine (Bln Rp) Total development (Bln Rp)
Source: World Bank staff calculations.
Almost all routine expenditures are allocated to the salaries of teachers. By the end of 2004, 93 percent of routine expenditure was attributed to salaries, a slightly lower share than the national average (96 percent). As a result, goods and operational expenditures for education represent a very small share of the total expenditure. In 2003 and 2004, less than US$10 million was spent on these two categories (Figure 5.21).
Figure 5.21. Specifi ed routine education expenditures (Rp. billions) (constant 2006 prices)
339 1335 1621 1551
12 59 80 102
0%
20%
40%
60%
80%
100%
2001 2002 2003 2004
RepaymentMiscellaneousTravelOperationalGoodsPersonnel
Source: World Bank staff calculations.
The new Teacher Law (No. 19/2005) will increase the expenditures on teacher wages in the coming years. This law stipulates that teachers of all levels of schooling should have a four year diploma or a bachelor’s degree; envisages that all teachers must be certifi ed within 10 years, and gives additional incentives for teachers who teach in confl ict and natural disaster areas.60 The law could increase the number of teachers in remote areas and reduce absenteeism. The new teacher law will certainly put additional fi scal demands on the resources for education because more educated teachers receive a higher base salary. Only if the current number of teachers is limited and more effi ciently used will the law benefi t education. Local governments on average spend a very signifi cant share of their total expenses on education. Only four districts spent below 20 percent of total expenses on education (fi gure B8). There are signifi cant variations in education allocations across districts. Many, but not all, districts adhere to the autonomy law (to contribute at least
60 Pasal 29, Law 19/2005.
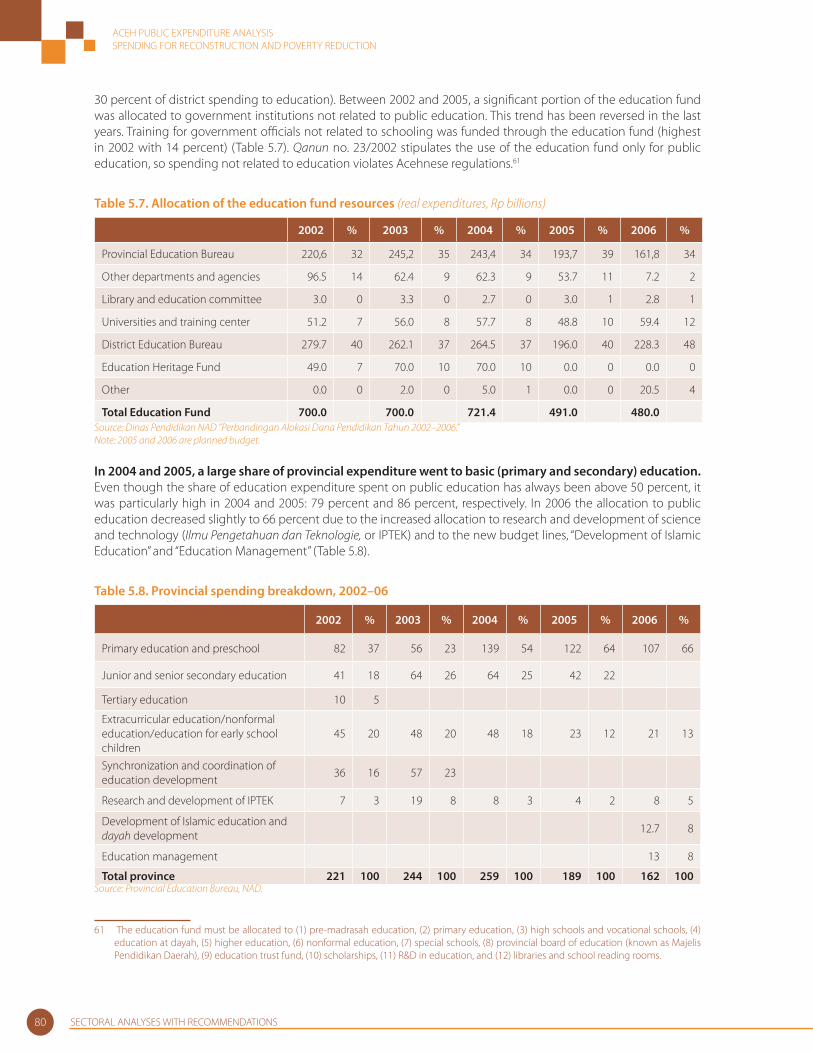
ACEH PUBLIC EXPENDITURE ANALYSISSPENDING FOR RECONSTRUCTION AND POVERTY REDUCTION
SECTORAL ANALYSES WITH RECOMMENDATIONS80
30 percent of district spending to education). Between 2002 and 2005, a signifi cant portion of the education fund was allocated to government institutions not related to public education. This trend has been reversed in the last years. Training for government offi cials not related to schooling was funded through the education fund (highest in 2002 with 14 percent) (Table 5.7). Qanun no. 23/2002 stipulates the use of the education fund only for public education, so spending not related to education violates Acehnese regulations.61
Table 5.7. Allocation of the education fund resources (real expenditures, Rp billions)
2002 % 2003 % 2004 % 2005 % 2006 %
Provincial Education Bureau 220,6 32 245,2 35 243,4 34 193,7 39 161,8 34
Other departments and agencies 96.5 14 62.4 9 62.3 9 53.7 11 7.2 2
Library and education committee 3.0 0 3.3 0 2.7 0 3.0 1 2.8 1
Universities and training center 51.2 7 56.0 8 57.7 8 48.8 10 59.4 12
District Education Bureau 279.7 40 262.1 37 264.5 37 196.0 40 228.3 48
Education Heritage Fund 49.0 7 70.0 10 70.0 10 0.0 0 0.0 0
Other 0.0 0 2.0 0 5.0 1 0.0 0 20.5 4
Total Education Fund 700.0 700.0 721.4 491.0 480.0Source: Dinas Pendidikan NAD ”Perbandingan Alokasi Dana Pendidikan Tahun 2002–2006.” Note: 2005 and 2006 are planned budget.
In 2004 and 2005, a large share of provincial expenditure went to basic (primary and secondary) education. Even though the share of education expenditure spent on public education has always been above 50 percent, it was particularly high in 2004 and 2005: 79 percent and 86 percent, respectively. In 2006 the allocation to public education decreased slightly to 66 percent due to the increased allocation to research and development of science and technology (Ilmu Pengetahuan dan Teknologie, or IPTEK) and to the new budget lines, “Development of Islamic Education” and “Education Management” (Table 5.8).
Table 5.8. Provincial spending breakdown, 2002–06
2002 % 2003 % 2004 % 2005 % 2006 %
Primary education and preschool 82 37 56 23 139 54 122 64 107 66
Junior and senior secondary education 41 18 64 26 64 25 42 22
Tertiary education 10 5
Extracurricular education/nonformal education/education for early school children
45 20 48 20 48 18 23 12 21 13
Synchronization and coordination of education development
36 16 57 23
Research and development of IPTEK 7 3 19 8 8 3 4 2 8 5
Development of Islamic education and dayah development
12.7 8
Education management 13 8
Total province 221 100 244 100 259 100 189 100 162 100Source: Provincial Education Bureau, NAD.
61 The education fund must be allocated to (1) pre-madrasah education, (2) primary education, (3) high schools and vocational schools, (4) education at dayah, (5) higher education, (6) nonformal education, (7) special schools, (8) provincial board of education (known as Majelis Pendidikan Daerah), (9) education trust fund, (10) scholarships, (11) R&D in education, and (12) libraries and school reading rooms.
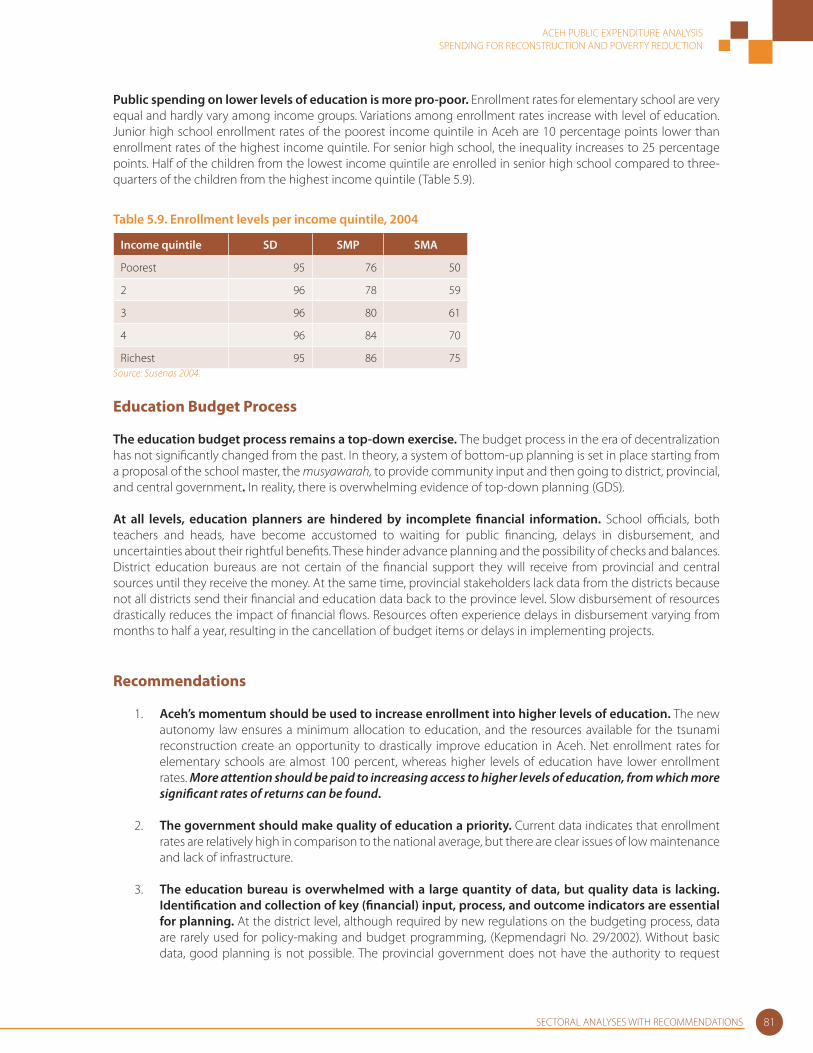
ACEH PUBLIC EXPENDITURE ANALYSISSPENDING FOR RECONSTRUCTION AND POVERTY REDUCTION
SECTORAL ANALYSES WITH RECOMMENDATIONS 81
Public spending on lower levels of education is more pro-poor. Enrollment rates for elementary school are very equal and hardly vary among income groups. Variations among enrollment rates increase with level of education. Junior high school enrollment rates of the poorest income quintile in Aceh are 10 percentage points lower than enrollment rates of the highest income quintile. For senior high school, the inequality increases to 25 percentage points. Half of the children from the lowest income quintile are enrolled in senior high school compared to three-quarters of the children from the highest income quintile (Table 5.9).
Table 5.9. Enrollment levels per income quintile, 2004
Income quintile SD SMP SMA
Poorest 95 76 50
2 96 78 59
3 96 80 61
4 96 84 70
Richest 95 86 75 Source: Susenas 2004.
Education Budget Process
The education budget process remains a top-down exercise. The budget process in the era of decentralization has not signifi cantly changed from the past. In theory, a system of bottom-up planning is set in place starting from a proposal of the school master, the musyawarah, to provide community input and then going to district, provincial, and central government. In reality, there is overwhelming evidence of top-down planning (GDS).
At all levels, education planners are hindered by incomplete fi nancial information. School offi cials, both teachers and heads, have become accustomed to waiting for public fi nancing, delays in disbursement, and uncertainties about their rightful benefi ts. These hinder advance planning and the possibility of checks and balances. District education bureaus are not certain of the fi nancial support they will receive from provincial and central sources until they receive the money. At the same time, provincial stakeholders lack data from the districts because not all districts send their fi nancial and education data back to the province level. Slow disbursement of resources drastically reduces the impact of fi nancial fl ows. Resources often experience delays in disbursement varying from months to half a year, resulting in the cancellation of budget items or delays in implementing projects.
Recommendations
1. Aceh’s momentum should be used to increase enrollment into higher levels of education. The new autonomy law ensures a minimum allocation to education, and the resources available for the tsunami reconstruction create an opportunity to drastically improve education in Aceh. Net enrollment rates for elementary schools are almost 100 percent, whereas higher levels of education have lower enrollment rates. More attention should be paid to increasing access to higher levels of education, from which more signifi cant rates of returns can be found.
2. The government should make quality of education a priority. Current data indicates that enrollment rates are relatively high in comparison to the national average, but there are clear issues of low maintenance and lack of infrastructure.
3. The education bureau is overwhelmed with a large quantity of data, but quality data is lacking. Identifi cation and collection of key (fi nancial) input, process, and outcome indicators are essential for planning. At the district level, although required by new regulations on the budgeting process, data are rarely used for policy-making and budget programming, (Kepmendagri No. 29/2002). Without basic data, good planning is not possible. The provincial government does not have the authority to request
ACEH PUBLIC EXPENDITURE ANALYSISSPENDING FOR RECONSTRUCTION AND POVERTY REDUCTION
SECTORAL ANALYSES WITH RECOMMENDATIONS82
information from local governments. Thus, reports from local governments to the provincial government are rare and of poor quality, an issue that clearly aff ects the quality of provincial reports. The implementation of the “one-roof” education system, in which both nonreligious and religious education will fall under the education bureau from 2008, provides an opportunity to improve data collection and evidence-based policy-making.
4. Education budget planning and programming should be based on performance indicators, not on minimum education service standards. Minimum service standards should refl ect district needs and be feasible both practically and fi nancially. The intention to comply with the “9 teachers per school” regulation would further reduce the student-teacher ratio, putting additional fi nancial burdens on the system without improving effi ciency. The “9 teachers” rule also would limit the fl exibility of local governments to provide other solutions to education supply problems. Solutions could include regrouping exercises in urban areas and multi-level teaching in rural areas.
5. To ensure equal distribution of teachers, the civil servant staffi ng policies must be reevaluated. Although the education bureau is aware of the clearly uneven distribution of teachers between urban and rural areas, it has made no real attempts to redistribute teachers. In theory, the new teacher law increases incentives to teach in remote and confl ict areas. However, in reality rural areas continue to suff er from a lack of qualifi ed teachers.
6. More resources should be allocated for maintenance. The share of education resources spent on maintenance is insignifi cant in comparison to the share spent on teachers’ salaries. The new teacher law is likely to result in an increasing share of expenditure going to teachers’ salaries.
7. In reality, spending authority remains with the center. The BOS program has increased central authority. A large share of district education expenditure, such as fi nancial resources from DAK, is already earmarked, and the province and district governments do not have the authority to use the money for what they deem necessary. Bottom-up planning in education with greater participation from all stakeholders, including parents, school committees, and local governments should be promoted.
8. Timely disbursement of fi nancial resources and early and accurate information about volume and time of disbursement are essential. District planners should have timely information about the amount of education resources available to them so that they can use the resources effi ciently.
Infrastructure
Even prior to the tsunami of December 2004, Aceh’s infrastructure was in poor condition because of a lack of public and private investment. The natural disaster crippled an already deteriorating sector. Aceh’s inadequate power, water and sanitation, and transportation infrastructure prior to the disaster highlights the lack of economic development in a resource-rich region.
Apart from major investments in industries including oil and gas, natural fertilizer, and cement, the private sector has made little direct investment by in infrastructure. Regional government was and is the major investor in infrastructure development. The volume of regional infrastructure spending in real terms has increased from Rp. 452 billion in 1999 to Rp. 1,188 billion in 2002. Infrastructure development in Aceh is behind national levels on many fronts. The number of villages with electricity and households with telephone connections or private sanitation and waste management all fall below the national average. On the other hand, electrifi cation rates and road density are signifi cantly higher than the national average (Table 5.10).
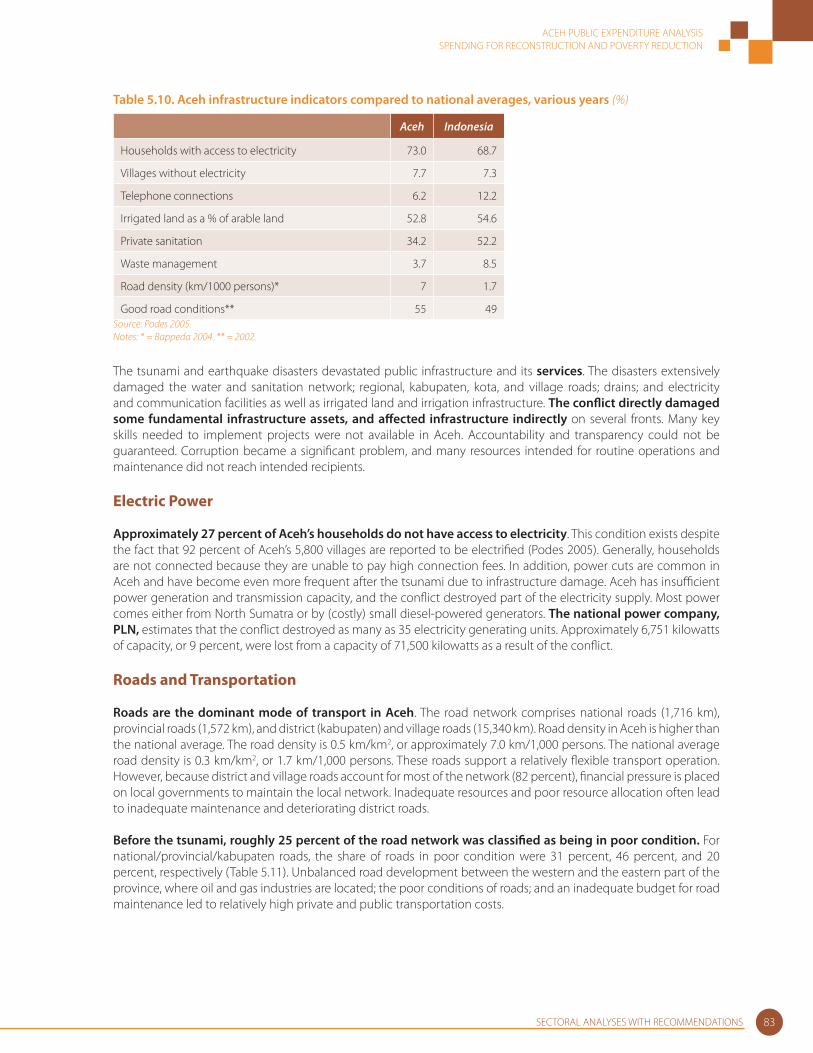
ACEH PUBLIC EXPENDITURE ANALYSISSPENDING FOR RECONSTRUCTION AND POVERTY REDUCTION
SECTORAL ANALYSES WITH RECOMMENDATIONS 83
Table 5.10. Aceh infrastructure indicators compared to national averages, various years (%)
Aceh Indonesia
Households with access to electricity 73.0 68.7
Villages without electricity 7.7 7.3
Telephone connections 6.2 12.2
Irrigated land as a % of arable land 52.8 54.6
Private sanitation 34.2 52.2
Waste management 3.7 8.5
Road density (km/1000 persons)* 7 1.7
Good road conditions** 55 49Source: Podes 2005.Notes: * = Bappeda 2004. ** = 2002.
The tsunami and earthquake disasters devastated public infrastructure and its services. The disasters extensively damaged the water and sanitation network; regional, kabupaten, kota, and village roads; drains; and electricity and communication facilities as well as irrigated land and irrigation infrastructure. The confl ict directly damaged some fundamental infrastructure assets, and aff ected infrastructure indirectly on several fronts. Many key skills needed to implement projects were not available in Aceh. Accountability and transparency could not be guaranteed. Corruption became a signifi cant problem, and many resources intended for routine operations and maintenance did not reach intended recipients.
Electric Power
Approximately 27 percent of Aceh’s households do not have access to electricity. This condition exists despite the fact that 92 percent of Aceh’s 5,800 villages are reported to be electrifi ed (Podes 2005). Generally, households are not connected because they are unable to pay high connection fees. In addition, power cuts are common in Aceh and have become even more frequent after the tsunami due to infrastructure damage. Aceh has insuffi cient power generation and transmission capacity, and the confl ict destroyed part of the electricity supply. Most power comes either from North Sumatra or by (costly) small diesel-powered generators. The national power company, PLN, estimates that the confl ict destroyed as many as 35 electricity generating units. Approximately 6,751 kilowatts of capacity, or 9 percent, were lost from a capacity of 71,500 kilowatts as a result of the confl ict.
Roads and Transportation
Roads are the dominant mode of transport in Aceh. The road network comprises national roads (1,716 km), provincial roads (1,572 km), and district (kabupaten) and village roads (15,340 km). Road density in Aceh is higher than the national average. The road density is 0.5 km/km2, or approximately 7.0 km/1,000 persons. The national average road density is 0.3 km/km2, or 1.7 km/1,000 persons. These roads support a relatively fl exible transport operation. However, because district and village roads account for most of the network (82 percent), fi nancial pressure is placed on local governments to maintain the local network. Inadequate resources and poor resource allocation often lead to inadequate maintenance and deteriorating district roads.
Before the tsunami, roughly 25 percent of the road network was classifi ed as being in poor condition. For national/provincial/kabupaten roads, the share of roads in poor condition were 31 percent, 46 percent, and 20 percent, respectively (Table 5.11). Unbalanced road development between the western and the eastern part of the province, where oil and gas industries are located; the poor conditions of roads; and an inadequate budget for road maintenance led to relatively high private and public transportation costs.
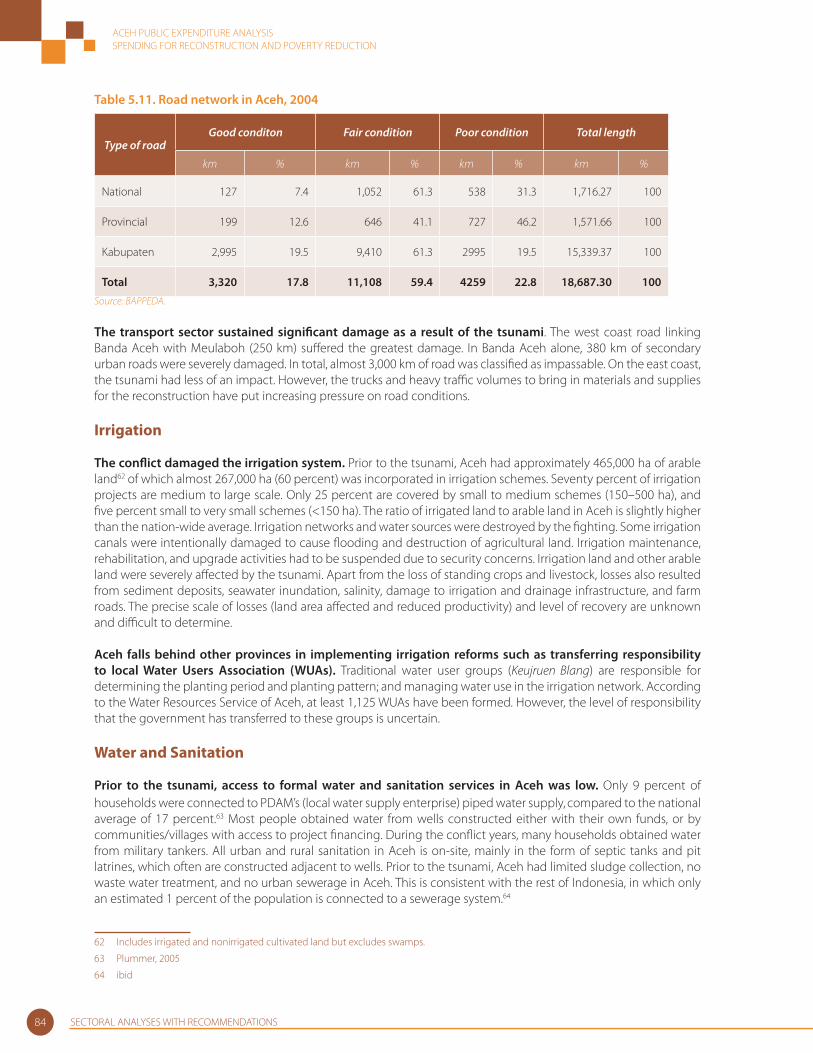
ACEH PUBLIC EXPENDITURE ANALYSISSPENDING FOR RECONSTRUCTION AND POVERTY REDUCTION
SECTORAL ANALYSES WITH RECOMMENDATIONS84
Table 5.11. Road network in Aceh, 2004
Type of roadGood conditon Fair condition Poor condition Total length
km % km % km % km %
National 127 7.4 1,052 61.3 538 31.3 1,716.27 100
Provincial 199 12.6 646 41.1 727 46.2 1,571.66 100
Kabupaten 2,995 19.5 9,410 61.3 2995 19.5 15,339.37 100
Total 3,320 17.8 11,108 59.4 4259 22.8 18,687.30 100
Source: BAPPEDA.
The transport sector sustained signifi cant damage as a result of the tsunami. The west coast road linking Banda Aceh with Meulaboh (250 km) suff ered the greatest damage. In Banda Aceh alone, 380 km of secondary urban roads were severely damaged. In total, almost 3,000 km of road was classifi ed as impassable. On the east coast, the tsunami had less of an impact. However, the trucks and heavy traffi c volumes to bring in materials and supplies for the reconstruction have put increasing pressure on road conditions.
Irrigation
The confl ict damaged the irrigation system. Prior to the tsunami, Aceh had approximately 465,000 ha of arable land62 of which almost 267,000 ha (60 percent) was incorporated in irrigation schemes. Seventy percent of irrigation projects are medium to large scale. Only 25 percent are covered by small to medium schemes (150–500 ha), and fi ve percent small to very small schemes (<150 ha). The ratio of irrigated land to arable land in Aceh is slightly higher than the nation-wide average. Irrigation networks and water sources were destroyed by the fi ghting. Some irrigation canals were intentionally damaged to cause fl ooding and destruction of agricultural land. Irrigation maintenance, rehabilitation, and upgrade activities had to be suspended due to security concerns. Irrigation land and other arable land were severely aff ected by the tsunami. Apart from the loss of standing crops and livestock, losses also resulted from sediment deposits, seawater inundation, salinity, damage to irrigation and drainage infrastructure, and farm roads. The precise scale of losses (land area aff ected and reduced productivity) and level of recovery are unknown and diffi cult to determine.
Aceh falls behind other provinces in implementing irrigation reforms such as transferring responsibility to local Water Users Association (WUAs). Traditional water user groups (Keujruen Blang) are responsible for determining the planting period and planting pattern; and managing water use in the irrigation network. According to the Water Resources Service of Aceh, at least 1,125 WUAs have been formed. However, the level of responsibility that the government has transferred to these groups is uncertain.
Water and Sanitation
Prior to the tsunami, access to formal water and sanitation services in Aceh was low. Only 9 percent of households were connected to PDAM’s (local water supply enterprise) piped water supply, compared to the national average of 17 percent.63 Most people obtained water from wells constructed either with their own funds, or by communities/villages with access to project fi nancing. During the confl ict years, many households obtained water from military tankers. All urban and rural sanitation in Aceh is on-site, mainly in the form of septic tanks and pit latrines, which often are constructed adjacent to wells. Prior to the tsunami, Aceh had limited sludge collection, no waste water treatment, and no urban sewerage in Aceh. This is consistent with the rest of Indonesia, in which only an estimated 1 percent of the population is connected to a sewerage system.64
62 Includes irrigated and nonirrigated cultivated land but excludes swamps.
63 Plummer, 2005
64 ibid
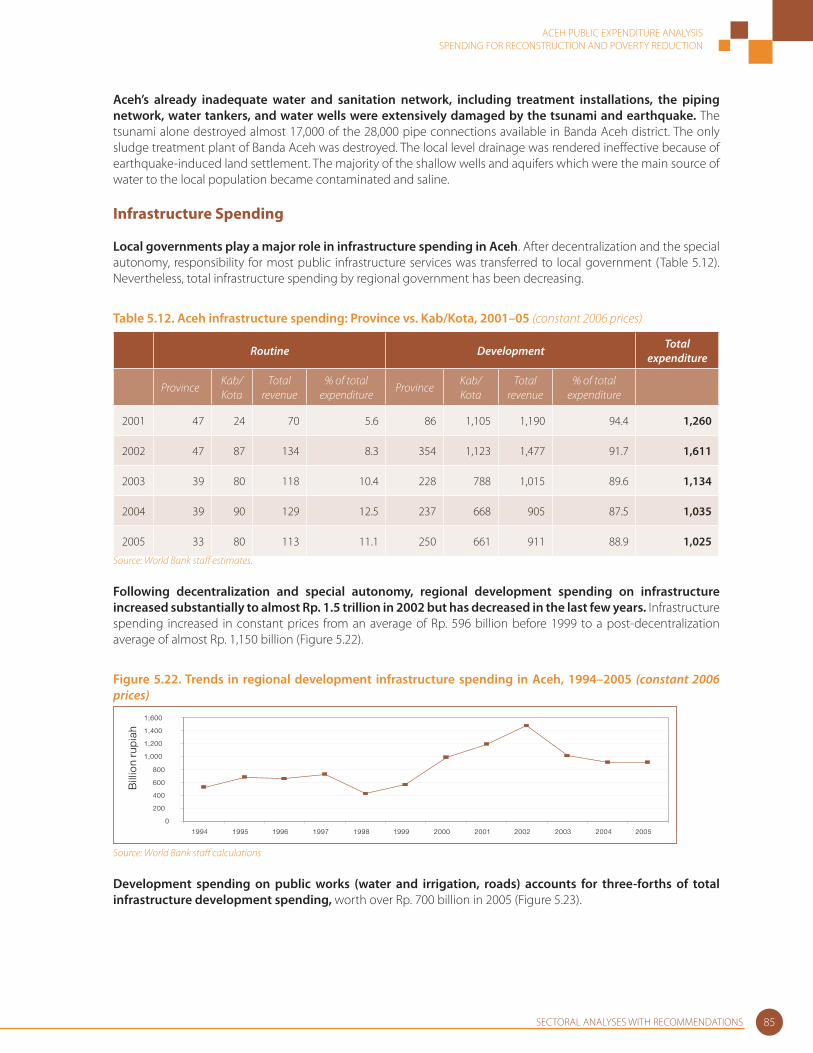
ACEH PUBLIC EXPENDITURE ANALYSISSPENDING FOR RECONSTRUCTION AND POVERTY REDUCTION
SECTORAL ANALYSES WITH RECOMMENDATIONS 85
Aceh’s already inadequate water and sanitation network, including treatment installations, the piping network, water tankers, and water wells were extensively damaged by the tsunami and earthquake. The tsunami alone destroyed almost 17,000 of the 28,000 pipe connections available in Banda Aceh district. The only sludge treatment plant of Banda Aceh was destroyed. The local level drainage was rendered ineff ective because of earthquake-induced land settlement. The majority of the shallow wells and aquifers which were the main source of water to the local population became contaminated and saline.
Infrastructure Spending
Local governments play a major role in infrastructure spending in Aceh. After decentralization and the special autonomy, responsibility for most public infrastructure services was transferred to local government (Table 5.12). Nevertheless, total infrastructure spending by regional government has been decreasing.
Table 5.12. Aceh infrastructure spending: Province vs. Kab/Kota, 2001–05 (constant 2006 prices)
Routine Development Total expenditure
ProvinceKab/Kota
Total revenue
% of total expenditure
ProvinceKab/Kota
Total revenue
% of total expenditure
2001 47 24 70 5.6 86 1,105 1,190 94.4 1,260
2002 47 87 134 8.3 354 1,123 1,477 91.7 1,611
2003 39 80 118 10.4 228 788 1,015 89.6 1,134
2004 39 90 129 12.5 237 668 905 87.5 1,035
2005 33 80 113 11.1 250 661 911 88.9 1,025
Source: World Bank staff estimates.
Following decentralization and special autonomy, regional development spending on infrastructure increased substantially to almost Rp. 1.5 trillion in 2002 but has decreased in the last few years. Infrastructure spending increased in constant prices from an average of Rp. 596 billion before 1999 to a post-decentralization average of almost Rp. 1,150 billion (Figure 5.22).
Figure 5.22. Trends in regional development infrastructure spending in Aceh, 1994–2005 (constant 2006 prices)
0
200
400
600
800
1,000
1,200
1,400
1,600
1994 1995 1996 1997 1998 1999 2000 2001 2002 2003 2004 2005
Bill
ion
rup
iah
Source: World Bank staff calculations
Development spending on public works (water and irrigation, roads) accounts for three-forths of total infrastructure development spending, worth over Rp. 700 billion in 2005 (Figure 5.23).
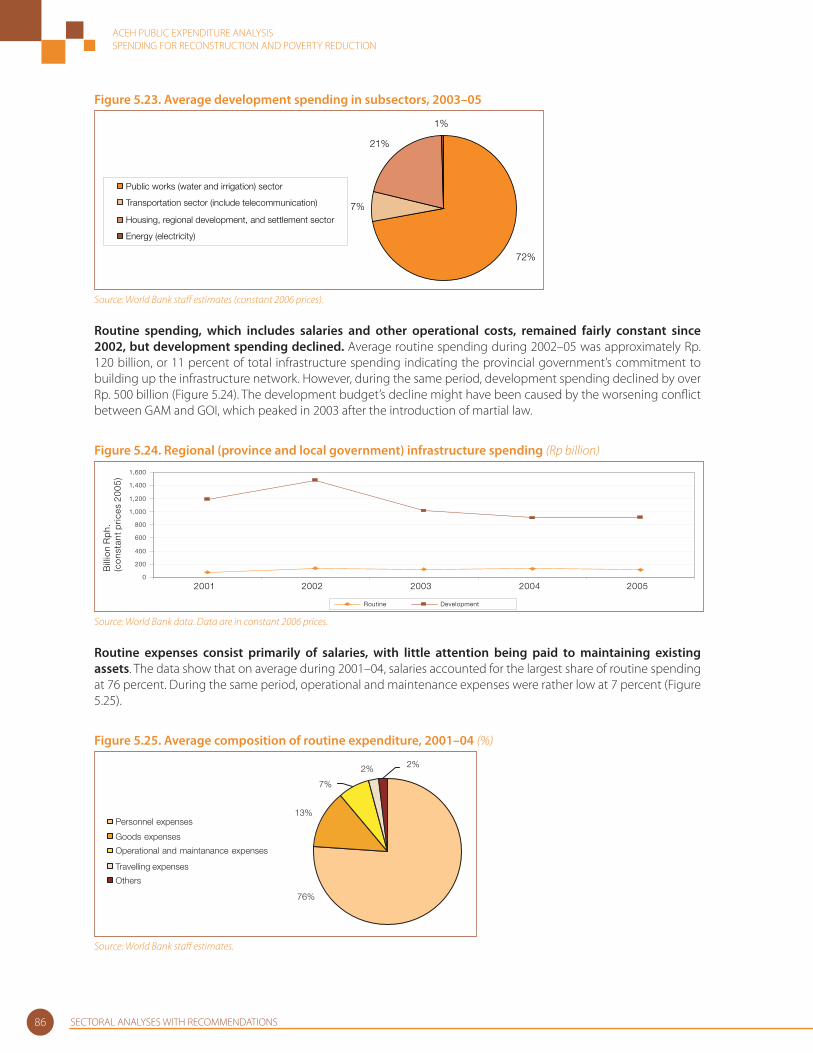
ACEH PUBLIC EXPENDITURE ANALYSISSPENDING FOR RECONSTRUCTION AND POVERTY REDUCTION
SECTORAL ANALYSES WITH RECOMMENDATIONS86
Figure 5.23. Average development spending in subsectors, 2003–05
1%
21%
7%
72%
Public works (water and irrigation) sector
Transportation sector (include telecommunication)
Housing, regional development, and settlement sector
Energy (electricity)
Source: World Bank staff estimates (constant 2006 prices).
Routine spending, which includes salaries and other operational costs, remained fairly constant since 2002, but development spending declined. Average routine spending during 2002–05 was approximately Rp. 120 billion, or 11 percent of total infrastructure spending indicating the provincial government’s commitment to building up the infrastructure network. However, during the same period, development spending declined by over Rp. 500 billion (Figure 5.24). The development budget’s decline might have been caused by the worsening confl ict between GAM and GOI, which peaked in 2003 after the introduction of martial law.
Figure 5.24. Regional (province and local government) infrastructure spending (Rp billion)
0
200
400
600
800
1,000
1,200
1,400
1,600
2001 2002 2003 2004 2005
Bill
ion
Rp
h.
(co
nsta
nt p
rice
s 2
00
5)
Routine Development
Source: World Bank data. Data are in constant 2006 prices.
Routine expenses consist primarily of salaries, with little attention being paid to maintaining existing assets. The data show that on average during 2001–04, salaries accounted for the largest share of routine spending at 76 percent. During the same period, operational and maintenance expenses were rather low at 7 percent (Figure 5.25).
Figure 5.25. Average composition of routine expenditure, 2001–04 (%)
76%
2% 2%
7%
13%Personnel expenses
Goods expenses
Operational and maintanance expenses
Travelling expenses
Others
Source: World Bank staff estimates.

ACEH PUBLIC EXPENDITURE ANALYSISSPENDING FOR RECONSTRUCTION AND POVERTY REDUCTION
SECTORAL ANALYSES WITH RECOMMENDATIONS 87
The three major issues facing provincial and local governments with regard to infrastructure spending include:
1. Provincial and local governments seem not to be prioritizing infrastructure spending based on local needs. Aceh has no distinct infrastructure spending pattern that derives from local needs. The majority of spending is split between public works and transportation.65
2. Capacity varies between local government units. Staff numbers were generally adequate, but skills mix and motivation were inadquate. Lack of technical expertise to perform project planning, implementation, supervision, and maintenance needs to be addressed.
3. BRR presence may lead local governments to spend less on development and more on routine. However, given the temporary nature of BRR’s mandate as well as the transfer of all assets to local and provincial governments by BRR, there will be signifi cant development and maintenance needs for infrastructure sector at the local government level.
Reconstruction Spending for Infrastructure and Role of the Rehabilitation and Reconstruction Agency (BRR)
Funding for rehabilitation and reconstruction of infrastructure comes from the Government of Indonesia, which is channeling large amounts through BRR and local governments, and through multilateral and bilateral donors and NGOs. Infrastructure and the social sectors have received the greatest resource allocations. However, an apparent “surplus” in total available funds to build back minimum needs hides shortfalls in key sectors. Infrastructure shows a US$653 million defi cit of available funds for reconstruction. The lack of suffi cient funding for the transport sector is clearly a critical issue because an effi cient transport network is vital for the delivery of rehabilitation and reconstruction assistance and for overall economic development.
There are signifi cant diff erences in the availability of funds between regions in Aceh. The areas immediately adjacent to Banda Aceh (Banda Aceh Kota and Aceh Besar) have more than adequate resources to rebuild, but other areas are severely under-funded. Infl ation is now one of the major problems for the reconstruction eff ort, with wages of construction workers up by 40 percent–50 percent during 2005. Funding critical gaps in infrastructure will likely fall to GOI through BRR and local governments. Many NGOs will complete their reconstruction tasks by the end of 2006 and are unlikely to make additonal commitments. Similarly, other bilateral and multilateral donors will likely continue to fund projects that they have funded previously and will concentrate on housing, education, health, and livelihoods.
It is essential that BRR keep the local and provincial governments involved at all times because they are directly responsible for the present and subsequent operation and maintenance of infrastructure. Some major infrastructure projects including major roads and large-scale drainage systems are beyond the capacity of international agencies and NGOs. Thus, deeper involvement of provincial and local governments in infrastructure fi nancing is crucial. In addition, current local government allocation of resources does not seem suffi cient to maintain assets.
Recommendations
1. BRR will need to involve the local and provincial governments more in becoming owners of projects fi nanced. Ownership not only will help build local government skills and capacity but also will ensure that local and provincial governments are immediately involved in the maintenance and upkeep of the newly reconstructed assets. To increase local government ownership, it is recommended that local governments be requested to cofi nance infrastructure projects with BRR and other NGOs if possible. Ideally, local governments would cover an increasing share of the costs of infrastructure projects over the next years starting from 2007.
2. The diff erent government levels (central, provincial and local) should promote a favorable investment climate to attract private sector investments in infrastructure. A favorable climate
65 In contrast, Papua, allocates almost 90 percent of infrastructure budget to transportation development.

ACEH PUBLIC EXPENDITURE ANALYSISSPENDING FOR RECONSTRUCTION AND POVERTY REDUCTION
SECTORAL ANALYSES WITH RECOMMENDATIONS88
requires addressing longer term issues, such as transparent public management and desperately needed legal reforms. They should encourage the private sector to undertake some of the major reconstruction and rehabilitation projects.
3. Local governments’ technical and institutional absorptive capacity constraints must be improved. Weak capacity of local governments limits the realization of increases in spending despite readily available funding. Technical assistance projects by donors and other agencies are critical to help ensure that local governments are well prepared and have the capacity to implement high quality projects. Their executing and implementing capacity must be maintained after 2009, when the reconstruction process will be over. The infrastructure development plans need to be disseminated down to the subdistrict level so that coordination is improved and responsibility is handed over effi ciently.
4. Maintenance of existing infrastructure assets and those under construction must be guaranteed. Maintenance is of utmost priority to ensure sustainability and to avoid decay of existing and newly developed infrastructure. To gain ground, an optimal balance is required between routine (maintenance) and development expenses. This balance will require strategies for local and provincial governments to have ownership of all the projects with which they will be left after the donor-fi nanced reconstruction is completed.
5. To make infrastructure spending more eff ective, local governments and BRR will need to prepare a long-term plan for infrastructure development in the province. This collaborative plan will necessitate greater coordination between provincial and local governments. In the short to medium term, BRR will be in the driver’s seat of reconstruction and development of infrastructure in the region. However, in the medium term, local governments must develop their capacities as regulators and planners, as investors in selected infrastructure subsectors, and, most importantly, as policy-makers. It will be useful to develop a medium-term fi scal and expenditure framework that will determine the expenditure ceilings over the medium term—for both capital and current expenditures on operations and maintenance. This framework will need to specify expenditures over a longer period in accordance with the revenue forecast.
6. BRR and the regional governments should strengthen monitoring and evaluation (MandE) systems. The fi rst 18 months of rehabilitation and reconstruction might have resulted in more cost-eff ective and sustainable infrastructure if MandE systems had been more robust. The sector must establish a workable MandE system that can be utilized by all projects at all levels of implementation: from national to kabupaten.

6 Local Governments’ Capacity to Manage Budget Funds
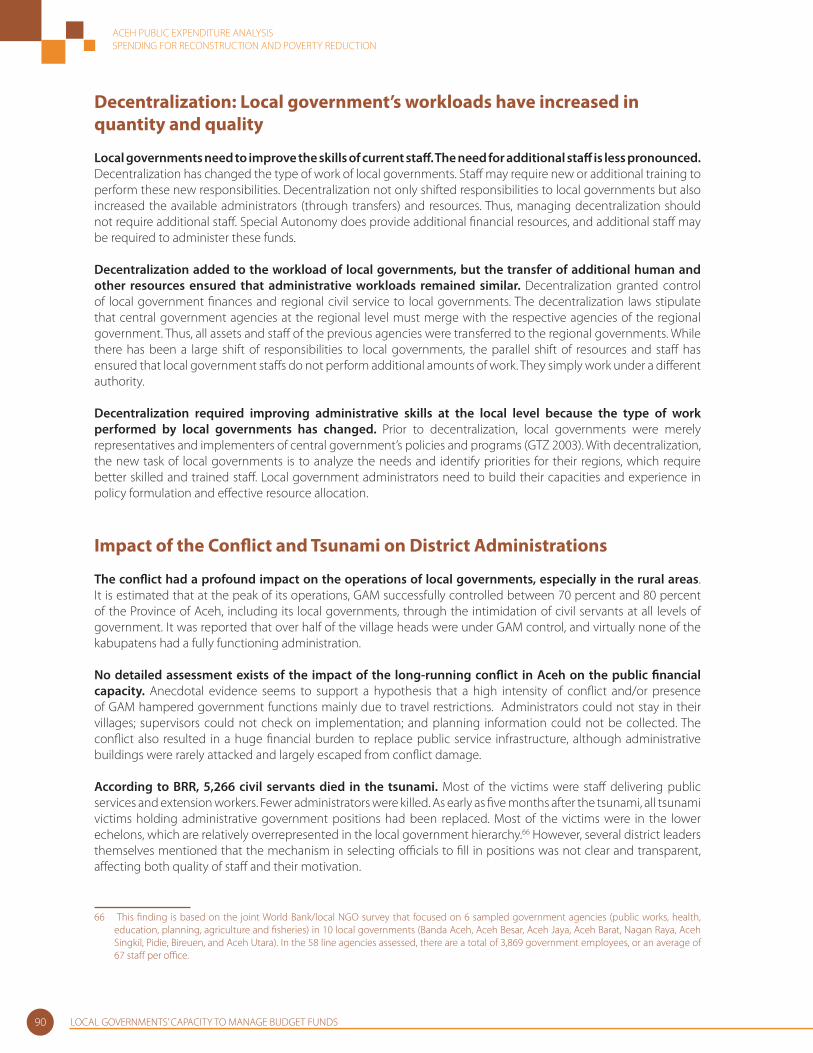
ACEH PUBLIC EXPENDITURE ANALYSISSPENDING FOR RECONSTRUCTION AND POVERTY REDUCTION
LOCAL GOVERNMENTS’ CAPACITY TO MANAGE BUDGET FUNDS90
Decentralization: Local government’s workloads have increased in quantity and quality
Local governments need to improve the skills of current staff . The need for additional staff is less pronounced. Decentralization has changed the type of work of local governments. Staff may require new or additional training to perform these new responsibilities. Decentralization not only shifted responsibilities to local governments but also increased the available administrators (through transfers) and resources. Thus, managing decentralization should not require additional staff . Special Autonomy does provide additional fi nancial resources, and additional staff may be required to administer these funds.
Decentralization added to the workload of local governments, but the transfer of additional human and other resources ensured that administrative workloads remained similar. Decentralization granted control of local government fi nances and regional civil service to local governments. The decentralization laws stipulate that central government agencies at the regional level must merge with the respective agencies of the regional government. Thus, all assets and staff of the previous agencies were transferred to the regional governments. While there has been a large shift of responsibilities to local governments, the parallel shift of resources and staff has ensured that local government staff s do not perform additional amounts of work. They simply work under a diff erent authority.
Decentralization required improving administrative skills at the local level because the type of work performed by local governments has changed. Prior to decentralization, local governments were merely representatives and implementers of central government’s policies and programs (GTZ 2003). With decentralization, the new task of local governments is to analyze the needs and identify priorities for their regions, which require better skilled and trained staff . Local government administrators need to build their capacities and experience in policy formulation and eff ective resource allocation.
Impact of the Confl ict and Tsunami on District Administrations
The confl ict had a profound impact on the operations of local governments, especially in the rural areas. It is estimated that at the peak of its operations, GAM successfully controlled between 70 percent and 80 percent of the Province of Aceh, including its local governments, through the intimidation of civil servants at all levels of government. It was reported that over half of the village heads were under GAM control, and virtually none of the kabupatens had a fully functioning administration.
No detailed assessment exists of the impact of the long-running confl ict in Aceh on the public fi nancial capacity. Anecdotal evidence seems to support a hypothesis that a high intensity of confl ict and/or presence of GAM hampered government functions mainly due to travel restrictions. Administrators could not stay in their villages; supervisors could not check on implementation; and planning information could not be collected. The confl ict also resulted in a huge fi nancial burden to replace public service infrastructure, although administrative buildings were rarely attacked and largely escaped from confl ict damage.
According to BRR, 5,266 civil servants died in the tsunami. Most of the victims were staff delivering public services and extension workers. Fewer administrators were killed. As early as fi ve months after the tsunami, all tsunami victims holding administrative government positions had been replaced. Most of the victims were in the lower echelons, which are relatively overrepresented in the local government hierarchy.66 However, several district leaders themselves mentioned that the mechanism in selecting offi cials to fi ll in positions was not clear and transparent, aff ecting both quality of staff and their motivation.
66 This fi nding is based on the joint World Bank/local NGO survey that focused on 6 sampled government agencies (public works, health, education, planning, agriculture and fi sheries) in 10 local governments (Banda Aceh, Aceh Besar, Aceh Jaya, Aceh Barat, Nagan Raya, Aceh Singkil, Pidie, Bireuen, and Aceh Utara). In the 58 line agencies assessed, there are a total of 3,869 government employees, or an average of 67 staff per offi ce.
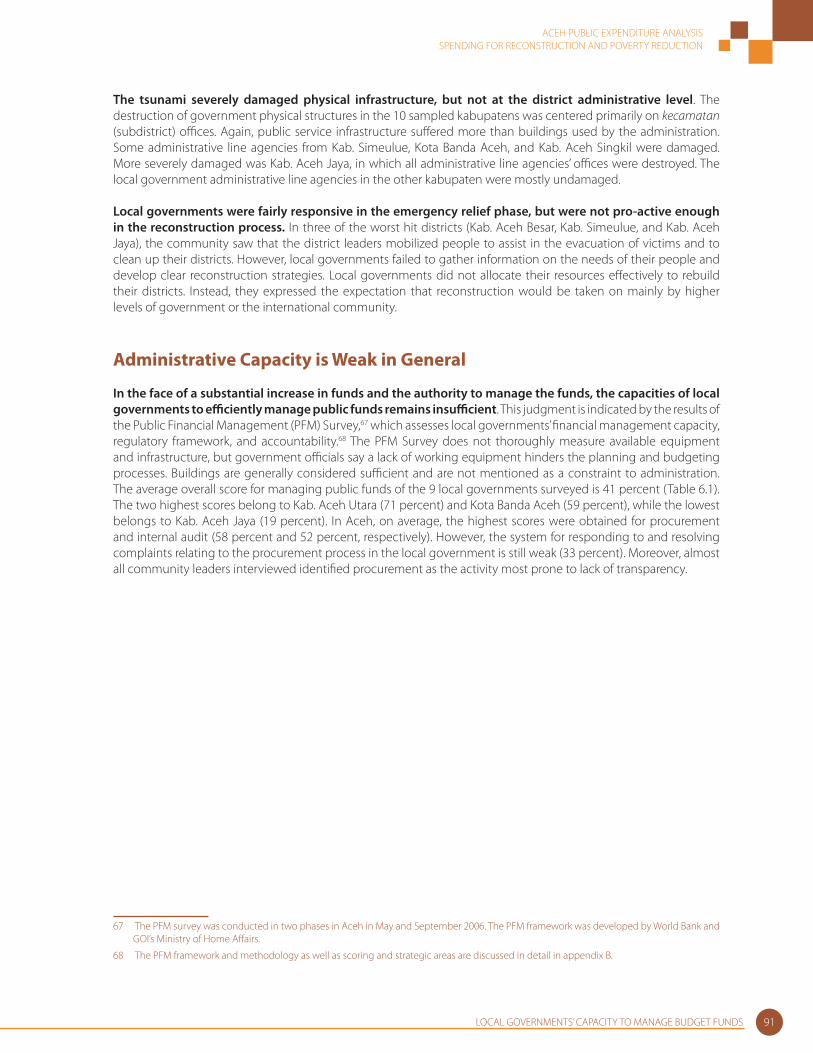
ACEH PUBLIC EXPENDITURE ANALYSISSPENDING FOR RECONSTRUCTION AND POVERTY REDUCTION
LOCAL GOVERNMENTS’ CAPACITY TO MANAGE BUDGET FUNDS 91
The tsunami severely damaged physical infrastructure, but not at the district administrative level. The destruction of government physical structures in the 10 sampled kabupatens was centered primarily on kecamatan (subdistrict) offi ces. Again, public service infrastructure suff ered more than buildings used by the administration. Some administrative line agencies from Kab. Simeulue, Kota Banda Aceh, and Kab. Aceh Singkil were damaged. More severely damaged was Kab. Aceh Jaya, in which all administrative line agencies’ offi ces were destroyed. The local government administrative line agencies in the other kabupaten were mostly undamaged.
Local governments were fairly responsive in the emergency relief phase, but were not pro-active enough in the reconstruction process. In three of the worst hit districts (Kab. Aceh Besar, Kab. Simeulue, and Kab. Aceh Jaya), the community saw that the district leaders mobilized people to assist in the evacuation of victims and to clean up their districts. However, local governments failed to gather information on the needs of their people and develop clear reconstruction strategies. Local governments did not allocate their resources eff ectively to rebuild their districts. Instead, they expressed the expectation that reconstruction would be taken on mainly by higher levels of government or the international community.
Administrative Capacity is Weak in General
In the face of a substantial increase in funds and the authority to manage the funds, the capacities of local governments to effi ciently manage public funds remains insuffi cient. This judgment is indicated by the results of the Public Financial Management (PFM) Survey,67 which assesses local governments’ fi nancial management capacity, regulatory framework, and accountability.68 The PFM Survey does not thoroughly measure available equipment and infrastructure, but government offi cials say a lack of working equipment hinders the planning and budgeting processes. Buildings are generally considered suffi cient and are not mentioned as a constraint to administration. The average overall score for managing public funds of the 9 local governments surveyed is 41 percent (Table 6.1). The two highest scores belong to Kab. Aceh Utara (71 percent) and Kota Banda Aceh (59 percent), while the lowest belongs to Kab. Aceh Jaya (19 percent). In Aceh, on average, the highest scores were obtained for procurement and internal audit (58 percent and 52 percent, respectively). However, the system for responding to and resolving complaints relating to the procurement process in the local government is still weak (33 percent). Moreover, almost all community leaders interviewed identifi ed procurement as the activity most prone to lack of transparency.
67 The PFM survey was conducted in two phases in Aceh in May and September 2006. The PFM framework was developed by World Bank and GOI’s Ministry of Home Aff airs.
68 The PFM framework and methodology as well as scoring and strategic areas are discussed in detail in appendix B.
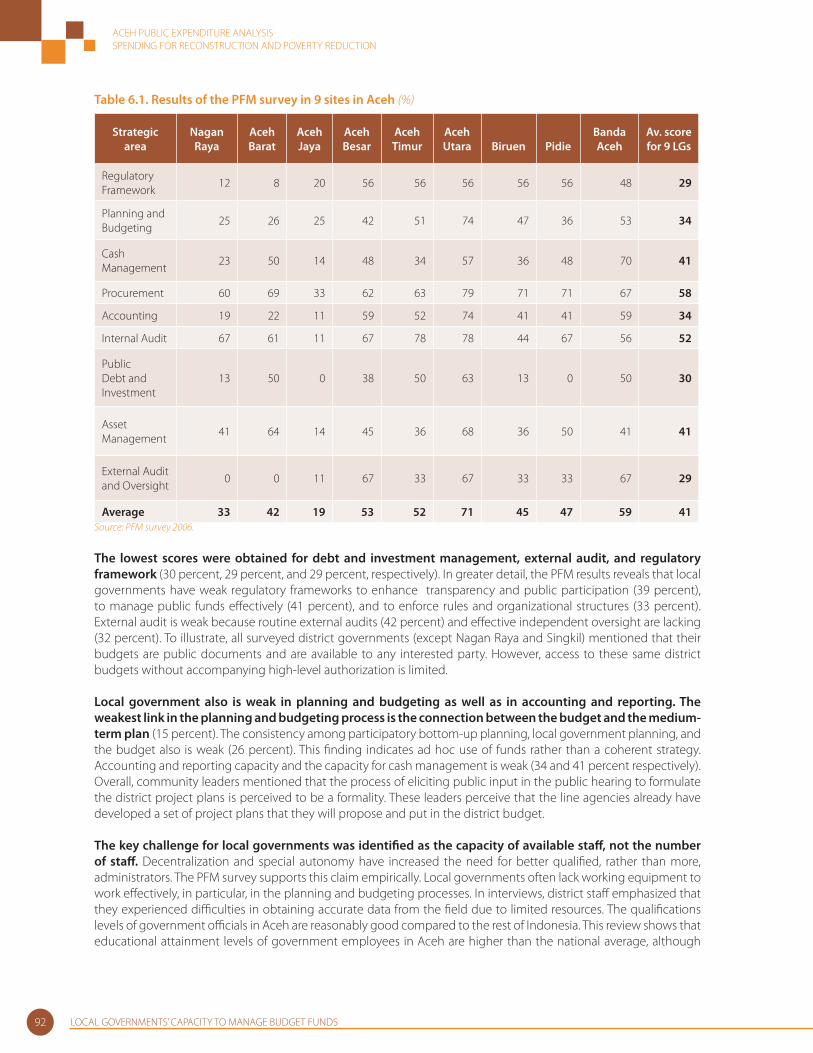
ACEH PUBLIC EXPENDITURE ANALYSISSPENDING FOR RECONSTRUCTION AND POVERTY REDUCTION
LOCAL GOVERNMENTS’ CAPACITY TO MANAGE BUDGET FUNDS92
Table 6.1. Results of the PFM survey in 9 sites in Aceh (%)
Strategic area
Nagan Raya
Aceh Barat
Aceh Jaya
Aceh Besar
Aceh Timur
Aceh Utara Biruen Pidie
Banda Aceh
Av. score for 9 LGs
Regulatory Framework
12 8 20 56 56 56 56 56 48 29
Planning and Budgeting
25 26 25 42 51 74 47 36 53 34
Cash Management
23 50 14 48 34 57 36 48 70 41
Procurement 60 69 33 62 63 79 71 71 67 58
Accounting 19 22 11 59 52 74 41 41 59 34
Internal Audit 67 61 11 67 78 78 44 67 56 52
Public Debt and Investment
13 50 0 38 50 63 13 0 50 30
Asset Management
41 64 14 45 36 68 36 50 41 41
External Audit and Oversight
0 0 11 67 33 67 33 33 67 29
Average 33 42 19 53 52 71 45 47 59 41Source: PFM survey 2006.
The lowest scores were obtained for debt and investment management, external audit, and regulatory framework (30 percent, 29 percent, and 29 percent, respectively). In greater detail, the PFM results reveals that local governments have weak regulatory frameworks to enhance transparency and public participation (39 percent), to manage public funds eff ectively (41 percent), and to enforce rules and organizational structures (33 percent). External audit is weak because routine external audits (42 percent) and eff ective independent oversight are lacking (32 percent). To illustrate, all surveyed district governments (except Nagan Raya and Singkil) mentioned that their budgets are public documents and are available to any interested party. However, access to these same district budgets without accompanying high-level authorization is limited.
Local government also is weak in planning and budgeting as well as in accounting and reporting. The weakest link in the planning and budgeting process is the connection between the budget and the medium-term plan (15 percent). The consistency among participatory bottom-up planning, local government planning, and the budget also is weak (26 percent). This fi nding indicates ad hoc use of funds rather than a coherent strategy. Accounting and reporting capacity and the capacity for cash management is weak (34 and 41 percent respectively). Overall, community leaders mentioned that the process of eliciting public input in the public hearing to formulate the district project plans is perceived to be a formality. These leaders perceive that the line agencies already have developed a set of project plans that they will propose and put in the district budget.
The key challenge for local governments was identifi ed as the capacity of available staff , not the number of staff . Decentralization and special autonomy have increased the need for better qualifi ed, rather than more, administrators. The PFM survey supports this claim empirically. Local governments often lack working equipment to work eff ectively, in particular, in the planning and budgeting processes. In interviews, district staff emphasized that they experienced diffi culties in obtaining accurate data from the fi eld due to limited resources. The qualifi cations levels of government offi cials in Aceh are reasonably good compared to the rest of Indonesia. This review shows that educational attainment levels of government employees in Aceh are higher than the national average, although
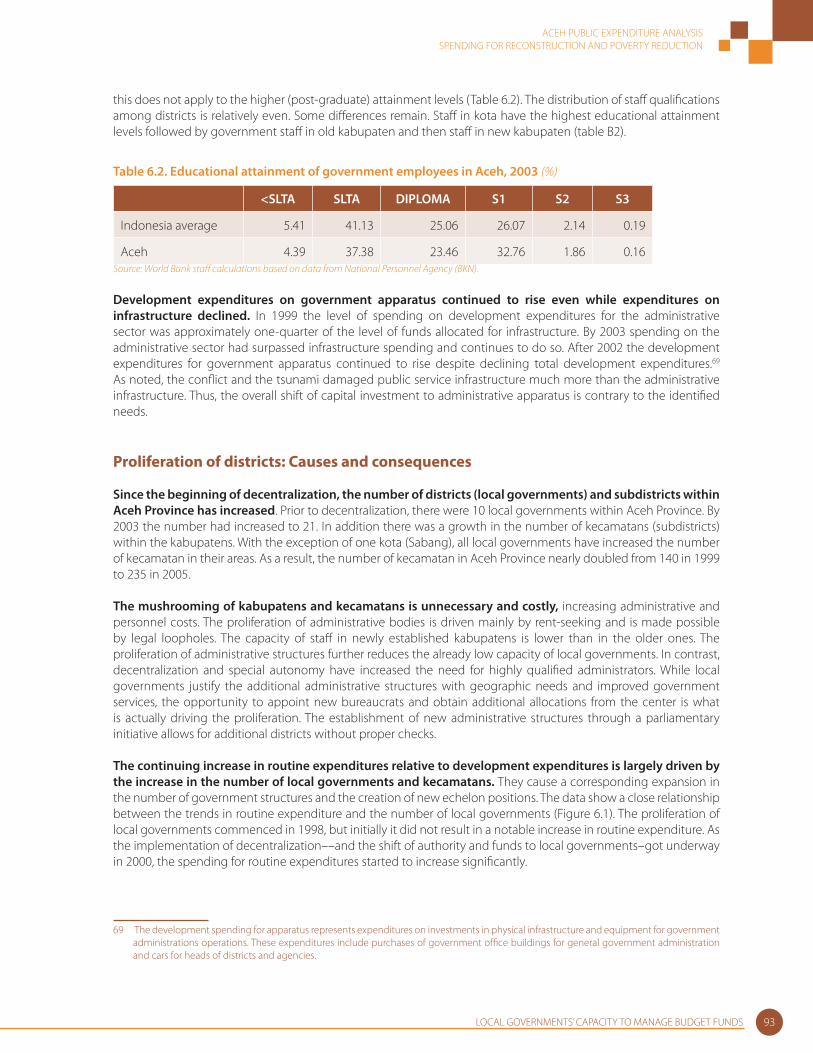
ACEH PUBLIC EXPENDITURE ANALYSISSPENDING FOR RECONSTRUCTION AND POVERTY REDUCTION
LOCAL GOVERNMENTS’ CAPACITY TO MANAGE BUDGET FUNDS 93
this does not apply to the higher (post-graduate) attainment levels (Table 6.2). The distribution of staff qualifi cations among districts is relatively even. Some diff erences remain. Staff in kota have the highest educational attainment levels followed by government staff in old kabupaten and then staff in new kabupaten (table B2).
Table 6.2. Educational attainment of government employees in Aceh, 2003 (%)
<SLTA SLTA DIPLOMA S1 S2 S3
Indonesia average 5.41 41.13 25.06 26.07 2.14 0.19
Aceh 4.39 37.38 23.46 32.76 1.86 0.16 Source: World Bank staff calculations based on data from National Personnel Agency (BKN).
Development expenditures on government apparatus continued to rise even while expenditures on infrastructure declined. In 1999 the level of spending on development expenditures for the administrative sector was approximately one-quarter of the level of funds allocated for infrastructure. By 2003 spending on the administrative sector had surpassed infrastructure spending and continues to do so. After 2002 the development expenditures for government apparatus continued to rise despite declining total development expenditures.69 As noted, the confl ict and the tsunami damaged public service infrastructure much more than the administrative infrastructure. Thus, the overall shift of capital investment to administrative apparatus is contrary to the identifi ed needs.
Proliferation of districts: Causes and consequences
Since the beginning of decentralization, the number of districts (local governments) and subdistricts within Aceh Province has increased. Prior to decentralization, there were 10 local governments within Aceh Province. By 2003 the number had increased to 21. In addition there was a growth in the number of kecamatans (subdistricts) within the kabupatens. With the exception of one kota (Sabang), all local governments have increased the number of kecamatan in their areas. As a result, the number of kecamatan in Aceh Province nearly doubled from 140 in 1999 to 235 in 2005.
The mushrooming of kabupatens and kecamatans is unnecessary and costly, increasing administrative and personnel costs. The proliferation of administrative bodies is driven mainly by rent-seeking and is made possible by legal loopholes. The capacity of staff in newly established kabupatens is lower than in the older ones. The proliferation of administrative structures further reduces the already low capacity of local governments. In contrast, decentralization and special autonomy have increased the need for highly qualifi ed administrators. While local governments justify the additional administrative structures with geographic needs and improved government services, the opportunity to appoint new bureaucrats and obtain additional allocations from the center is what is actually driving the proliferation. The establishment of new administrative structures through a parliamentary initiative allows for additional districts without proper checks.
The continuing increase in routine expenditures relative to development expenditures is largely driven by the increase in the number of local governments and kecamatans. They cause a corresponding expansion in the number of government structures and the creation of new echelon positions. The data show a close relationship between the trends in routine expenditure and the number of local governments (Figure 6.1). The proliferation of local governments commenced in 1998, but initially it did not result in a notable increase in routine expenditure. As the implementation of decentralization––and the shift of authority and funds to local governments–got underway in 2000, the spending for routine expenditures started to increase signifi cantly.
69 The development spending for apparatus represents expenditures on investments in physical infrastructure and equipment for government administrations operations. These expenditures include purchases of government offi ce buildings for general government administration and cars for heads of districts and agencies.
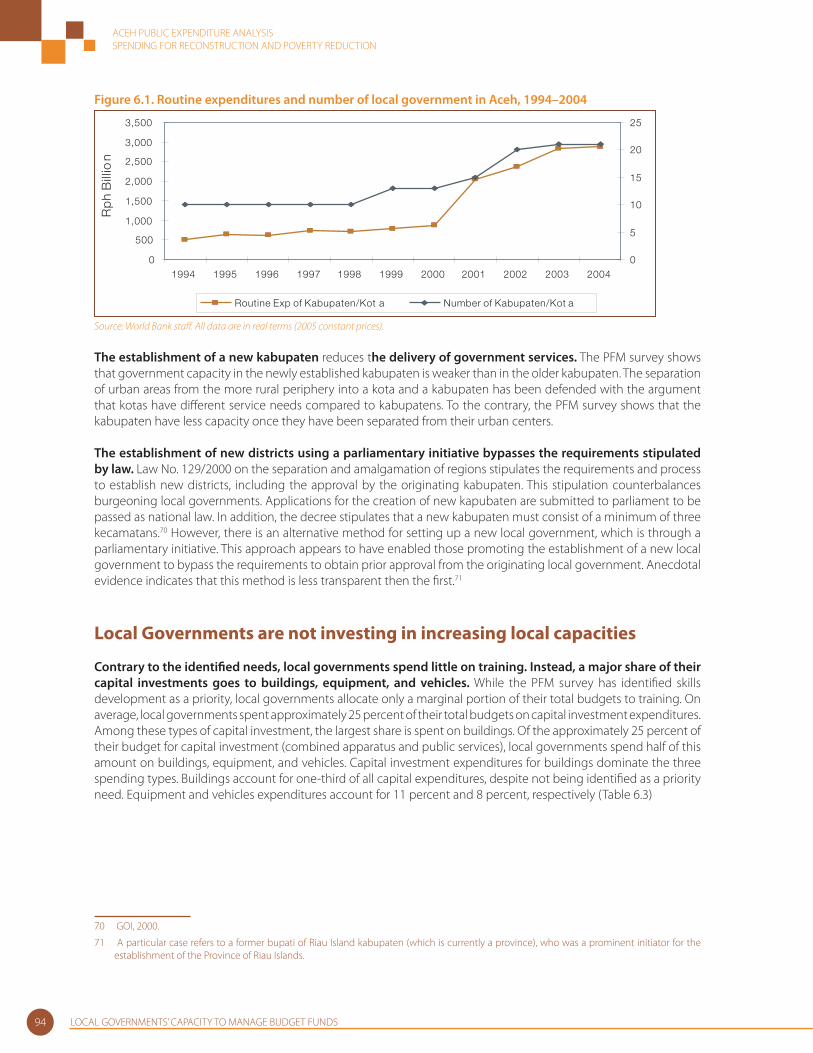
ACEH PUBLIC EXPENDITURE ANALYSISSPENDING FOR RECONSTRUCTION AND POVERTY REDUCTION
LOCAL GOVERNMENTS’ CAPACITY TO MANAGE BUDGET FUNDS94
Figure 6.1. Routine expenditures and number of local government in Aceh, 1994–2004
0
500
1,000
1,500
2,000
2,500
3,000
3,500
1994 1995 1996 1997 1998 1999 2000 2001 2002 2003 2004
Rp
h B
illio
n
0
5
10
15
20
25
Routine Exp of Kabupaten/Kot a Number of Kabupaten/Kot a
Source: World Bank staff . All data are in real terms (2005 constant prices).
The establishment of a new kabupaten reduces the delivery of government services. The PFM survey shows that government capacity in the newly established kabupaten is weaker than in the older kabupaten. The separation of urban areas from the more rural periphery into a kota and a kabupaten has been defended with the argument that kotas have diff erent service needs compared to kabupatens. To the contrary, the PFM survey shows that the kabupaten have less capacity once they have been separated from their urban centers.
The establishment of new districts using a parliamentary initiative bypasses the requirements stipulated by law. Law No. 129/2000 on the separation and amalgamation of regions stipulates the requirements and process to establish new districts, including the approval by the originating kabupaten. This stipulation counterbalances burgeoning local governments. Applications for the creation of new kapubaten are submitted to parliament to be passed as national law. In addition, the decree stipulates that a new kabupaten must consist of a minimum of three kecamatans.70 However, there is an alternative method for setting up a new local government, which is through a parliamentary initiative. This approach appears to have enabled those promoting the establishment of a new local government to bypass the requirements to obtain prior approval from the originating local government. Anecdotal evidence indicates that this method is less transparent then the fi rst.71
Local Governments are not investing in increasing local capacities
Contrary to the identifi ed needs, local governments spend little on training. Instead, a major share of their capital investments goes to buildings, equipment, and vehicles. While the PFM survey has identifi ed skills development as a priority, local governments allocate only a marginal portion of their total budgets to training. On average, local governments spent approximately 25 percent of their total budgets on capital investment expenditures. Among these types of capital investment, the largest share is spent on buildings. Of the approximately 25 percent of their budget for capital investment (combined apparatus and public services), local governments spend half of this amount on buildings, equipment, and vehicles. Capital investment expenditures for buildings dominate the three spending types. Buildings account for one-third of all capital expenditures, despite not being identifi ed as a priority need. Equipment and vehicles expenditures account for 11 percent and 8 percent, respectively (Table 6.3)
70 GOI, 2000.
71 A particular case refers to a former bupati of Riau Island kabupaten (which is currently a province), who was a prominent initiator for the establishment of the Province of Riau Islands.
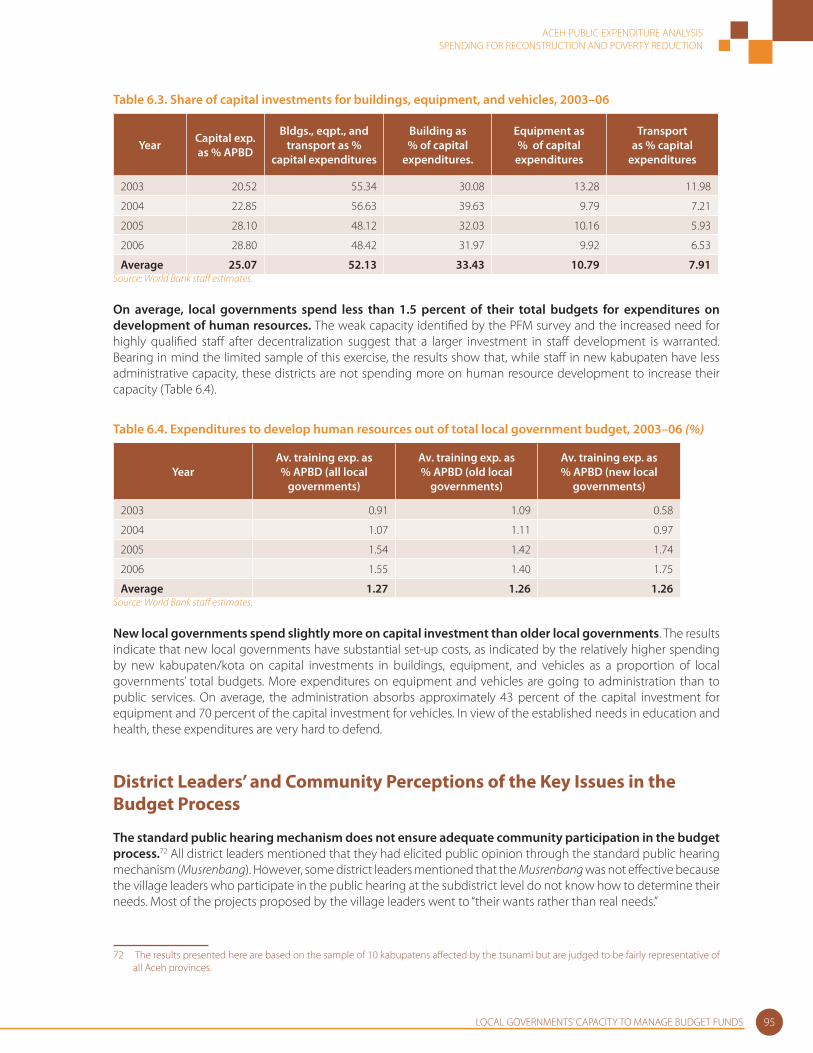
ACEH PUBLIC EXPENDITURE ANALYSISSPENDING FOR RECONSTRUCTION AND POVERTY REDUCTION
LOCAL GOVERNMENTS’ CAPACITY TO MANAGE BUDGET FUNDS 95
Table 6.3. Share of capital investments for buildings, equipment, and vehicles, 2003–06
Year Capital exp. as % APBD
Bldgs., eqpt., and transport as %
capital expenditures
Building as % of capital
expenditures.
Equipment as % of capital
expenditures
Transport as % capital
expenditures
2003 20.52 55.34 30.08 13.28 11.98
2004 22.85 56.63 39.63 9.79 7.21
2005 28.10 48.12 32.03 10.16 5.93
2006 28.80 48.42 31.97 9.92 6.53
Average 25.07 52.13 33.43 10.79 7.91 Source: World Bank staff estimates.
On average, local governments spend less than 1.5 percent of their total budgets for expenditures on development of human resources. The weak capacity identifi ed by the PFM survey and the increased need for highly qualifi ed staff after decentralization suggest that a larger investment in staff development is warranted. Bearing in mind the limited sample of this exercise, the results show that, while staff in new kabupaten have less administrative capacity, these districts are not spending more on human resource development to increase their capacity (Table 6.4).
Table 6.4. Expenditures to develop human resources out of total local government budget, 2003–06 (%)
YearAv. training exp. as % APBD (all local
governments)
Av. training exp. as % APBD (old local
governments)
Av. training exp. as % APBD (new local
governments)
2003 0.91 1.09 0.58
2004 1.07 1.11 0.97
2005 1.54 1.42 1.74
2006 1.55 1.40 1.75
Average 1.27 1.26 1.26Source: World Bank staff estimates.
New local governments spend slightly more on capital investment than older local governments. The results indicate that new local governments have substantial set-up costs, as indicated by the relatively higher spending by new kabupaten/kota on capital investments in buildings, equipment, and vehicles as a proportion of local governments’ total budgets. More expenditures on equipment and vehicles are going to administration than to public services. On average, the administration absorbs approximately 43 percent of the capital investment for equipment and 70 percent of the capital investment for vehicles. In view of the established needs in education and health, these expenditures are very hard to defend.
District Leaders’ and Community Perceptions of the Key Issues in the Budget Process
The standard public hearing mechanism does not ensure adequate community participation in the budget process.72 All district leaders mentioned that they had elicited public opinion through the standard public hearing mechanism (Musrenbang). However, some district leaders mentioned that the Musrenbang was not eff ective because the village leaders who participate in the public hearing at the subdistrict level do not know how to determine their needs. Most of the projects proposed by the village leaders went to “their wants rather than real needs.”
72 The results presented here are based on the sample of 10 kabupatens aff ected by the tsunami but are judged to be fairly representative of all Aceh provinces.
ACEH PUBLIC EXPENDITURE ANALYSISSPENDING FOR RECONSTRUCTION AND POVERTY REDUCTION
LOCAL GOVERNMENTS’ CAPACITY TO MANAGE BUDGET FUNDS96
Transparency problems persist in the district government bureaucracies. Of the 10 districts visited, community leaders in 8 districts mentioned issues with transparency in the district governments. The procurement practices of government projects have been identifi ed as the area most prone to a lack of transparency. In some cases, the lack of transparency was said to have aff ected the whole bureaucracy.
Recommendations
1. Planning departments (provincial and district Bappeda) should scrutinize the allocation of funds for general public administration. The expansion of the government system and structures had a profound impact on the local governments’ budget structure. Expansion has shifted expenditures from public service delivery toward general public administration. Despite the increased spending on public administration, the capacity of local governments remains weak.
2. It would be prudent for the provincial and national governments to prevent the creation of new kabupatens. The mushrooming of kabupatens seems to have reduced the capacity to manage budget funds. The creation of new kabupatens also results in dis-economies of scale, adding to costs for additional personnel, equipment and buildings at the expense of investments in public services. Therefore, the process of screening the establishment of new kabupatens needs to be made more transparent.
3. BRR, donors and the provincial government should give top priority to strengthening the capacity of local governments. The main threat to the effi cient use of public resources results from the lack of capacity for fi nancial management and the lack of transparency and accountability at all levels. However, given that local governments have invested heavily in general administration but with little positive impact, their capacity must be enhanced, especially for planning, budgeting, transparency, and accountability to improve the allocation of public funds.
4. Local governments should complete their regulatory frameworks to ensure that their resources are allocated strategically and in an accountable and transparent manner. Once their regulatory frameworks are in place, external audits could be used to ensure that local governments are accountable. Local governments should establish proper regulatory frameworks and mechanisms for participatory planning, and accurate and timely accounting and reporting procedures. In addition, they should set up and enforce an independent and transparent monitoring and oversight mechanism.
5. Additional investments in the administrative apparatus should clearly result in measurable
effi ciency improvements. If the effi ciency gains do not justify the investment, the resources should be shifted to public services. Returns on investing public funds in improving public services are likely to be greater than constructing new buildings for the general administration.
Appendix
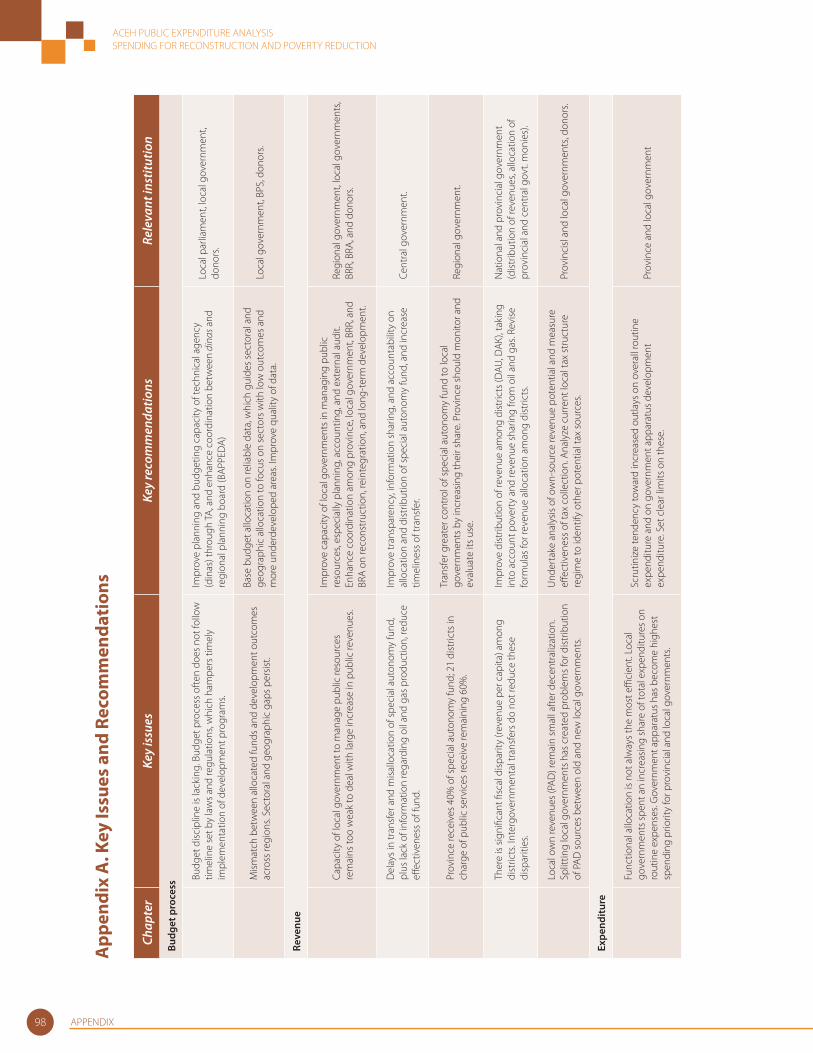
ACEH PUBLIC EXPENDITURE ANALYSISSPENDING FOR RECONSTRUCTION AND POVERTY REDUCTION
APPENDIX98
App
endi
x A
. Key
Issu
es a
nd R
ecom
men
dati
ons
Chap
ter
Key
issu
esKe
y re
com
men
datio
nsRe
leva
nt in
stitu
tion
Budg
et p
roce
ss
Budg
et d
iscip
line
is la
ckin
g. B
udge
t pro
cess
ofte
n do
es n
ot fo
llow
tim
elin
e se
t by
law
s and
regu
latio
ns, w
hich
ham
pers
tim
ely
impl
emen
tatio
n of
dev
elop
men
t pro
gram
s.
Impr
ove
plan
ning
and
bud
getin
g ca
paci
ty o
f tec
hnic
al a
genc
y (d
inas
) thr
ough
TA, a
nd e
nhan
ce c
oord
inat
ion
betw
een
dina
s and
re
gion
al p
lann
ing
boar
d (B
APPE
DA)
Loca
l par
liam
ent,
loca
l gov
ernm
ent,
dono
rs.
Mism
atch
bet
wee
n al
loca
ted
fund
s and
dev
elop
men
t out
com
es
acro
ss re
gion
s. Se
ctor
al a
nd g
eogr
aphi
c ga
ps p
ersis
t.
Base
bud
get a
lloca
tion
on re
liabl
e da
ta, w
hich
gui
des s
ecto
ral a
nd
geog
raph
ic a
lloca
tion
to fo
cus o
n se
ctor
s with
low
out
com
es a
nd
mor
e un
derd
evel
oped
are
as. I
mpr
ove
qual
ity o
f dat
a.Lo
cal g
over
nmen
t, BP
S, d
onor
s.
Reve
nue
Capa
city
of l
ocal
gov
ernm
ent t
o m
anag
e pu
blic
reso
urce
s re
mai
ns to
o w
eak
to d
eal w
ith la
rge
incr
ease
in p
ublic
reve
nues
.
Impr
ove
capa
city
of l
ocal
gov
ernm
ents
in m
anag
ing
publ
ic
reso
urce
s, es
peci
ally
pla
nnin
g, a
ccou
ntin
g, a
nd e
xter
nal a
udit.
En
hanc
e co
ordi
natio
n am
ong
prov
ince
, loc
al g
over
nmen
t, BR
R, a
nd
BRA
on re
cons
truc
tion,
rein
tegr
atio
n, a
nd lo
ng-t
erm
dev
elop
men
t.
Regi
onal
gov
ernm
ent,
loca
l gov
ernm
ents
, BR
R, B
RA, a
nd d
onor
s.
Del
ays i
n tr
ansf
er a
nd m
isallo
catio
n of
spec
ial a
uton
omy
fund
, pl
us la
ck o
f inf
orm
atio
n re
gard
ing
oil a
nd g
as p
rodu
ctio
n, re
duce
eff
ect
iven
ess o
f fun
d.
Impr
ove
tran
spar
ency
, inf
orm
atio
n sh
arin
g, a
nd a
ccou
ntab
ility
on
allo
catio
n an
d di
strib
utio
n of
spec
ial a
uton
omy
fund
, and
incr
ease
tim
elin
ess o
f tra
nsfe
r.Ce
ntra
l gov
ernm
ent.
Prov
ince
rece
ives
40%
of s
peci
al a
uton
omy
fund
; 21
dist
ricts
in
char
ge o
f pub
lic se
rvic
es re
ceiv
e re
mai
ning
60%
.
Tran
sfer
gre
ater
con
trol
of s
peci
al a
uton
omy
fund
to lo
cal
gove
rnm
ents
by
incr
easin
g th
eir s
hare
. Pro
vinc
e sh
ould
mon
itor a
nd
eval
uate
its u
se.
Regi
onal
gov
ernm
ent.
Ther
e is
signi
fi can
t fi s
cal d
ispar
ity (r
even
ue p
er c
apita
) am
ong
dist
ricts
. Int
ergo
vern
men
tal t
rans
fers
do
not r
educ
e th
ese
disp
ariti
es.
Impr
ove
dist
ribut
ion
of re
venu
e am
ong
dist
ricts
(DAU
, DAK
), ta
king
in
to a
ccou
nt p
over
ty a
nd re
venu
e sh
arin
g fro
m o
il an
d ga
s. Re
vise
fo
rmul
as fo
r rev
enue
allo
catio
n am
ong
dist
ricts
.
Nat
iona
l and
pro
vinc
ial g
over
nmen
t (d
istrib
utio
n of
reve
nues
, allo
catio
n of
pr
ovin
cial
and
cen
tral
gov
t. m
onie
s).
Loca
l ow
n re
venu
es (P
AD) r
emai
n sm
all a
fter d
ecen
tral
izat
ion.
Sp
littin
g lo
cal g
over
nmen
ts h
as c
reat
ed p
robl
ems f
or d
istrib
utio
n of
PAD
sour
ces b
etw
een
old
and
new
loca
l gov
ernm
ents
.
Und
erta
ke a
naly
sis o
f ow
n-so
urce
reve
nue
pote
ntia
l and
mea
sure
eff
ect
iven
ess o
f tax
col
lect
ion.
Ana
lyze
cur
rent
loca
l tax
stru
ctur
e re
gim
e to
iden
tify
othe
r pot
entia
l tax
sour
ces.
Prov
inci
sl an
d lo
cal g
over
nmen
ts, d
onor
s.
Expe
nditu
re
Func
tiona
l allo
catio
n is
not a
lway
s the
mos
t effi
cien
t. Lo
cal
gove
rnm
ents
spen
t an
incr
easin
g sh
are
of to
tal e
xpen
ditu
res o
n ro
utin
e ex
pens
es. G
over
nmen
t app
arat
us h
as b
ecom
e hi
ghes
t sp
endi
ng p
riorit
y fo
r pro
vinc
ial a
nd lo
cal g
over
nmen
ts.
Scru
tiniz
e te
nden
cy to
war
d in
crea
sed
outla
ys o
n ov
eral
l rou
tine
expe
nditu
re a
nd o
n go
vern
men
t app
arat
us d
evel
opm
ent
expe
nditu
re. S
et c
lear
lim
its o
n th
ese.
Prov
ince
and
loca
l gov
ernm
ent
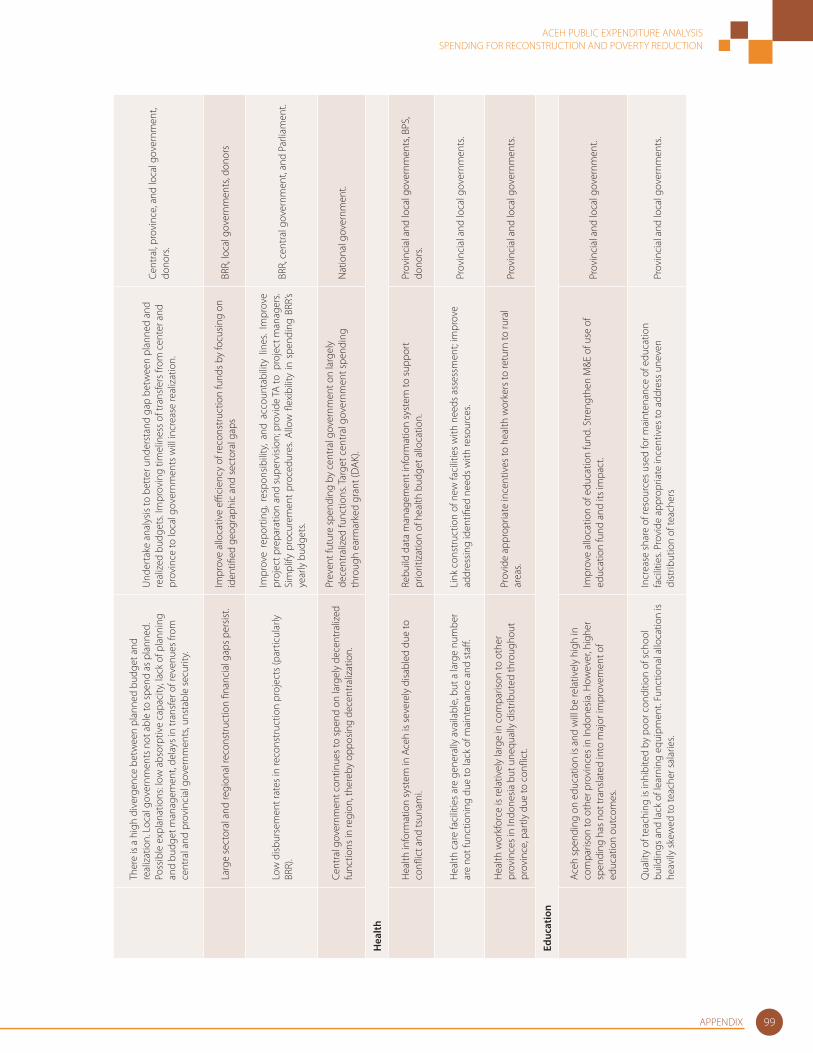
ACEH PUBLIC EXPENDITURE ANALYSISSPENDING FOR RECONSTRUCTION AND POVERTY REDUCTION
APPENDIX 99
Ther
e is
a hi
gh d
iver
genc
e be
twee
n pl
anne
d bu
dget
and
re
aliz
atio
n. L
ocal
gov
ernm
ents
not
abl
e to
spen
d as
pla
nned
. Po
ssib
le e
xpla
natio
ns: l
ow a
bsor
ptiv
e ca
paci
ty, l
ack
of p
lann
ing
and
budg
et m
anag
emen
t, de
lays
in tr
ansf
er o
f rev
enue
s fro
m
cent
ral a
nd p
rovi
ncia
l gov
ernm
ents
, uns
tabl
e se
curit
y.
Und
erta
ke a
naly
sis to
bet
ter u
nder
stan
d ga
p be
twee
n pl
anne
d an
d re
aliz
ed b
udge
ts. I
mpr
ovin
g tim
elin
ess o
f tra
nsfe
rs fr
om c
ente
r and
pr
ovin
ce to
loca
l gov
ernm
ents
will
incr
ease
real
izat
ion.
Cent
ral,
prov
ince
, and
loca
l gov
ernm
ent,
dono
rs.
Larg
e se
ctor
al a
nd re
gion
al re
cons
truc
tion
fi nan
cial
gap
s per
sist.
Impr
ove
allo
cativ
e effi
cie
ncy
of re
cons
truc
tion
fund
s by
focu
sing
on
iden
tifi e
d ge
ogra
phic
and
sect
oral
gap
s BR
R, lo
cal g
over
nmen
ts, d
onor
s
Low
disb
urse
men
t rat
es in
reco
nstr
uctio
n pr
ojec
ts (p
artic
ular
ly
BRR)
.
Impr
ove
repo
rtin
g, r
espo
nsib
ility
, and
acc
ount
abili
ty l
ines
. Im
prov
e pr
ojec
t pre
para
tion
and
supe
rvisi
on; p
rovi
de TA
to p
roje
ct m
anag
ers.
Sim
plify
pro
cure
men
t pr
oced
ures
. Allo
w fl
exib
ility
in s
pend
ing
BRR’
s ye
arly
bud
gets
.
BRR,
cen
tral
gov
ernm
ent,
and
Parli
amen
t.
Cent
ral g
over
nmen
t con
tinue
s to
spen
d on
larg
ely
dece
ntra
lized
fu
nctio
ns in
regi
on, t
here
by o
ppos
ing
dece
ntra
lizat
ion.
Prev
ent f
utur
e sp
endi
ng b
y ce
ntra
l gov
ernm
ent o
n la
rgel
y de
cent
raliz
ed fu
nctio
ns. T
arge
t cen
tral
gov
ernm
ent s
pend
ing
thro
ugh
earm
arke
d gr
ant (
DAK
). N
atio
nal g
over
nmen
t.
Hea
lth
Hea
lth in
form
atio
n sy
stem
in A
ceh
is se
vere
ly d
isabl
ed d
ue to
co
nfl ic
t and
tsun
ami.
Rebu
ild d
ata
man
agem
ent i
nfor
mat
ion
syst
em to
supp
ort
prio
ritiz
atio
n of
hea
lth b
udge
t allo
catio
n.Pr
ovin
cial
and
loca
l gov
ernm
ents
, BPS
, do
nors
.
Hea
lth c
are
faci
litie
s are
gen
eral
ly a
vaila
ble,
but
a la
rge
num
ber
are
not f
unct
ioni
ng d
ue to
lack
of m
aint
enan
ce a
nd st
aff .
Link
con
stru
ctio
n of
new
faci
litie
s with
nee
ds a
sses
smen
t; im
prov
e ad
dres
sing
iden
tifi e
d ne
eds w
ith re
sour
ces.
Prov
inci
al a
nd lo
cal g
over
nmen
ts.
Hea
lth w
orkf
orce
is re
lativ
ely
larg
e in
com
paris
on to
oth
er
prov
ince
s in
Indo
nesia
but
une
qual
ly d
istrib
uted
thro
ugho
ut
prov
ince
, par
tly d
ue to
con
fl ict
.
Prov
ide
appr
opria
te in
cent
ives
to h
ealth
wor
kers
to re
turn
to ru
ral
area
s. Pr
ovin
cial
and
loca
l gov
ernm
ents
.
Educ
atio
n
Aceh
spen
ding
on
educ
atio
n is
and
will
be
rela
tivel
y hi
gh in
co
mpa
rison
to o
ther
pro
vinc
es in
Indo
nesia
. How
ever
, hig
her
spen
ding
has
not
tran
slate
d in
to m
ajor
impr
ovem
ent o
f ed
ucat
ion
outc
omes
.
Impr
ove
allo
catio
n of
edu
catio
n fu
nd. S
tren
gthe
n M
&E o
f use
of
educ
atio
n fu
nd a
nd it
s im
pact
.Pr
ovin
cial
and
loca
l gov
ernm
ent.
Qua
lity
of te
achi
ng is
inhi
bite
d by
poo
r con
ditio
n of
scho
ol
build
ings
and
lack
of l
earn
ing
equi
pmen
t. Fu
nctio
nal a
lloca
tion
is he
avily
skew
ed to
teac
her s
alar
ies.
Incr
ease
shar
e of
reso
urce
s use
d fo
r mai
nten
ance
of e
duca
tion
faci
litie
s. Pr
ovid
e ap
prop
riate
ince
ntiv
es to
add
ress
une
ven
dist
ribut
ion
of te
ache
rsPr
ovin
cial
and
loca
l gov
ernm
ents
.
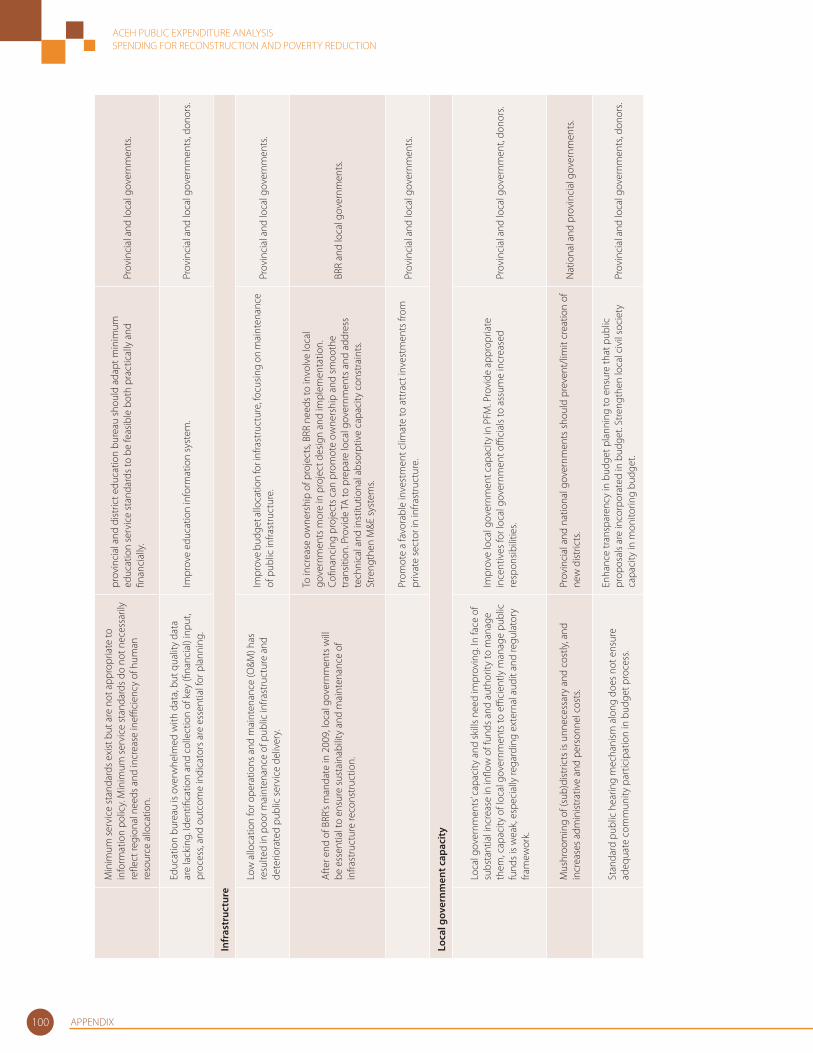
ACEH PUBLIC EXPENDITURE ANALYSISSPENDING FOR RECONSTRUCTION AND POVERTY REDUCTION
APPENDIX100
Min
imum
serv
ice
stan
dard
s exi
st b
ut a
re n
ot a
ppro
pria
te to
in
form
atio
n po
licy.
Min
imum
serv
ice
stan
dard
s do
not n
eces
saril
y re
fl ect
regi
onal
nee
ds a
nd in
crea
se in
effi c
ienc
y of
hum
an
reso
urce
allo
catio
n.
prov
inci
al a
nd d
istric
t edu
catio
n bu
reau
shou
ld a
dapt
min
imum
ed
ucat
ion
serv
ice
stan
dard
s to
be fe
asib
le b
oth
prac
tical
ly a
nd
fi nan
cial
ly.
Prov
inci
al a
nd lo
cal g
over
nmen
ts.
Educ
atio
n bu
reau
is o
verw
helm
ed w
ith d
ata,
but
qua
lity
data
ar
e la
ckin
g. Id
entifi
cat
ion
and
colle
ctio
n of
key
(fi n
anci
al) i
nput
, pr
oces
s, an
d ou
tcom
e in
dica
tors
are
ess
entia
l for
pla
nnin
g.Im
prov
e ed
ucat
ion
info
rmat
ion
syst
em.
Prov
inci
al a
nd lo
cal g
over
nmen
ts, d
onor
s.
Infr
astr
uctu
re
Low
allo
catio
n fo
r ope
ratio
ns a
nd m
aint
enan
ce (O
&M) h
as
resu
lted
in p
oor m
aint
enan
ce o
f pub
lic in
frast
ruct
ure
and
dete
riora
ted
publ
ic se
rvic
e de
liver
y.
Impr
ove
budg
et a
lloca
tion
for i
nfra
stru
ctur
e, fo
cusin
g on
mai
nten
ance
of
pub
lic in
frast
ruct
ure.
Pr
ovin
cial
and
loca
l gov
ernm
ents
.
Afte
r end
of B
RR’s
man
date
in 2
009,
loca
l gov
ernm
ents
will
be
ess
entia
l to
ensu
re su
stai
nabi
lity
and
mai
nten
ance
of
infra
stru
ctur
e re
cons
truc
tion.
To in
crea
se o
wne
rshi
p of
pro
ject
s, BR
R ne
eds t
o in
volv
e lo
cal
gove
rnm
ents
mor
e in
pro
ject
des
ign
and
impl
emen
tatio
n.
Cofi n
anci
ng p
roje
cts c
an p
rom
ote
owne
rshi
p an
d sm
ooth
e tr
ansit
ion.
Pro
vide
TA to
pre
pare
loca
l gov
ernm
ents
and
add
ress
te
chni
cal a
nd in
stitu
tiona
l abs
orpt
ive
capa
city
con
stra
ints
. St
reng
then
M&E
syst
ems.
BRR
and
loca
l gov
ernm
ents
.
Prom
ote
a fa
vora
ble
inve
stm
ent c
limat
e to
att
ract
inve
stm
ents
from
pr
ivat
e se
ctor
in in
frast
ruct
ure.
Prov
inci
al a
nd lo
cal g
over
nmen
ts.
Loca
l gov
ernm
ent c
apac
ity
Loca
l gov
ernm
ents
’ cap
acity
and
skill
s nee
d im
prov
ing.
In fa
ce o
f su
bsta
ntia
l inc
reas
e in
infl o
w o
f fun
ds a
nd a
utho
rity
to m
anag
e th
em, c
apac
ity o
f loc
al g
over
nmen
ts to
effi
cien
tly m
anag
e pu
blic
fu
nds i
s wea
k, e
spec
ially
rega
rdin
g ex
tern
al a
udit
and
regu
lato
ry
fram
ewor
k.
Impr
ove
loca
l gov
ernm
ent c
apac
ity in
PFM
. Pro
vide
app
ropr
iate
in
cent
ives
for l
ocal
gov
ernm
ent o
ffi ci
als t
o as
sum
e in
crea
sed
resp
onsib
ilitie
s.Pr
ovin
cial
and
loca
l gov
ernm
ent,
dono
rs.
Mus
hroo
min
g of
(sub
)dist
ricts
is u
nnec
essa
ry a
nd c
ostly
, and
in
crea
ses a
dmin
istra
tive
and
pers
onne
l cos
ts.
Prov
inci
al a
nd n
atio
nal g
over
nmen
ts s
houl
d pr
even
t/lim
it cr
eatio
n of
ne
w d
istric
ts.
Nat
iona
l and
pro
vinc
ial g
over
nmen
ts.
Stan
dard
pub
lic h
earin
g m
echa
nism
alo
ng d
oes n
ot e
nsur
e ad
equa
te c
omm
unity
par
ticip
atio
n in
bud
get p
roce
ss.
Enha
nce
tran
spar
ency
in b
udge
t pla
nnin
g to
ens
ure
that
pub
lic
prop
osal
s are
inco
rpor
ated
in b
udge
t. St
reng
then
loca
l civ
il so
ciet
y ca
paci
ty in
mon
itorin
g bu
dget
.Pr
ovin
cial
and
loca
l gov
ernm
ents
, don
ors.
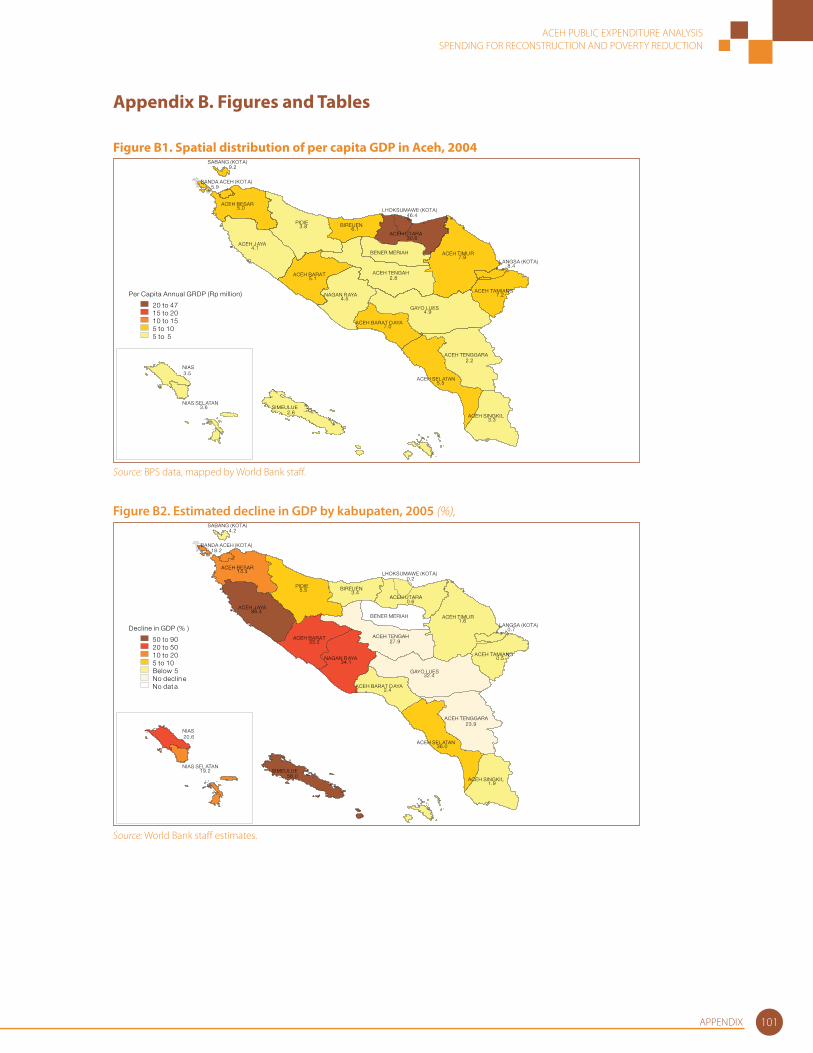
ACEH PUBLIC EXPENDITURE ANALYSISSPENDING FOR RECONSTRUCTION AND POVERTY REDUCTION
APPENDIX 101
Appendix B. Figures and Tables
Figure B1. Spatial distribution of per capita GDP in Aceh, 2004
SIMEULUE
ACEH TENGGARA
ACEH TENGAH
BENER MERIAH
ACEH UTARA
LHOKSUMAWE (KOTA)
LANGSA (KOTA)
BANDA ACEH (KOT A)
SABANG (KOTA)
2.6
5.9
46.4
30.6
8.4
5.5
2.2
2.8
4.9
9.2
ACEH SINGKI L
ACEH SEL ATAN
ACEH TIMU R
ACEH BARAT
ACEH BESAR
PIDIE BIREUEN
ACEH BARAT D AYA
GAYO LUES
ACEH TAMIANGNAGAN R AYA
ACEH J AYA
3.3
7.9
5.1
5.0
3.8 6.1
7.0
7.24.5
4.1
NIAS SEL ATAN
NIAS3.5
3.6
Per Capita Annual GRDP (Rp million)
20 to 4715 to 2010 to 155 to 105 to 5
Source: BPS data, mapped by World Bank staff .
Figure B2. Estimated decline in GDP by kabupaten, 2005 (%),
SIMEULUE
ACEH TENGGARA
ACEH TENGAH
BENER MERIAH
ACEH UTARA
LHOKSUMAWE (KOTA)
LANGSA (KOTA)
BANDA ACEH (KOT A)
SABANG (KOTA)
56.0
18.2
0.2
0.6
0.7
36.0
23.9
27.9
32.4
4.2
ACEH SINGKI L
ACEH SEL ATAN
ACEH TIMU R
ACEH BARAT
ACEH BESAR
PIDIE BIREUEN
ACEH BARAT D AYA
GAYO LUES
ACEH TAMIANGNAGAN R AYA
ACEH J AYA
1.9
1.6
33.2
14.4
5.5 3.4
2.4
0.534.1
86.4
NIAS SEL ATAN
NIAS20.6
19.2
Decline in GDP (% )
50 to 9020 to 5010 to 205 to 10Below 5No declin eNo dat a
Source: World Bank staff estimates.
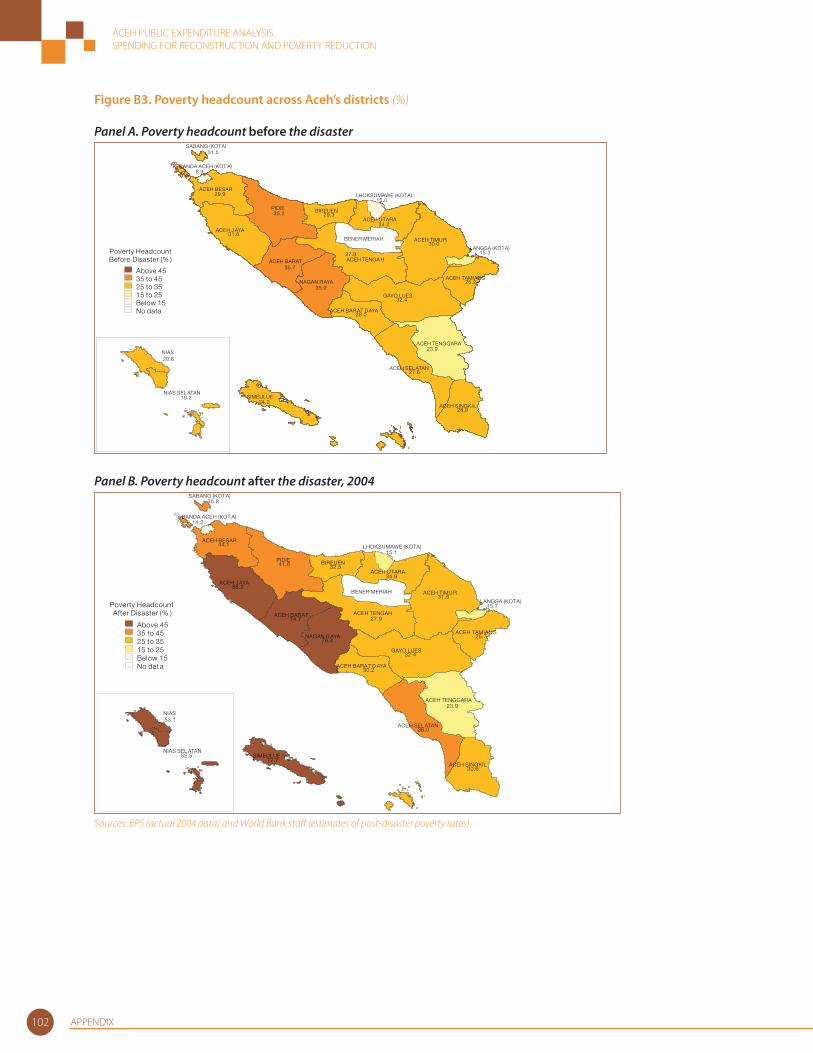
ACEH PUBLIC EXPENDITURE ANALYSISSPENDING FOR RECONSTRUCTION AND POVERTY REDUCTION
APPENDIX102
Figure B3. Poverty headcount across Aceh’s districts (%)
Panel A. Poverty headcount before the disaster
ACEH TENGGARA
ACEH TENGA H
BENER MERIAH
ACEH UTARA
SIMEULUE
LHOKSUMAWE (KOTA)
LANGSA (KOTA)
BANDA ACEH (KOT A)
SABANG (KOTA)
29.9
35.2
35.9
35.7
34.3
31.6
27.9
27.6
28.9
8.9
34.2
15.0
15.3
30.0
28.0
25.2
32.4
23.9
29.3
31.5
ACEH SINGKI L
ACEH SEL ATAN
ACEH TIMU R
ACEH BARAT
ACEH BESAR
PIDIE BIREUEN
ACEH BAR AT DAYA
GAYO LUES
ACEH TAMIANGNAGAN R AYA
ACEH J AYA
NIAS SEL ATAN
NIAS
19.2
20.6
Poverty HeadcountBefore Disaster (% )
Above 4535 to 45 25 to 3515 to 25Below 15No data
Panel B. Poverty headcount after the disaster, 2004
SIMEULUE
ACEH TENGGARA
ACEH TENGAH
BENER MERIAH
ACEH UTARA
LHOKSUMAWE (KOTA)
LANGSA (KOTA)
BANDA ACEH (KOT A)
SABANG (KOTA)
72.7
36.0
23.9
27.9
32.4
14.2
15.1
34.9
15.7
35.8
ACEH SINGKIL
ACEH SEL ATAN
ACEH TIMU R
ACEH BARAT
ACEH BESAR
PIDIE BIREUEN
ACEH BARAT D AYA
GAYO LUES
ACEH TAMIANGNAGAN R AYA
ACEH J AYA
30.6
31.6
74.7
44.1
41.6 32.5
30.2
25.776.4
86.2
NIAS SEL ATAN
NIAS
52.5
53.1
Poverty HeadcountAfter Disaster (% )
Above 4535 to 4525 to 3515 to 25Below 15No dat a
Sources: BPS (actual 2004 data) and World Bank staff (estimates of post-disaster poverty rates).

ACEH PUBLIC EXPENDITURE ANALYSISSPENDING FOR RECONSTRUCTION AND POVERTY REDUCTION
APPENDIX 103
Figure B4. Budget preparation process
June : Regional government submits general policy of APBD to regional parliament (DPRD) Executive budget
committee
October-November : Discussion of draft Perda of APBD
January–May :Formulation of a regional work plan (RKPD) as a basis for the general policy of regional government budget (APBD)
September-October : Evaluation of line agencies’ budget proposals and preparation of draft regional regulation (Perda) of APBD
First week of October : Regional government submits a draft Perda of APBD to DPRD
Discussion of general policy of APBD
General policy of APBD agreed
September-OctoberLine agencies in region prepare work programs and
November-December:APBD approved
December : APBD is formalized through passage of regional regulation
July-August : Regional government and DPRD discusses priorities and budget ceilings
Becomes reference for line agencies in region
budget estimates for following year
Source: DG Budget and Fiscal Balance-MoF based on Law 17/2003, Law 15/2004, Law 32/2004, Law 33/2004, Kepmen 29/2002.
Figure B5. Budget evaluation
July: First semester realization and estimates for second semester presented to DPRD
Local government presents draft Perda on revised APBD to DPRD to be approved at least three months prior end of the fiscal year concerned
APBD realization is submitted to National Audit Agency (BPK) at the latest three months after end of fiscal year concerned
BPK to audit APBD realization within two months after receiving ABPD report
Head of region submits draft Perda on accountability report of APBD to DPRD for approval at the latest six months after end of fiscal year concerned
Sources: Law 15/2004, Law 17.2003, PP 58/2005, PP 56/2005.

ACEH PUBLIC EXPENDITURE ANALYSISSPENDING FOR RECONSTRUCTION AND POVERTY REDUCTION
APPENDIX104
Figure B6. Composition of natural resources revenue-sharing, pre- and post-decentralization, 1994–2005 (% of total natural resources revenue-sharing)
0%
20%
40%
60%
80%
100%
1994 1995 1996 1997 1998 1999 2001 2002 2003 2004 2005
Forestry-resource rent (IHH)/(PSDH) Forestry-land rent (IHPH) Mining-land rentMining-royalty Mining exploration fee Fishery corporation feeFishery resource fee Oil GasState land right issue Others
Source: World Bank staff calculations based on data from SIKD/MoF.
Figure B7. Change in DAU allocation, 2005–06 (%)
Kab. Aceh Utara
Kab. Simeulue
Kab. Aceh Singkil
Kab. Aceh Selatan
Kab. Aceh Tenggara
Kab. Bener Meriah
Kab. Aceh Tengah
Kota Banda Aceh
Kota Langsa
Kota Lhokseumawe
Kab. Aceh Timur
Kab. Aceh Barat
Kab. Aceh Besar
Kab. Aceh Pidie Kab. Bireuen
Kab. Aceh Barat Daya
Kab. Gayo Lues
Kab. Aceh TamiangKab. Nagan Raya
Kab. Aceh Jaya
Kota Sabang
Change in DAU Allocations 2005-2006 (%)Source: Ministry of Finance
160 to 606 (1)80 to 160 (1)60 to 80 (11)50 to 60 (4)20 to 50 (3)
No change (hold harmless) to 20 (1)
Source: MoF and World Bank staff calculations.
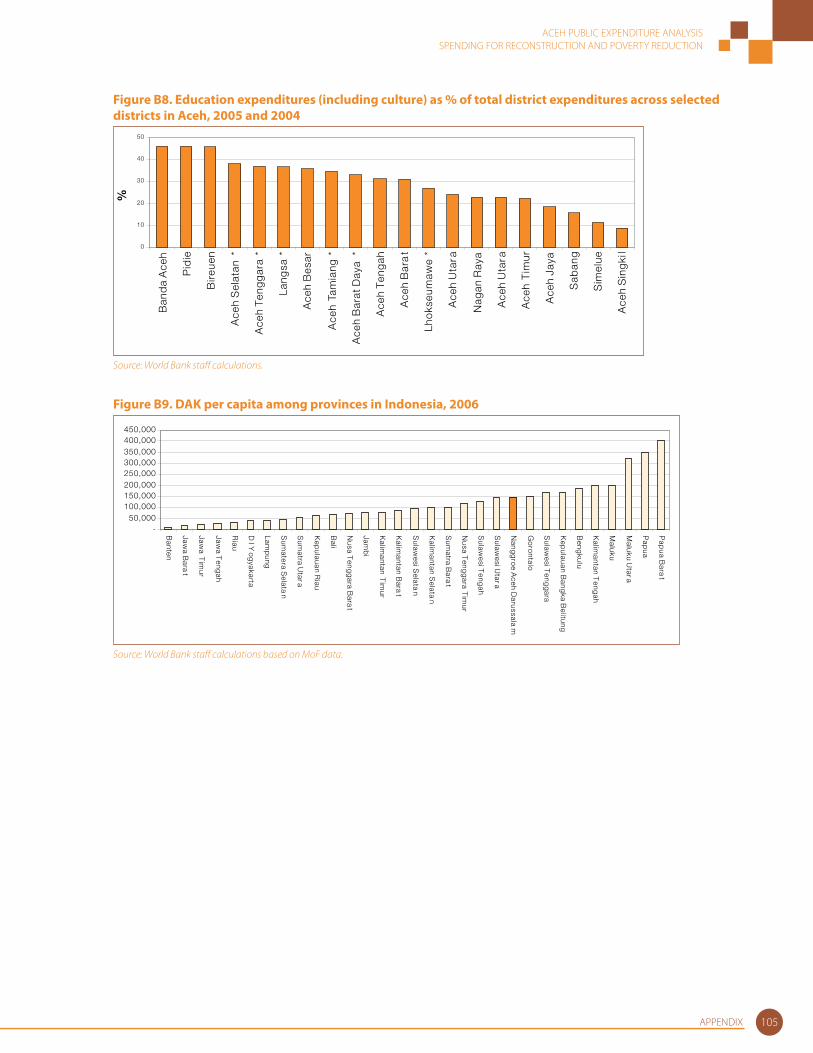
ACEH PUBLIC EXPENDITURE ANALYSISSPENDING FOR RECONSTRUCTION AND POVERTY REDUCTION
APPENDIX 105
Figure B8. Education expenditures (including culture) as % of total district expenditures across selected districts in Aceh, 2005 and 2004
0
10
20
30
40
50
Ban
da
Ace
h
Pid
ie
Bire
uen
Ace
h S
elat
an *
Ace
h T
eng
gar
a *
Lang
sa *
Ace
h B
esar
Ace
h Ta
mia
ng *
Ace
h B
arat
Day
a *
Ace
h T
eng
ah
Ace
h B
ara
t
Lho
kseu
maw
e *
Ace
h U
tara
Nag
an R
aya
Ace
h U
tara
Ace
h T
imur
Ace
h Ja
ya
Sab
ang
Sim
elue
Ace
h S
ing
kil
%
Source: World Bank staff calculations.
Figure B9. DAK per capita among provinces in Indonesia, 2006
-50,000
100,000150,000200,000250,000300,000350,000400,000450,000
Banten
Jawa B
arat
Jawa T
imur
Jawa T
engah
Riau
D I Y
og
yakarta
Lamp
ung
Sum
atera Selata
n
Sum
atra Utara
Kep
ulauan Riau
Bali
Nusa T
engg
ara Bara
t
Jamb
i
Kalim
antan Tim
ur
Kalim
antan Bara
t
Sulaw
esi Selata
n
Kalim
antan Selata
n
Sum
atra Bara
t
Nusa T
engg
ara Tim
ur
Sulaw
esi Teng
ah
Sulaw
esi Utara
Nang
gro
e Aceh D
arussalam
Go
rontalo
Sulaw
esi Teng
gara
Kep
ulauan Bang
ka Belitung
Beng
kulu
Kalim
antan Teng
ah
Maluku
Maluku U
tara
Pap
ua
Pap
ua Bara
t
Source: World Bank staff calculations based on MoF data.
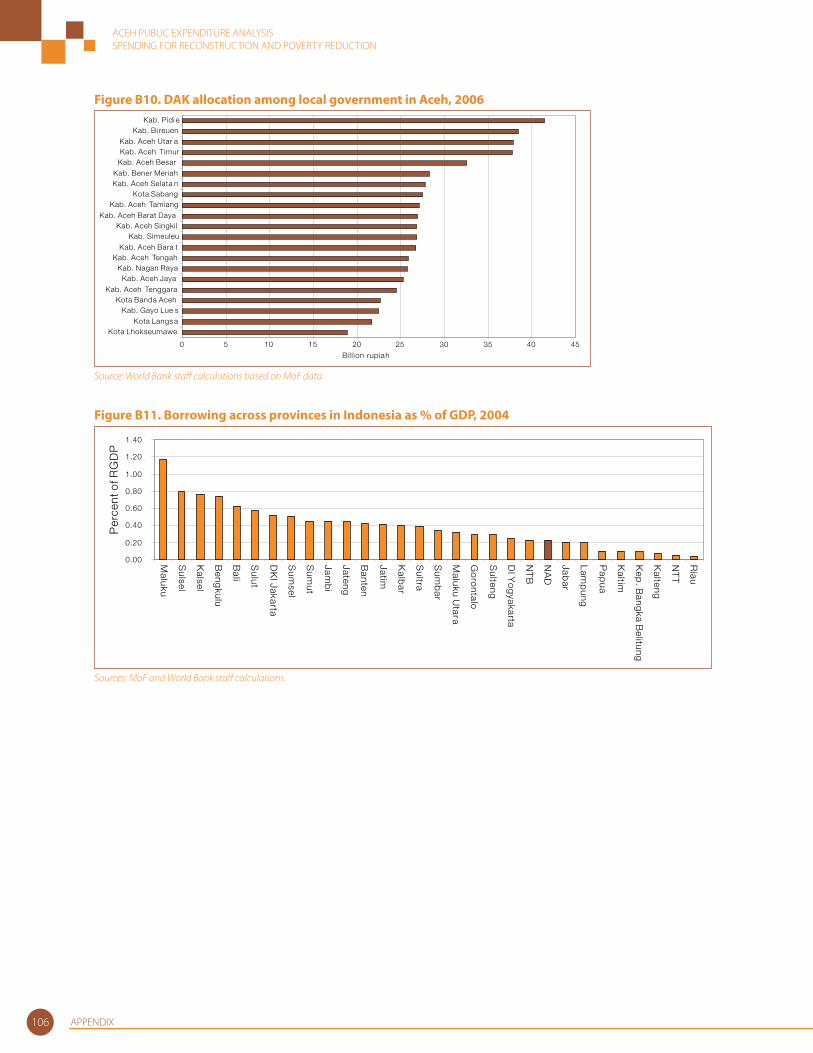
ACEH PUBLIC EXPENDITURE ANALYSISSPENDING FOR RECONSTRUCTION AND POVERTY REDUCTION
APPENDIX106
Figure B10. DAK allocation among local government in Aceh, 2006
0 5 10 15 20 25 30 35 40 45
Kota LhokseumaweKota Langs a
Kab. Gayo Lue sKota Banda Aceh
Kab. Aceh TenggaraKab. Aceh Jaya
Kab. Nagan RayaKab. Aceh Tengah
Kab. Aceh Bara tKab. Simeuleu
Kab. Aceh SingkilKab. Aceh Barat Daya
Kab. Aceh TamiangKota Sabang
Kab. Aceh Selata nKab. Bener Meriah
Kab. Aceh BesarKab. Aceh TimurKab. Aceh Utar a
Kab. Bi reuenKab. Pidi e
Bil l ion rupiah
Source: World Bank staff calculations based on MoF data.
Figure B11. Borrowing across provinces in Indonesia as % of GDP, 2004
0.00
0.20
0.40
0.60
0.80
1.00
1.20
1.40
Maluku
Sulsel
Kalsel
Beng
kulu
Bali
Sulut
DK
I Jakarta
Sum
sel
Sum
ut
Jamb
i
Jateng
Banten
Jatim
Kalb
ar
Sultra
Sum
bar
Maluku U
tara
Go
rontalo
Sulteng
DI Y
og
yakarta
NT
B
NA
D
Jabar
Lamp
ung
Pap
ua
Kaltim
Kep
. Bang
ka Belitung
Kalteng
NT
T
Riau
Per
cent
of R
GD
P
Sources: MoF and World Bank staff calculations.
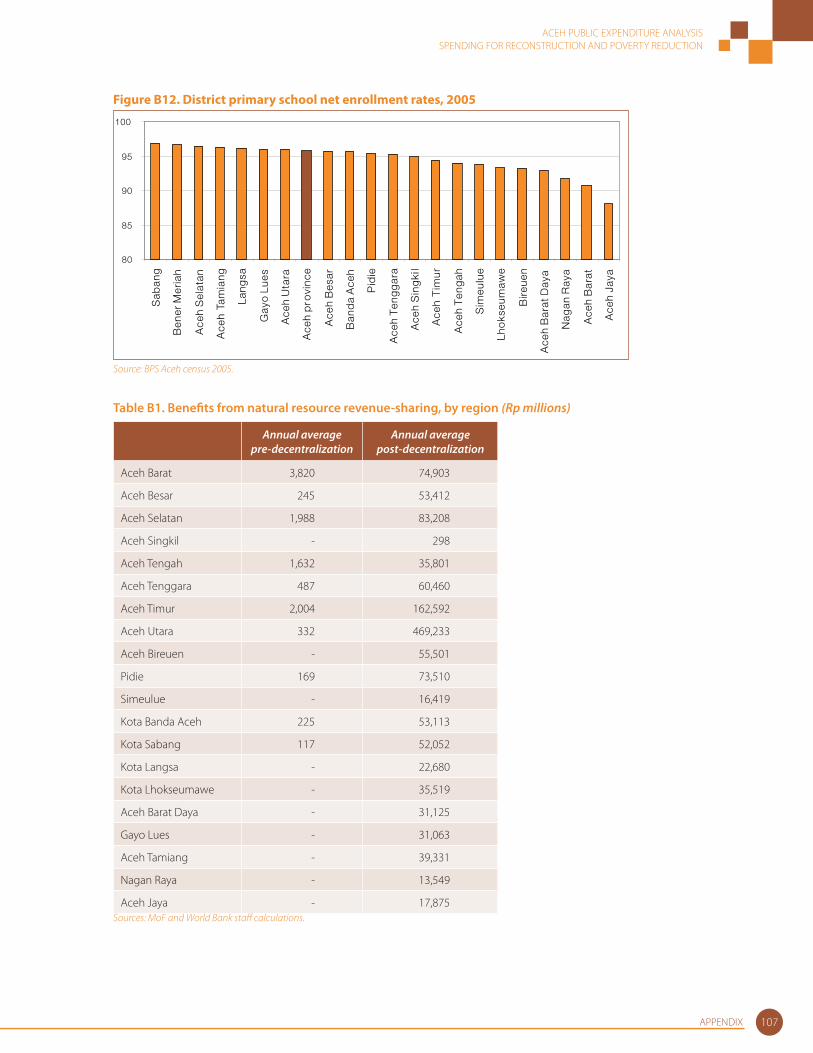
ACEH PUBLIC EXPENDITURE ANALYSISSPENDING FOR RECONSTRUCTION AND POVERTY REDUCTION
APPENDIX 107
Figure B12. District primary school net enrollment rates, 2005
80
85
90
95
100
Sab
ang
Ben
er M
eria
h
Ace
h S
elat
an
Ace
h Ta
mia
ng
Lang
sa
Gay
o Lu
es
Ace
h U
tara
Ace
h p
rovi
nce
Ace
h B
esar
Ban
da
Ace
h
Pid
ie
Ace
h T
eng
gar
a
Ace
h S
ing
kil
Ace
h T
imur
Ace
h T
eng
ah
Sim
eulu
e
Lho
kseu
maw
e
Bire
uen
Ace
h B
arat
Day
a
Nag
an R
aya
Ace
h B
arat
Ace
h Ja
ya
Source: BPS Aceh census 2005.
Table B1. Benefi ts from natural resource revenue-sharing, by region (Rp millions)
Annual average pre-decentralization
Annual average post-decentralization
Aceh Barat 3,820 74,903
Aceh Besar 245 53,412
Aceh Selatan 1,988 83,208
Aceh Singkil - 298
Aceh Tengah 1,632 35,801
Aceh Tenggara 487 60,460
Aceh Timur 2,004 162,592
Aceh Utara 332 469,233
Aceh Bireuen - 55,501
Pidie 169 73,510
Simeulue - 16,419
Kota Banda Aceh 225 53,113
Kota Sabang 117 52,052
Kota Langsa - 22,680
Kota Lhokseumawe - 35,519
Aceh Barat Daya - 31,125
Gayo Lues - 31,063
Aceh Tamiang - 39,331
Nagan Raya - 13,549
Aceh Jaya - 17,875Sources: MoF and World Bank staff calculations.
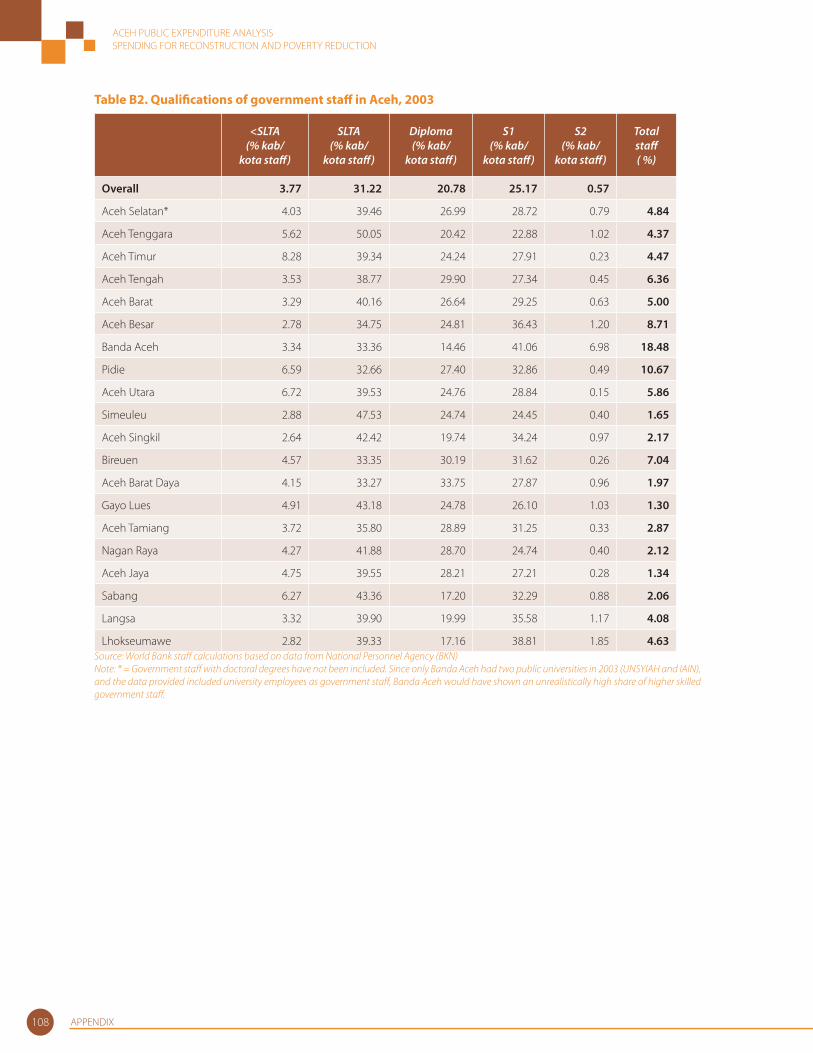
ACEH PUBLIC EXPENDITURE ANALYSISSPENDING FOR RECONSTRUCTION AND POVERTY REDUCTION
APPENDIX108
Table B2. Qualifi cations of government staff in Aceh, 2003
<SLTA(% kab/
kota staff )
SLTA(% kab/
kota staff )
Diploma (% kab/
kota staff )
S1 (% kab/
kota staff )
S2 (% kab/
kota staff )
Total staff ( %)
Overall 3.77 31.22 20.78 25.17 0.57
Aceh Selatan* 4.03 39.46 26.99 28.72 0.79 4.84
Aceh Tenggara 5.62 50.05 20.42 22.88 1.02 4.37
Aceh Timur 8.28 39.34 24.24 27.91 0.23 4.47
Aceh Tengah 3.53 38.77 29.90 27.34 0.45 6.36
Aceh Barat 3.29 40.16 26.64 29.25 0.63 5.00
Aceh Besar 2.78 34.75 24.81 36.43 1.20 8.71
Banda Aceh 3.34 33.36 14.46 41.06 6.98 18.48
Pidie 6.59 32.66 27.40 32.86 0.49 10.67
Aceh Utara 6.72 39.53 24.76 28.84 0.15 5.86
Simeuleu 2.88 47.53 24.74 24.45 0.40 1.65
Aceh Singkil 2.64 42.42 19.74 34.24 0.97 2.17
Bireuen 4.57 33.35 30.19 31.62 0.26 7.04
Aceh Barat Daya 4.15 33.27 33.75 27.87 0.96 1.97
Gayo Lues 4.91 43.18 24.78 26.10 1.03 1.30
Aceh Tamiang 3.72 35.80 28.89 31.25 0.33 2.87
Nagan Raya 4.27 41.88 28.70 24.74 0.40 2.12
Aceh Jaya 4.75 39.55 28.21 27.21 0.28 1.34
Sabang 6.27 43.36 17.20 32.29 0.88 2.06
Langsa 3.32 39.90 19.99 35.58 1.17 4.08
Lhokseumawe 2.82 39.33 17.16 38.81 1.85 4.63 Source: World Bank staff calculations based on data from National Personnel Agency (BKN)Note: * = Government staff with doctoral degrees have not been included. Since only Banda Aceh had two public universities in 2003 (UNSYIAH and IAIN), and the data provided included university employees as government staff , Banda Aceh would have shown an unrealistically high share of higher skilled government staff .

ACEH PUBLIC EXPENDITURE ANALYSISSPENDING FOR RECONSTRUCTION AND POVERTY REDUCTION
APPENDIX 109
Appendix C. Methodological Notes
C.1 Provincial and Local Government Budget (APBD)
Provincial and local government budget (Anggaran Pendapatan dan Belanja Daerah/APBD) is the yearly budget allocated and/or spent by provincial and local governments. The budget consists of two categories: planned (proposal for parliament approval) and realization (actual spending or accountability report of the head of the region). Data span from 1994 to 2006 from several sources. For 1994–99, data was provided by BPS. For 2000–04, data was derived from MoF’s Regional Financial Information System (Sistem Informasi Keuangan Daerah, or SIKD). Data for 2005 was obtained from provincial and local governments in Aceh. A projection is made for 2006 numbers.
Since decentralization, regional governments have the legal obligation to submit APBD data to the Ministry of Finance (SIKD) in a timely manner. Central government can impose sanctions by withholding the DAU transfer if a local government fails to submit on time. However, many local governments do not submit their budgets to MoF. In 2003, 334 of 370 total local governments in Indonesia submitted their APBD report to the MoF. In Aceh, only 10 of 20 local governments submitted their APBD reports in 2003, and 12 of 21 in 2004. The MoF complemented missing SIKD data by collecting data directly from provincial and local governments.
To obtain the aggregate picture of revenue and expenditure of provincial and local government in Aceh, missing data for certain districts and years were projected using the shares of RGDP (Regional Gross Domestic Product) of missing local governments as an infl ation factor. The real value of the time series was calculated using a projection for the 2006 CPI.
C.2 Aceh Revenue Projection (2006–11) and Sensitivity of Oil Price Simulation
The projection is based on some macro assumptions, such as economic growth, fi scal growth, infl ation rate, and oil price, that link to the central government budget projection. The oil price simulations are based on 3 scenarios: low (US$50/brl), moderate (US$60/brl), and high (US$75/brl) oil prices.
Natural resources revenue-sharing and General Allocation Fund (DAU) are two main components of revenue that use oil prices and sensitivity simulations. A weighted share is given to gas and oil revenue in Aceh using gas production data. For DAU, it is assumed that Aceh receives a 3 percent share from regular national DAU allocation (average yearly allocation). An additional 2 percent will be allocated starting in 2008 based on the new law 11/2006. For other revenue components, which consist of own-source revenue, specifi c allocation fund, and other revenue, the projection is based on the 5 percent growth assumption.
C.3 Borrowing Simulation
The objective of the simulation is to see the borrowing capability as well as the borrowing ceiling of regional government in Aceh. The simulation is based on Law 33/2004 on Fiscal Balance between Central and Regional Government and Government Regulation PP 54/2005 on Regional Borrowing.
The regulation stipulates that regional government needs to meet the following requirements to have a medium- and long-term loan: (1) the remaining borrowing of regional government plus the intended borrowing amount is not greater than 75 percent of regional budget general revenue of the previous year; (2) the projection ratio of regional government fi nancial capacity in returning the loan is at a minimum of 2.5; (3) regional government does not have any arrears on any loan that comes from central government, and (4) the loan is approved by regional parliament.
Based on the regulation, the borrowing ceiling simulation for the Aceh regional government in 2004 was reached by:
1. Multiplying the general revenue of regional government from 2003 by 0.75. General revenue consists of all revenue components except the specifi c allocation fund (DAK), emergency fund, old loans, and other revenue.
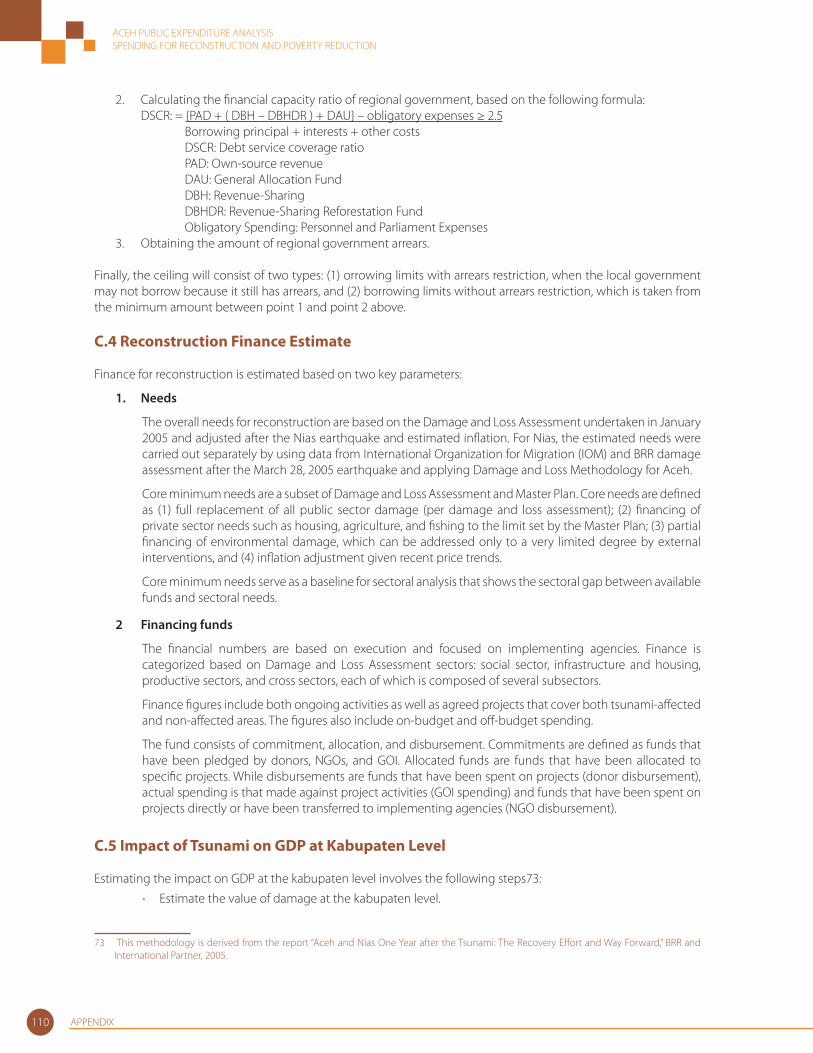
ACEH PUBLIC EXPENDITURE ANALYSISSPENDING FOR RECONSTRUCTION AND POVERTY REDUCTION
APPENDIX110
2. Calculating the fi nancial capacity ratio of regional government, based on the following formula: DSCR: = {PAD + ( DBH – DBHDR ) + DAU} – obligatory expenses ≥ 2.5 Borrowing principal + interests + other costs
DSCR: Debt service coverage ratio PAD: Own-source revenue DAU: General Allocation Fund DBH: Revenue-Sharing DBHDR: Revenue-Sharing Reforestation Fund Obligatory Spending: Personnel and Parliament Expenses
3. Obtaining the amount of regional government arrears.
Finally, the ceiling will consist of two types: (1) orrowing limits with arrears restriction, when the local government may not borrow because it still has arrears, and (2) borrowing limits without arrears restriction, which is taken from the minimum amount between point 1 and point 2 above.
C.4 Reconstruction Finance Estimate Finance for reconstruction is estimated based on two key parameters:
1. Needs
The overall needs for reconstruction are based on the Damage and Loss Assessment undertaken in January 2005 and adjusted after the Nias earthquake and estimated infl ation. For Nias, the estimated needs were carried out separately by using data from International Organization for Migration (IOM) and BRR damage assessment after the March 28, 2005 earthquake and applying Damage and Loss Methodology for Aceh.
Core minimum needs are a subset of Damage and Loss Assessment and Master Plan. Core needs are defi ned as (1) full replacement of all public sector damage (per damage and loss assessment); (2) fi nancing of private sector needs such as housing, agriculture, and fi shing to the limit set by the Master Plan; (3) partial fi nancing of environmental damage, which can be addressed only to a very limited degree by external interventions, and (4) infl ation adjustment given recent price trends.
Core minimum needs serve as a baseline for sectoral analysis that shows the sectoral gap between available funds and sectoral needs.
2 Financing funds The fi nancial numbers are based on execution and focused on implementing agencies. Finance is categorized based on Damage and Loss Assessment sectors: social sector, infrastructure and housing, productive sectors, and cross sectors, each of which is composed of several subsectors.
Finance fi gures include both ongoing activities as well as agreed projects that cover both tsunami-aff ected and non-aff ected areas. The fi gures also include on-budget and off -budget spending.
The fund consists of commitment, allocation, and disbursement. Commitments are defi ned as funds that have been pledged by donors, NGOs, and GOI. Allocated funds are funds that have been allocated to specifi c projects. While disbursements are funds that have been spent on projects (donor disbursement), actual spending is that made against project activities (GOI spending) and funds that have been spent on projects directly or have been transferred to implementing agencies (NGO disbursement).
C.5 Impact of Tsunami on GDP at Kabupaten Level
Estimating the impact on GDP at the kabupaten level involves the following steps73:
Estimate the value of damage at the kabupaten level.
73 This methodology is derived from the report “Aceh and Nias One Year after the Tsunami: The Recovery Eff ort and Way Forward,” BRR and International Partner, 2005.
•
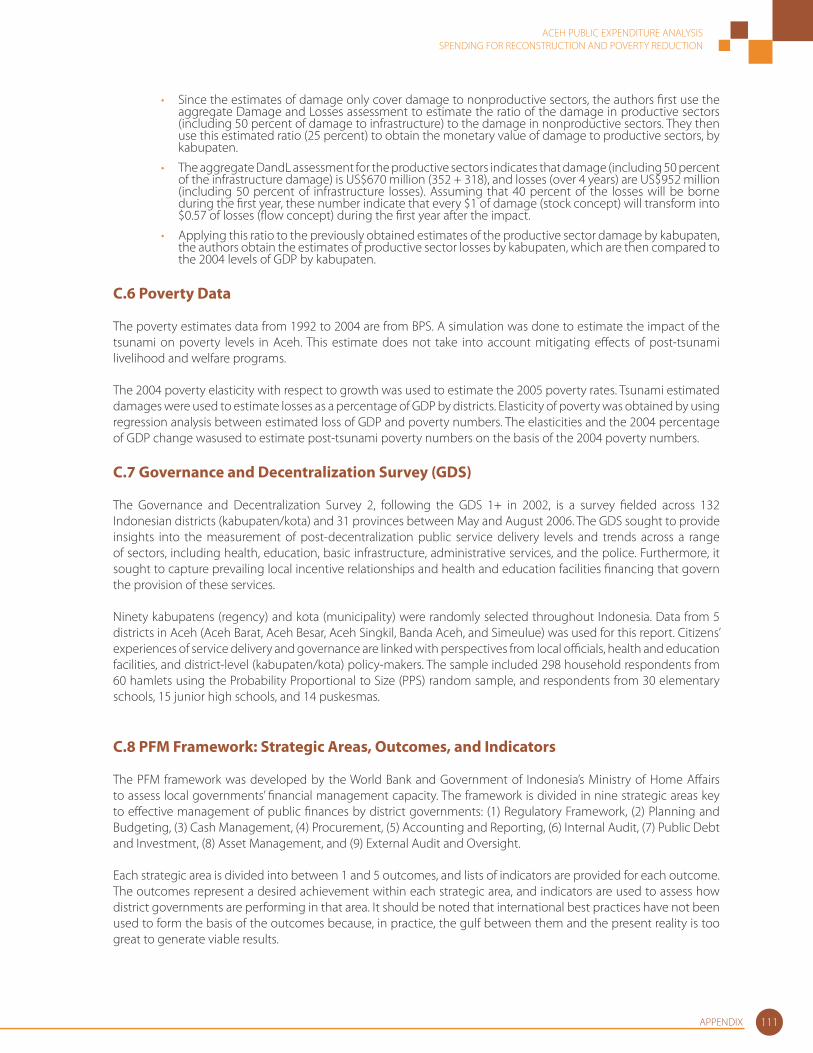
ACEH PUBLIC EXPENDITURE ANALYSISSPENDING FOR RECONSTRUCTION AND POVERTY REDUCTION
APPENDIX 111
Since the estimates of damage only cover damage to nonproductive sectors, the authors fi rst use the aggregate Damage and Losses assessment to estimate the ratio of the damage in productive sectors (including 50 percent of damage to infrastructure) to the damage in nonproductive sectors. They then use this estimated ratio (25 percent) to obtain the monetary value of damage to productive sectors, by kabupaten.
The aggregate DandL assessment for the productive sectors indicates that damage (including 50 percent of the infrastructure damage) is US$670 million (352 + 318), and losses (over 4 years) are US$952 million (including 50 percent of infrastructure losses). Assuming that 40 percent of the losses will be borne during the fi rst year, these number indicate that every $1 of damage (stock concept) will transform into $0.57 of losses (fl ow concept) during the fi rst year after the impact.
Applying this ratio to the previously obtained estimates of the productive sector damage by kabupaten, the authors obtain the estimates of productive sector losses by kabupaten, which are then compared to the 2004 levels of GDP by kabupaten.
C.6 Poverty Data
The poverty estimates data from 1992 to 2004 are from BPS. A simulation was done to estimate the impact of the tsunami on poverty levels in Aceh. This estimate does not take into account mitigating eff ects of post-tsunami livelihood and welfare programs.
The 2004 poverty elasticity with respect to growth was used to estimate the 2005 poverty rates. Tsunami estimated damages were used to estimate losses as a percentage of GDP by districts. Elasticity of poverty was obtained by using regression analysis between estimated loss of GDP and poverty numbers. The elasticities and the 2004 percentage of GDP change wasused to estimate post-tsunami poverty numbers on the basis of the 2004 poverty numbers.
C.7 Governance and Decentralization Survey (GDS)
The Governance and Decentralization Survey 2, following the GDS 1+ in 2002, is a survey fi elded across 132 Indonesian districts (kabupaten/kota) and 31 provinces between May and August 2006. The GDS sought to provide insights into the measurement of post-decentralization public service delivery levels and trends across a range of sectors, including health, education, basic infrastructure, administrative services, and the police. Furthermore, it sought to capture prevailing local incentive relationships and health and education facilities fi nancing that govern the provision of these services.
Ninety kabupatens (regency) and kota (municipality) were randomly selected throughout Indonesia. Data from 5 districts in Aceh (Aceh Barat, Aceh Besar, Aceh Singkil, Banda Aceh, and Simeulue) was used for this report. Citizens’ experiences of service delivery and governance are linked with perspectives from local offi cials, health and education facilities, and district-level (kabupaten/kota) policy-makers. The sample included 298 household respondents from 60 hamlets using the Probability Proportional to Size (PPS) random sample, and respondents from 30 elementary schools, 15 junior high schools, and 14 puskesmas.
C.8 PFM Framework: Strategic Areas, Outcomes, and Indicators
The PFM framework was developed by the World Bank and Government of Indonesia’s Ministry of Home Aff airs to assess local governments’ fi nancial management capacity. The framework is divided in nine strategic areas key to eff ective management of public fi nances by district governments: (1) Regulatory Framework, (2) Planning and Budgeting, (3) Cash Management, (4) Procurement, (5) Accounting and Reporting, (6) Internal Audit, (7) Public Debt and Investment, (8) Asset Management, and (9) External Audit and Oversight.
Each strategic area is divided into between 1 and 5 outcomes, and lists of indicators are provided for each outcome. The outcomes represent a desired achievement within each strategic area, and indicators are used to assess how district governments are performing in that area. It should be noted that international best practices have not been used to form the basis of the outcomes because, in practice, the gulf between them and the present reality is too great to generate viable results.
•
•
•
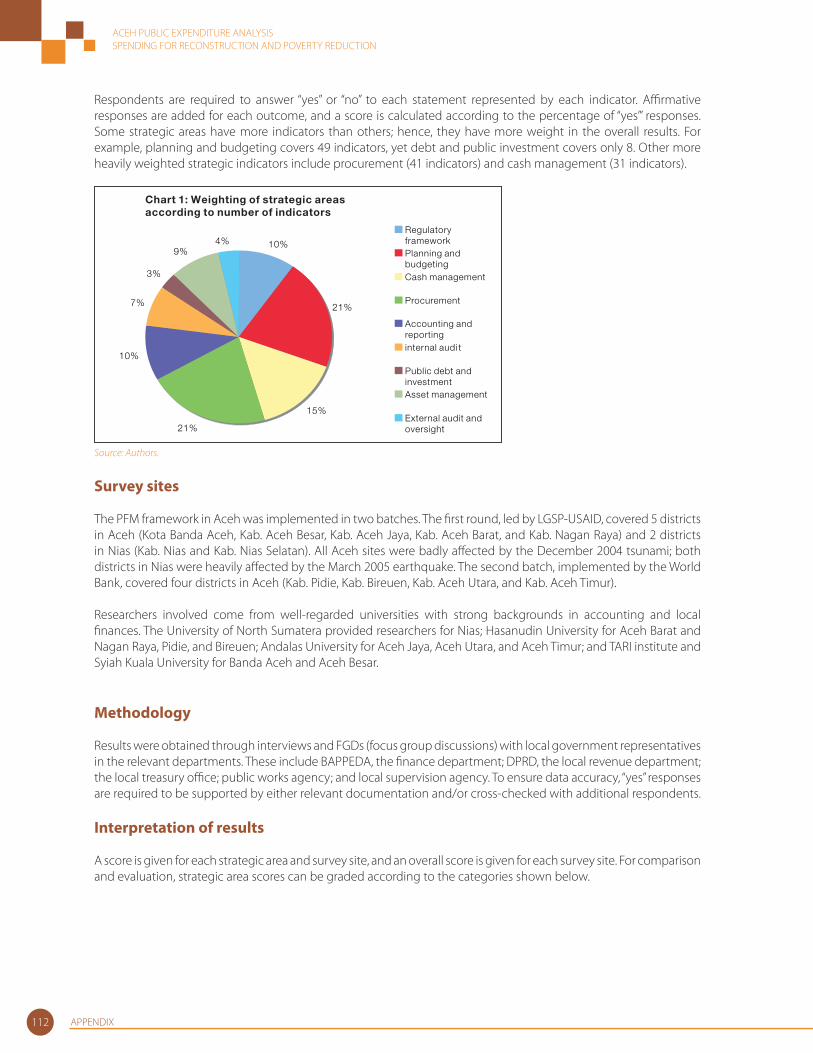
ACEH PUBLIC EXPENDITURE ANALYSISSPENDING FOR RECONSTRUCTION AND POVERTY REDUCTION
APPENDIX112
Respondents are required to answer “yes” or “no” to each statement represented by each indicator. Affi rmative responses are added for each outcome, and a score is calculated according to the percentage of “yes’” responses. Some strategic areas have more indicators than others; hence, they have more weight in the overall results. For example, planning and budgeting covers 49 indicators, yet debt and public investment covers only 8. Other more heavily weighted strategic indicators include procurement (41 indicators) and cash management (31 indicators).
10%
21%
15%
21%
10%
7%
3%
9%4%
RegulatoryframeworkPlanning andbudgetingCash management
Procurement
Accounting andreportinginternal audi t
Public debt andinvestmentAsset management
External audit andoversight
Chart 1: Weighting of strategic areas according to number of indicators
Source: Authors.
Survey sites
The PFM framework in Aceh was implemented in two batches. The fi rst round, led by LGSP-USAID, covered 5 districts in Aceh (Kota Banda Aceh, Kab. Aceh Besar, Kab. Aceh Jaya, Kab. Aceh Barat, and Kab. Nagan Raya) and 2 districts in Nias (Kab. Nias and Kab. Nias Selatan). All Aceh sites were badly aff ected by the December 2004 tsunami; both districts in Nias were heavily aff ected by the March 2005 earthquake. The second batch, implemented by the World Bank, covered four districts in Aceh (Kab. Pidie, Kab. Bireuen, Kab. Aceh Utara, and Kab. Aceh Timur).
Researchers involved come from well-regarded universities with strong backgrounds in accounting and local fi nances. The University of North Sumatera provided researchers for Nias; Hasanudin University for Aceh Barat and Nagan Raya, Pidie, and Bireuen; Andalas University for Aceh Jaya, Aceh Utara, and Aceh Timur; and TARI institute and Syiah Kuala University for Banda Aceh and Aceh Besar.
Methodology
Results were obtained through interviews and FGDs (focus group discussions) with local government representatives in the relevant departments. These include BAPPEDA, the fi nance department; DPRD, the local revenue department; the local treasury offi ce; public works agency; and local supervision agency. To ensure data accuracy, “yes” responses are required to be supported by either relevant documentation and/or cross-checked with additional respondents.
Interpretation of results
A score is given for each strategic area and survey site, and an overall score is given for each survey site. For comparison and evaluation, strategic area scores can be graded according to the categories shown below.

ACEH PUBLIC EXPENDITURE ANALYSISSPENDING FOR RECONSTRUCTION AND POVERTY REDUCTION
APPENDIX 113
Overall score (%)
80–100 Excellent/fully acceptable
60–79 Very good/substantially acceptable
40–59 Good/fairly acceptable
20–39 Moderate/partially acceptable
0–19 Poor/not acceptable
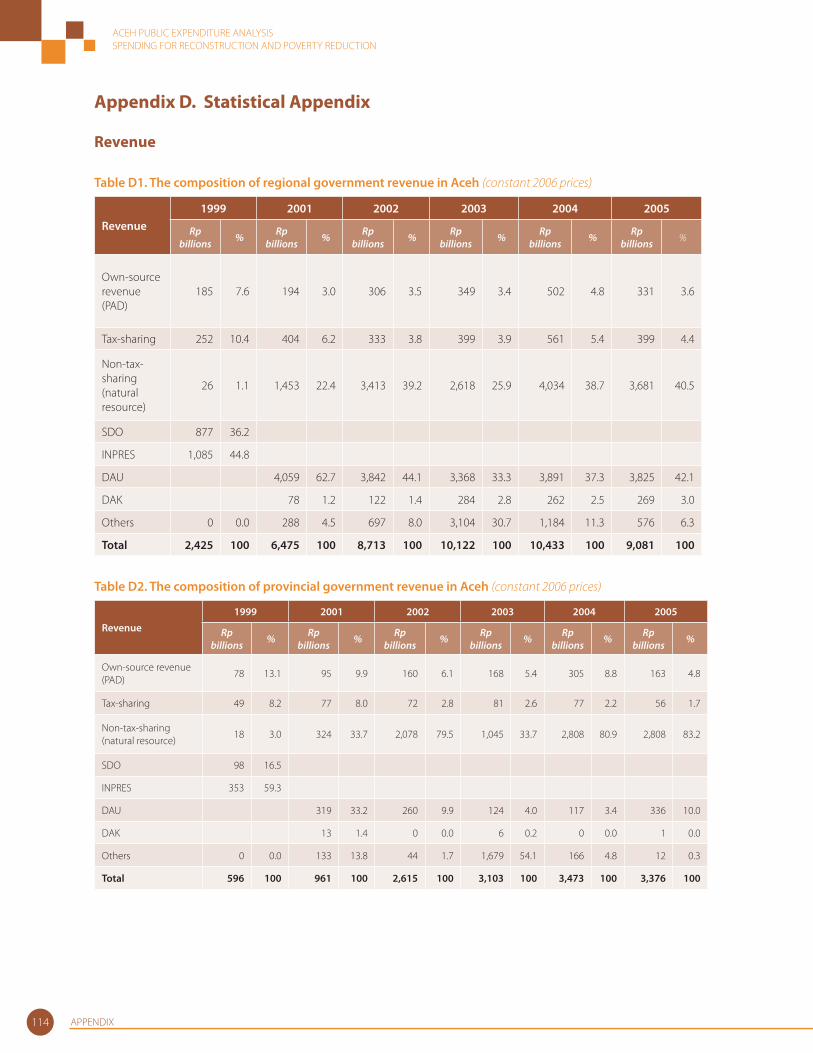
ACEH PUBLIC EXPENDITURE ANALYSISSPENDING FOR RECONSTRUCTION AND POVERTY REDUCTION
APPENDIX114
Appendix D. Statistical Appendix
Revenue
Table D1. The composition of regional government revenue in Aceh (constant 2006 prices)
Revenue
1999 2001 2002 2003 2004 2005
Rp billions % Rp
billions % Rp billions % Rp
billions % Rp billions % Rp
billions %
Own-source revenue (PAD)
185 7.6 194 3.0 306 3.5 349 3.4 502 4.8 331 3.6
Tax-sharing 252 10.4 404 6.2 333 3.8 399 3.9 561 5.4 399 4.4
Non-tax-sharing (natural resource)
26 1.1 1,453 22.4 3,413 39.2 2,618 25.9 4,034 38.7 3,681 40.5
SDO 877 36.2
INPRES 1,085 44.8
DAU 4,059 62.7 3,842 44.1 3,368 33.3 3,891 37.3 3,825 42.1
DAK 78 1.2 122 1.4 284 2.8 262 2.5 269 3.0
Others 0 0.0 288 4.5 697 8.0 3,104 30.7 1,184 11.3 576 6.3
Total 2,425 100 6,475 100 8,713 100 10,122 100 10,433 100 9,081 100
Table D2. The composition of provincial government revenue in Aceh (constant 2006 prices)
Revenue
1999 2001 2002 2003 2004 2005
Rp billions % Rp
billions % Rp billions % Rp
billions % Rpbillions % Rp
billions %
Own-source revenue (PAD)
78 13.1 95 9.9 160 6.1 168 5.4 305 8.8 163 4.8
Tax-sharing 49 8.2 77 8.0 72 2.8 81 2.6 77 2.2 56 1.7
Non-tax-sharing (natural resource)
18 3.0 324 33.7 2,078 79.5 1,045 33.7 2,808 80.9 2,808 83.2
SDO 98 16.5
INPRES 353 59.3
DAU 319 33.2 260 9.9 124 4.0 117 3.4 336 10.0
DAK 13 1.4 0 0.0 6 0.2 0 0.0 1 0.0
Others 0 0.0 133 13.8 44 1.7 1,679 54.1 166 4.8 12 0.3
Total 596 100 961 100 2,615 100 3,103 100 3,473 100 3,376 100
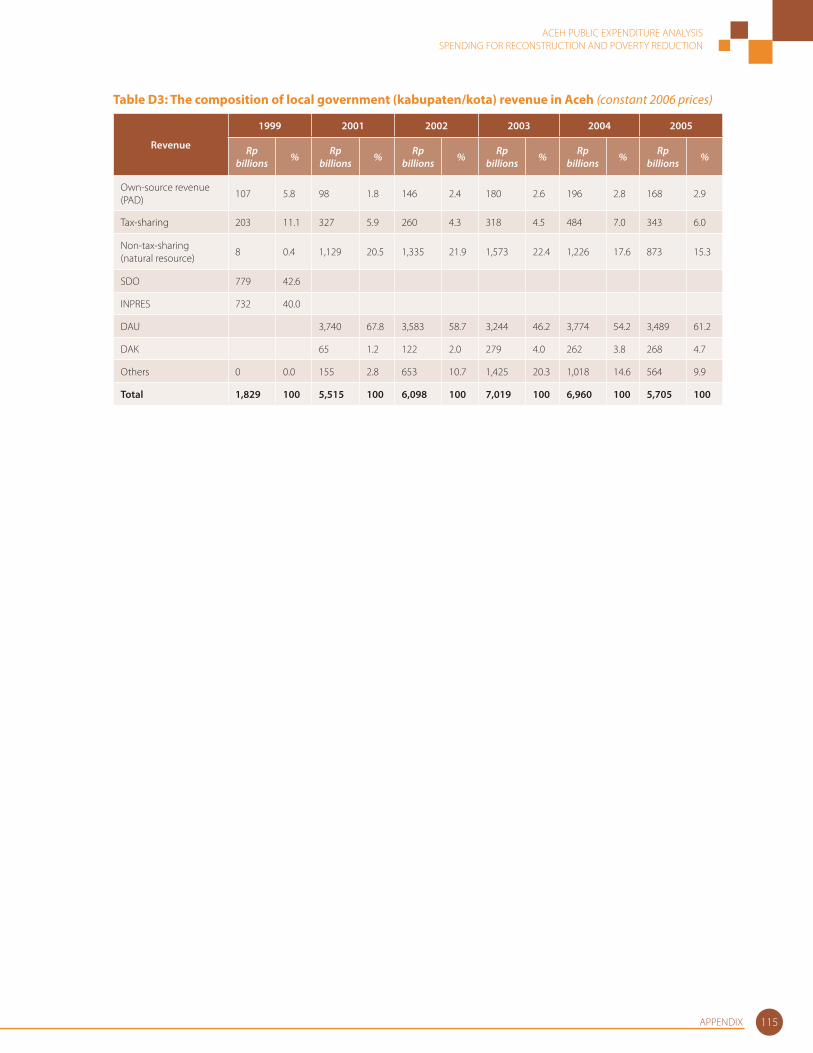
ACEH PUBLIC EXPENDITURE ANALYSISSPENDING FOR RECONSTRUCTION AND POVERTY REDUCTION
APPENDIX 115
Table D3: The composition of local government (kabupaten/kota) revenue in Aceh (constant 2006 prices)
Revenue
1999 2001 2002 2003 2004 2005
Rp billions % Rp
billions % Rp billions % Rp
billions % Rpbillions % Rp
billions %
Own-source revenue (PAD)
107 5.8 98 1.8 146 2.4 180 2.6 196 2.8 168 2.9
Tax-sharing 203 11.1 327 5.9 260 4.3 318 4.5 484 7.0 343 6.0
Non-tax-sharing (natural resource)
8 0.4 1,129 20.5 1,335 21.9 1,573 22.4 1,226 17.6 873 15.3
SDO 779 42.6
INPRES 732 40.0
DAU 3,740 67.8 3,583 58.7 3,244 46.2 3,774 54.2 3,489 61.2
DAK 65 1.2 122 2.0 279 4.0 262 3.8 268 4.7
Others 0 0.0 155 2.8 653 10.7 1,425 20.3 1,018 14.6 564 9.9
Total 1,829 100 5,515 100 6,098 100 7,019 100 6,960 100 5,705 100
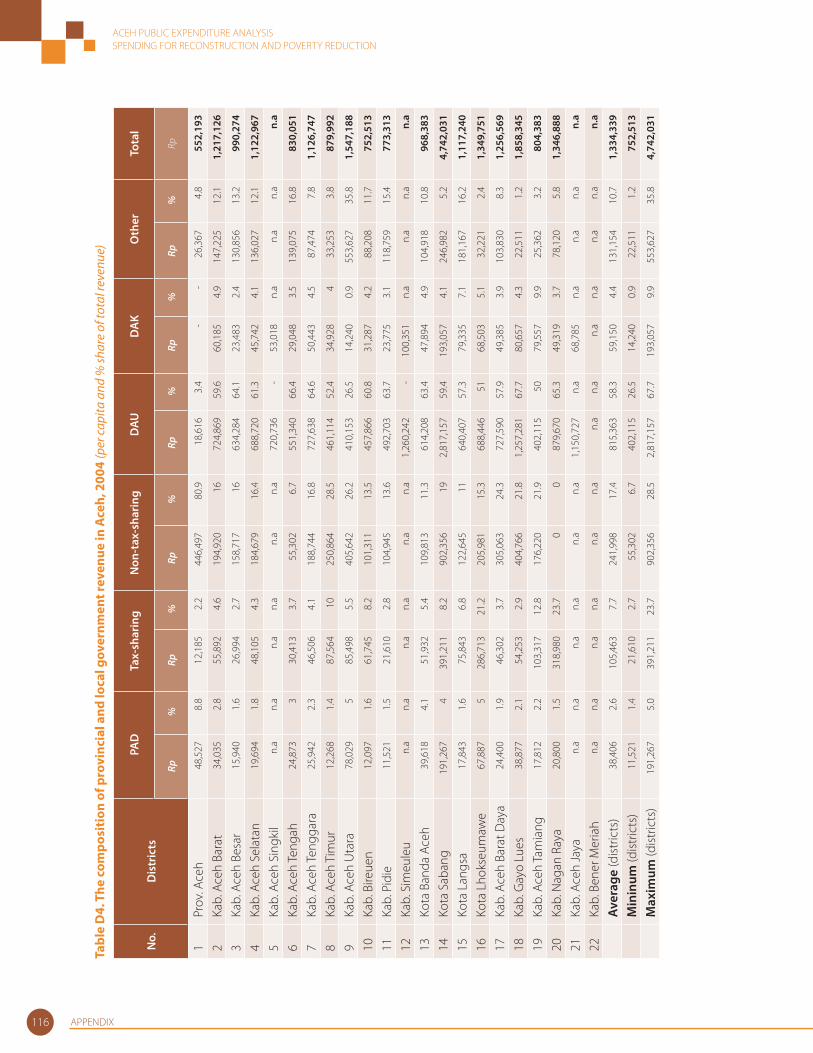
ACEH PUBLIC EXPENDITURE ANALYSISSPENDING FOR RECONSTRUCTION AND POVERTY REDUCTION
APPENDIX116
Tabl
e D
4. T
he c
ompo
siti
on o
f pro
vinc
ial a
nd lo
cal g
over
nmen
t rev
enue
in A
ceh,
200
4 (p
er ca
pita
and
% sh
are
of to
tal r
even
ue)
No.
Dis
tric
tsPA
DTa
x-sh
arin
gN
on-t
ax-s
hari
ngD
AUD
AK
Oth
erTo
tal
Rp %
Rp %
Rp %
Rp %
Rp %
Rp %
Rp
1Pr
ov. A
ceh
48,5
278.
812
,185
2.2
446,
497
80.9
18,6
163.
4-
-26
,367
4.8
552,
193
2Ka
b. A
ceh
Bara
t34
,035
2.8
55,8
924.
619
4,92
016
724,
869
59.6
60,1
854.
914
7,22
512
.11,
217,
126
3Ka
b. A
ceh
Besa
r15
,940
1.6
26,9
942.
715
8,71
716
634,
284
64.1
23,4
832.
413
0,85
613
.299
0,27
4
4Ka
b. A
ceh
Sela
tan
19,6
941.
848
,105
4.3
184,
679
16.4
688,
720
61.3
45,7
424.
113
6,02
712
.11,
122,
967
5Ka
b. A
ceh
Sing
kil
n.a
n.a
n.a
n.a
n.a
n.a
720,
736
-53
,018
n.a
n.a
n.a
n.a
6Ka
b. A
ceh
Teng
ah
24,8
733
30,4
133.
755
,302
6.7
551,
340
66.4
29,0
483.
513
9,07
516
.883
0,05
1
7Ka
b. A
ceh
Teng
gara
25,9
422.
346
,506
4.1
188,
744
16.8
727,
638
64.6
50,4
434.
587
,474
7.8
1,12
6,74
7
8Ka
b. A
ceh
Tim
ur12
,268
1.4
87,5
6410
250,
864
28.5
461,
114
52.4
34,9
284
33,2
533.
887
9,99
2
9Ka
b. A
ceh
Uta
ra78
,029
585
,498
5.5
405,
642
26.2
410,
153
26.5
14,2
400.
955
3,62
735
.81,
547,
188
10Ka
b. B
ireue
n12
,097
1.6
61,7
458.
210
1,31
113
.545
7,86
660
.831
,287
4.2
88,2
0811
.775
2,51
3
11Ka
b. P
idie
11,5
211.
521
,610
2.8
104,
945
13.6
492,
703
63.7
23,7
753.
111
8,75
915
.477
3,31
3
12Ka
b. S
imeu
leu
n.a
n.a
n.a
n.a
n.a
n.a
1,26
0,24
2-
100,
351
n.a
n.a
n.a
n.a
13Ko
ta B
anda
Ace
h39
,618
4.1
51,9
325.
410
9,81
311
.361
4,20
863
.447
,894
4.9
104,
918
10.8
968,
383
14Ko
ta S
aban
g19
1,26
74
391,
211
8.2
902,
356
192,
817,
157
59.4
193,
057
4.1
246,
982
5.2
4,74
2,03
1
15Ko
ta L
angs
a17
,843
1.6
75,8
436.
812
2,64
511
640,
407
57.3
79,3
357.
118
1,16
716
.21,
117,
240
16Ko
ta L
hoks
eum
awe
67,8
875
286,
713
21.2
205,
981
15.3
688,
446
5168
,503
5.1
32,2
212.
41,
349,
751
17Ka
b. A
ceh
Bara
t Day
a24
,400
1.9
46,3
023.
730
5,06
324
.372
7,59
057
.949
,385
3.9
103,
830
8.3
1,25
6,56
9
18Ka
b. G
ayo
Lues
38,8
772.
154
,253
2.9
404,
766
21.8
1,25
7,28
167
.780
,657
4.3
22,5
111.
21,
858,
345
19Ka
b. A
ceh
Tam
iang
17,8
122.
210
3,31
712
.817
6,22
021
.940
2,11
550
79,5
579.
925
,362
3.2
804,
383
20Ka
b. N
agan
Ray
a20
,800
1.5
318,
980
23.7
00
879,
670
65.3
49,3
193.
778
,120
5.8
1,34
6,88
8
21Ka
b. A
ceh
Jaya
n.a
n
.a
n.a
n
.a
n.a
n
.a
1,15
0,72
7 n
.a
68,7
85 n
.a
n.a
n
.a
n.a
22Ka
b. B
ener
Mer
iah
n.a
n
.a
n.a
n
.a
n.a
n
.a
n.a
n
.a
n.a
n.a
n
.a
n.a
n
.a
Av
erag
e (d
istric
ts)
38,4
062.
610
5,46
37.
724
1,99
817
.481
5,36
358
.359
,150
4.4
131,
154
10.7
1,33
4,33
9
M
inin
um (d
istric
ts)
11,5
211.
421
,610
2.7
55,3
026.
740
2,11
526
.514
,240
0.9
22,5
111.
275
2,51
3
M
axim
um (d
istric
ts)
191,
267
5.0
391,
211
23.7
902,
356
28.5
2,81
7,15
767
.719
3,05
79.
955
3,62
735
.84,
742,
031
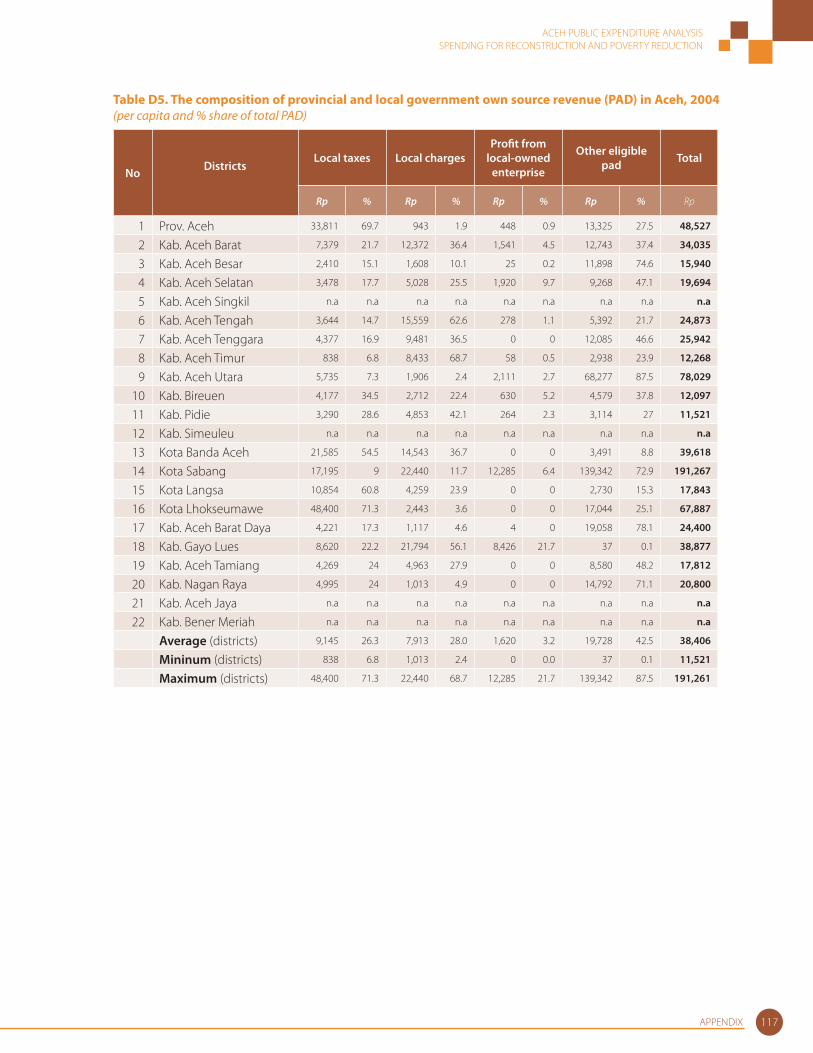
ACEH PUBLIC EXPENDITURE ANALYSISSPENDING FOR RECONSTRUCTION AND POVERTY REDUCTION
APPENDIX 117
Table D5. The composition of provincial and local government own source revenue (PAD) in Aceh, 2004 (per capita and % share of total PAD)
No Districts
Local taxes Local chargesProfi t from
local-owned enterprise
Other eligible pad Total
Rp % Rp % Rp % Rp % Rp
1 Prov. Aceh 33,811 69.7 943 1.9 448 0.9 13,325 27.5 48,527
2 Kab. Aceh Barat 7,379 21.7 12,372 36.4 1,541 4.5 12,743 37.4 34,035
3 Kab. Aceh Besar 2,410 15.1 1,608 10.1 25 0.2 11,898 74.6 15,940
4 Kab. Aceh Selatan 3,478 17.7 5,028 25.5 1,920 9.7 9,268 47.1 19,694
5 Kab. Aceh Singkil n.a n.a n.a n.a n.a n.a n.a n.a n.a
6 Kab. Aceh Tengah 3,644 14.7 15,559 62.6 278 1.1 5,392 21.7 24,873
7 Kab. Aceh Tenggara 4,377 16.9 9,481 36.5 0 0 12,085 46.6 25,942
8 Kab. Aceh Timur 838 6.8 8,433 68.7 58 0.5 2,938 23.9 12,268
9 Kab. Aceh Utara 5,735 7.3 1,906 2.4 2,111 2.7 68,277 87.5 78,029
10 Kab. Bireuen 4,177 34.5 2,712 22.4 630 5.2 4,579 37.8 12,097
11 Kab. Pidie 3,290 28.6 4,853 42.1 264 2.3 3,114 27 11,521
12 Kab. Simeuleu n.a n.a n.a n.a n.a n.a n.a n.a n.a
13 Kota Banda Aceh 21,585 54.5 14,543 36.7 0 0 3,491 8.8 39,618
14 Kota Sabang 17,195 9 22,440 11.7 12,285 6.4 139,342 72.9 191,267
15 Kota Langsa 10,854 60.8 4,259 23.9 0 0 2,730 15.3 17,843
16 Kota Lhokseumawe 48,400 71.3 2,443 3.6 0 0 17,044 25.1 67,887
17 Kab. Aceh Barat Daya 4,221 17.3 1,117 4.6 4 0 19,058 78.1 24,400
18 Kab. Gayo Lues 8,620 22.2 21,794 56.1 8,426 21.7 37 0.1 38,877
19 Kab. Aceh Tamiang 4,269 24 4,963 27.9 0 0 8,580 48.2 17,812
20 Kab. Nagan Raya 4,995 24 1,013 4.9 0 0 14,792 71.1 20,800
21 Kab. Aceh Jaya n.a n.a n.a n.a n.a n.a n.a n.a n.a
22 Kab. Bener Meriah n.a n.a n.a n.a n.a n.a n.a n.a n.a
Average (districts) 9,145 26.3 7,913 28.0 1,620 3.2 19,728 42.5 38,406
Mininum (districts) 838 6.8 1,013 2.4 0 0.0 37 0.1 11,521
Maximum (districts) 48,400 71.3 22,440 68.7 12,285 21.7 139,342 87.5 191,261
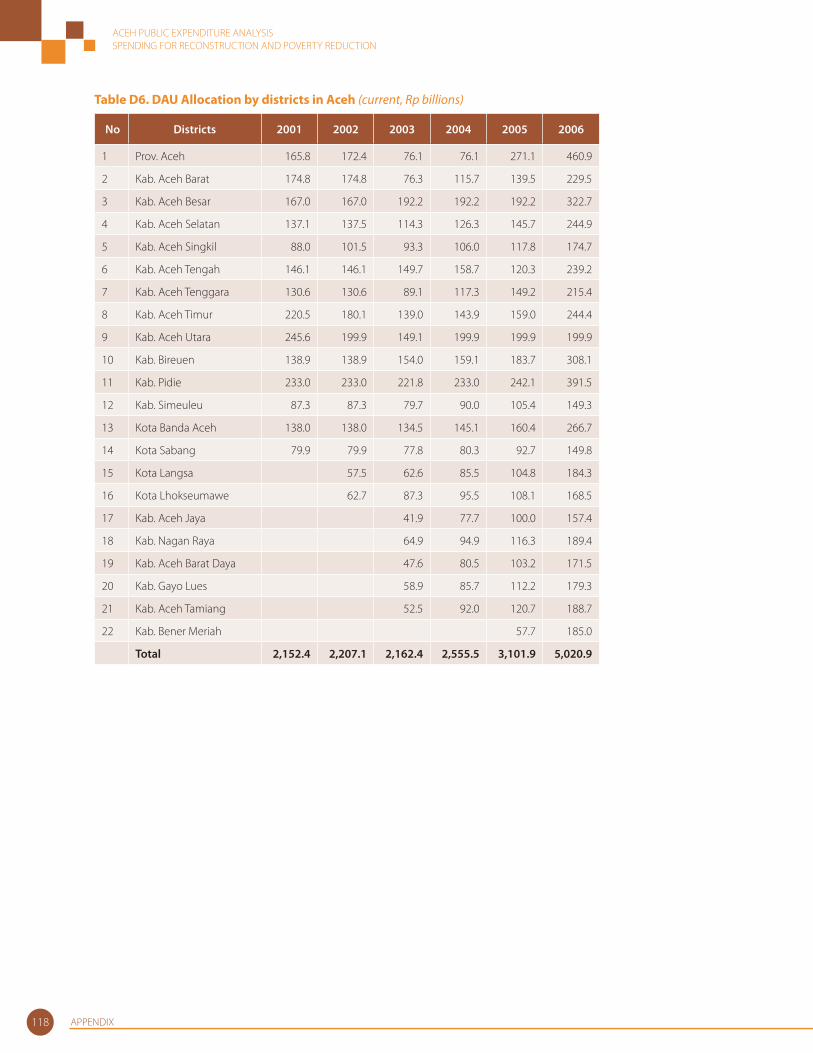
ACEH PUBLIC EXPENDITURE ANALYSISSPENDING FOR RECONSTRUCTION AND POVERTY REDUCTION
APPENDIX118
Table D6. DAU Allocation by districts in Aceh (current, Rp billions)
No Districts 2001 2002 2003 2004 2005 2006
1 Prov. Aceh 165.8 172.4 76.1 76.1 271.1 460.9
2 Kab. Aceh Barat 174.8 174.8 76.3 115.7 139.5 229.5
3 Kab. Aceh Besar 167.0 167.0 192.2 192.2 192.2 322.7
4 Kab. Aceh Selatan 137.1 137.5 114.3 126.3 145.7 244.9
5 Kab. Aceh Singkil 88.0 101.5 93.3 106.0 117.8 174.7
6 Kab. Aceh Tengah 146.1 146.1 149.7 158.7 120.3 239.2
7 Kab. Aceh Tenggara 130.6 130.6 89.1 117.3 149.2 215.4
8 Kab. Aceh Timur 220.5 180.1 139.0 143.9 159.0 244.4
9 Kab. Aceh Utara 245.6 199.9 149.1 199.9 199.9 199.9
10 Kab. Bireuen 138.9 138.9 154.0 159.1 183.7 308.1
11 Kab. Pidie 233.0 233.0 221.8 233.0 242.1 391.5
12 Kab. Simeuleu 87.3 87.3 79.7 90.0 105.4 149.3
13 Kota Banda Aceh 138.0 138.0 134.5 145.1 160.4 266.7
14 Kota Sabang 79.9 79.9 77.8 80.3 92.7 149.8
15 Kota Langsa 57.5 62.6 85.5 104.8 184.3
16 Kota Lhokseumawe 62.7 87.3 95.5 108.1 168.5
17 Kab. Aceh Jaya 41.9 77.7 100.0 157.4
18 Kab. Nagan Raya 64.9 94.9 116.3 189.4
19 Kab. Aceh Barat Daya 47.6 80.5 103.2 171.5
20 Kab. Gayo Lues 58.9 85.7 112.2 179.3
21 Kab. Aceh Tamiang 52.5 92.0 120.7 188.7
22 Kab. Bener Meriah 57.7 185.0
Total 2,152.4 2,207.1 2,162.4 2,555.5 3,101.9 5,020.9
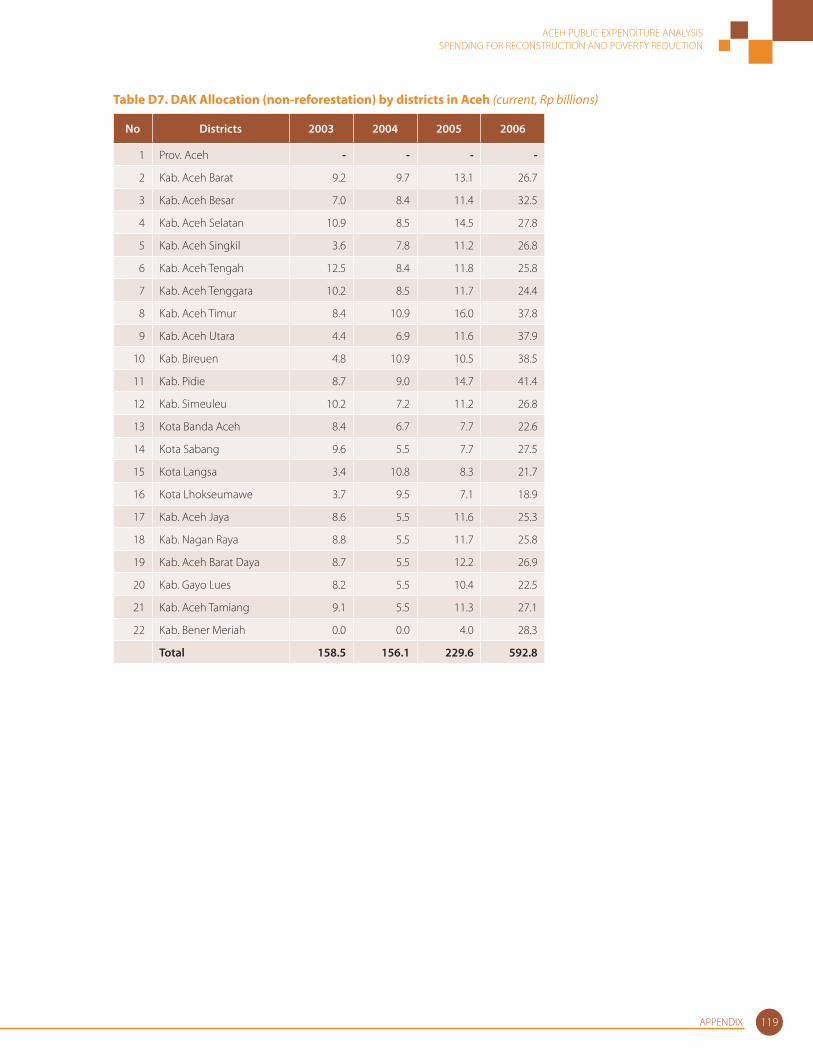
ACEH PUBLIC EXPENDITURE ANALYSISSPENDING FOR RECONSTRUCTION AND POVERTY REDUCTION
APPENDIX 119
Table D7. DAK Allocation (non-reforestation) by districts in Aceh (current, Rp billions)
No Districts 2003 2004 2005 2006
1 Prov. Aceh - - - -
2 Kab. Aceh Barat 9.2 9.7 13.1 26.7
3 Kab. Aceh Besar 7.0 8.4 11.4 32.5
4 Kab. Aceh Selatan 10.9 8.5 14.5 27.8
5 Kab. Aceh Singkil 3.6 7.8 11.2 26.8
6 Kab. Aceh Tengah 12.5 8.4 11.8 25.8
7 Kab. Aceh Tenggara 10.2 8.5 11.7 24.4
8 Kab. Aceh Timur 8.4 10.9 16.0 37.8
9 Kab. Aceh Utara 4.4 6.9 11.6 37.9
10 Kab. Bireuen 4.8 10.9 10.5 38.5
11 Kab. Pidie 8.7 9.0 14.7 41.4
12 Kab. Simeuleu 10.2 7.2 11.2 26.8
13 Kota Banda Aceh 8.4 6.7 7.7 22.6
14 Kota Sabang 9.6 5.5 7.7 27.5
15 Kota Langsa 3.4 10.8 8.3 21.7
16 Kota Lhokseumawe 3.7 9.5 7.1 18.9
17 Kab. Aceh Jaya 8.6 5.5 11.6 25.3
18 Kab. Nagan Raya 8.8 5.5 11.7 25.8
19 Kab. Aceh Barat Daya 8.7 5.5 12.2 26.9
20 Kab. Gayo Lues 8.2 5.5 10.4 22.5
21 Kab. Aceh Tamiang 9.1 5.5 11.3 27.1
22 Kab. Bener Meriah 0.0 0.0 4.0 28.3
Total 158.5 156.1 229.6 592.8
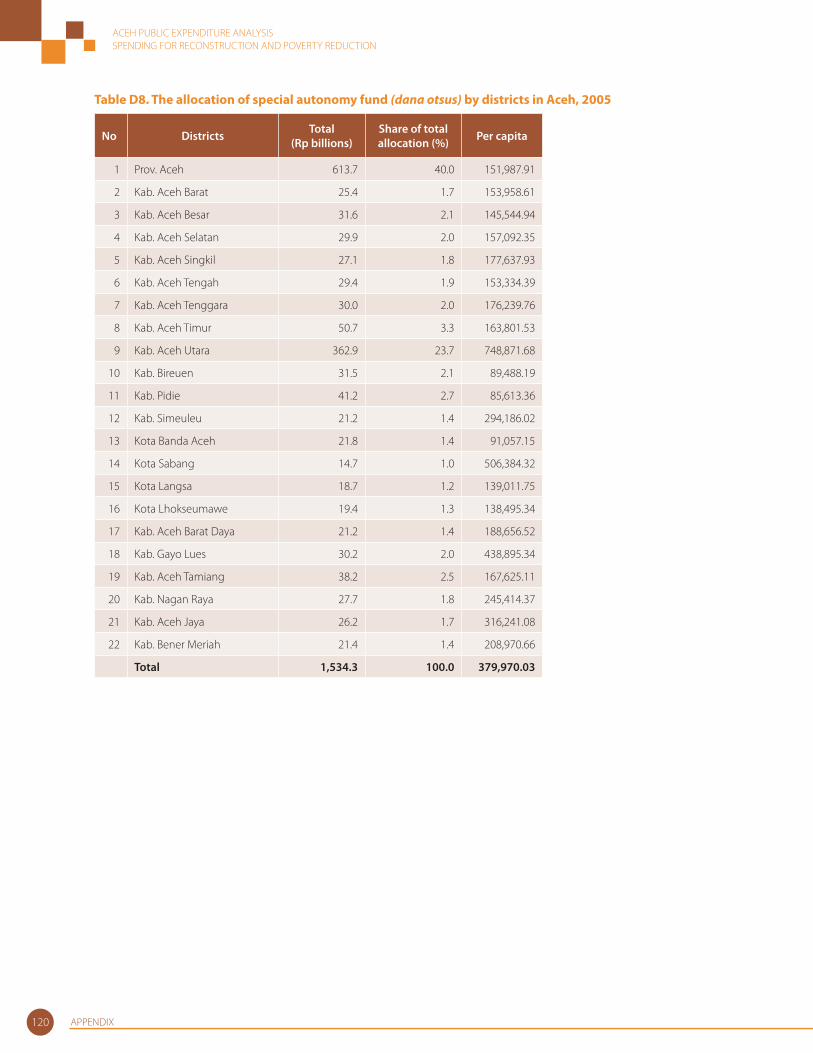
ACEH PUBLIC EXPENDITURE ANALYSISSPENDING FOR RECONSTRUCTION AND POVERTY REDUCTION
APPENDIX120
Table D8. The allocation of special autonomy fund (dana otsus) by districts in Aceh, 2005
No Districts Total (Rp billions)
Share of total allocation (%) Per capita
1 Prov. Aceh 613.7 40.0 151,987.91
2 Kab. Aceh Barat 25.4 1.7 153,958.61
3 Kab. Aceh Besar 31.6 2.1 145,544.94
4 Kab. Aceh Selatan 29.9 2.0 157,092.35
5 Kab. Aceh Singkil 27.1 1.8 177,637.93
6 Kab. Aceh Tengah 29.4 1.9 153,334.39
7 Kab. Aceh Tenggara 30.0 2.0 176,239.76
8 Kab. Aceh Timur 50.7 3.3 163,801.53
9 Kab. Aceh Utara 362.9 23.7 748,871.68
10 Kab. Bireuen 31.5 2.1 89,488.19
11 Kab. Pidie 41.2 2.7 85,613.36
12 Kab. Simeuleu 21.2 1.4 294,186.02
13 Kota Banda Aceh 21.8 1.4 91,057.15
14 Kota Sabang 14.7 1.0 506,384.32
15 Kota Langsa 18.7 1.2 139,011.75
16 Kota Lhokseumawe 19.4 1.3 138,495.34
17 Kab. Aceh Barat Daya 21.2 1.4 188,656.52
18 Kab. Gayo Lues 30.2 2.0 438,895.34
19 Kab. Aceh Tamiang 38.2 2.5 167,625.11
20 Kab. Nagan Raya 27.7 1.8 245,414.37
21 Kab. Aceh Jaya 26.2 1.7 316,241.08
22 Kab. Bener Meriah 21.4 1.4 208,970.66
Total 1,534.3 100.0 379,970.03
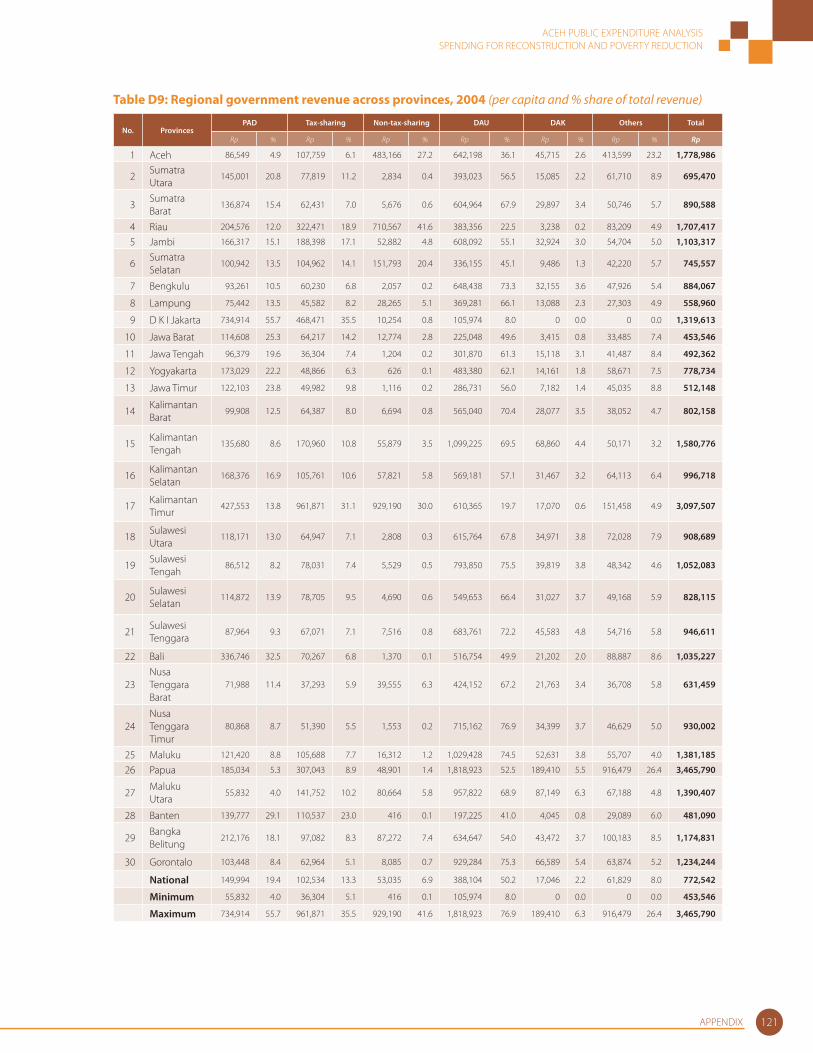
ACEH PUBLIC EXPENDITURE ANALYSISSPENDING FOR RECONSTRUCTION AND POVERTY REDUCTION
APPENDIX 121
Table D9: Regional government revenue across provinces, 2004 (per capita and % share of total revenue)
No. ProvincesPAD Tax-sharing Non-tax-sharing DAU DAK Others Total
Rp % Rp % Rp % Rp % Rp % Rp % Rp
1 Aceh 86,549 4.9 107,759 6.1 483,166 27.2 642,198 36.1 45,715 2.6 413,599 23.2 1,778,986
2Sumatra Utara
145,001 20.8 77,819 11.2 2,834 0.4 393,023 56.5 15,085 2.2 61,710 8.9 695,470
3Sumatra Barat
136,874 15.4 62,431 7.0 5,676 0.6 604,964 67.9 29,897 3.4 50,746 5.7 890,588
4 Riau 204,576 12.0 322,471 18.9 710,567 41.6 383,356 22.5 3,238 0.2 83,209 4.9 1,707,417
5 Jambi 166,317 15.1 188,398 17.1 52,882 4.8 608,092 55.1 32,924 3.0 54,704 5.0 1,103,317
6Sumatra Selatan
100,942 13.5 104,962 14.1 151,793 20.4 336,155 45.1 9,486 1.3 42,220 5.7 745,557
7 Bengkulu 93,261 10.5 60,230 6.8 2,057 0.2 648,438 73.3 32,155 3.6 47,926 5.4 884,067
8 Lampung 75,442 13.5 45,582 8.2 28,265 5.1 369,281 66.1 13,088 2.3 27,303 4.9 558,960
9 D K I Jakarta 734,914 55.7 468,471 35.5 10,254 0.8 105,974 8.0 0 0.0 0 0.0 1,319,613
10 Jawa Barat 114,608 25.3 64,217 14.2 12,774 2.8 225,048 49.6 3,415 0.8 33,485 7.4 453,546
11 Jawa Tengah 96,379 19.6 36,304 7.4 1,204 0.2 301,870 61.3 15,118 3.1 41,487 8.4 492,362
12 Yogyakarta 173,029 22.2 48,866 6.3 626 0.1 483,380 62.1 14,161 1.8 58,671 7.5 778,734
13 Jawa Timur 122,103 23.8 49,982 9.8 1,116 0.2 286,731 56.0 7,182 1.4 45,035 8.8 512,148
14Kalimantan Barat
99,908 12.5 64,387 8.0 6,694 0.8 565,040 70.4 28,077 3.5 38,052 4.7 802,158
15Kalimantan Tengah
135,680 8.6 170,960 10.8 55,879 3.5 1,099,225 69.5 68,860 4.4 50,171 3.2 1,580,776
16Kalimantan Selatan
168,376 16.9 105,761 10.6 57,821 5.8 569,181 57.1 31,467 3.2 64,113 6.4 996,718
17Kalimantan Timur
427,553 13.8 961,871 31.1 929,190 30.0 610,365 19.7 17,070 0.6 151,458 4.9 3,097,507
18Sulawesi Utara
118,171 13.0 64,947 7.1 2,808 0.3 615,764 67.8 34,971 3.8 72,028 7.9 908,689
19Sulawesi Tengah
86,512 8.2 78,031 7.4 5,529 0.5 793,850 75.5 39,819 3.8 48,342 4.6 1,052,083
20Sulawesi Selatan
114,872 13.9 78,705 9.5 4,690 0.6 549,653 66.4 31,027 3.7 49,168 5.9 828,115
21Sulawesi Tenggara
87,964 9.3 67,071 7.1 7,516 0.8 683,761 72.2 45,583 4.8 54,716 5.8 946,611
22 Bali 336,746 32.5 70,267 6.8 1,370 0.1 516,754 49.9 21,202 2.0 88,887 8.6 1,035,227
23Nusa Tenggara Barat
71,988 11.4 37,293 5.9 39,555 6.3 424,152 67.2 21,763 3.4 36,708 5.8 631,459
24Nusa Tenggara Timur
80,868 8.7 51,390 5.5 1,553 0.2 715,162 76.9 34,399 3.7 46,629 5.0 930,002
25 Maluku 121,420 8.8 105,688 7.7 16,312 1.2 1,029,428 74.5 52,631 3.8 55,707 4.0 1,381,185
26 Papua 185,034 5.3 307,043 8.9 48,901 1.4 1,818,923 52.5 189,410 5.5 916,479 26.4 3,465,790
27Maluku Utara
55,832 4.0 141,752 10.2 80,664 5.8 957,822 68.9 87,149 6.3 67,188 4.8 1,390,407
28 Banten 139,777 29.1 110,537 23.0 416 0.1 197,225 41.0 4,045 0.8 29,089 6.0 481,090
29Bangka Belitung
212,176 18.1 97,082 8.3 87,272 7.4 634,647 54.0 43,472 3.7 100,183 8.5 1,174,831
30 Gorontalo 103,448 8.4 62,964 5.1 8,085 0.7 929,284 75.3 66,589 5.4 63,874 5.2 1,234,244
National 149,994 19.4 102,534 13.3 53,035 6.9 388,104 50.2 17,046 2.2 61,829 8.0 772,542
Minimum 55,832 4.0 36,304 5.1 416 0.1 105,974 8.0 0 0.0 0 0.0 453,546
Maximum 734,914 55.7 961,871 35.5 929,190 41.6 1,818,923 76.9 189,410 6.3 916,479 26.4 3,465,790
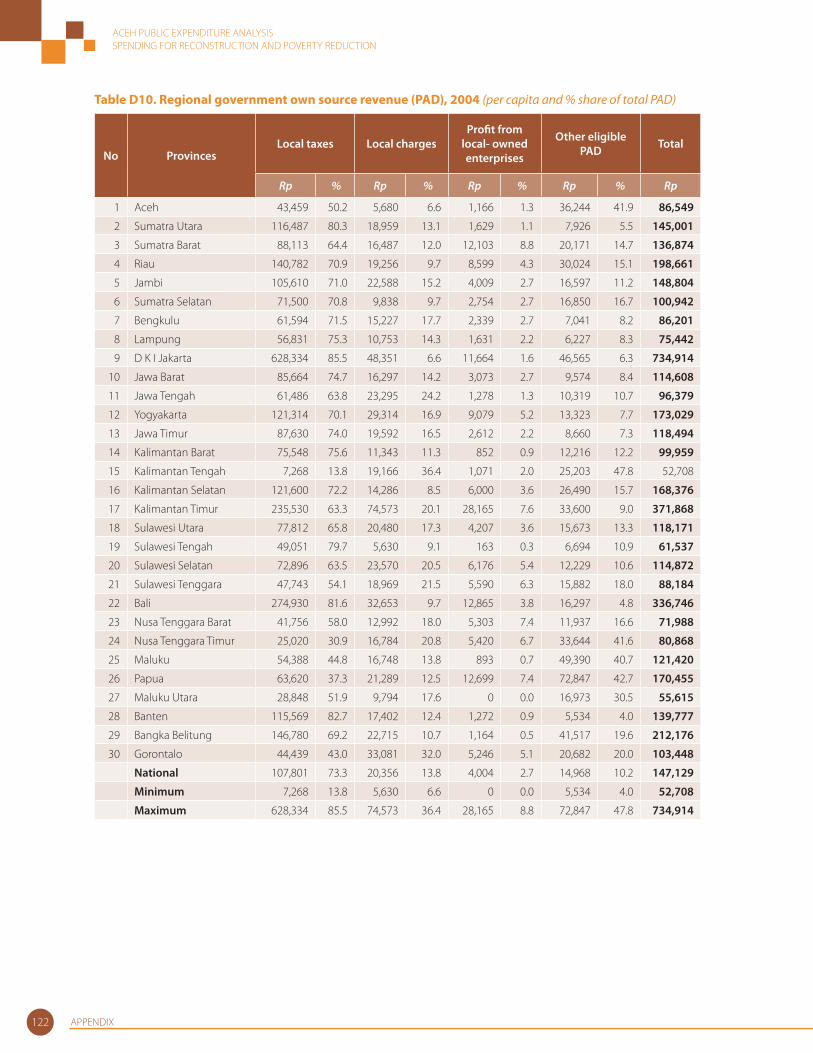
ACEH PUBLIC EXPENDITURE ANALYSISSPENDING FOR RECONSTRUCTION AND POVERTY REDUCTION
APPENDIX122
Table D10. Regional government own source revenue (PAD), 2004 (per capita and % share of total PAD)
No ProvincesLocal taxes Local charges
Profi t from local- owned enterprises
Other eligible PAD Total
Rp % Rp % Rp % Rp % Rp
1 Aceh 43,459 50.2 5,680 6.6 1,166 1.3 36,244 41.9 86,549
2 Sumatra Utara 116,487 80.3 18,959 13.1 1,629 1.1 7,926 5.5 145,001
3 Sumatra Barat 88,113 64.4 16,487 12.0 12,103 8.8 20,171 14.7 136,874
4 Riau 140,782 70.9 19,256 9.7 8,599 4.3 30,024 15.1 198,661
5 Jambi 105,610 71.0 22,588 15.2 4,009 2.7 16,597 11.2 148,804
6 Sumatra Selatan 71,500 70.8 9,838 9.7 2,754 2.7 16,850 16.7 100,942
7 Bengkulu 61,594 71.5 15,227 17.7 2,339 2.7 7,041 8.2 86,201
8 Lampung 56,831 75.3 10,753 14.3 1,631 2.2 6,227 8.3 75,442
9 D K I Jakarta 628,334 85.5 48,351 6.6 11,664 1.6 46,565 6.3 734,914
10 Jawa Barat 85,664 74.7 16,297 14.2 3,073 2.7 9,574 8.4 114,608
11 Jawa Tengah 61,486 63.8 23,295 24.2 1,278 1.3 10,319 10.7 96,379
12 Yogyakarta 121,314 70.1 29,314 16.9 9,079 5.2 13,323 7.7 173,029
13 Jawa Timur 87,630 74.0 19,592 16.5 2,612 2.2 8,660 7.3 118,494
14 Kalimantan Barat 75,548 75.6 11,343 11.3 852 0.9 12,216 12.2 99,959
15 Kalimantan Tengah 7,268 13.8 19,166 36.4 1,071 2.0 25,203 47.8 52,708
16 Kalimantan Selatan 121,600 72.2 14,286 8.5 6,000 3.6 26,490 15.7 168,376
17 Kalimantan Timur 235,530 63.3 74,573 20.1 28,165 7.6 33,600 9.0 371,868
18 Sulawesi Utara 77,812 65.8 20,480 17.3 4,207 3.6 15,673 13.3 118,171
19 Sulawesi Tengah 49,051 79.7 5,630 9.1 163 0.3 6,694 10.9 61,537
20 Sulawesi Selatan 72,896 63.5 23,570 20.5 6,176 5.4 12,229 10.6 114,872
21 Sulawesi Tenggara 47,743 54.1 18,969 21.5 5,590 6.3 15,882 18.0 88,184
22 Bali 274,930 81.6 32,653 9.7 12,865 3.8 16,297 4.8 336,746
23 Nusa Tenggara Barat 41,756 58.0 12,992 18.0 5,303 7.4 11,937 16.6 71,988
24 Nusa Tenggara Timur 25,020 30.9 16,784 20.8 5,420 6.7 33,644 41.6 80,868
25 Maluku 54,388 44.8 16,748 13.8 893 0.7 49,390 40.7 121,420
26 Papua 63,620 37.3 21,289 12.5 12,699 7.4 72,847 42.7 170,455
27 Maluku Utara 28,848 51.9 9,794 17.6 0 0.0 16,973 30.5 55,615
28 Banten 115,569 82.7 17,402 12.4 1,272 0.9 5,534 4.0 139,777
29 Bangka Belitung 146,780 69.2 22,715 10.7 1,164 0.5 41,517 19.6 212,176
30 Gorontalo 44,439 43.0 33,081 32.0 5,246 5.1 20,682 20.0 103,448
National 107,801 73.3 20,356 13.8 4,004 2.7 14,968 10.2 147,129
Minimum 7,268 13.8 5,630 6.6 0 0.0 5,534 4.0 52,708
Maximum 628,334 85.5 74,573 36.4 28,165 8.8 72,847 47.8 734,914
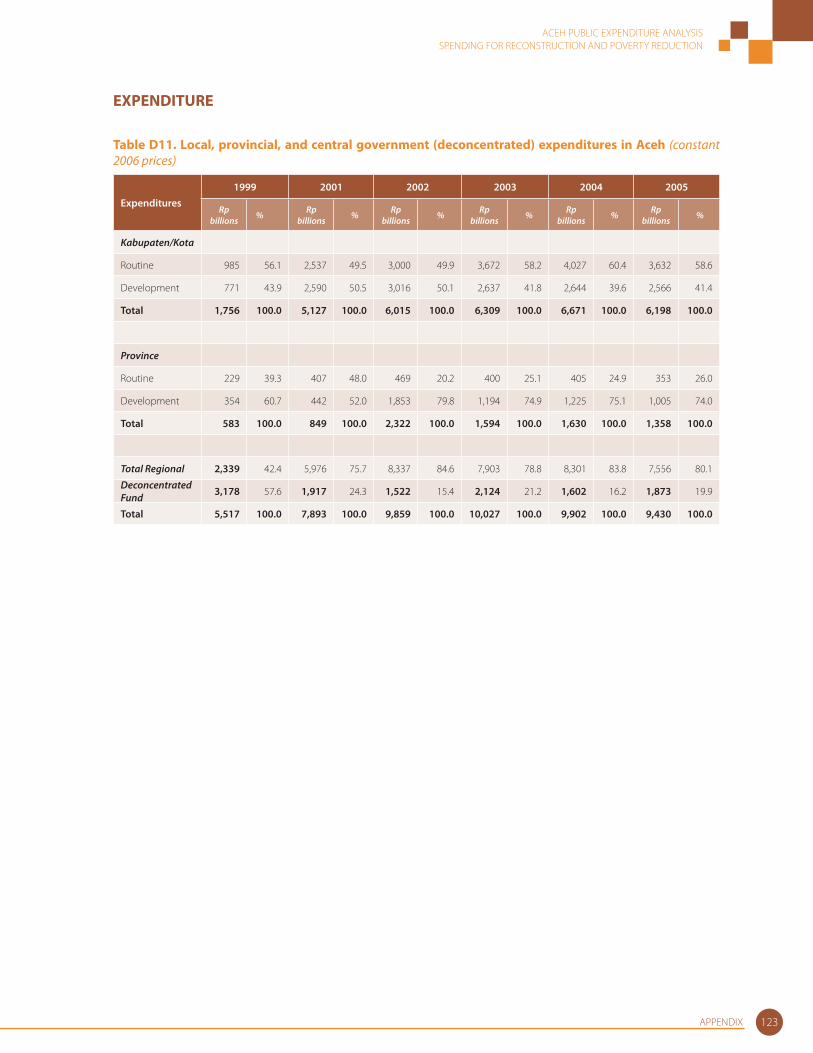
ACEH PUBLIC EXPENDITURE ANALYSISSPENDING FOR RECONSTRUCTION AND POVERTY REDUCTION
APPENDIX 123
EXPENDITURE
Table D11. Local, provincial, and central government (deconcentrated) expenditures in Aceh (constant 2006 prices)
Expenditures1999 2001 2002 2003 2004 2005
Rp billions % Rp
billions % Rp billions % Rp
billions % Rp billions % Rp
billions %
Kabupaten/Kota
Routine 985 56.1 2,537 49.5 3,000 49.9 3,672 58.2 4,027 60.4 3,632 58.6
Development 771 43.9 2,590 50.5 3,016 50.1 2,637 41.8 2,644 39.6 2,566 41.4
Total 1,756 100.0 5,127 100.0 6,015 100.0 6,309 100.0 6,671 100.0 6,198 100.0
Province
Routine 229 39.3 407 48.0 469 20.2 400 25.1 405 24.9 353 26.0
Development 354 60.7 442 52.0 1,853 79.8 1,194 74.9 1,225 75.1 1,005 74.0
Total 583 100.0 849 100.0 2,322 100.0 1,594 100.0 1,630 100.0 1,358 100.0
Total Regional 2,339 42.4 5,976 75.7 8,337 84.6 7,903 78.8 8,301 83.8 7,556 80.1
Deconcentrated Fund 3,178 57.6 1,917 24.3 1,522 15.4 2,124 21.2 1,602 16.2 1,873 19.9
Total 5,517 100.0 7,893 100.0 9,859 100.0 10,027 100.0 9,902 100.0 9,430 100.0

ACEH PUBLIC EXPENDITURE ANALYSISSPENDING FOR RECONSTRUCTION AND POVERTY REDUCTION
APPENDIX124
Table D12. Routine and development expenditures by districts in Aceh, 2004 (Rp billion, per capita, and % share of total expenditure)
No Districts
Routine Development Total
Total (Rp billion)
Per capita %Total (Rp
billion)Per capita %
Rp billion Per capita
1 Prov. Aceh 263 64,416 24.9 796 194,760 75.1 1,060 259,176
2 Kab. Aceh Barat 117 722,378 59.4 80 492,854 40.6 197 1,215,233
3 Kab. Aceh Besar 177 583,125 66.0 91 300,281 34.0 268 883,406
4 Kab. Aceh Selatan 135 722,010 63.3 78 418,342 36.7 213 1,140,352
5 Kab. Aceh Singkil n.a n.a n.a n.a n.a n.a n.a n.a
6 Kab. Aceh Tengah 187 648,933 61.5 117 405,418 38.5 303 1,054,351
7 Kab. Aceh Tenggara 103 609,773 56.2 80 474,436 43.8 182 1,084,209
8 Kab. Aceh Timur 202 648,596 77.3 60 190,824 22.7 262 839,419
9 Kab. Aceh Utara 299 613,303 40.7 435 891,983 59.3 734 1,505,286
10 Kab. Bireuen 176 503,010 65.4 93 266,355 34.6 269 769,365
11 Kab. Pidie 284 600,030 76.1 89 188,934 23.9 374 788,963
12 Kab. Simeuleu 63 876,469 47.2 70 979,685 52.8 133 1,856,155
13 Kota Banda Aceh 161 675,154 74.8 54 227,456 25.2 215 902,611
14 Kota Sabang 77 2,710,870 59.5 53 1,843,998 40.5 130 4,554,868
15 Kota Langsa 80 594,839 59.6 54 402,600 40.4 134 997,439
16 Kota Lhokseumawe 133 957,396 70.2 56 406,904 29.8 189 1,364,300
17 Kab. Aceh Barat Daya 71 633,224 54.8 58 522,295 45.2 129 1,155,519
18 Kab. Gayo Lues 69 1,011,914 51.5 65 953,448 48.5 134 1,965,363
19 Kab. Aceh Tamiang 98 428,137 60.0 65 285,813 40.0 163 713,950
20 Kab. Nagan Raya 83 748,658 55.9 66 591,736 44.1 149 1,340,394
21 Kab. Aceh Jaya n.a n.a n.a 0 n.a n.a n.a n.a
22 Kab. Bener Meriah n.a n.a n.a 0 n.a n.a n.a n.a
Average (districts) 140 793,768 61.1 83 546,853 38.9 232 1,340,621
Minimum (districts) 63 428,137 40.7 0 188,934 22.7 129 713,950
Maximum (districts) 299 2,710,870 77.3 435 1,843,998 59.3 734 4,554,868
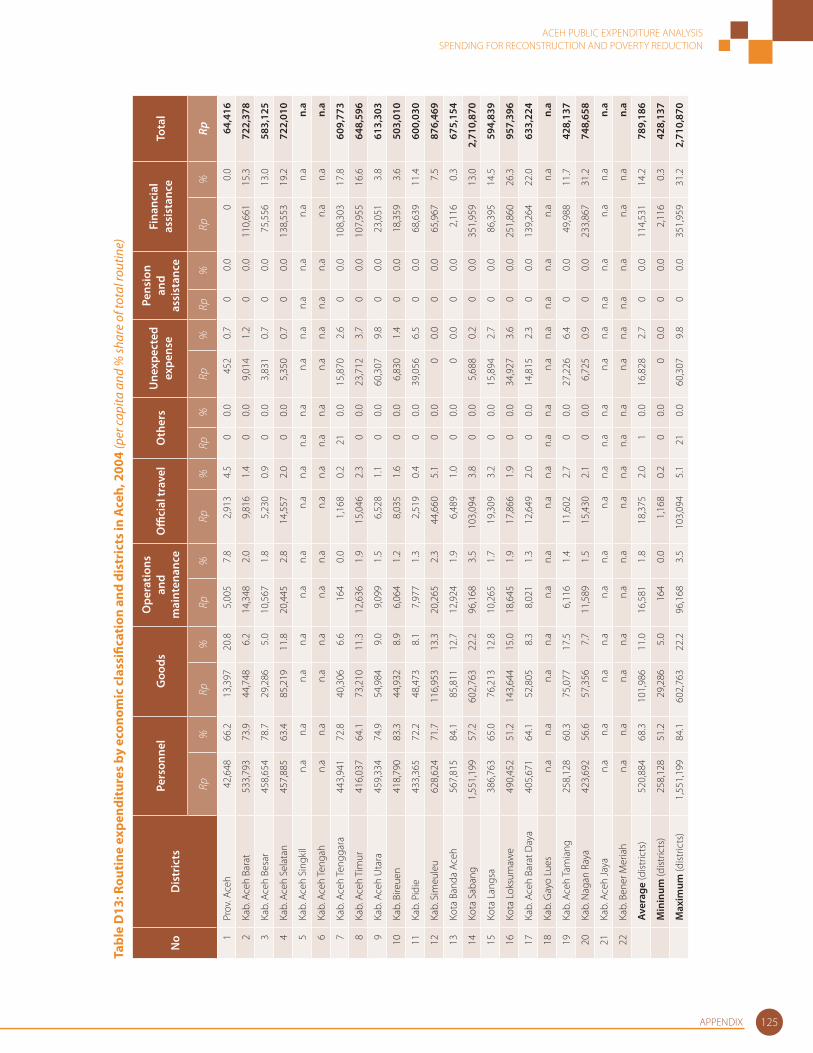
ACEH PUBLIC EXPENDITURE ANALYSISSPENDING FOR RECONSTRUCTION AND POVERTY REDUCTION
APPENDIX 125
Tabl
e D
13: R
outi
ne e
xpen
ditu
res
by e
cono
mic
cla
ssifi
cati
on a
nd d
istr
icts
in A
ceh,
200
4 (p
er ca
pita
and
% sh
are
of to
tal r
outin
e)
No
Dis
tric
tsPe
rson
nel
Goo
dsO
pera
tions
an
d m
aint
enan
ceO
ffi ci
al tr
avel
Oth
ers
Une
xpec
ted
expe
nse
Pens
ion
and
assi
stan
ce
Fina
ncia
l as
sist
ance
Tota
l
Rp%
Rp%
Rp%
Rp%
Rp%
Rp%
Rp%
Rp%
Rp
1Pr
ov. A
ceh
42,
648
66.2
1
3,39
7 20
.8
5,0
05
7.8
2,9
13
4.5
00.
0 4
52
0.7
0 0.
0 0
0.0
64,
416
2Ka
b. A
ceh
Bara
t 5
33,7
93
73.9
4
4,74
8 6.
2 14
,348
2.
0 9
,816
1.
4 0
0.0
9,0
14
1.2
0 0.
0 11
0,66
1 15
.3
722
,378
3Ka
b. A
ceh
Besa
r 4
58,6
54
78.7
2
9,28
6 5.
0 10
,567
1.
8 5
,230
0.
9 0
0.0
3,8
31
0.7
0 0.
0 7
5,55
6 13
.0
583
,125
4Ka
b. A
ceh
Sela
tan
457
,885
63
.4
85,
219
11.8
20
,445
2.
8 1
4,55
7 2.
0 0
0.0
5,3
50
0.7
0 0.
0 13
8,55
3 19
.2
722
,010
5Ka
b. A
ceh
Sing
kil
n.a
n
.a
n.a
n
.a
n.a
n.
a n
.a
n.a
n.a
n.
a n
.a
n.a
n.a
n.a
n.a
n
.a
n.a
6Ka
b. A
ceh
Teng
ah
n.a
n
.a
n.a
n
.a
n.a
n.
a n
.a
n.a
n.a
n.
a n
.a
n.a
n.a
n.
a n
.a
n.a
n
.a
7Ka
b. A
ceh
Teng
gara
443
,941
72
.8
40,
306
6.6
164
0.
0 1
,168
0.
2 21
0.0
15,8
70
2.6
0 0.
0 10
8,30
3 17
.8
609
,773
8Ka
b. A
ceh
Tim
ur 4
16,0
37
64.1
7
3,21
0 11
.3
12,6
36
1.9
15,
046
2.3
00.
0 23
,712
3.
7 0
0.0
107,
955
16.6
6
48,5
96
9Ka
b. A
ceh
Uta
ra 4
59,3
34
74.9
5
4,98
4 9.
0 9
,099
1.
5 6
,528
1.
1 0
0.0
60,3
07
9.8
0 0.
0 2
3,05
1 3.
8 6
13,3
03
10Ka
b. B
ireue
n 4
18,7
90
83.3
4
4,93
2 8.
9 6
,064
1.
2 8
,035
1.
6 0
0.0
6,8
30
1.4
0 0.
0 1
8,35
9 3.
6 5
03,0
10
11Ka
b. P
idie
433
,365
72
.2
48,
473
8.1
7,9
77
1.3
2,5
19
0.4
00.
0 39
,056
6.
5 0
0.0
68,
639
11.4
6
00,0
30
12Ka
b. S
imeu
leu
628
,624
71
.7
116
,953
13
.3
20,2
65
2.3
44,
660
5.1
00.
0 0
0.0
0 0.
0 6
5,96
7 7.
5 8
76,4
69
13Ko
ta B
anda
Ace
h 5
67,8
15
84.1
8
5,81
1 12
.7
12,9
24
1.9
6,4
89
1.0
00.
0 0
0.0
0 0.
0 2
,116
0.
3 6
75,1
54
14Ko
ta S
aban
g 1
,551
,199
57
.2
602
,763
22
.2
96,1
68
3.5
103,
094
3.8
00.
0 5
,688
0.
2 0
0.0
351
,959
13
.0
2,71
0,87
0
15Ko
ta L
angs
a 3
86,7
63
65.0
7
6,21
3 12
.8
10,2
65
1.7
19,
309
3.2
00.
0 15
,894
2.
7 0
0.0
86,
395
14.5
5
94,8
39
16Ko
ta L
oksu
maw
e 4
90,4
52
51.2
1
43,6
44
15.0
18
,645
1.
9 1
7,86
6 1.
9 0
0.0
34,9
27
3.6
0 0.
0 2
51,8
60
26.3
9
57,3
96
17Ka
b. A
ceh
Bara
t Day
a 4
05,6
71
64.1
5
2,80
5 8.
3 8
,021
1.
3 1
2,64
9 2.
0 0
0.0
14,8
15
2.3
0 0.
0 1
39,2
64
22.0
6
33,2
24
18Ka
b. G
ayo
Lues
n.a
n.
a n
.a
n.a
n.a
n.
a n
.a
n.a
n.a
n.
a n
.a
n.a
n.a
n.
a n
.a
n.a
n.a
19Ka
b. A
ceh
Tam
iang
258
,128
60
.3
75,
077
17.5
6
,116
1.
4 1
1,60
2 2.
7 0
0.0
27,2
26
6.4
0 0.
0 4
9,98
8 11
.7
428
,137
20Ka
b. N
agan
Ray
a 4
23,6
92
56.6
5
7,35
6 7.
7 11
,589
1.
5 1
5,43
0 2.
1 0
0.0
6,7
25
0.9
0 0.
0 23
3,86
7 31
.2
748
,658
21Ka
b. A
ceh
Jaya
n.a
n
.a
n.a
n
.a
n.a
n.
a n
.a
n.a
n.a
n.
a n
.a
n.a
n.a
n.
a n
.a
n.a
n.
a
22Ka
b. B
ener
Mer
iah
n.a
n
.a
n.a
n
.a
n.a
n.
a n
.a
n.a
n.a
n.
a n
.a
n.a
n.a
n.
a n
.a
n.a
n
.a
Av
erag
e (d
istric
ts)
520,
884
68.3
101,
986
11.0
16,5
811.
818
,375
2.0
10.
016
,828
2.7
00.
011
4,53
114
.278
9,18
6
M
inin
um (d
istric
ts)
258,
128
51.2
29,2
865.
016
40.
01,
168
0.2
00.
00
0.0
00.
02,
116
0.3
428,
137
M
axim
um (d
istric
ts)
1,55
1,19
984
.160
2,76
322
.296
,168
3.5
103,
094
5.1
210.
060
,307
9.8
00.
035
1,95
931
.22,
710,
870
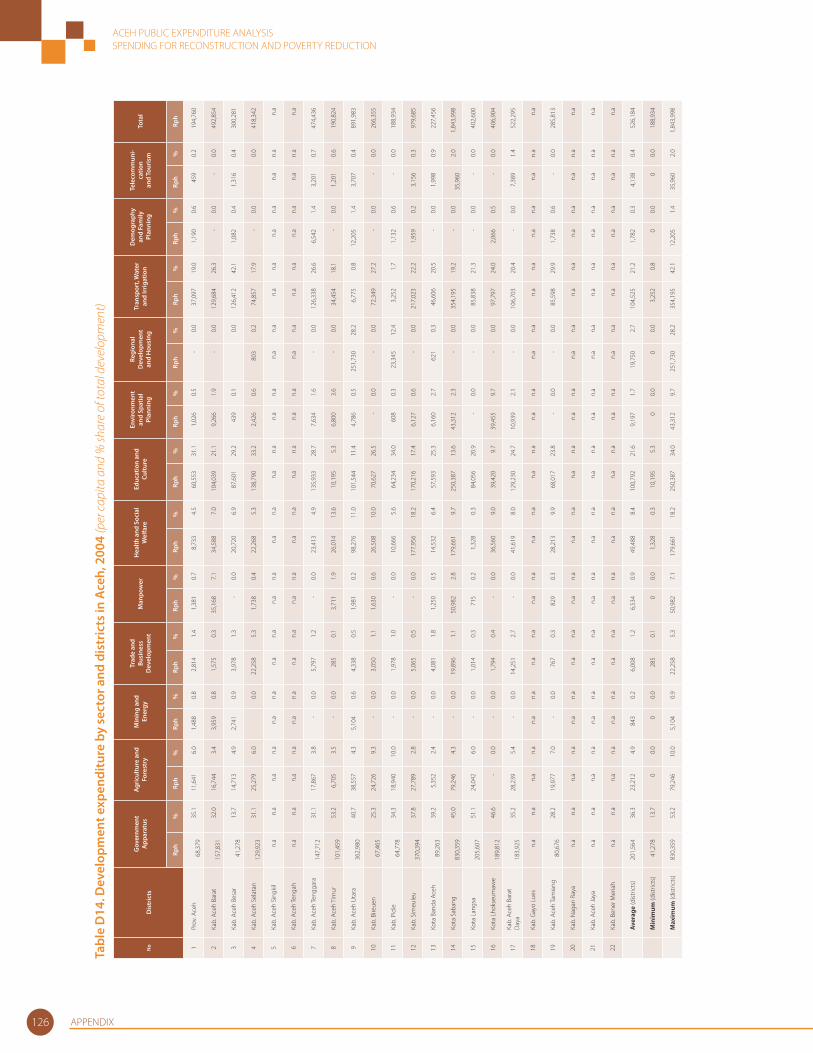
ACEH PUBLIC EXPENDITURE ANALYSISSPENDING FOR RECONSTRUCTION AND POVERTY REDUCTION
APPENDIX126
Tabl
e D
14. D
evel
opm
ent e
xpen
ditu
re b
y se
ctor
and
dis
tric
ts in
Ace
h, 2
004
(per
capi
ta a
nd %
shar
e of
tota
l dev
elop
men
t)
No
Dis
tric
ts
Gov
ernm
ent
App
arat
usA
gric
ultu
re a
nd
Fore
stry
Min
ing
and
Ener
gy
Trad
e an
d Bu
sine
ss
Dev
elop
men
tM
anpo
wer
Hea
lth a
nd S
ocia
l W
elfa
reEd
ucat
ion
and
Cultu
re
Envi
ronm
ent
and
Spat
ial
Plan
ning
Regi
onal
D
evel
opm
ent
and
Hou
sing
Tran
spor
t, W
ater
an
d Ir
riga
tion
Dem
ogra
phy
and
Fam
ily
Plan
ning
Tele
com
mun
i-ca
tion
and
Tour
ism
Tota
l
Rph
%Rp
h%
Rph
%Rp
h%
Rph
%Rp
h%
Rph
%Rp
h%
Rph
%Rp
h%
Rph
%Rp
h%
Rph
1Pr
ov. A
ceh
68
,379
35
.1
11,
641
6.0
1,4
88
0.8
2,
814
1.4
1,
381
0.7
8
,733
4.
5
60,5
53
31.1
1,02
6 0.
5
- 0.
0
37,0
97
19.0
1,19
0 0.
6
459
0.
2
194
,760
2Ka
b. A
ceh
Bara
t
157,
831
32.0
1
6,74
4 3.
4 3
,959
0.
8
1,57
5 0.
3 3
5,16
8 7.
1
34,5
88
7.0
104
,039
21
.1
9,
266
1.9
-
0.0
129
,684
26
.3
- 0.
0
-
0.0
4
92,8
54
3Ka
b. A
ceh
Besa
r
41,2
78
13.7
1
4,71
3 4.
9 2
,741
0.
9
3,97
8 1.
3
-
0.0
20
,720
6.
9
87,6
01
29.2
439
0.
1 0.
0 1
26,4
12
42.1
1,08
2 0.
4
1,31
6 0.
4
300
,281
4Ka
b. A
ceh
Sela
tan
12
9,92
3 31
.1
25,
279
6.0
0.0
22,
258
5.3
1,
738
0.4
22
,268
5.
3 1
38,7
90
33.2
2,42
6 0.
6
8
03
0.2
74
,857
17
.9
- 0.
0 0.
0
418
,342
5Ka
b. A
ceh
Sing
kil
n.a
n
.a
n.a
n
.a
n.a
n
.a
n.a
n
.a
n.a
n
.a
n.a
n
.a
n.a
n
.a
n.a
n
.a
n.a
n
.a
n.a
n
.a
n.a
n
.a
n.a
n.
a n
.a
6Ka
b. A
ceh
Teng
ah
n.a
n
.a
n.a
n
.a
n.a
n
.a
n.a
n
.a
n.a
n
.a
n.a
n
.a
n.a
n
.a
n.a
n
.a
n.a
n
.a
n.a
n
.a
n.a
n
.a
n.a
n.
a n
.a
7Ka
b. A
ceh
Teng
gara
14
7,71
2 31
.1
17,
867
3.8
- 0.
0
5,79
7 1.
2
-
0.0
23
,413
4.
9 1
35,9
33
28.7
7,63
4 1.
6
- 0.
0 1
26,3
38
26.6
6,54
2 1.
4
3,20
1 0.
7
474
,436
8Ka
b. A
ceh
Tim
ur
101,
459
53.2
6,70
5 3.
5
-
0.0
2
85
0.1
3,
711
1.9
26
,014
13
.6
10
,195
5.
3
6,80
0 3.
6
- 0.
0
34,4
54
18.1
-
0.0
1,
201
0.6
1
90,8
24
9Ka
b. A
ceh
Uta
ra
362,
980
40.7
3
8,55
7 4.
3 5
,104
0.
6
4,33
8 0.
5
1,98
1 0.
2
98,2
76
11.0
1
01,5
44
11.4
4,78
6 0.
5 2
51,7
30
28.2
6,7
75
0.8
12,
205
1.4
3,
707
0.4
8
91,9
83
10Ka
b. B
ireue
n
67,4
65
25.3
2
4,72
6 9.
3
-
0.0
3,
050
1.1
1,
630
0.6
26
,508
10
.0
70
,627
26
.5
- 0.
0
- 0.
0
72,3
49
27.2
-
0.0
- 0.
0
266
,355
11Ka
b. P
idie
64
,778
34
.3
18,
940
10.0
-
0.0
1,
978
1.0
- 0.
0
10,6
66
5.6
64
,234
34
.0
6
08
0.3
23
,345
12
.4
3
,252
1.
7
1,13
2 0.
6
-
0.0
1
88,9
34
12Ka
b. S
imeu
leu
37
0,39
4 37
.8
27,
789
2.8
- 0.
0
5,06
5 0.
5
-
0.0
177
,956
18
.2
170
,216
17
.4
6,
127
0.6
-
0.0
217
,023
22
.2
1,
959
0.2
3,
156
0.3
9
79,6
85
13Ko
ta B
anda
Ace
h
89,2
63
39.2
5,35
2 2.
4
-
0.0
4,
081
1.8
1,
250
0.5
14
,532
6.
4
57,5
93
25.3
6,16
0 2.
7
6
21
0.3
46
,606
20
.5
- 0.
0
1,99
8 0.
9
227
,456
14Ko
ta S
aban
g
830,
359
45.0
7
9,24
6 4.
3
-
0.0
19,
896
1.1
50,
982
2.8
179
,661
9.
7 2
50,3
87
13.6
4
3,31
2 2.
3
- 0.
0 3
54,1
95
19.2
-
0.0
35
,960
2.
0 1
,843
,998
15Ko
ta L
angs
a
205,
607
51.1
2
4,04
2 6.
0
-
0.0
1,
014
0.3
7
15
0.2
1
,328
0.
3
84,0
56
20.9
-
0.0
-
0.0
85
,838
21
.3
- 0.
0
-
0.0
4
02,6
00
16Ko
ta L
hoks
eum
awe
18
9,81
2 46
.6
- 0.
0
-
0.0
1,
794
0.4
- 0.
0
36,5
60
9.0
39
,420
9.
7 3
9,45
5 9.
7
- 0.
0
97,7
97
24.0
2,06
6 0.
5
-
0.0
4
06,9
04
17Ka
b. A
ceh
Bara
t D
aya
18
3,92
5 35
.2
28,
239
5.4
- 0.
0 1
4,25
1 2.
7
-
0.0
41
,619
8.
0 1
29,2
30
24.7
1
0,93
9 2.
1
- 0.
0 1
06,7
03
20.4
-
0.0
7,
389
1.4
5
22,2
95
18Ka
b. G
ayo
Lues
n.a
n
.a
n.a
n
.a
n.a
n
.a
n.a
n
.a
n.a
n
.a
n.a
n
.a
n.a
n
.a
n.a
n
.a
n.a
n
.a
n.a
n
.a
n.a
n
.a
n.a
n.
a n
.a
19Ka
b. A
ceh
Tam
iang
80
,676
28
.2
19,
977
7.0
- 0.
0
767
0.
3
829
0.
3
28,2
13
9.9
68
,017
23
.8
- 0.
0
- 0.
0
85,5
98
29.9
1,73
8 0.
6
-
0.0
2
85,8
13
20Ka
b. N
agan
Ray
a n
.a
n.a
n
.a
n.a
n
.a
n.a
n
.a
n.a
n
.a
n.a
n
.a
n.a
n
.a
n.a
n
.a
n.a
n
.a
n.a
n
.a
n.a
n
.a
n.a
n
.a
n.a
n.a
21Ka
b. A
ceh
Jaya
n.a
n
.a
n.a
n
.a
n.a
n
.a
n.a
n
.a
n.a
n
.a
n.a
n
.a
n.a
n
.a
n.a
n
.a
n.a
n
.a
n.a
n
.a
n.a
n
.a
n.a
n.
a n
.a
22Ka
b. B
ener
Mer
iah
n.a
n
.a
n.a
n
.a
n.a
n
.a
n.a
n
.a
n.a
n
.a
n.a
n
.a
n.a
n
.a
n.a
n
.a
n.a
n
.a
n.a
n
.a
n.a
n
.a
n.a
n.
a n
.a
Av
erag
e (d
istric
ts)
201,
564
36.3
23,2
124.
984
30.
26,
008
1.2
6,53
40.
949
,488
8.4
100,
792
21.6
9,19
71.
719
,750
2.7
104,
525
21.2
1,78
20.
34,
138
0.4
526,
184
Min
imum
(dist
ricts
)41
,278
13.7
00.
00
0.0
285
0.1
00.
01,
328
0.3
10,1
955.
30
0.0
00.
03,
252
0.8
00.
00
0.0
188,
934
M
axim
um (d
istric
ts)
830,
359
53.2
79,2
4610
.05,
104
0.9
22,2
585.
350
,982
7.1
179,
661
18.2
250,
387
34.0
43,3
129.
725
1,73
028
.235
4,19
542
.112
,205
1.4
35,9
602.
01,
843,
998
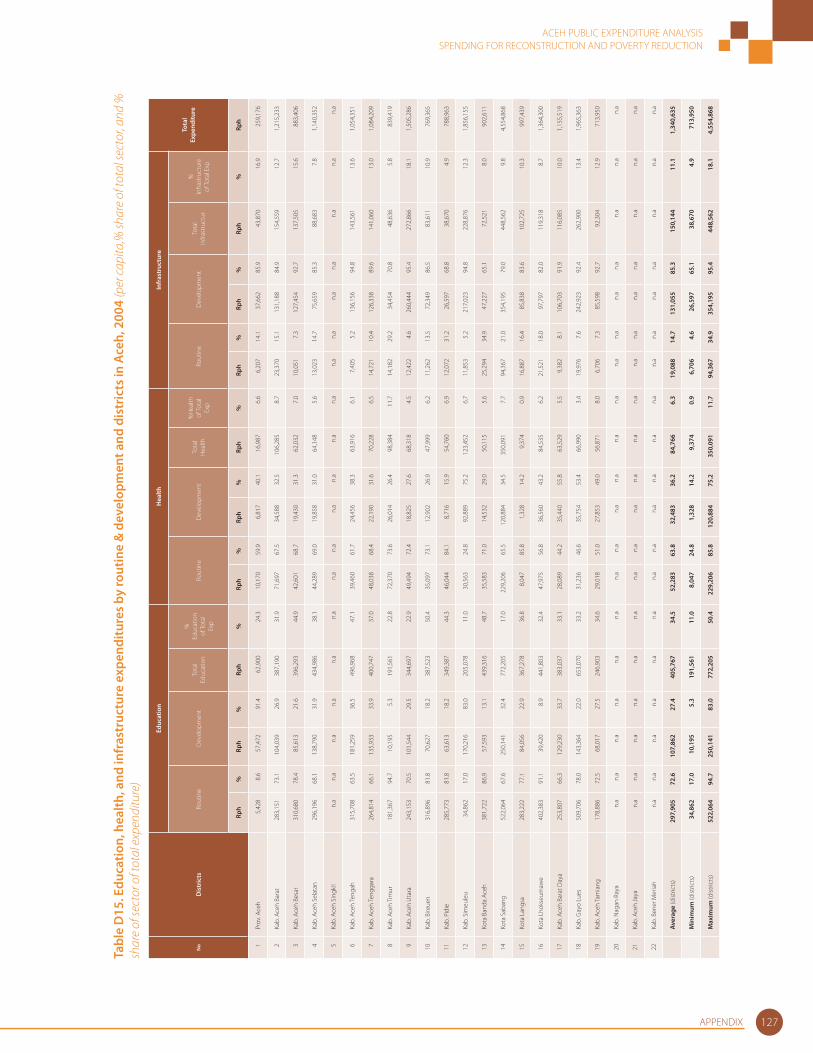
ACEH PUBLIC EXPENDITURE ANALYSISSPENDING FOR RECONSTRUCTION AND POVERTY REDUCTION
APPENDIX 127
Tabl
e D
15. E
duca
tion,
hea
lth, a
nd in
fras
truc
ture
exp
endi
ture
s by
rout
ine
& d
evel
opm
ent a
nd d
istr
icts
in A
ceh,
200
4 (p
er ca
pita
,% sh
are
of to
tal s
ecto
r, an
d %
sh
are
of se
ctor
of t
otal
exp
endi
ture
)
No
Dis
tric
ts
Educ
atio
nH
ealth
Infr
astr
uctu
re
Tota
l Ex
pend
iture
Rout
ine
Dev
elop
men
tTo
tal
Educ
atio
n
%
Educ
atio
n of
Tota
l Ex
p
Rout
ine
Dev
elop
men
tTo
tal
Hea
lth
%H
ealth
of
Tota
l Ex
pRo
utin
eD
evel
opm
ent
Tota
l In
frast
ruct
ur
%
Infra
stru
ctur
e of
Tota
l Exp
Rph
%Rp
h%
Rph
%Rp
h%
Rph
%Rp
h%
Rph
%Rp
h%
Rph
%Rp
h
1Pr
ov. A
ceh
5,42
8 8.
657
,472
91
.462
,900
24
.310
,170
59
.96,
817
40.1
16,9
87
6.6
6,20
7 14
.137
,662
85
.943
,870
16
.9
2
59,1
76
2Ka
b. A
ceh
Bara
t28
3,15
1 73
.110
4,03
9 26
.938
7,19
0 31
.971
,697
67
.534
,588
32.5
106,
285
8.7
23,3
70
15.1
131,
188
84.9
154,
559
12.7
1
,215
,233
3Ka
b. A
ceh
Besa
r31
0,68
0 78
.485
,613
21
.639
6,29
3 44
.942
,601
68
.719
,430
31.3
62,0
32
7.0
10,0
51
7.3
127,
454
92.7
137,
505
15.6
883
,406
4Ka
b. A
ceh
Sela
tan
296,
196
68.1
138,
790
31.9
434,
986
38.1
44,2
89
69.0
19,8
5831
.064
,148
5.
613
,023
14
.775
,659
85
.388
,683
7.
8
1,1
40,3
52
5Ka
b. A
ceh
Sing
kil
n.a
n.a
n.a
n.a
n.a
n.a
n.a
n.a
n.a
n.a
n.a
n.a
n.a
n.a
n.a
n.a
n.a
n.a
n.a
6Ka
b. A
ceh
Teng
ah
315,
708
63.5
18
1,25
9 36
.5
496,
968
47.1
39
,460
61
.7
24,4
56
38.3
63
,916
6.
1 7,
405
5.2
136,
156
94.8
14
3,56
1 13
.6
1,05
4,35
1
7Ka
b. A
ceh
Teng
gara
264,
814
66.1
135,
933
33.9
400,
747
37.0
48,0
38
68.4
22,1
9031
.670
,228
6.
514
,721
10
.412
6,33
8 89
.614
1,06
0 13
.0
1,0
84,2
09
8Ka
b. A
ceh
Tim
ur18
1,36
7 94
.710
,195
5.
319
1,56
1 22
.872
,370
73
.626
,014
26.4
98,3
84
11.7
14,1
82
29.2
34,4
54
70.8
48,6
36
5.8
839
,419
9Ka
b. A
ceh
Uta
ra24
3,15
3 70
.510
1,54
4 29
.534
4,69
7 22
.949
,494
72
.418
,825
27.6
68,3
18
4.5
12,4
22
4.6
260,
444
95.4
272,
866
18.1
1
,505
,286
10Ka
b. B
ireue
n31
6,89
6 81
.870
,627
18
.238
7,52
3 50
.435
,097
73
.112
,902
26.9
47,9
99
6.2
11,2
62
13.5
72,3
49
86.5
83,6
11
10.9
769
,365
11Ka
b. P
idie
285,
773
81.8
63,6
13
18.2
349,
387
44.3
46,0
44
84.1
8,71
615
.954
,760
6.
912
,072
31
.226
,597
68
.838
,670
4.
9
7
88,9
63
12Ka
b. S
imeu
leu
34,8
62
17.0
170,
216
83.0
205,
078
11.0
30,5
63
24.8
92,8
8975
.212
3,45
2 6.
711
,853
5.
221
7,02
3 94
.822
8,87
6 12
.3
1,8
56,1
55
13Ko
ta B
anda
Ace
h38
1,72
2 86
.957
,593
13
.143
9,31
6 48
.735
,583
71
.014
,532
29.0
50,1
15
5.6
25,2
94
34.9
47,2
27
65.1
72,5
21
8.0
902
,611
14Ko
ta S
aban
g52
2,06
4 67
.625
0,14
1 32
.477
2,20
5 17
.022
9,20
6 65
.512
0,88
434
.535
0,09
1 7.
794
,367
21
.035
4,19
5 79
.044
8,56
2 9.
8
4,5
54,8
68
15Ko
ta L
angs
a28
3,22
2 77
.184
,056
22
.936
7,27
8 36
.88,
047
85.8
1,32
814
.29,
374
0.9
16,8
87
16.4
85,8
38
83.6
102,
725
10.3
997
,439
16Ko
ta L
hoks
eum
awe
402,
383
91.1
39,4
20
8.9
441,
803
32.4
47,9
75
56.8
36,5
6043
.284
,535
6.
221
,521
18
.097
,797
82
.011
9,31
8 8.
7
1,3
64,3
00
17Ka
b. A
ceh
Bara
t Day
a25
3,80
7 66
.312
9,23
0 33
.738
3,03
7 33
.128
,089
44
.235
,440
55.8
63,5
29
5.5
9,38
2 8.
110
6,70
3 91
.911
6,08
5 10
.0
1,1
55,5
19
18Ka
b. G
ayo
Lues
509,
706
78.0
143,
364
22.0
653,
070
33.2
31,2
36
46.6
35,7
5453
.466
,990
3.
419
,976
7.
624
2,92
3 92
.426
2,90
0 13
.4
1,9
65,3
63
19Ka
b. A
ceh
Tam
iang
178,
886
72.5
68,0
17
27.5
246,
903
34.6
29,0
18
51.0
27,8
5349
.056
,871
8.
06,
706
7.3
85,5
98
92.7
92,3
04
12.9
713
,950
20Ka
b. N
agan
Ray
an.
an.
an.
an.
an.
an.
an.
an.
an.
an.
an.
an.
an.
an.
an.
an.
an.
an.
an.
a
21Ka
b. A
ceh
Jaya
n.a
n.a
n.a
n.a
n.a
n.a
n.a
n.a
n.a
n.a
n.a
n.a
n.a
n.a
n.a
n.a
n.a
n.a
n.a
22Ka
b. B
ener
Mer
iah
n.a
n.a
n.a
n.a
n.a
n.a
n.a
n.a
n.a
n.a
n.a
n.a
n.a
n.a
n.a
n.a
n.a
n.a
n.a
Av
erag
e (d
istric
ts)
297,
905
72.6
10
7,86
2 27
.4
405,
767
34.5
52
,283
63
.8
32,4
83
36.2
84
,766
6.
3 19
,088
14
.7
131,
055
85.3
15
0,14
4 11
.1
1,34
0,63
5
Min
imum
(dist
ricts
)34
,862
17
.0
10,1
95
5.3
191,
561
11.0
8,
047
24.8
1,
328
14.2
9,
374
0.9
6,70
6 4.
6 26
,597
65
.1
38,6
70
4.9
713,
950
M
axim
um (d
istric
ts)
522,
064
94.7
25
0,14
1 83
.0
772,
205
50.4
22
9,20
6 85
.8
120,
884
75.2
35
0,09
1 11
.7
94,3
67
34.9
35
4,19
5 95
.4
448,
562
18.1
4,
554,
868
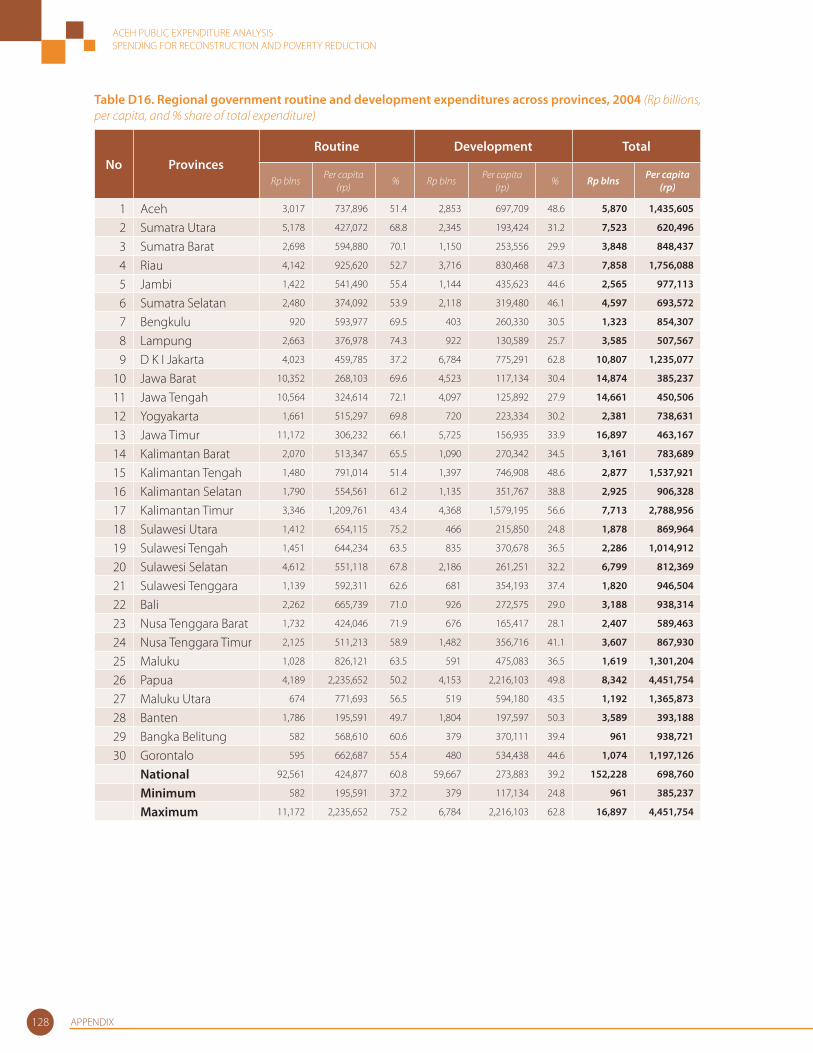
ACEH PUBLIC EXPENDITURE ANALYSISSPENDING FOR RECONSTRUCTION AND POVERTY REDUCTION
APPENDIX128
Table D16. Regional government routine and development expenditures across provinces, 2004 (Rp billions, per capita, and % share of total expenditure)
No ProvincesRoutine Development Total
Rp blnsPer capita
(rp) % Rp blns
Per capita (rp)
% Rp blns Per capita (rp)
1 Aceh 3,017 737,896 51.4 2,853 697,709 48.6 5,870 1,435,605
2 Sumatra Utara 5,178 427,072 68.8 2,345 193,424 31.2 7,523 620,496
3 Sumatra Barat 2,698 594,880 70.1 1,150 253,556 29.9 3,848 848,437
4 Riau 4,142 925,620 52.7 3,716 830,468 47.3 7,858 1,756,088
5 Jambi 1,422 541,490 55.4 1,144 435,623 44.6 2,565 977,113
6 Sumatra Selatan 2,480 374,092 53.9 2,118 319,480 46.1 4,597 693,572
7 Bengkulu 920 593,977 69.5 403 260,330 30.5 1,323 854,307
8 Lampung 2,663 376,978 74.3 922 130,589 25.7 3,585 507,567
9 D K I Jakarta 4,023 459,785 37.2 6,784 775,291 62.8 10,807 1,235,077
10 Jawa Barat 10,352 268,103 69.6 4,523 117,134 30.4 14,874 385,237
11 Jawa Tengah 10,564 324,614 72.1 4,097 125,892 27.9 14,661 450,506
12 Yogyakarta 1,661 515,297 69.8 720 223,334 30.2 2,381 738,631
13 Jawa Timur 11,172 306,232 66.1 5,725 156,935 33.9 16,897 463,167
14 Kalimantan Barat 2,070 513,347 65.5 1,090 270,342 34.5 3,161 783,689
15 Kalimantan Tengah 1,480 791,014 51.4 1,397 746,908 48.6 2,877 1,537,921
16 Kalimantan Selatan 1,790 554,561 61.2 1,135 351,767 38.8 2,925 906,328
17 Kalimantan Timur 3,346 1,209,761 43.4 4,368 1,579,195 56.6 7,713 2,788,956
18 Sulawesi Utara 1,412 654,115 75.2 466 215,850 24.8 1,878 869,964
19 Sulawesi Tengah 1,451 644,234 63.5 835 370,678 36.5 2,286 1,014,912
20 Sulawesi Selatan 4,612 551,118 67.8 2,186 261,251 32.2 6,799 812,369
21 Sulawesi Tenggara 1,139 592,311 62.6 681 354,193 37.4 1,820 946,504
22 Bali 2,262 665,739 71.0 926 272,575 29.0 3,188 938,314
23 Nusa Tenggara Barat 1,732 424,046 71.9 676 165,417 28.1 2,407 589,463
24 Nusa Tenggara Timur 2,125 511,213 58.9 1,482 356,716 41.1 3,607 867,930
25 Maluku 1,028 826,121 63.5 591 475,083 36.5 1,619 1,301,204
26 Papua 4,189 2,235,652 50.2 4,153 2,216,103 49.8 8,342 4,451,754
27 Maluku Utara 674 771,693 56.5 519 594,180 43.5 1,192 1,365,873
28 Banten 1,786 195,591 49.7 1,804 197,597 50.3 3,589 393,188
29 Bangka Belitung 582 568,610 60.6 379 370,111 39.4 961 938,721
30 Gorontalo 595 662,687 55.4 480 534,438 44.6 1,074 1,197,126
National 92,561 424,877 60.8 59,667 273,883 39.2 152,228 698,760
Minimum 582 195,591 37.2 379 117,134 24.8 961 385,237
Maximum 11,172 2,235,652 75.2 6,784 2,216,103 62.8 16,897 4,451,754
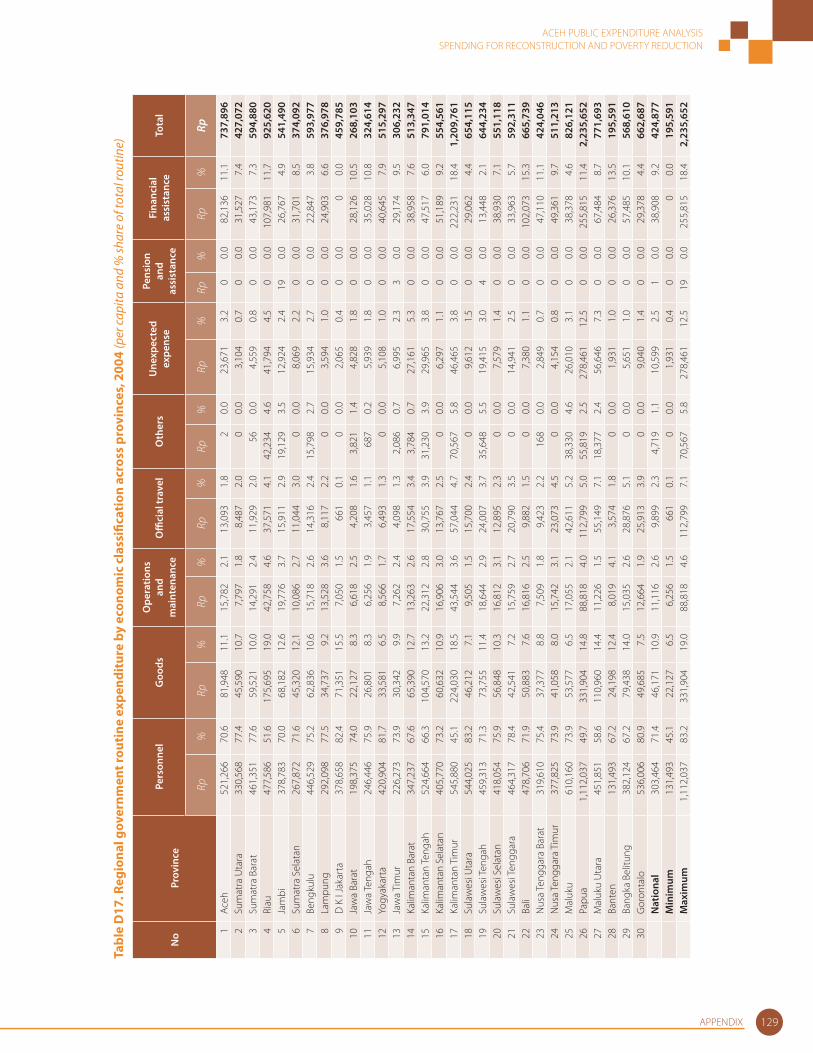
ACEH PUBLIC EXPENDITURE ANALYSISSPENDING FOR RECONSTRUCTION AND POVERTY REDUCTION
APPENDIX 129
Tabl
e D
17. R
egio
nal g
over
nmen
t rou
tine
exp
endi
ture
by
econ
omic
cla
ssifi
cati
on a
cros
s pr
ovin
ces,
200
4 (p
er ca
pita
and
% sh
are
of to
tal r
outin
e)
No
Prov
ince
Pers
onne
l G
oods
Ope
ratio
ns
and
mai
nten
ance
Offi
cial
trav
elO
ther
sU
nexp
ecte
d ex
pens
e
Pens
ion
and
assi
stan
ce
Fina
ncia
l as
sist
ance
To
tal
Rp%
Rp%
Rp%
Rp%
Rp%
Rp%
Rp%
Rp%
Rp
1Ac
eh
521,
266
70.6
81,9
4811
.115
,782
2.1
13,0
931.
82
0.0
23,6
713.
20
0.0
82,1
3611
.173
7,89
62
Sum
atra
Uta
ra33
0,56
877
.445
,590
10.7
7,79
71.
88,
487
2.0
00.
03,
104
0.7
00.
031
,527
7.4
427,
072
3Su
mat
ra B
arat
461,
351
77.6
59,5
2110
.014
,291
2.4
11,9
292.
056
0.0
4,55
90.
80
0.0
43,1
737.
359
4,88
04
Riau
477,
586
51.6
175,
695
19.0
42,7
584.
637
,571
4.1
42,2
344.
641
,794
4.5
00.
010
7,98
111
.792
5,62
05
Jam
bi37
8,78
370
.068
,182
12.6
19,7
763.
715
,911
2.9
19,1
293.
512
,924
2.4
190.
026
,767
4.9
541,
490
6Su
mat
ra S
elat
an26
7,87
271
.645
,320
12.1
10,0
862.
711
,044
3.0
00.
08,
069
2.2
00.
031
,701
8.5
374,
092
7Be
ngku
lu44
6,52
975
.262
,836
10.6
15,7
182.
614
,316
2.4
15,7
982.
715
,934
2.7
00.
022
,847
3.8
593,
977
8La
mpu
ng29
2,09
877
.534
,737
9.2
13,5
283.
68,
117
2.2
00.
03,
594
1.0
00.
024
,903
6.6
376,
978
9D
K I
Jaka
rta
378,
658
82.4
71,3
5115
.57,
050
1.5
661
0.1
00.
02,
065
0.4
00.
00
0.0
459,
785
10Ja
wa
Bara
t19
8,37
574
.022
,127
8.3
6,61
82.
54,
208
1.6
3,82
11.
44,
828
1.8
00.
028
,126
10.5
268,
103
11Ja
wa
Teng
ah24
6,44
675
.926
,801
8.3
6,25
61.
93,
457
1.1
687
0.2
5,93
91.
80
0.0
35,0
2810
.832
4,61
412
Yogy
akar
ta42
0,90
481
.733
,581
6.5
8,56
61.
76,
493
1.3
00.
05,
108
1.0
00.
040
,645
7.9
515,
297
13Ja
wa
Tim
ur22
6,27
373
.930
,342
9.9
7,26
22.
44,
098
1.3
2,08
60.
76,
995
2.3
30.
029
,174
9.5
306,
232
14Ka
liman
tan
Bara
t34
7,23
767
.665
,390
12.7
13,2
632.
617
,554
3.4
3,78
40.
727
,161
5.3
00.
038
,958
7.6
513,
347
15Ka
liman
tan
Teng
ah52
4,66
466
.310
4,57
013
.222
,312
2.8
30,7
553.
931
,230
3.9
29,9
653.
80
0.0
47,5
176.
079
1,01
416
Kalim
anta
n Se
lata
n40
5,77
073
.260
,632
10.9
16,9
063.
013
,767
2.5
00.
06,
297
1.1
00.
051
,189
9.2
554,
561
17Ka
liman
tan
Tim
ur54
5,88
045
.122
4,03
018
.543
,544
3.6
57,0
444.
770
,567
5.8
46,4
653.
80
0.0
222,
231
18.4
1,20
9,76
118
Sula
wes
i Uta
ra54
4,02
583
.246
,212
7.1
9,50
51.
515
,700
2.4
00.
09,
612
1.5
00.
029
,062
4.4
654,
115
19Su
law
esi T
enga
h45
9,31
371
.373
,755
11.4
18,6
442.
924
,007
3.7
35,6
485.
519
,415
3.0
40.
013
,448
2.1
644,
234
20Su
law
esi S
elat
an41
8,05
475
.956
,848
10.3
16,8
123.
112
,895
2.3
00.
07,
579
1.4
00.
038
,930
7.1
551,
118
21Su
law
esi T
engg
ara
464,
317
78.4
42,5
417.
215
,759
2.7
20,7
903.
50
0.0
14,9
412.
50
0.0
33,9
635.
759
2,31
122
Bali
478,
706
71.9
50,8
837.
616
,816
2.5
9,88
21.
50
0.0
7,38
01.
10
0.0
102,
073
15.3
665,
739
23N
usa
Teng
gara
Bar
at31
9,61
075
.437
,377
8.8
7,50
91.
89,
423
2.2
168
0.0
2,84
90.
70
0.0
47,1
1011
.142
4,04
624
Nus
a Te
ngga
ra T
imur
377,
825
73.9
41,0
588.
015
,742
3.1
23,0
734.
50
0.0
4,15
40.
80
0.0
49,3
619.
751
1,21
325
Mal
uku
610,
160
73.9
53,5
776.
517
,055
2.1
42,6
115.
238
,330
4.6
26,0
103.
10
0.0
38,3
784.
682
6,12
126
Papu
a1,
112,
037
49.7
331,
904
14.8
88,8
184.
011
2,79
95.
055
,819
2.5
278,
461
12.5
00.
025
5,81
511
.42,
235,
652
27M
aluk
u U
tara
451,
851
58.6
110,
960
14.4
11,2
261.
555
,149
7.1
18,3
772.
456
,646
7.3
00.
067
,484
8.7
771,
693
28Ba
nten
131,
493
67.2
24,1
9812
.48,
019
4.1
3,57
41.
80
0.0
1,93
11.
00
0.0
26,3
7613
.519
5,59
129
Bang
ka B
elitu
ng38
2,12
467
.279
,438
14.0
15,0
352.
628
,876
5.1
00.
05,
651
1.0
00.
057
,485
10.1
568,
610
30G
oron
talo
536,
006
80.9
49,6
857.
512
,664
1.9
25,9
133.
90
0.0
9,04
01.
40
0.0
29,3
784.
466
2,68
7
Nat
iona
l30
3,46
471
.446
,171
10.9
11,1
162.
69,
899
2.3
4,71
91.
110
,599
2.5
10.
038
,908
9.2
424,
877
M
inim
um13
1,49
345
.122
,127
6.5
6,25
61.
566
10.
10
0.0
1,93
10.
40
0.0
00.
019
5,59
1
Max
imum
1,11
2,03
783
.233
1,90
419
.088
,818
4.6
112,
799
7.1
70,5
675.
827
8,46
112
.519
0.0
255,
815
18.4
2,23
5,65
2
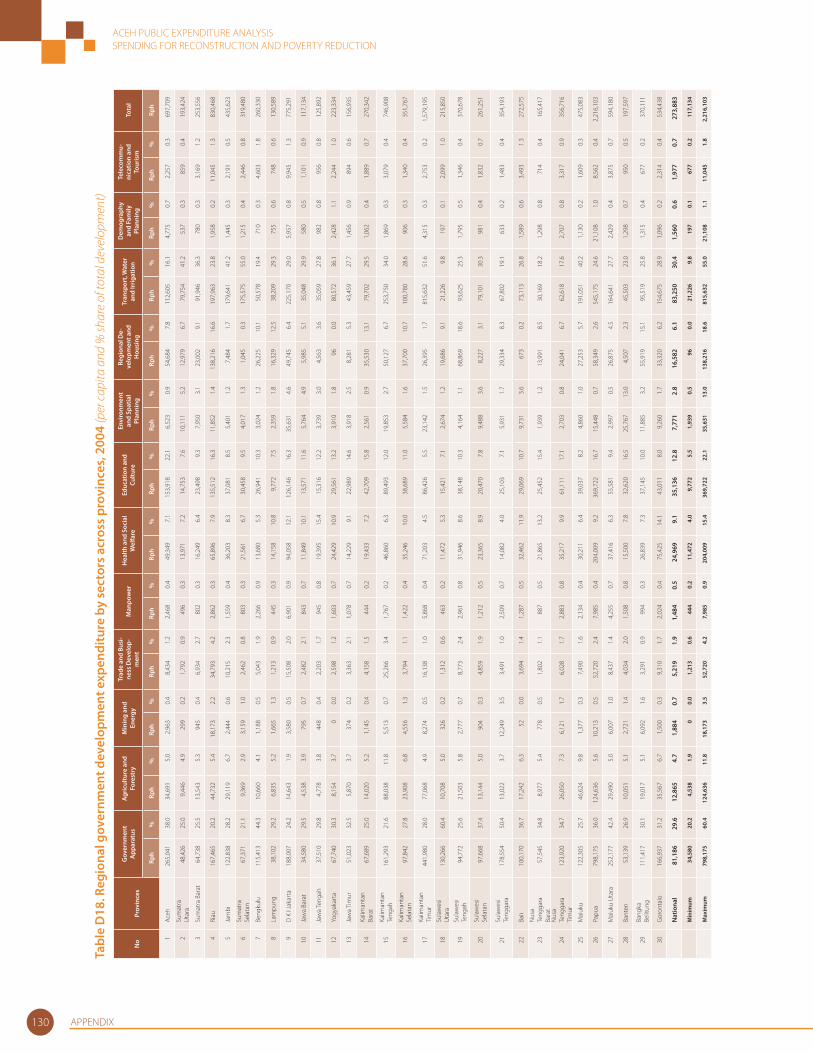
ACEH PUBLIC EXPENDITURE ANALYSISSPENDING FOR RECONSTRUCTION AND POVERTY REDUCTION
APPENDIX130
Tabl
e D
18. R
egio
nal g
over
nmen
t dev
elop
men
t exp
endi
ture
by
sect
ors
acro
ss p
rovi
nces
, 200
4 (p
er ca
pita
and
% sh
are
of to
tal d
evel
opm
ent)
No
Prov
ince
s
Gov
ernm
ent
App
arat
usA
gric
ultu
re a
nd
Fore
stry
Min
ing
and
Ener
gy
Trad
e an
d Bu
si-
ness
Dev
elop
-m
ent
Man
pow
erH
ealth
and
Soc
ial
Wel
fare
Educ
atio
n an
d Cu
lture
Envi
ronm
ent
and
Spat
ial
Plan
ning
Regi
onal
De-
velo
pmen
t and
H
ousi
ng
Tran
spor
t, W
ater
an
d Ir
riga
tion
Dem
ogra
phy
and
Fam
ily
Plan
ning
Tele
com
mu-
nica
tion
and
Tour
ism
Tota
l
Rph
%Rp
h%
Rph
%Rp
h%
Rph
%Rp
h%
Rph
%Rp
h%
Rph
%Rp
h%
Rph
%Rp
h%
Rph
1Ac
eh
265,
041
38.0
34,6
915.
02,
963
0.4
8,43
41.
22,
468
0.4
49,3
497.
115
3,91
822
.16,
523
0.9
54,6
847.
811
2,60
516
.14,
775
0.7
2,25
70.
369
7,70
9
2Su
mat
ra
Uta
ra48
,426
25.0
9,44
64.
929
90.
21,
792
0.9
496
0.3
13,9
717.
214
,753
7.6
10,1
115.
212
,979
6.7
79,7
5441
.253
70.
385
90.
419
3,42
4
3Su
mat
ra B
arat
64,7
3825
.513
,543
5.3
945
0.4
6,93
42.
780
20.
316
,249
6.4
23,4
989.
37,
950
3.1
23,0
029.
191
,946
36.3
780
0.3
3,16
91.
225
3,55
6
4Ri
au16
7,46
520
.244
,732
5.4
18,1
732.
234
,793
4.2
2,86
20.
365
,896
7.9
135,
512
16.3
11,8
521.
413
8,21
616
.619
7,96
323
.81,
958
0.2
11,0
451.
383
0,46
8
5Ja
mbi
122,
838
28.2
29,1
196.
72,
444
0.6
10,2
152.
31,
559
0.4
36,2
038.
337
,081
8.5
5,40
11.
27,
484
1.7
179,
641
41.2
1,44
50.
32,
191
0.5
435,
623
6Su
mat
ra
Sela
tan
67,3
7121
.19,
369
2.9
3,15
91.
02,
462
0.8
803
0.3
21,5
616.
730
,458
9.5
4,01
71.
31,
045
0.3
175,
575
55.0
1,21
50.
42,
446
0.8
319,
480
7Be
ngku
lu11
5,41
344
.310
,660
4.1
1,18
80.
55,
043
1.9
2,26
60.
913
,680
5.3
26,9
4110
.33,
024
1.2
26,2
2510
.150
,578
19.4
710
0.3
4,60
31.
826
0,33
0
8La
mpu
ng38
,102
29.2
6,83
55.
21,
665
1.3
1,21
30.
944
50.
314
,158
10.8
9,77
27.
52,
359
1.8
16,3
2912
.538
,209
29.3
755
0.6
748
0.6
130,
589
9D
K I
Jaka
rta
188,
007
24.2
14,6
431.
93,
580
0.5
15,5
082.
06,
901
0.9
94,0
5812
.112
6,14
616
.335
,631
4.6
49,7
456.
422
5,17
029
.05,
957
0.8
9,94
51.
377
5,29
1
10Ja
wa
Bara
t34
,580
29.5
4,53
83.
979
50.
72,
482
2.1
843
0.7
11,8
4910
.113
,571
11.6
5,76
44.
95,
985
5.1
35,0
4829
.958
00.
51,
101
0.9
117,
134
11Ja
wa
Teng
ah37
,510
29.8
4,77
83.
844
80.
42,
203
1.7
945
0.8
19,3
9515
.415
,316
12.2
3,73
93.
04,
563
3.6
35,0
5927
.898
20.
895
60.
812
5,89
2
12Yo
gyak
arta
67,7
4030
.38,
154
3.7
00.
02,
598
1.2
1,60
30.
724
,429
10.9
29,5
6113
.23,
910
1.8
960.
080
,572
36.1
2,42
81.
12,
244
1.0
223,
334
13Ja
wa
Tim
ur51
,023
32.5
5,87
03.
737
40.
23,
363
2.1
1,07
80.
714
,229
9.1
22,9
8914
.63,
918
2.5
8,28
15.
343
,459
27.7
1,45
60.
989
40.
615
6,93
5
14Ka
liman
tan
Bara
t67
,689
25.0
14,0
205.
21,
145
0.4
4,15
81.
544
40.
219
,433
7.2
42,7
0915
.82,
561
0.9
35,5
3013
.179
,702
29.5
1,06
20.
41,
889
0.7
270,
342
15Ka
liman
tan
Teng
ah16
1,29
321
.688
,038
11.8
5,51
30.
725
,266
3.4
1,76
70.
246
,860
6.3
89,4
9312
.019
,853
2.7
50,1
276.
725
3,75
034
.01,
869
0.3
3,07
90.
474
6,90
8
16Ka
liman
tan
Sela
tan
97,8
4227
.823
,908
6.8
4,55
61.
33,
794
1.1
1,42
20.
435
,246
10.0
38,6
8911
.05,
584
1.6
37,7
0010
.710
0,78
028
.690
60.
31,
340
0.4
351,
767
17Ka
liman
tan
Tim
ur44
1,98
028
.077
,068
4.9
8,27
40.
516
,138
1.0
5,86
80.
471
,203
4.5
86,4
265.
523
,142
1.5
26,3
951.
781
5,63
251
.64,
315
0.3
2,75
30.
21,
579,
195
18Su
law
esi
Uta
ra13
0,26
660
.410
,708
5.0
326
0.2
1,31
20.
646
30.
211
,472
5.3
15,4
217.
12,
674
1.2
19,6
869.
121
,226
9.8
197
0.1
2,09
91.
021
5,85
0
19Su
law
esi
Teng
ah94
,772
25.6
21,5
035.
82,
777
0.7
8,77
32.
42,
961
0.8
31,9
468.
638
,148
10.3
4,16
41.
168
,869
18.6
93,6
2525
.31,
795
0.5
1,34
60.
437
0,67
8
20Su
law
esi
Sela
tan
97,6
6837
.413
,144
5.0
904
0.3
4,85
91.
91,
212
0.5
23,3
658.
920
,470
7.8
9,48
83.
68,
227
3.1
79,1
0130
.398
10.
41,
832
0.7
261,
251
21Su
law
esi
Teng
gara
178,
554
50.4
13,0
223.
712
,249
3.5
3,49
11.
02,
509
0.7
14,0
824.
025
,103
7.1
5,93
11.
729
,334
8.3
67,8
0219
.163
30.
21,
483
0.4
354,
193
22Ba
li10
0,17
036
.717
,242
6.3
520.
03,
694
1.4
1,28
70.
532
,462
11.9
29,0
6910
.79,
731
3.6
673
0.2
73,1
1326
.81,
589
0.6
3,49
31.
327
2,57
5
23N
usa
Teng
gara
Ba
rat
57,5
4534
.88,
977
5.4
778
0.5
1,80
21.
188
70.
521
,865
13.2
25,4
5215
.41,
939
1.2
13,9
918.
530
,169
18.2
1,29
80.
871
40.
416
5,41
7
24N
usa
Teng
gara
Ti
mur
123,
920
34.7
26,0
507.
36,
121
1.7
6,02
81.
72,
883
0.8
35,2
179.
961
,111
17.1
2,70
30.
824
,041
6.7
62,6
1817
.62,
707
0.8
3,31
70.
935
6,71
6
25M
aluk
u12
2,30
525
.746
,624
9.8
1,37
70.
37,
490
1.6
2,13
40.
430
,211
6.4
39,0
378.
24,
860
1.0
27,2
535.
719
1,05
140
.21,
130
0.2
1,60
90.
347
5,08
3
26Pa
pua
798,
175
36.0
124,
636
5.6
10,2
130.
552
,720
2.4
7,98
50.
420
4,00
99.
236
9,72
216
.715
,448
0.7
58,3
492.
654
5,17
524
.621
,108
1.0
8,56
20.
42,
216,
103
27M
aluk
u U
tara
252,
177
42.4
29,4
905.
06,
007
1.0
8,43
71.
44,
255
0.7
37,4
166.
355
,581
9.4
2,99
70.
526
,875
4.5
164,
641
27.7
2,42
90.
43,
875
0.7
594,
180
28Ba
nten
53,1
3926
.910
,051
5.1
2,72
11.
44,
034
2.0
1,50
80.
815
,500
7.8
32,6
2016
.525
,767
13.0
4,50
72.
345
,503
23.0
1,29
80.
795
00.
519
7,59
7
29Ba
ngka
Be
litun
g11
1,41
730
.119
,017
5.1
6,09
21.
63,
291
0.9
994
0.3
26,8
397.
337
,145
10.0
11,8
853.
255
,919
15.1
95,5
1925
.81,
315
0.4
677
0.2
370,
111
30G
oron
talo
166,
937
31.2
35,5
676.
71,
500
0.3
9,31
01.
72,
024
0.4
75,4
2514
.143
,011
8.0
9,26
01.
733
,320
6.2
154,
675
28.9
1,09
60.
22,
314
0.4
534,
438
N
atio
nal
81,1
8629
.612
,865
4.7
1,88
40.
75,
219
1.9
1,48
40.
524
,969
9.1
35,1
3612
.87,
771
2.8
16,5
826.
183
,250
30.4
1,56
00.
61,
977
0.7
273,
883
Min
imum
34,5
8020
.24,
538
1.9
00.
01,
213
0.6
444
0.2
11,4
724.
09,
772
5.5
1,93
90.
596
0.0
21,2
269.
819
70.
167
70.
211
7,13
4
M
axim
um79
8,17
560
.412
4,63
611
.818
,173
3.5
52,7
204.
27,
985
0.9
204,
009
15.4
369,
722
22.1
35,6
3113
.013
8,21
618
.681
5,63
255
.021
,108
1.1
11,0
451.
82,
216,
103
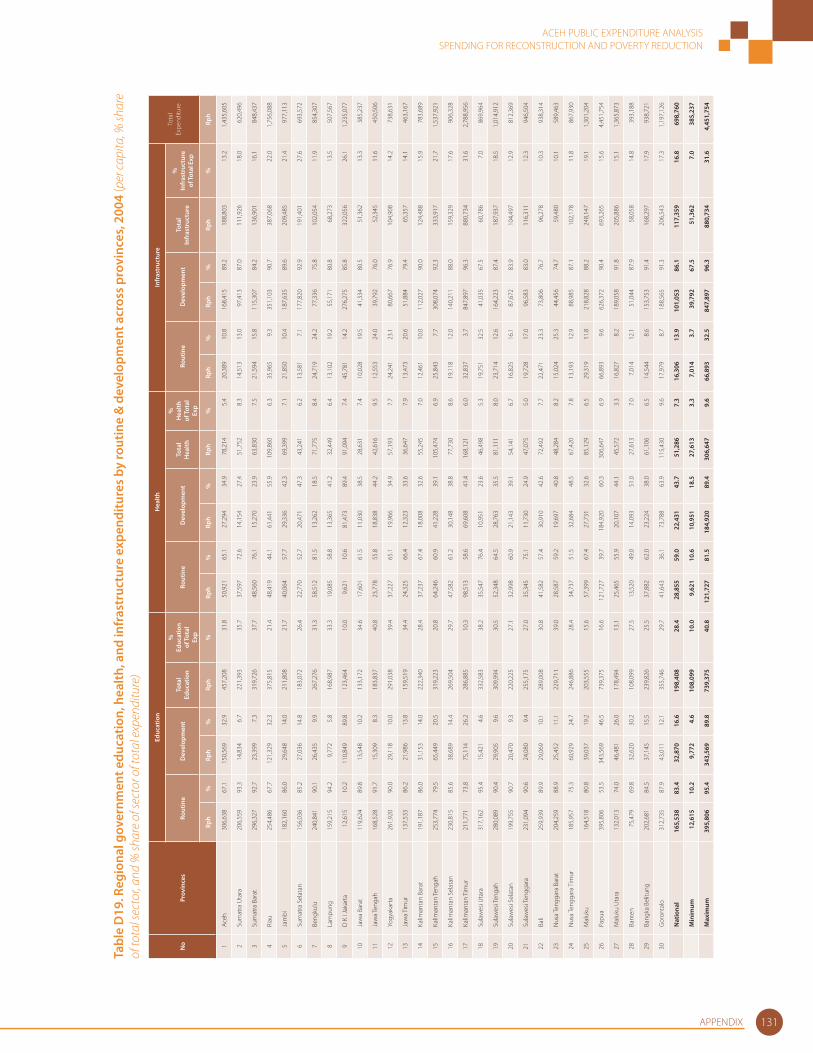
ACEH PUBLIC EXPENDITURE ANALYSISSPENDING FOR RECONSTRUCTION AND POVERTY REDUCTION
APPENDIX 131
Tabl
e D
19. R
egio
nal g
over
nmen
t edu
catio
n, h
ealth
, and
infr
astr
uctu
re e
xpen
ditu
res
by ro
utin
e &
dev
elop
men
t acr
oss
prov
ince
s, 2
004
(per
capi
ta, %
shar
e of
tota
l sec
tor,
and
% sh
are
of se
ctor
of t
otal
exp
endi
ture
)
No
Prov
ince
s
Educ
atio
nH
ealth
Infr
astr
uctu
re
Tota
l Ex
pend
iture
Rout
ine
Dev
elop
men
tTo
tal
Educ
atio
n
%
Educ
atio
n of
Tot
al
Exp
Rout
ine
Dev
elop
men
tTo
tal
Hea
lth
%
Hea
lth
of T
otal
Ex
p
Rout
ine
Dev
elop
men
tTo
tal
Infr
astr
uctu
re
%
Infr
astr
uctu
re
of T
otal
Exp
Rph
%Rp
h%
Rph
%Rp
h%
Rph
%Rp
h%
Rph
%Rp
h%
Rph
%Rp
h
1Ac
eh
306,
638
67.1
150,
569
32.9
457,
208
31.8
50,9
2165
.127
,294
34.9
78,2
145.
420
,389
10.8
168,
415
89.2
188,
803
13.2
1,43
5,60
5
2Su
mat
ra U
tara
206,
559
93.3
14,8
346.
722
1,39
335
.737
,597
72.6
14,1
5427
.451
,752
8.3
14,5
1313
.097
,413
87.0
111,
926
18.0
620,
496
3Su
mat
ra B
arat
296,
327
92.7
23,3
997.
331
9,72
637
.748
,560
76.1
15,2
7023
.963
,830
7.5
21,5
9415
.811
5,30
784
.213
6,90
116
.184
8,43
7
4Ri
au25
4,48
667
.712
1,32
932
.337
5,81
521
.448
,419
44.1
61,4
4155
.910
9,86
06.
335
,965
9.3
351,
103
90.7
387,
068
22.0
1,75
6,08
8
5Ja
mbi
182,
160
86.0
29,6
4814
.021
1,80
821
.740
,064
57.7
29,3
3642
.369
,399
7.1
21,8
5010
.418
7,63
589
.620
9,48
521
.497
7,11
3
6Su
mat
ra S
elat
an15
6,03
685
.227
,036
14.8
183,
072
26.4
22,7
7052
.720
,471
47.3
43,2
416.
213
,581
7.1
177,
820
92.9
191,
401
27.6
693,
572
7Be
ngku
lu24
0,84
190
.126
,435
9.9
267,
276
31.3
58,5
1281
.513
,262
18.5
71,7
758.
424
,719
24.2
77,3
3675
.810
2,05
411
.985
4,30
7
8La
mpu
ng15
9,21
594
.29,
772
5.8
168,
987
33.3
19,0
8558
.813
,365
41.2
32,4
496.
413
,102
19.2
55,1
7180
.868
,273
13.5
507,
567
9D
K I
Jaka
rta
12,6
1510
.211
0,84
989
.812
3,46
410
.09,
621
10.6
81,4
7389
.491
,094
7.4
45,7
8114
.227
6,27
585
.832
2,05
626
.11,
235,
077
10Ja
wa
Bara
t11
9,62
489
.813
,548
10.2
133,
172
34.6
17,6
0161
.511
,030
38.5
28,6
317.
410
,028
19.5
41,3
3480
.551
,362
13.3
385,
237
11Ja
wa
Teng
ah16
8,52
891
.715
,309
8.3
183,
837
40.8
23,7
7855
.818
,838
44.2
42,6
169.
512
,553
24.0
39,7
9276
.052
,345
11.6
450,
506
12Yo
gyak
arta
261,
920
90.0
29,1
1810
.029
1,03
839
.437
,227
65.1
19,9
6634
.957
,193
7.7
24,2
4123
.180
,667
76.9
104,
908
14.2
738,
631
13Ja
wa
Tim
ur13
7,53
386
.221
,986
13.8
159,
519
34.4
24,3
2566
.412
,323
33.6
36,6
477.
913
,473
20.6
51,8
8479
.465
,357
14.1
463,
167
14Ka
liman
tan
Bara
t19
1,18
786
.031
,153
14.0
222,
340
28.4
37,2
3767
.418
,008
32.6
55,2
457.
012
,461
10.0
112,
027
90.0
124,
488
15.9
783,
689
15Ka
liman
tan
Teng
ah25
3,77
479
.565
,449
20.5
319,
223
20.8
64,2
4660
.941
,228
39.1
105,
474
6.9
25,8
437.
730
8,07
492
.333
3,91
721
.71,
537,
921
16Ka
liman
tan
Sela
tan
230,
815
85.6
38,6
8914
.426
9,50
429
.747
,582
61.2
30,1
4838
.877
,730
8.6
19,1
1812
.014
0,21
188
.015
9,32
917
.690
6,32
8
17Ka
liman
tan
Tim
ur21
1,77
173
.875
,114
26.2
286,
885
10.3
98,5
1358
.669
,608
41.4
168,
121
6.0
32,8
373.
784
7,89
796
.388
0,73
431
.62,
788,
956
18Su
law
esi U
tara
317,
162
95.4
15,4
214.
633
2,58
338
.235
,547
76.4
10,9
5123
.646
,498
5.3
19,7
5132
.541
,035
67.5
60,7
867.
086
9,96
4
19Su
law
esi T
enga
h28
0,08
990
.429
,905
9.6
309,
994
30.5
52,3
4864
.528
,763
35.5
81,1
118.
023
,714
12.6
164,
223
87.4
187,
937
18.5
1,01
4,91
2
20Su
law
esi S
elat
an19
9,75
590
.720
,470
9.3
220,
225
27.1
32,9
9860
.921
,143
39.1
54,1
416.
716
,825
16.1
87,6
7283
.910
4,49
712
.981
2,36
9
21Su
law
esi T
engg
ara
231,
094
90.6
24,0
809.
425
5,17
527
.035
,345
75.1
11,7
3024
.947
,075
5.0
19,7
2817
.096
,583
83.0
116,
311
12.3
946,
504
22Ba
li25
9,93
989
.929
,069
10.1
289,
008
30.8
41,5
8257
.430
,910
42.6
72,4
927.
722
,471
23.3
73,8
0676
.796
,278
10.3
938,
314
23N
usa
Teng
gara
Bar
at20
4,25
988
.925
,452
11.1
229,
711
39.0
28,5
8759
.219
,697
40.8
48,2
848.
215
,024
25.3
44,4
5674
.759
,480
10.1
589,
463
24N
usa
Teng
gara
Tim
ur18
5,95
775
.360
,929
24.7
246,
886
28.4
34,7
3751
.532
,684
48.5
67,4
207.
813
,193
12.9
88,9
8587
.110
2,17
811
.886
7,93
0
25M
aluk
u16
4,51
880
.839
,037
19.2
203,
555
15.6
57,3
9967
.427
,731
32.6
85,1
296.
529
,319
11.8
218,
828
88.2
248,
147
19.1
1,30
1,20
4
26Pa
pua
395,
806
53.5
343,
569
46.5
739,
375
16.6
121,
727
39.7
184,
920
60.3
306,
647
6.9
66,8
939.
662
6,37
290
.469
3,26
515
.64,
451,
754
27M
aluk
u U
tara
132,
013
74.0
46,4
8126
.017
8,49
413
.125
,465
55.9
20,1
0744
.145
,572
3.3
16,8
278.
218
9,05
891
.820
5,88
615
.11,
365,
873
28Ba
nten
75,4
7969
.832
,620
30.2
108,
099
27.5
13,5
2049
.014
,093
51.0
27,6
137.
07,
014
12.1
51,0
4487
.958
,058
14.8
393,
188
29Ba
ngka
Bel
itung
202,
681
84.5
37,1
4515
.523
9,82
625
.537
,882
62.0
23,2
2438
.061
,106
6.5
14,5
448.
615
3,75
391
.416
8,29
717
.993
8,72
1
30G
oron
talo
312,
735
87.9
43,0
1112
.135
5,74
629
.741
,643
36.1
73,7
8863
.911
5,43
09.
617
,979
8.7
188,
565
91.3
206,
543
17.3
1,19
7,12
6
N
atio
nal
165,
538
83.4
32,8
7016
.619
8,40
828
.428
,855
59.0
22,4
3143
.751
,286
7.3
16,3
0613
.910
1,05
386
.111
7,35
916
.869
8,76
0
Min
imum
12,6
1510
.29,
772
4.6
108,
099
10.0
9,62
110
.610
,951
18.5
27,6
133.
37,
014
3.7
39,7
9267
.551
,362
7.0
385,
237
M
axim
um39
5,80
695
.434
3,56
989
.873
9,37
540
.812
1,72
781
.518
4,92
089
.430
6,64
79.
666
,893
32.5
847,
897
96.3
880,
734
31.6
4,45
1,75
4
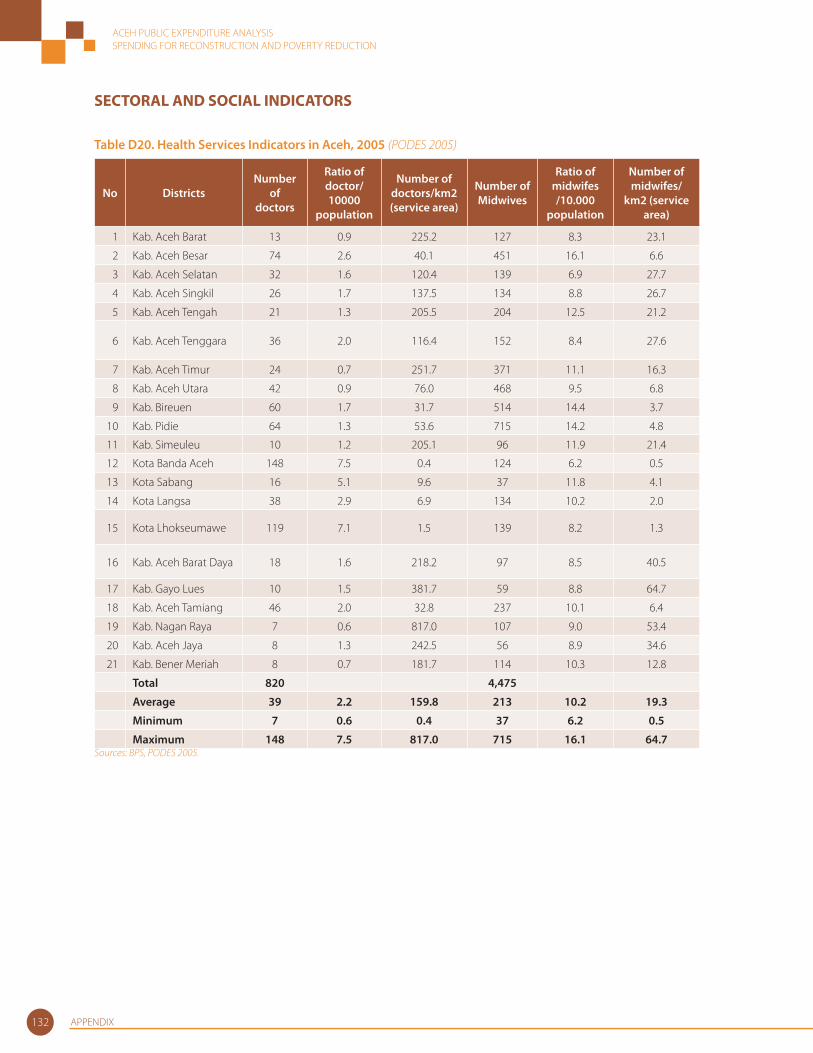
ACEH PUBLIC EXPENDITURE ANALYSISSPENDING FOR RECONSTRUCTION AND POVERTY REDUCTION
APPENDIX132
SECTORAL AND SOCIAL INDICATORS
Table D20. Health Services Indicators in Aceh, 2005 (PODES 2005)
No DistrictsNumber
of doctors
Ratio of doctor/ 10000
population
Number of doctors/km2 (service area)
Number of Midwives
Ratio of midwifes /10.000
population
Number of midwifes/
km2 (service area)
1 Kab. Aceh Barat 13 0.9 225.2 127 8.3 23.1
2 Kab. Aceh Besar 74 2.6 40.1 451 16.1 6.6
3 Kab. Aceh Selatan 32 1.6 120.4 139 6.9 27.7
4 Kab. Aceh Singkil 26 1.7 137.5 134 8.8 26.7
5 Kab. Aceh Tengah 21 1.3 205.5 204 12.5 21.2
6 Kab. Aceh Tenggara 36 2.0 116.4 152 8.4 27.6
7 Kab. Aceh Timur 24 0.7 251.7 371 11.1 16.3
8 Kab. Aceh Utara 42 0.9 76.0 468 9.5 6.8
9 Kab. Bireuen 60 1.7 31.7 514 14.4 3.7
10 Kab. Pidie 64 1.3 53.6 715 14.2 4.8
11 Kab. Simeuleu 10 1.2 205.1 96 11.9 21.4
12 Kota Banda Aceh 148 7.5 0.4 124 6.2 0.5
13 Kota Sabang 16 5.1 9.6 37 11.8 4.1
14 Kota Langsa 38 2.9 6.9 134 10.2 2.0
15 Kota Lhokseumawe 119 7.1 1.5 139 8.2 1.3
16 Kab. Aceh Barat Daya 18 1.6 218.2 97 8.5 40.5
17 Kab. Gayo Lues 10 1.5 381.7 59 8.8 64.7
18 Kab. Aceh Tamiang 46 2.0 32.8 237 10.1 6.4
19 Kab. Nagan Raya 7 0.6 817.0 107 9.0 53.4
20 Kab. Aceh Jaya 8 1.3 242.5 56 8.9 34.6
21 Kab. Bener Meriah 8 0.7 181.7 114 10.3 12.8
Total 820 4,475
Average 39 2.2 159.8 213 10.2 19.3
Minimum 7 0.6 0.4 37 6.2 0.5
Maximum 148 7.5 817.0 715 16.1 64.7Sources: BPS, PODES 2005.
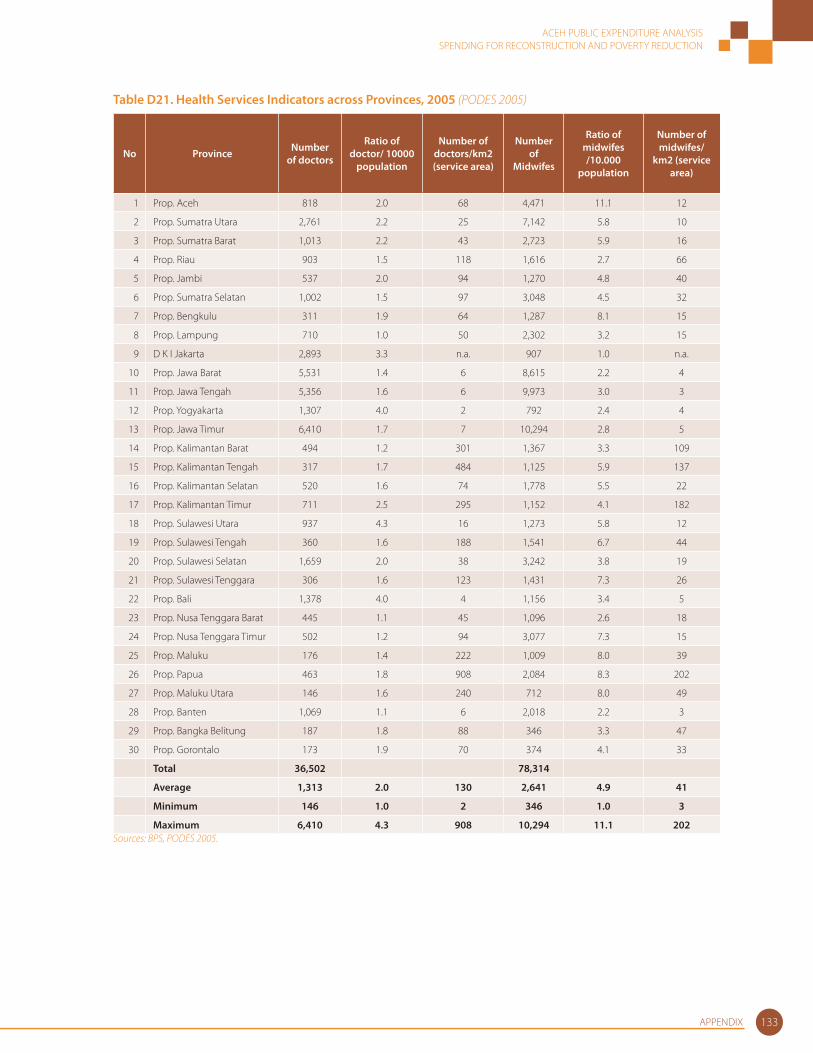
ACEH PUBLIC EXPENDITURE ANALYSISSPENDING FOR RECONSTRUCTION AND POVERTY REDUCTION
APPENDIX 133
Table D21. Health Services Indicators across Provinces, 2005 (PODES 2005)
No Province Number of doctors
Ratio of doctor/ 10000
population
Number of doctors/km2 (service area)
Number of
Midwifes
Ratio of midwifes /10.000
population
Number of midwifes/
km2 (service area)
1 Prop. Aceh 818 2.0 68 4,471 11.1 12
2 Prop. Sumatra Utara 2,761 2.2 25 7,142 5.8 10
3 Prop. Sumatra Barat 1,013 2.2 43 2,723 5.9 16
4 Prop. Riau 903 1.5 118 1,616 2.7 66
5 Prop. Jambi 537 2.0 94 1,270 4.8 40
6 Prop. Sumatra Selatan 1,002 1.5 97 3,048 4.5 32
7 Prop. Bengkulu 311 1.9 64 1,287 8.1 15
8 Prop. Lampung 710 1.0 50 2,302 3.2 15
9 D K I Jakarta 2,893 3.3 n.a. 907 1.0 n.a.
10 Prop. Jawa Barat 5,531 1.4 6 8,615 2.2 4
11 Prop. Jawa Tengah 5,356 1.6 6 9,973 3.0 3
12 Prop. Yogyakarta 1,307 4.0 2 792 2.4 4
13 Prop. Jawa Timur 6,410 1.7 7 10,294 2.8 5
14 Prop. Kalimantan Barat 494 1.2 301 1,367 3.3 109
15 Prop. Kalimantan Tengah 317 1.7 484 1,125 5.9 137
16 Prop. Kalimantan Selatan 520 1.6 74 1,778 5.5 22
17 Prop. Kalimantan Timur 711 2.5 295 1,152 4.1 182
18 Prop. Sulawesi Utara 937 4.3 16 1,273 5.8 12
19 Prop. Sulawesi Tengah 360 1.6 188 1,541 6.7 44
20 Prop. Sulawesi Selatan 1,659 2.0 38 3,242 3.8 19
21 Prop. Sulawesi Tenggara 306 1.6 123 1,431 7.3 26
22 Prop. Bali 1,378 4.0 4 1,156 3.4 5
23 Prop. Nusa Tenggara Barat 445 1.1 45 1,096 2.6 18
24 Prop. Nusa Tenggara Timur 502 1.2 94 3,077 7.3 15
25 Prop. Maluku 176 1.4 222 1,009 8.0 39
26 Prop. Papua 463 1.8 908 2,084 8.3 202
27 Prop. Maluku Utara 146 1.6 240 712 8.0 49
28 Prop. Banten 1,069 1.1 6 2,018 2.2 3
29 Prop. Bangka Belitung 187 1.8 88 346 3.3 47
30 Prop. Gorontalo 173 1.9 70 374 4.1 33
Total 36,502 78,314
Average 1,313 2.0 130 2,641 4.9 41
Minimum 146 1.0 2 346 1.0 3
Maximum 6,410 4.3 908 10,294 11.1 202Sources: BPS, PODES 2005.
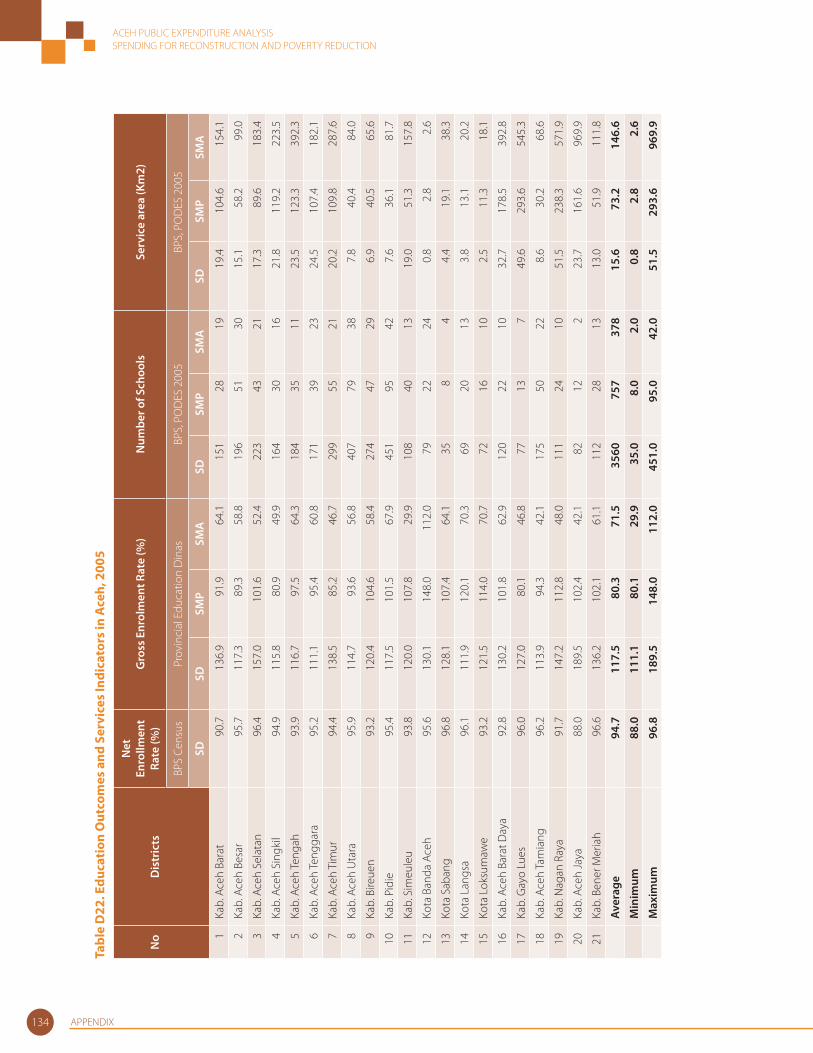
ACEH PUBLIC EXPENDITURE ANALYSISSPENDING FOR RECONSTRUCTION AND POVERTY REDUCTION
APPENDIX134
Tabl
e D
22. E
duca
tion
Out
com
es a
nd S
ervi
ces
Indi
cato
rs in
Ace
h, 2
005
No
Dis
tric
ts
Net
En
rollm
ent
Rate
(%)
Gro
ss E
nrol
men
t Rat
e (%
)N
umbe
r of S
choo
lsSe
rvic
e ar
ea (K
m2)
BPS
Cens
usPr
ovin
cial
Edu
catio
n D
inas
BPS,
PO
DES
200
5BP
S, P
OD
ES 2
005
SD
SDSM
PSM
ASD
SMP
SMA
SDSM
PSM
A
1Ka
b. A
ceh
Bara
t90
.713
6.9
91.9
64.1
151
2819
19.4
104.
615
4.1
2Ka
b. A
ceh
Besa
r95
.711
7.3
89.3
58.8
196
5130
15.1
58.2
99.0
3Ka
b. A
ceh
Sela
tan
96.4
157.
010
1.6
52.4
223
4321
17.3
89.6
183.
4
4Ka
b. A
ceh
Sing
kil
94.9
115.
880
.949
.916
430
1621
.811
9.2
223.
5
5Ka
b. A
ceh
Teng
ah
93.9
116.
797
.564
.318
435
1123
.512
3.3
392.
3
6Ka
b. A
ceh
Teng
gara
95.2
111.
195
.460
.817
139
2324
.510
7.4
182.
1
7Ka
b. A
ceh
Tim
ur94
.413
8.5
85.2
46.7
299
5521
20.2
109.
828
7.6
8Ka
b. A
ceh
Uta
ra95
.911
4.7
93.6
56.8
407
7938
7.8
40.4
84.0
9Ka
b. B
ireue
n93
.212
0.4
104.
658
.427
447
296.
940
.565
.6
10Ka
b. P
idie
95.4
117.
510
1.5
67.9
451
9542
7.6
36.1
81.7
11Ka
b. S
imeu
leu
93.8
120.
010
7.8
29.9
108
4013
19.0
51.3
157.
8
12Ko
ta B
anda
Ace
h95
.613
0.1
148.
011
2.0
7922
240.
82.
82.
6
13Ko
ta S
aban
g96
.812
8.1
107.
464
.135
84
4.4
19.1
38.3
14Ko
ta L
angs
a96
.111
1.9
120.
170
.369
2013
3.8
13.1
20.2
15Ko
ta L
oksu
maw
e93
.212
1.5
114.
070
.772
1610
2.5
11.3
18.1
16Ka
b. A
ceh
Bara
t Day
a92
.813
0.2
101.
862
.912
022
1032
.717
8.5
392.
8
17Ka
b. G
ayo
Lues
96.0
127.
080
.146
.877
137
49.6
293.
654
5.3
18Ka
b. A
ceh
Tam
iang
96.2
113.
994
.342
.117
550
228.
630
.268
.6
19Ka
b. N
agan
Ray
a91
.714
7.2
112.
848
.011
124
1051
.523
8.3
571.
9
20Ka
b. A
ceh
Jaya
88.0
189.
510
2.4
42.1
8212
223
.716
1.6
969.
9
21Ka
b. B
ener
Mer
iah
96.6
136.
210
2.1
61.1
112
2813
13.0
51.9
111.
8
Av
erag
e94
.711
7.5
80.3
71.5
3560
757
378
15.6
73.2
146.
6
M
inim
um88
.011
1.1
80.1
29.9
35.0
8.0
2.0
0.8
2.8
2.6
M
axim
um96
.818
9.5
148.
011
2.0
451.
095
.042
.051
.529
3.6
969.
9
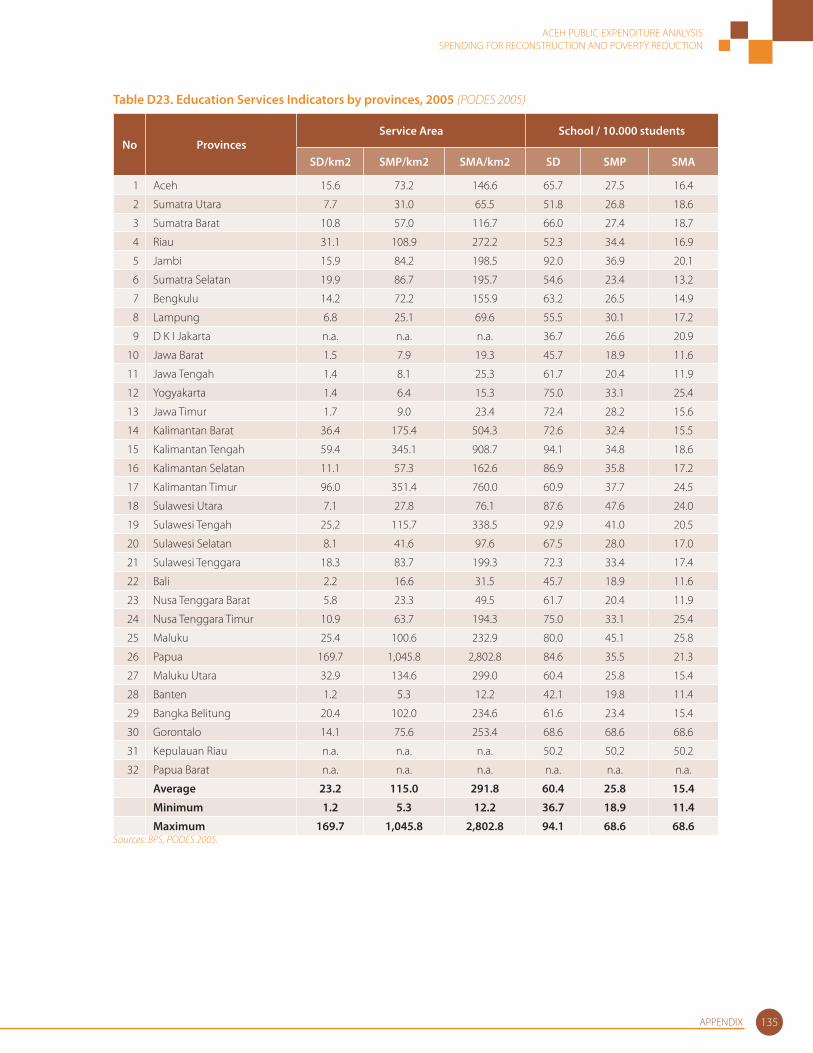
ACEH PUBLIC EXPENDITURE ANALYSISSPENDING FOR RECONSTRUCTION AND POVERTY REDUCTION
APPENDIX 135
Table D23. Education Services Indicators by provinces, 2005 (PODES 2005)
No ProvincesService Area School / 10.000 students
SD/km2 SMP/km2 SMA/km2 SD SMP SMA
1 Aceh 15.6 73.2 146.6 65.7 27.5 16.4
2 Sumatra Utara 7.7 31.0 65.5 51.8 26.8 18.6
3 Sumatra Barat 10.8 57.0 116.7 66.0 27.4 18.7
4 Riau 31.1 108.9 272.2 52.3 34.4 16.9
5 Jambi 15.9 84.2 198.5 92.0 36.9 20.1
6 Sumatra Selatan 19.9 86.7 195.7 54.6 23.4 13.2
7 Bengkulu 14.2 72.2 155.9 63.2 26.5 14.9
8 Lampung 6.8 25.1 69.6 55.5 30.1 17.2
9 D K I Jakarta n.a. n.a. n.a. 36.7 26.6 20.9
10 Jawa Barat 1.5 7.9 19.3 45.7 18.9 11.6
11 Jawa Tengah 1.4 8.1 25.3 61.7 20.4 11.9
12 Yogyakarta 1.4 6.4 15.3 75.0 33.1 25.4
13 Jawa Timur 1.7 9.0 23.4 72.4 28.2 15.6
14 Kalimantan Barat 36.4 175.4 504.3 72.6 32.4 15.5
15 Kalimantan Tengah 59.4 345.1 908.7 94.1 34.8 18.6
16 Kalimantan Selatan 11.1 57.3 162.6 86.9 35.8 17.2
17 Kalimantan Timur 96.0 351.4 760.0 60.9 37.7 24.5
18 Sulawesi Utara 7.1 27.8 76.1 87.6 47.6 24.0
19 Sulawesi Tengah 25.2 115.7 338.5 92.9 41.0 20.5
20 Sulawesi Selatan 8.1 41.6 97.6 67.5 28.0 17.0
21 Sulawesi Tenggara 18.3 83.7 199.3 72.3 33.4 17.4
22 Bali 2.2 16.6 31.5 45.7 18.9 11.6
23 Nusa Tenggara Barat 5.8 23.3 49.5 61.7 20.4 11.9
24 Nusa Tenggara Timur 10.9 63.7 194.3 75.0 33.1 25.4
25 Maluku 25.4 100.6 232.9 80.0 45.1 25.8
26 Papua 169.7 1,045.8 2,802.8 84.6 35.5 21.3
27 Maluku Utara 32.9 134.6 299.0 60.4 25.8 15.4
28 Banten 1.2 5.3 12.2 42.1 19.8 11.4
29 Bangka Belitung 20.4 102.0 234.6 61.6 23.4 15.4
30 Gorontalo 14.1 75.6 253.4 68.6 68.6 68.6
31 Kepulauan Riau n.a. n.a. n.a. 50.2 50.2 50.2
32 Papua Barat n.a. n.a. n.a. n.a. n.a. n.a.
Average 23.2 115.0 291.8 60.4 25.8 15.4
Minimum 1.2 5.3 12.2 36.7 18.9 11.4
Maximum 169.7 1,045.8 2,802.8 94.1 68.6 68.6Sources: BPS, PODES 2005.
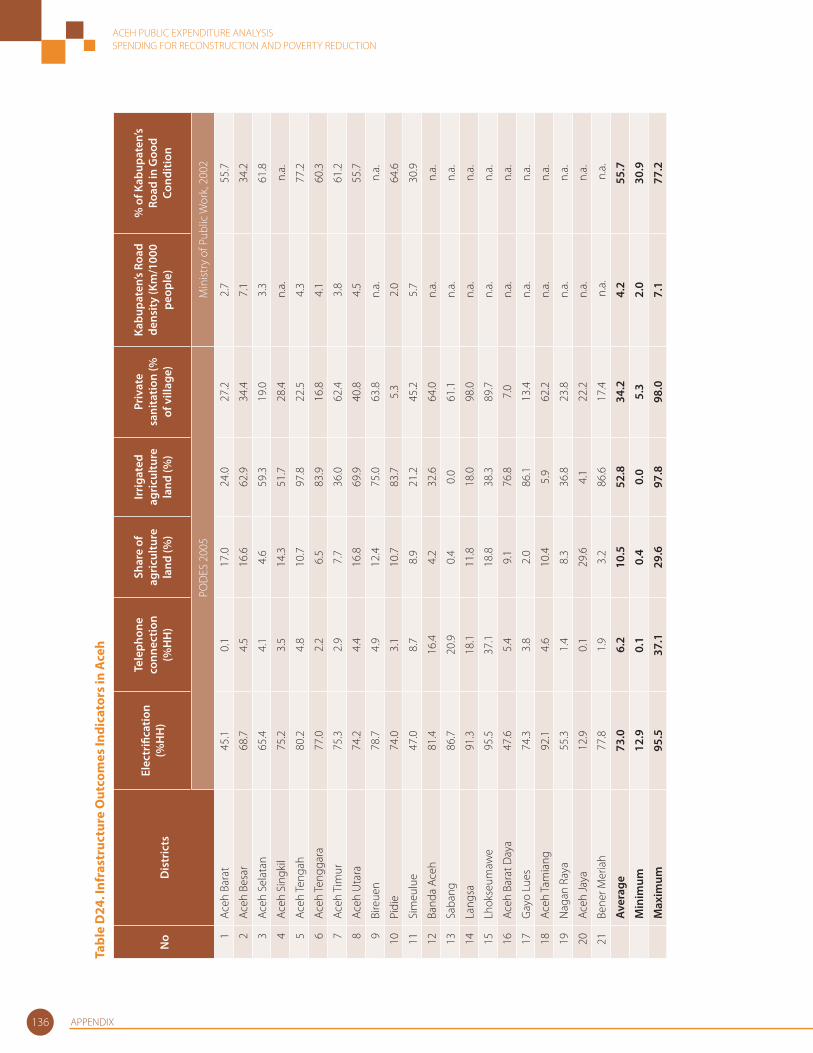
ACEH PUBLIC EXPENDITURE ANALYSISSPENDING FOR RECONSTRUCTION AND POVERTY REDUCTION
APPENDIX136
Tabl
e D
24. I
nfra
stru
ctur
e O
utco
mes
Indi
cato
rs in
Ace
h
No
Dis
tric
ts
Elec
trifi
catio
n (%
HH
)
Tele
phon
e co
nnec
tion
(%H
H)
Shar
e of
ag
ricu
lture
la
nd (%
)
Irri
gate
d ag
ricu
lture
la
nd (%
)
Priv
ate
sani
tatio
n (%
of
vill
age)
Kabu
pate
n’s
Road
de
nsit
y (K
m/1
000
peop
le)
% o
f Kab
upat
en’s
Road
in G
ood
Cond
ition
POD
ES 2
005
Min
istry
of P
ublic
Wor
k, 2
002
1Ac
eh B
arat
45.1
0.1
17.0
24.0
27.2
2.7
55.7
2Ac
eh B
esar
68.7
4.5
16.6
62.9
34.4
7.1
34.2
3Ac
eh S
elat
an65
.44.
14.
659
.319
.03.
361
.8
4Ac
eh S
ingk
il75
.23.
514
.351
.728
.4n.
a.n.
a.
5Ac
eh Te
ngah
80.2
4.8
10.7
97.8
22.5
4.3
77.2
6Ac
eh Te
ngga
ra77
.02.
26.
583
.916
.84.
160
.3
7Ac
eh T
imur
75.3
2.9
7.7
36.0
62.4
3.8
61.2
8Ac
eh U
tara
74.2
4.4
16.8
69.9
40.8
4.5
55.7
9Bi
reue
n78
.74.
912
.475
.063
.8n.
a.n.
a.
10Pi
die
74.0
3.1
10.7
83.7
5.3
2.0
64.6
11Si
meu
lue
47.0
8.7
8.9
21.2
45.2
5.7
30.9
12Ba
nda
Aceh
81.4
16.4
4.2
32.6
64.0
n.a.
n.a.
13Sa
bang
86.7
20.9
0.4
0.0
61.1
n.a.
n.a.
14La
ngsa
91.3
18.1
11.8
18.0
98.0
n.a.
n.a.
15Lh
okse
umaw
e95
.537
.118
.838
.389
.7n.
a.n.
a.
16Ac
eh B
arat
Day
a47
.65.
49.
176
.87.
0n.
a.n.
a.
17G
ayo
Lues
74.3
3.8
2.0
86.1
13.4
n.a.
n.a.
18Ac
eh Ta
mia
ng92
.14.
610
.45.
962
.2n.
a.n.
a.
19N
agan
Ray
a55
.31.
48.
336
.823
.8n.
a.n.
a.
20Ac
eh Ja
ya12
.90.
129
.64.
122
.2n.
a.n.
a.
21Be
ner M
eria
h77
.81.
93.
286
.617
.4 n
.a.
n.a
.
Av
erag
e73
.06.
210
.552
.834
.24.
255
.7
M
inim
um12
.90.
10.
40.
05.
32.
030
.9
M
axim
um95
.537
.129
.697
.898
.07.
177
.2
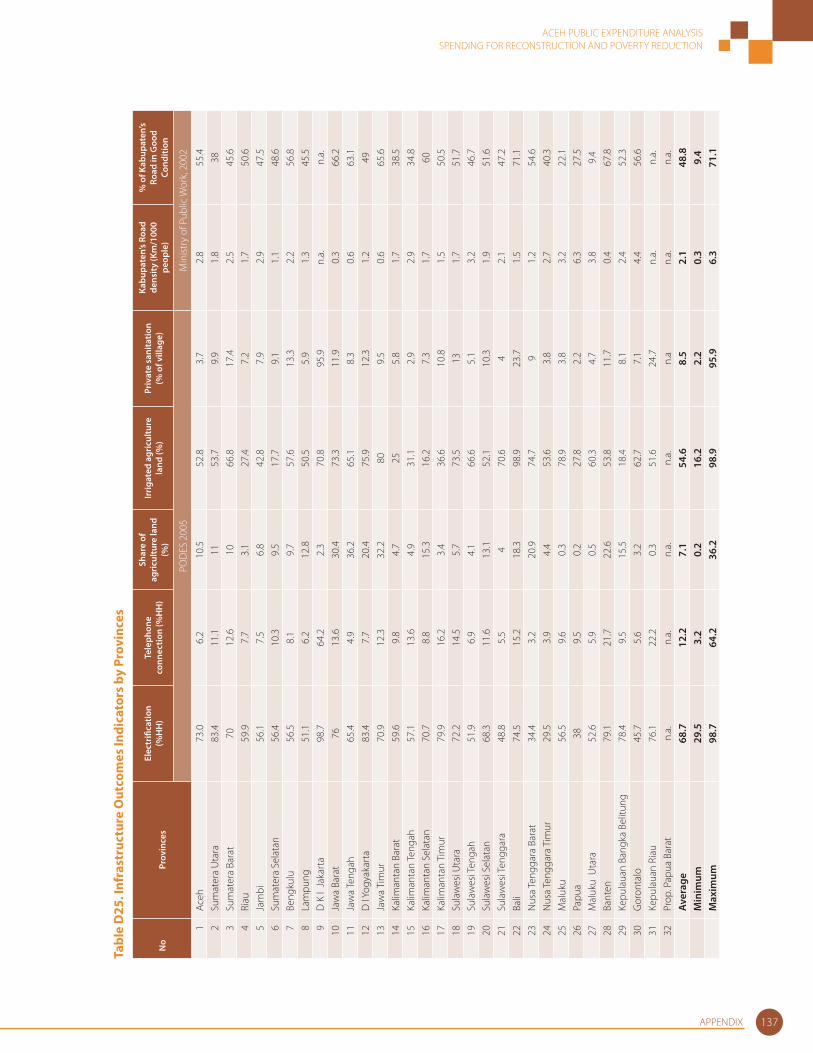
ACEH PUBLIC EXPENDITURE ANALYSISSPENDING FOR RECONSTRUCTION AND POVERTY REDUCTION
APPENDIX 137
Tabl
e D
25. I
nfra
stru
ctur
e O
utco
mes
Indi
cato
rs b
y Pr
ovin
ces
No
Prov
ince
s
Elec
trifi
catio
n (%
HH
)Te
leph
one
conn
ectio
n (%
HH
)
Shar
e of
ag
ricu
lture
land
(%
)
Irri
gate
d ag
ricu
lture
la
nd (%
)Pr
ivat
e sa
nita
tion
(% o
f vill
age)
Kabu
pate
n’s
Road
de
nsit
y (K
m/1
000
peop
le)
% o
f Kab
upat
en’s
Road
in G
ood
Cond
ition
POD
ES 2
005
Min
istry
of P
ublic
Wor
k, 2
002
1Ac
eh73
.06.
210
.552
.83.
72.
855
.42
Sum
ater
a U
tara
83.4
11.1
1153
.79.
91.
838
3Su
mat
era
Bara
t70
12.6
1066
.817
.42.
545
.64
Riau
59.9
7.7
3.1
27.4
7.2
1.7
50.6
5Ja
mbi
56.1
7.5
6.8
42.8
7.9
2.9
47.5
6Su
mat
era
Sela
tan
56.4
10.3
9.5
17.7
9.1
1.1
48.6
7Be
ngku
lu56
.58.
19.
757
.613
.32.
256
.88
Lam
pung
51.1
6.2
12.8
50.5
5.9
1.3
45.5
9D
K I
Jaka
rta
98.7
64.2
2.3
70.8
95.9
n.a.
n.a.
10Ja
wa
Bara
t76
13.6
30.4
73.3
11.9
0.3
66.2
11Ja
wa
Teng
ah65
.44.
936
.265
.18.
30.
663
.112
D I
Yogy
akar
ta83
.47.
720
.475
.912
.31.
249
13Ja
wa
Tim
ur70
.912
.332
.280
9.5
0.6
65.6
14Ka
liman
tan
Bara
t59
.69.
84.
725
5.8
1.7
38.5
15Ka
liman
tan
Teng
ah57
.113
.64.
931
.12.
92.
934
.816
Kalim
anta
n Se
lata
n70
.78.
815
.316
.27.
31.
760
17Ka
liman
tan
Tim
ur79
.916
.23.
436
.610
.81.
550
.518
Sula
wes
i Uta
ra72
.214
.55.
773
.513
1.7
51.7
19Su
law
esi T
enga
h51
.96.
94.
166
.65.
13.
246
.720
Sula
wes
i Sel
atan
68.3
11.6
13.1
52.1
10.3
1.9
51.6
21Su
law
esi T
engg
ara
48.8
5.5
470
.64
2.1
47.2
22Ba
li 74
.515
.218
.398
.923
.71.
571
.123
Nus
a Te
ngga
ra B
arat
34.4
3.2
20.9
74.7
91.
254
.624
Nus
a Te
ngga
ra T
imur
29.5
3.9
4.4
53.6
3.8
2.7
40.3
25M
aluk
u56
.59.
60.
378
.93.
83.
222
.126
Papu
a38
9.5
0.2
27.8
2.2
6.3
27.5
27M
aluk
u U
tara
52.6
5.9
0.5
60.3
4.7
3.8
9.4
28Ba
nten
79.1
21.7
22.6
53.8
11.7
0.4
67.8
29Ke
pula
uan
Bang
ka B
elitu
ng78
.49.
515
.518
.48.
12.
452
.330
Gor
onta
lo45
.75.
63.
262
.77.
14.
456
.631
Kepu
laua
n Ri
au76
.122
.20.
351
.624
.7n.
a.n.
a.32
Prop
. Pap
ua B
arat
n.a.
n.a.
n.a.
n.a.
n.a
n.a.
n.a.
Av
erag
e68
.712
.27.
154
.68.
52.
148
.8
Min
imum
29.5
3.2
0.2
16.2
2.2
0.3
9.4
M
axim
um98
.764
.236
.298
.995
.96.
371
.1

ACEH PUBLIC EXPENDITURE ANALYSISSPENDING FOR RECONSTRUCTION AND POVERTY REDUCTION
APPENDIX138
Table D26. Population by districts in Aceh (1999-2005)
No Districts 1999 2000 2001 2002 2003 2004 2005
1 Kab. Aceh Barat 479,200 440,239 431,787 423,334 228,149 162,250 165,2582 Kab. Aceh Besar 306,149 288,760 291,562 294,364 302,752 303,019 216,9983 Kab. Aceh Selatan 555,280 261,309 285,940 310,571 167,511 186,860 190,5304 Kab. Aceh Singkil 120,040 124,727 129,416 175,175 147,119 152,5945 Kab. Aceh Tengah 265,079 228,380 251,000 273,621 280,058 287,799 192,0276 Kab. Aceh Tenggara 237,929 211,649 214,154 216,660 168,488 168,309 170,2457 Kab. Aceh Timur 781,669 708,830 589,377 469,925 253,257 312,070 309,6998 Kab. Aceh Utara 589,010 632,200 561,065 489,931 396,755 487,369 484,5929 Kab. Bireuen 340,269 341,615 342,962 352,174 349,350 352,312
10 Kab. Aceh Pidie 638,669 479,410 496,686 513,963 519,205 473,500 481,58711 Kab. Simeulue 57,060 56,097 55,134 76,896 71,449 72,11012 Kota Banda Aceh 206,139 219,070 219,831 220,593 269,942 238,699 239,50113 Kota Sabang 24,610 23,649 23,482 23,315 27,531 28,489 29,07914 Kota Langsa 117,260 117,271 117,283 141,212 134,279 134,24715 Kota Lhokseumawe 141,039 141,054 141,068 156,934 138,679 139,93216 Kab. Aceh Barat Daya 153,893 111,370 112,23017 Kab. Gayo Lues 83,921 68,190 68,78418 Kab. Aceh Tamiang 238,824 228,820 228,08919 Kab. Nagan Raya 153,393 111,519 112,96120 Kab. Aceh Jaya 93,905 79,959 82,78921 Kab. Mener Merah 102,336
Total/Province 4,083,734 4,269,164 4,145,648 4,022,140 4,239,975 4,089,098 4,037,900Source: BPS / MoF baseline data for DAU calculation
Table D27. Poverty Headcount (%) and Human Development Index by districts in Aceh
No Districts
Poverty Headcount (%) Human Development Index
1999 2000 2002 2003 2004 1996 1999 2002
BPS/MoF Baseline data for DAU Calculation BPS UNDP
1 Kab. Aceh Barat 18.3 15.0 38.1 36.1 35.7 67.1 64.3 65.62 Kab. Aceh Besar 23.2 22.0 33.2 30.5 29.9 68.4 66.8 67.23 Kab. Aceh Selatan 7.5 12.4 28.3 29.4 27.6 64.2 62.1 63.84 Kab. Aceh Singkil n.a 12.4 28.3 29.5 28.9 n.a n.a 62.25 Kab. Aceh Tengah 14.3 13.0 28.4 28.9 27.9 68.3 66 66.76 Kab. Aceh Tenggara 26.4 26.8 29.8 24.2 23.9 67.7 63.9 66.87 Kab. Aceh Timur 20.4 17.7 25.3 31.6 30.0 69.5 65.4 66.78 Kab. Aceh Utara 37.3 18.5 25.5 38.2 34.2 69.5 63.1 65.99 Kab. Bireuen n.a 18.5 25.3 30.0 29.3 n.a n.a 70.5
10 Kab. Aceh Pidie 2.4 2.5 44.0 38.9 35.2 67.8 64.1 67.811 Kab. Simeuleu n.a 15.0 38.1 35.0 34.3 n.a n.a 61.812 Kota Banda Aceh 5.0 3.4 10.3 9.7 8.9 74.2 70.5 71.913 Kota Sabang 22.8 21.6 36.7 32.4 31.5 70.1 63.7 69.514 Kota Langsa 25.3 16.3 15.3 n.a n.a n.a15 Kota Lhokseumawe 16.4 15.0 n.a n.a n.a16 Kab. Nagan Raya 34.7 35.9 n.a n.a n.a17 Kab. Aceh Jaya 32.0 31.6 n.a n.a n.a18 Kab. Aceh Barat Daya 27.9 28.0 n.a n.a n.a19 Kab. Gayo Lues 32.2 32.4 n.a n.a n.a20 Kab. Aceh Tamiang 26.0 25.2 n.a n.a n.a
Aceh 17.4 15.0 29.8 29.8 28.5 69.4 65.3 66
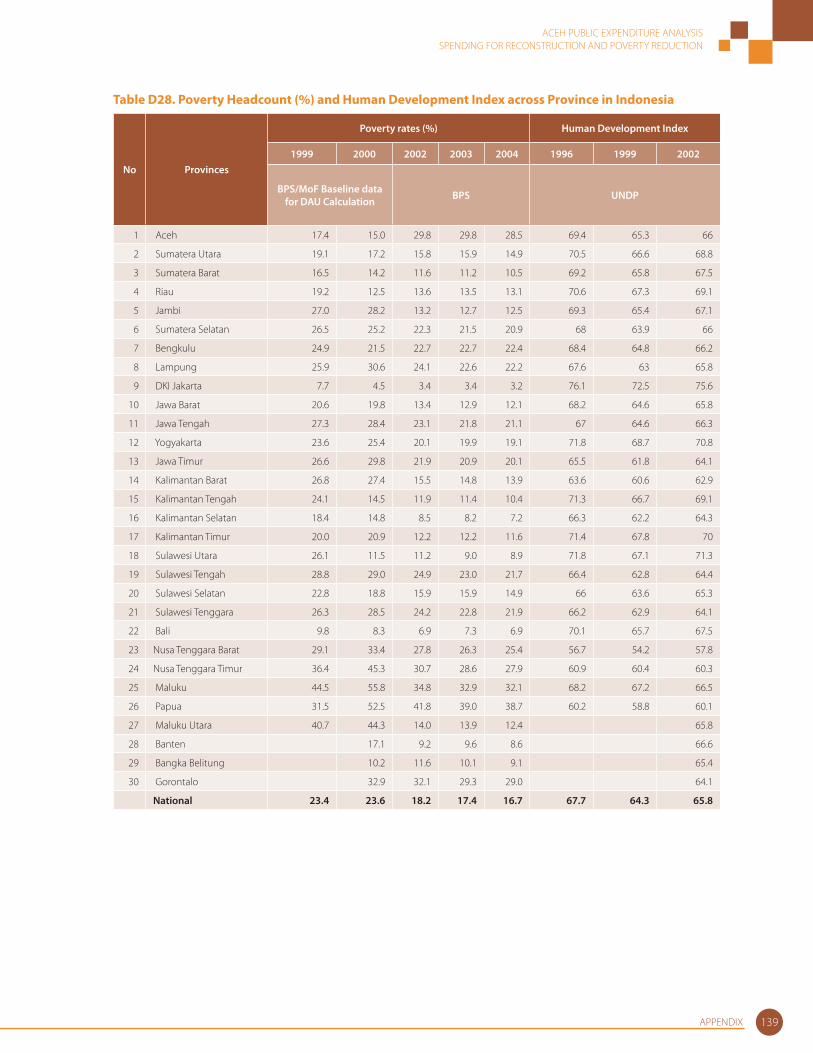
ACEH PUBLIC EXPENDITURE ANALYSISSPENDING FOR RECONSTRUCTION AND POVERTY REDUCTION
APPENDIX 139
Table D28. Poverty Headcount (%) and Human Development Index across Province in Indonesia
No Provinces
Poverty rates (%) Human Development Index
1999 2000 2002 2003 2004 1996 1999 2002
BPS/MoF Baseline data for DAU Calculation BPS UNDP
1 Aceh 17.4 15.0 29.8 29.8 28.5 69.4 65.3 66
2 Sumatera Utara 19.1 17.2 15.8 15.9 14.9 70.5 66.6 68.8
3 Sumatera Barat 16.5 14.2 11.6 11.2 10.5 69.2 65.8 67.5
4 Riau 19.2 12.5 13.6 13.5 13.1 70.6 67.3 69.1
5 Jambi 27.0 28.2 13.2 12.7 12.5 69.3 65.4 67.1
6 Sumatera Selatan 26.5 25.2 22.3 21.5 20.9 68 63.9 66
7 Bengkulu 24.9 21.5 22.7 22.7 22.4 68.4 64.8 66.2
8 Lampung 25.9 30.6 24.1 22.6 22.2 67.6 63 65.8
9 DKI Jakarta 7.7 4.5 3.4 3.4 3.2 76.1 72.5 75.6
10 Jawa Barat 20.6 19.8 13.4 12.9 12.1 68.2 64.6 65.8
11 Jawa Tengah 27.3 28.4 23.1 21.8 21.1 67 64.6 66.3
12 Yogyakarta 23.6 25.4 20.1 19.9 19.1 71.8 68.7 70.8
13 Jawa Timur 26.6 29.8 21.9 20.9 20.1 65.5 61.8 64.1
14 Kalimantan Barat 26.8 27.4 15.5 14.8 13.9 63.6 60.6 62.9
15 Kalimantan Tengah 24.1 14.5 11.9 11.4 10.4 71.3 66.7 69.1
16 Kalimantan Selatan 18.4 14.8 8.5 8.2 7.2 66.3 62.2 64.3
17 Kalimantan Timur 20.0 20.9 12.2 12.2 11.6 71.4 67.8 70
18 Sulawesi Utara 26.1 11.5 11.2 9.0 8.9 71.8 67.1 71.3
19 Sulawesi Tengah 28.8 29.0 24.9 23.0 21.7 66.4 62.8 64.4
20 Sulawesi Selatan 22.8 18.8 15.9 15.9 14.9 66 63.6 65.3
21 Sulawesi Tenggara 26.3 28.5 24.2 22.8 21.9 66.2 62.9 64.1
22 Bali 9.8 8.3 6.9 7.3 6.9 70.1 65.7 67.5
23 Nusa Tenggara Barat 29.1 33.4 27.8 26.3 25.4 56.7 54.2 57.8
24 Nusa Tenggara Timur 36.4 45.3 30.7 28.6 27.9 60.9 60.4 60.3
25 Maluku 44.5 55.8 34.8 32.9 32.1 68.2 67.2 66.5
26 Papua 31.5 52.5 41.8 39.0 38.7 60.2 58.8 60.1
27 Maluku Utara 40.7 44.3 14.0 13.9 12.4 65.8
28 Banten 17.1 9.2 9.6 8.6 66.6
29 Bangka Belitung 10.2 11.6 10.1 9.1 65.4
30 Gorontalo 32.9 32.1 29.3 29.0 64.1
National 23.4 23.6 18.2 17.4 16.7 67.7 64.3 65.8
ACEH PUBLIC EXPENDITURE ANALYSISSPENDING FOR RECONSTRUCTION AND POVERTY REDUCTION
140
References
Aceh Forum. 2006. “Sekilas Aceh.” www.acehforum.or.id/archive/index.php/t-129.html.
Aspinall, E. 2005. “The Helsinki Agreement: A More Promising Basis for Peace in Aceh?” Policy Studies 20. East-West Center, Washington, DC.
_____ and H. Crouch. 2003. “The Aceh Peace Process: Why It Failed.” East-West Center, Washington, DC.
Badan Pusat Statistik (BPS) Provinsi Nanggroe Aceh Darussalam. 2004. Aceh Dalam Angka 2004. Banda Aceh, BPS.
_____. 2005. SPAN: Population Census of Nanggroe Aceh Darussalam.
_____ and International Partners. 2005. “Aceh and Nias One Year after the Tsunami: The Recovery Eff ort and Way Forward.” Jakarta.
BRR (Badan Rehabilitasi dan Rekonstruksi) NAD-Nias and World Bank. 2005. “Rebuilding a Better Aceh and Nias: Stocktaking of the Reconstruction Eff ort.” Jakarta.
BAPPENAS, Natural Resource Management (NRM), and LPEM FEUI. 2000. “Penerimaan Daerah dari Bagi Hasil Sumber Daya Alam.” Jakarta.
Barron, P., S. Clark, and M. Daud. 2005. “Confl ict and Recovery in Aceh.” World Bank, Jakarta.
Brodjonegoro, B., and J. Martinez-Vazquez. 2002. “An Analysis of Indonesia’s Transfer System: Recent Performance and Future Prospects.” Conference on Can Decentralization Help Build Indonesia? Atlanta.
Burke, Adam and Afnan. 2005. “Aceh: Reconstruction in a Confl ict Environment (Views from Civil Society, Donors and NGOs).” Indonesian Social Development Paper 8. Decentralization Support Facilities, Jakarta.
CGI (Consultative Group on Indonesia). 2003. “Promoting Peaceful Development in Aceh.” Brief for the Consultative Group on Indonesia.
Cohen, M. 1999. “Captive of the Cause.” Far Eastern Economic Review (2 September): 16–18.
Depkes, M. 2005. Operational Manual of the Ministry of Health, Government of Indonesia.
GTZ (Deutsche Gesellschaft fur Technische Zusammenarbeit) 2003. “Decentralization in Indonesia Since 1999: An Overview.” Support for Decentralization Measures, www.gtzsfdm.or.id/dec_in_ind.htm
Hedman, E.E. 2005. “State of Emergency, a Strategy of War: Internal Displacement, Forced Relocation, and Involuntary Return in Aceh.” Aceh under Martial Law: Confl ict Violence and Displacements, ed. Eva-Lotta E. Hedman. RSC Working Papers 24. University of Oxford. Hofman, B., K.K. Kadjatmiko, and B.S. Suharnoko. 2006. “Evaluating Fiscal Equalization in Indonesia.” World Bank Policy Working Paper WPS 3911.
Indonesia Relief. 2005. “Three Authorities Raise Indonesian Death Toll.” Indonesia Relief, 10/2/2005. www.indonesia-relief.org/
International Crisis Group. 2001. “Aceh: Why Military Force Won’t Bring Lasting Peace.” ICG Asia Report 17. Jakarta/Brussels.
ACEH PUBLIC EXPENDITURE ANALYSISSPENDING FOR RECONSTRUCTION AND POVERTY REDUCTION
141
International Labour Organization. 2005. “Towards Decent Employment in NAD and Nias.” November.
Jakarta Post. 2002. “Thousands Demonstrate for Riau Island Province.” 1 May.
Kell, T. 1995. “The Roots of the Acehnese Rebellion, 1989–1992.” Cornell Modern Indonesia Project 74. Cornell University, Ithaca.
Lewis, B., and J. Chakeri. 2004. “Development Spending in the Regions.” World Bank Jakarta.
Pemerintah Daerah Papua and World Bank. 2005. “Papua Public Expenditure Analysis: Regional Finance and Service Delivery in Indonesia’s Most Remote Region.”
Pemerintah Indonesia. Keputusan Menteri Keuangan No. 523 tahun 2000 tentang Tata Cara Penganggaran, Penyaluran Dana, Pertanggungjawaban dan Pelaporan Pelaksanaan Dekonsentrasi dan Tugas Pembantuan.
_____. 2000. Keputusan Menteri Keuangan No. 556 tahun 2000 tentang Tatacara Penyaluran Dana Alokasi Umum dan Alokasi Khusus.
_____. 2000. Peraturan Pemerintah Republik Indonesia nomor 107 tahun 2000 tentang Pinjaman Daerah.
_____. 2000. Peraturan Pemerintah Republik Indonesia nomor 129 tahun 2000 tentang Persyaratan Pembentukan dan Kriteria Pemekaran, Penghapusan, dan Penggabungan Daerah.
_____. 2001. Keputusan Menteri Keuangan No. 344 tahun 2001 tentang Penyaluran Dana Bagian Daerah dari Sumber Daya Alam.
_____. 2001. Undang-Undang No. 18 tahun 2001 tentang Otonomi Khusus bagi Provinsi Daerah Istimewa Aceh sebagai Provinsi Nanggroe Aceh Darussalam.
_____. 2001. Undang-undang Republik Indonesia nomor 19 tahun 2001 tentang Penghapusan, dan Penggabungan Daerah.
_____.. 2001. Peraturan Pemerintah Republik Indonesia No. 39 tahun 2001 tentang Penyelenggaraan Dekonsentrasi.
_____.. 2001. Peraturan Pemerintah Republik Indonesia No. 65 tahun 2001 tentang Pajak Daerah.
_____.. 2001. Peraturan Pemerintah Republik Indonesia No. 66 tahun 2001 tentang Retribusi Daerah.
_____. 2002. Anggaran Pendapatan dan Belanja Negara tahun Anggaran 2002.
_____. 2002. Keputusan Menteri Dalam Negeri No. 29 tahun 2002 tentang Pedoman Pengurusan, Pertanggungjawaban dan Pengawasan Keuangan dan Belanja Daerah, Pelaksanaan Tata Usaha Keuangan Daerah dan Penyusunan Perhitungan Anggaran Pendapatan dan Belanjan Daerah.
_____. 2002. Keputusan Menteri Keuangan No. 214 tahun 2002 tentang Penetapan Perkiraan Jumlah Dana Bagian Daerah dari Sumber Daya Alam Minyak Bumi dan Gas Alam, Pertambangan Umum serta Perikanan tahun anggaran 2002.
_____. 2003. Keputusan Menteri Keuangan No. 237 tahun 2003 tentang Penetapan Perkiraan Jumlah Dana Bagian Daerah dari Sumber Daya Alam Minyak Bumi dan Gas Alam tahun anggaran 2003.
_____. 2003. Undang-Undang Republik Indonesia No. 17 tahun 2003 tentang Keuangan Negara.
ACEH PUBLIC EXPENDITURE ANALYSISSPENDING FOR RECONSTRUCTION AND POVERTY REDUCTION
142
_____. 2004. Undang-Undang Republik Indonesia No. 15 tahun 2004 tentang Pemeriksaan Pengelolaan dan Tanggung Jawab Keuangan Negara.
_____. 2004. Undang-Undang No. 32 tahun 2004 tentang Pemerintahan Daerah.
_____. 2004. Undang-Undang No. 33 tahun 2004 tentang Perimbangan Keuangan antara Pemerintah Pusat dan Pemerintahan Daerah.
_____. 2004. Keputusan Menteri Keuangan No. 275 tahun 2004 tentang Penetapan Perkiraan Jumlah Dana Bagian Daerah dari Sumber Daya Alam Minyak Bumi dan Gas Alam tahun anggaran 2004.
_____. 2005. Keputusan Menteri Keuangan No. 42 tahun 2005 tentang Penetapan Perkiraan Jumlah Dana Bagian Daerah dari Sumber Daya Alam Minyak Bumi dan Gas Alam tahun anggaran 2005.
_____. 2005. Peraturan Pemerintah Republik Indonesia No. 54 tahun 2005 tentang Pinjaman Daerah.
_____. 2005. Peraturan Pemerintah Republik Indonesia No. 55 tahun 2005 tentang Dana Perimbangan.
_____. 2005. Peraturan Pemerintah Republik Indonesia No. 56 tahun 2005 tentang Sistem Informasi Keuangan Daerah.
_____. 2005. Peraturan Pemerintah Republik Indonesia No. 58 tahun 2005 tentang Pengelolaan Keuangan Daerah.
Pemerintah Province Nanggroe Aceh Darussalam. 2002. Qanun Provinsi Nanggroe Aceh Darussalam No. 4 tahun 2002 tentang Dana Perimbangan Antara Pemerintah Provinsi dan Pemerintah Local government.
Plummer, J. 2005. Anti-Corruption Eff orts in the Post-tsunami Reconstruction of Water and Sanitation Infrastructure and Services in Aceh, Indonesia, paper presented at the World Water Week in Stockholm, April 2005, www.siwi.org/downloads/downswswww.html
Reid, A. 1988. Southeast Asia in the Age of Commerce 1450–1680, Vol. One: The Lands below the Winds. New Haven: Yale University Press.
_____. 1993 Southeast Asia in the Age of Commerce 1450–1680, Vol. Two: Expansion and Crisis. New Haven: Yale University Press.
Republika. 2006. Wapres Tagih Nama 3000 Anggota GAM. 6 Feb. www_republika_co_id.htm
Ricklefs, M.C. 2001. A History of Modern Indonesia Since 1200. 3d ed. Basingstoke: Palgrave.
Ross, M.L. 2003. “Resources and Rebellion in Aceh, Indonesia.” Economics of Political Violence. A Yale World Bank Report.
Schulze, K.E. 2004. “(GAM): Anatomy of a Separatist Organization.” East-West Center, Washington, DC.
Serambi Indonesia. 2004. “500 Sekolah Terbakar di NAD Selesai tahun 2005.” 29 Nov.
_____. 2004. “Di Dayah Blang Keudah: Murid Masih Belajar di Ruang Darurat.” 3 Dec.
_____. 2006. “Tujuh Kabupaten Belum Tuntaskan APBD: Diduga akan Rawan KKN.” 5 Jun.
Sherlock, S. 2003. “Confl ict in Aceh: A Military Solution?” Current Issues Brief, Information, Analysis and Advice for the Parliament, Canberra, Australia. www.aph.gov.au/library/pubs/CIB/2002-03/03cib32.pdf.
ACEH PUBLIC EXPENDITURE ANALYSISSPENDING FOR RECONSTRUCTION AND POVERTY REDUCTION
143
Sidik, M. 2002. “Perimbangan Keuangan Pusat dan Daerah Sebagai Pelaksanaan Desentralisasi Fiskal.” Seminar Setahun Implementasi Kebijaksanaan Otonomi Daerah di Indonesia, Yogyakarta 2002.
Sukma, R. 2004. “Security Operation in Aceh: Goals, Consequences and Lessons.” Policy Studies 3. East-West Center Washington DC.
UNESCO. 2003. “Education Indicators.” Institute for Statistics. Paris.
U.S. Committee for Refugees. 2001. “Shadow Plays: The Crisis of Refugees and Internally Displaced Peoples in Indonesia.”
World Bank. 2002. “Decentralizing Indonesia.” World Bank Regional Public Expenditure Review Overview Report. World Bank East Asia and Pacifi c Region (EAP), Poverty Reduction and Economic Management (PREM) Unit.
World Bank. 2004. Indonesia: Averting an Infrastructure Crisis: A Framework for Policy and Action.

ACEH PUBLIC EXPENDITURE ANALYSISSPENDING FOR RECONSTRUCTION AND POVERTY REDUCTION
144