ACE Joint Probability Utility Joint Cost & Schedule Risk Analysis ...
17
ACE Joint Probability Utility ACE Joint Probability Utility ACE Joint Probability Utility Joint Cost & Schedule Risk Analysis ACE Joint Probability Utility Joint Cost & Schedule Risk Analysis James Johnson ACEIT Users Conference, Santa Barbara, CA ACEIT Users Conference, Santa Barbara, CA January 2009 Tecolote Research, Inc. Copyright © Tecolote Research, Inc. January 2009
Transcript of ACE Joint Probability Utility Joint Cost & Schedule Risk Analysis ...
ACE Joint Probability UtilityACE Joint Probability UtilityACE Joint Probability Utility
Joint Cost & Schedule Risk Analysis
ACE Joint Probability Utility
Joint Cost & Schedule Risk Analysis
James Johnson
ACEIT Users Conference, Santa Barbara, CAACEIT Users Conference, Santa Barbara, CAJanuary 2009
Tecolote Research, Inc.
Copyright © Tecolote Research, Inc. January 2009
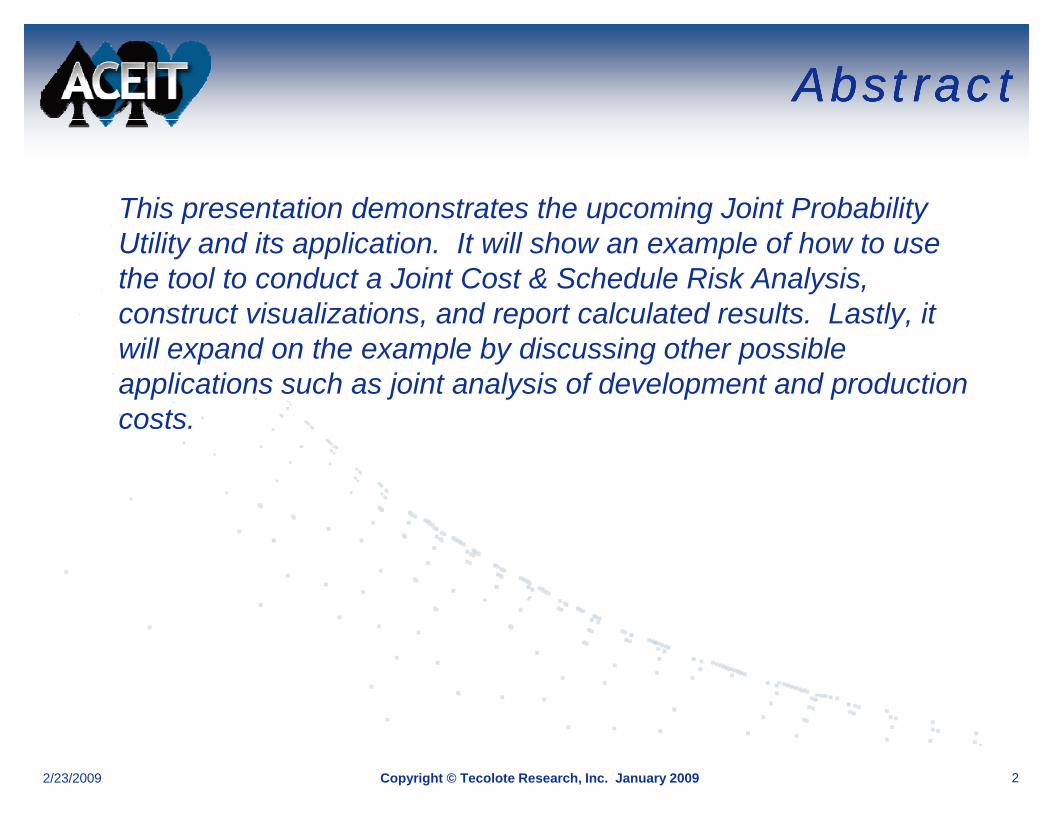
AbstractAbstractAbstractAbstract
This presentation demonstrates the upcoming Joint ProbabilityThis presentation demonstrates the upcoming Joint Probability Utility and its application. It will show an example of how to use the tool to conduct a Joint Cost & Schedule Risk Analysis, construct visualizations and report calculated results Lastly itconstruct visualizations, and report calculated results. Lastly, it will expand on the example by discussing other possible applications such as joint analysis of development and production costs.
22/23/2009 Copyright © Tecolote Research, Inc. January 2009
OutlineOutlineOutlineOutline
What do I mean by Joint Probability? Conducting the Cost Risk AnalysisConducting the Cost Risk AnalysisConducting the Schedule Risk AnalysisKey Factors, End Result, and Definitions
Using the simulation results
Process in Joint Probability Utility (JPU)
Visualization OutputsScatter PlotJoint Probability Contour PlotJo t obab ty Co tou otCumulative Probability Contour Plot
More than just Cost & ScheduleExamples using ACE Tutorial File
Conclusion
32/23/2009 Copyright © Tecolote Research, Inc. January 2009
What is Joint Probability?What is Joint Probability?What is Joint Probability?What is Joint Probability?
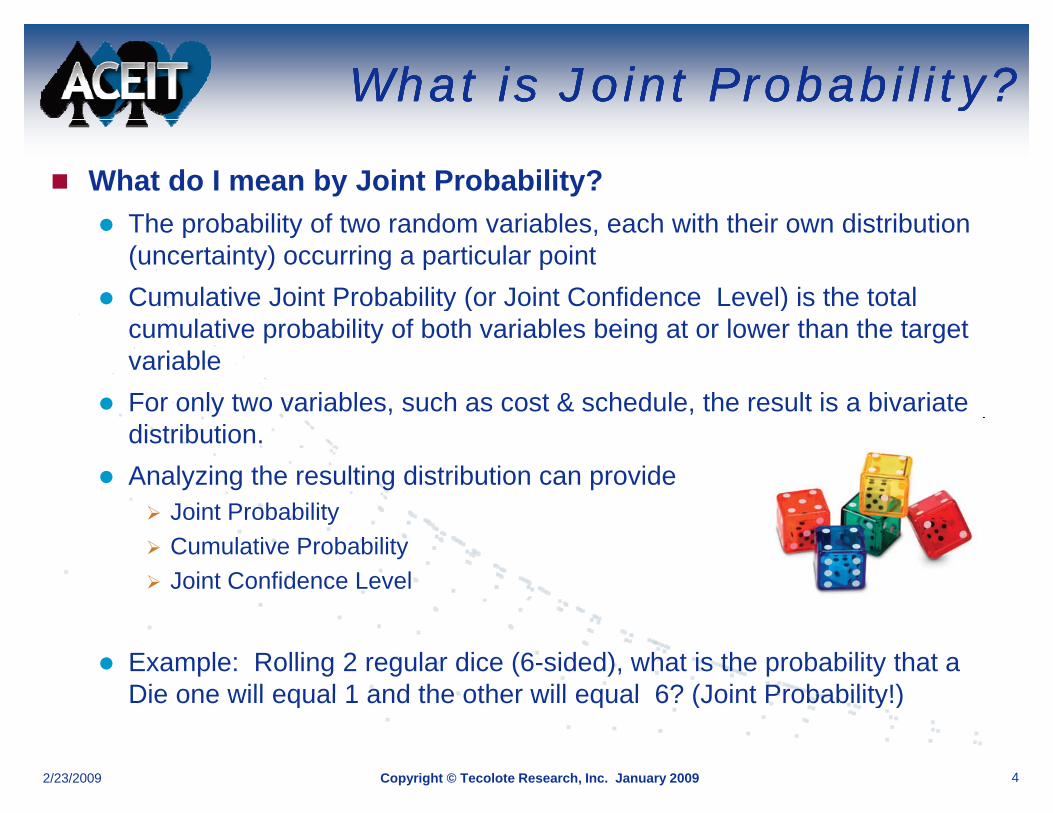
What do I mean by Joint Probability?Th b bilit f t d i bl h ith th i di t ib tiThe probability of two random variables, each with their own distribution (uncertainty) occurring a particular pointCumulative Joint Probability (or Joint Confidence Level) is the total y ( )cumulative probability of both variables being at or lower than the target variableFor only two variables such as cost & schedule the result is a bivariateFor only two variables, such as cost & schedule, the result is a bivariate distribution. Analyzing the resulting distribution can provide
J i P b biliJoint ProbabilityCumulative ProbabilityJoint Confidence Level
Example: Rolling 2 regular dice (6-sided), what is the probability that a Die one will equal 1 and the other will equal 6? (Joint Probability!)Die one will equal 1 and the other will equal 6? (Joint Probability!)
42/23/2009 Copyright © Tecolote Research, Inc. January 2009
Cost Risk AnalysisCost Risk Analysis
To complete JCL on cost & schedule, uncertainty/risk analysis needs to be completedanalysis needs to be completed
Detailed How To? See the AFCAA Cost Risk Uncertainty Handbook
Methods available to include uncertainty as well as discreteMethods available to include uncertainty as well as discrete risksChallenge: Need to understand behavior of costs
JCL…schedule…how is cost affected by schedule changes?Fixed cost increase due to schedule growth, etc
Challenge: Common WBSJCL…schedule…how to load all costs against schedule?Schedule WBS by Activity VS Cost WBS by ProductSchedule WBS by Activity VS. Cost WBS by Product
Flexibility in re-summarizing source detail estimate (ACE!)Ability to specify uncertainty at varying levels (ACE!)Ability to specify uncertainty at varying levels (ACE!)
5 of 172/23/2009 Copyright © Tecolote Research, Inc. January 2009
Schedule Risk AnalysisSchedule Risk Analysis
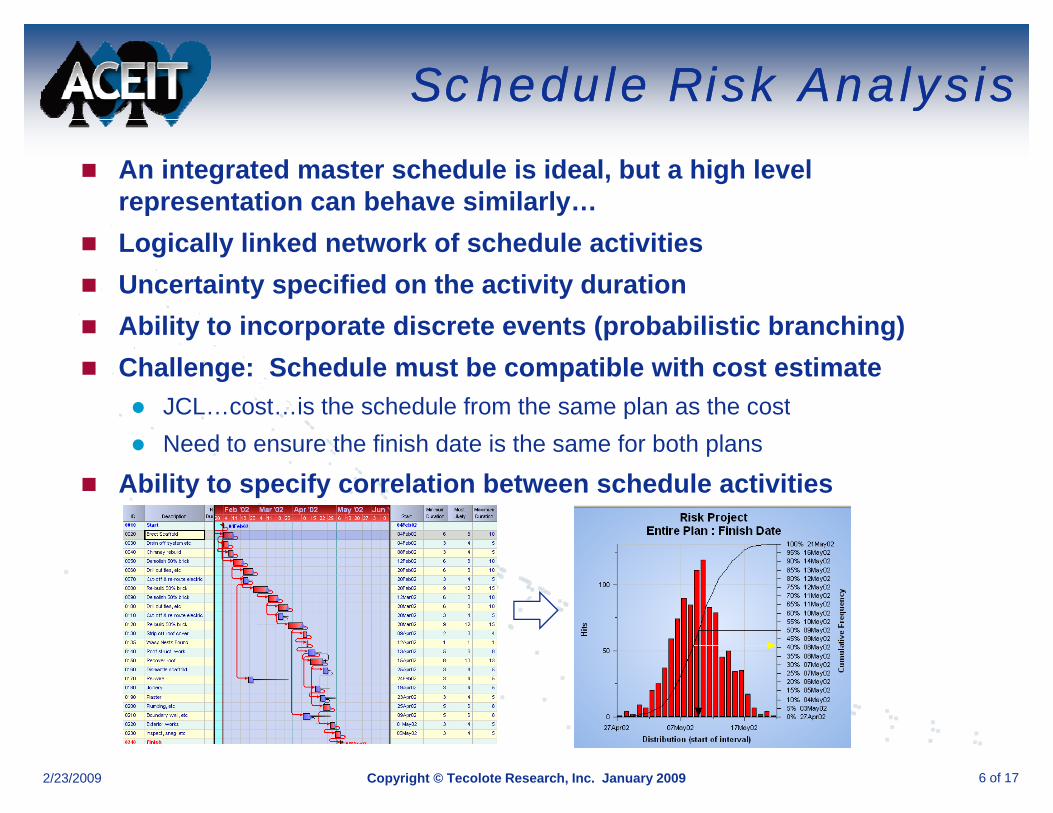
An integrated master schedule is ideal, but a high level representation can behave similarly…p yLogically linked network of schedule activitiesUncertainty specified on the activity durationAbility to incorporate discrete events (probabilistic branching)Challenge: Schedule must be compatible with cost estimate
JCL cost is the schedule from the same plan as the costJCL…cost…is the schedule from the same plan as the costNeed to ensure the finish date is the same for both plans
Ability to specify correlation between schedule activities
6 of 172/23/2009 Copyright © Tecolote Research, Inc. January 2009
Key Factors for JCLCost & Schedule
Key Factors for JCLCost & ScheduleCost & ScheduleCost & Schedule
Cost & Schedule risk analysis completeCost & Schedule risk analysis completeCost risk analysis should not include uncertainty due to schedule!IMS contains network of logically linked activitiesBehavior of cost established to allow the total cost to
l l t f ti f th h d l d ticalculate as a function of the schedule durationAbility to cost-load the network of schedule activitiesAbility to schedule load the cost estimate (!!)Ability to schedule-load the cost estimate (!!)
7 of 172/23/2009 Copyright © Tecolote Research, Inc. January 2009
The End ResultThe End Result
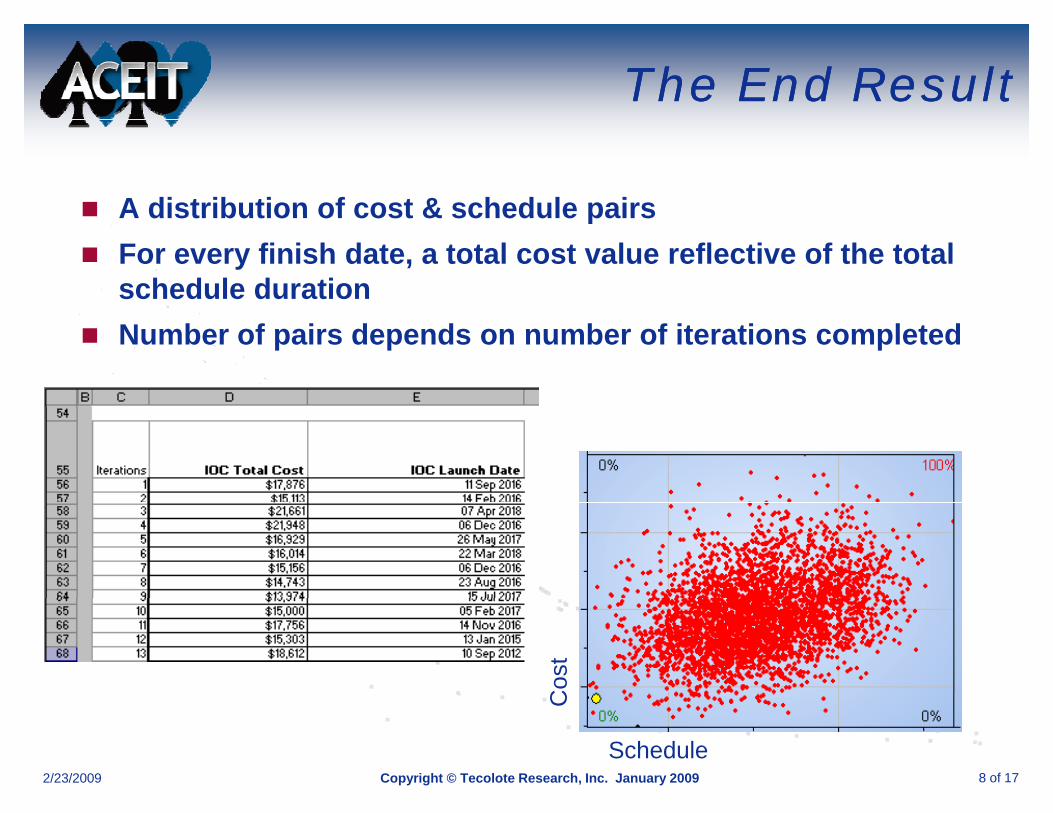
A distribution of cost & schedule pairsA distribution of cost & schedule pairsFor every finish date, a total cost value reflective of the total schedule durationNumber of pairs depends on number of iterations completed
Cos
t
Schedule
C
8 of 172/23/2009 Copyright © Tecolote Research, Inc. January 2009
DefinitionsDefinitions
Joint Probability – the probability of a single pair of random variables (X Y) occurring given the total distribution ofvariables (X, Y) occurring given the total distribution of pairs.
Example: The joint probability of the pair value, finish date = 01 Jan p j p y p2013 and total cost = $25B, is 1% in this distribution of 5k iterations. (meaning 50 of the iteration draws was the 01Jan2013, $25B pair)The sum of all joint probabilities is 100%The sum of all joint probabilities is 100%
Cumulative Probability – the sum of the total probability up Cu u at e obab ty t e su o t e tota p obab ty upto a certain pair value (cost = x, schedule = y). This includes the sum of all probabilities for pair values <=x and y.
E l Th l ti b bilit f fi i hi b f 01 JExample: The cumulative probability of finishing before 01 Jan 2013, for a total cost less than $25B, is 10%. S-Curves and Scatter plot quadrantJoint Confidence Level
9 of 172/23/2009 Copyright © Tecolote Research, Inc. January 2009
Inside JPUInside JPU
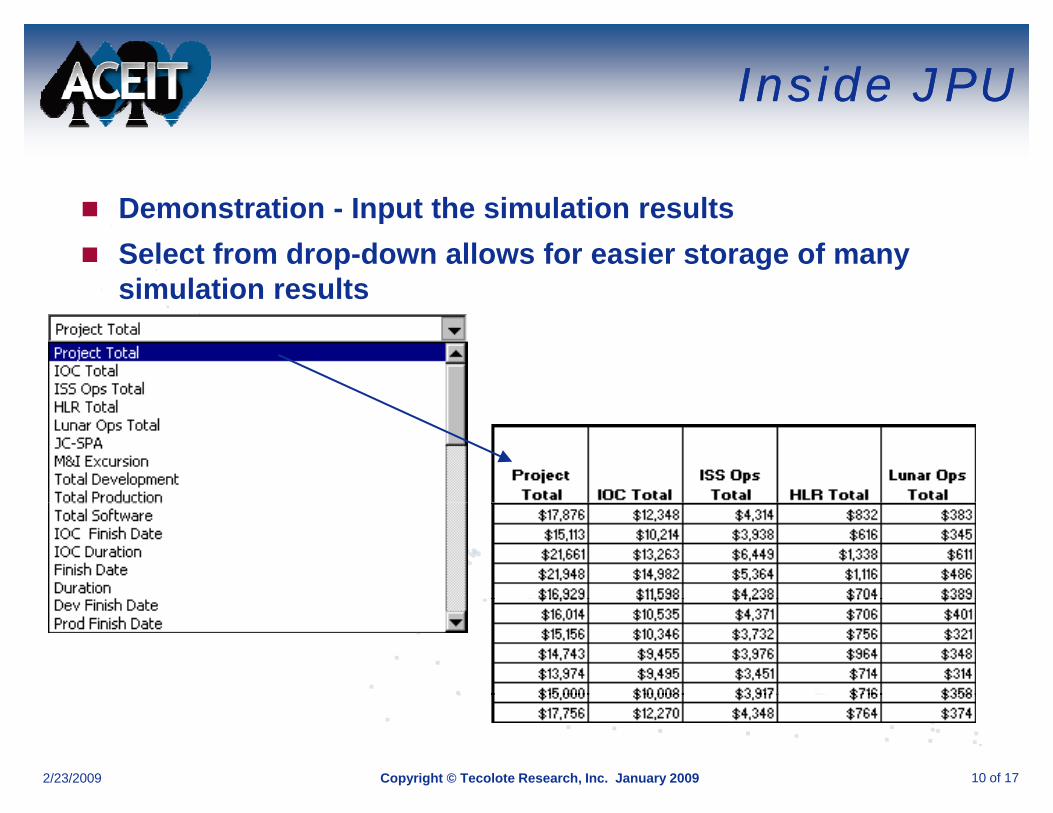
Demonstration - Input the simulation resultsDemonstration Input the simulation resultsSelect from drop-down allows for easier storage of many simulation results
10 of 172/23/2009 Copyright © Tecolote Research, Inc. January 2009
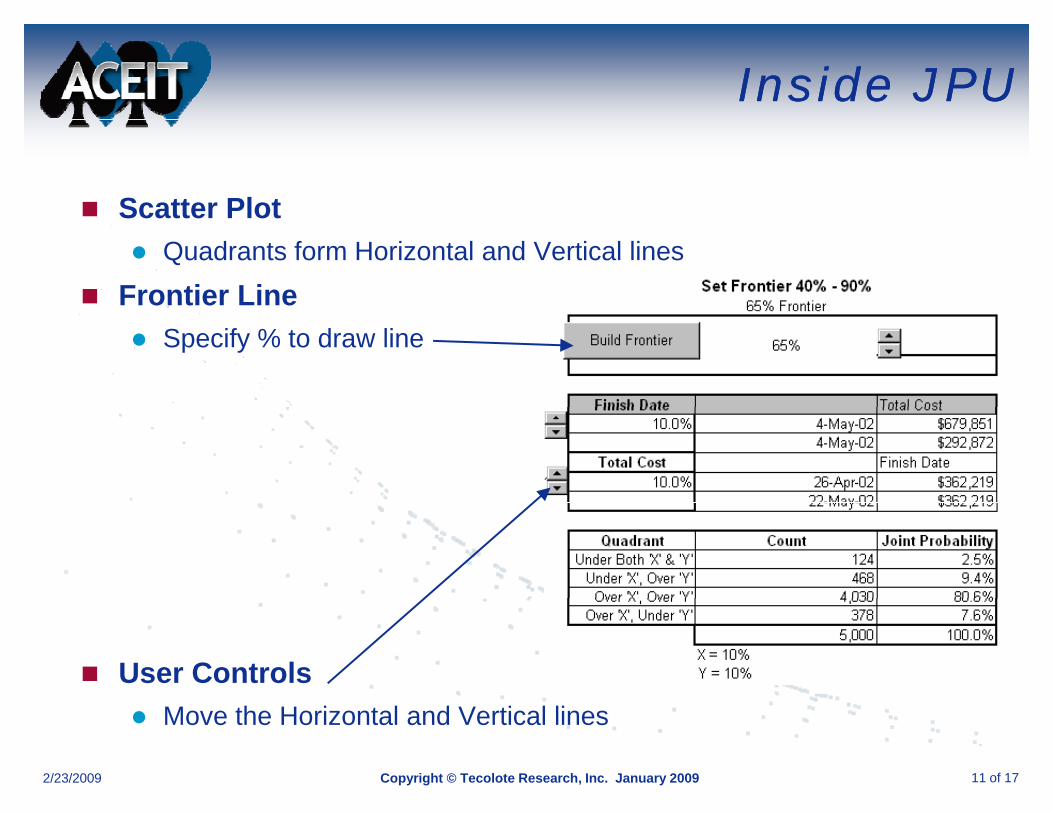
Inside JPUInside JPU
Scatter PlotScatter PlotQuadrants form Horizontal and Vertical lines
Frontier LineSpecify % to draw line
User ControlsMove the Horizontal and Vertical lines
11 of 172/23/2009 Copyright © Tecolote Research, Inc. January 2009
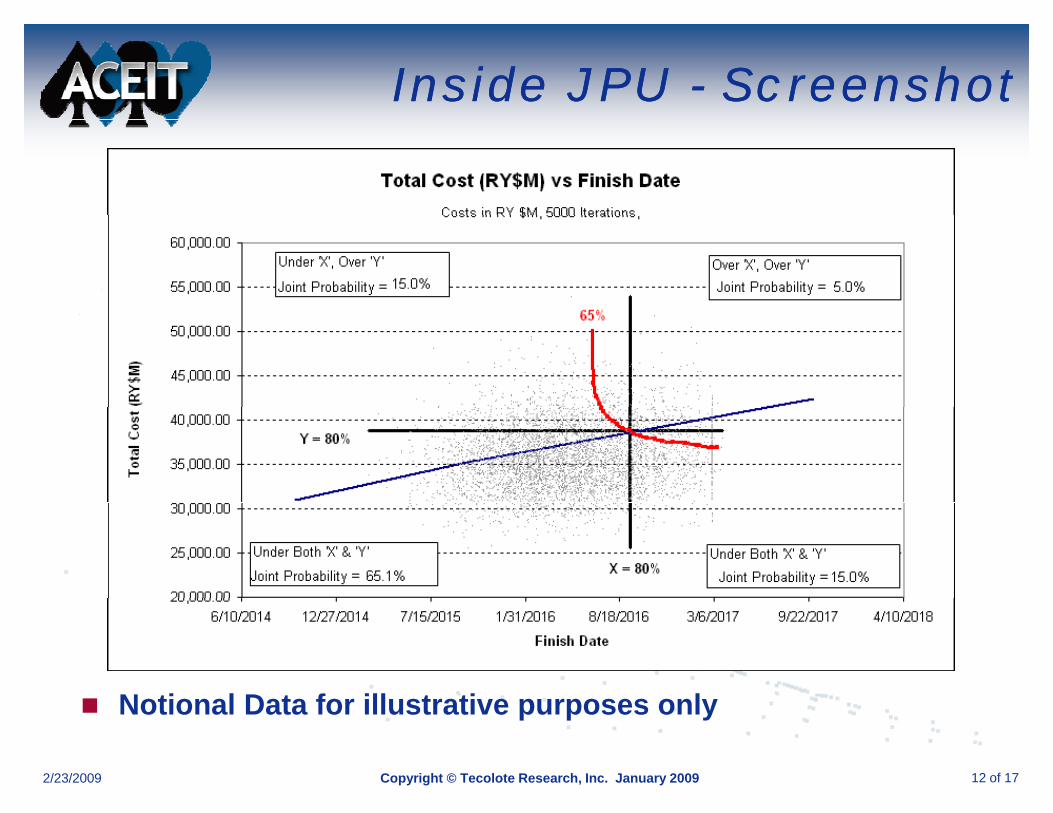
Inside JPU - ScreenshotInside JPU - Screenshot
N ti l D t f ill t ti lNotional Data for illustrative purposes only
12 of 172/23/2009 Copyright © Tecolote Research, Inc. January 2009
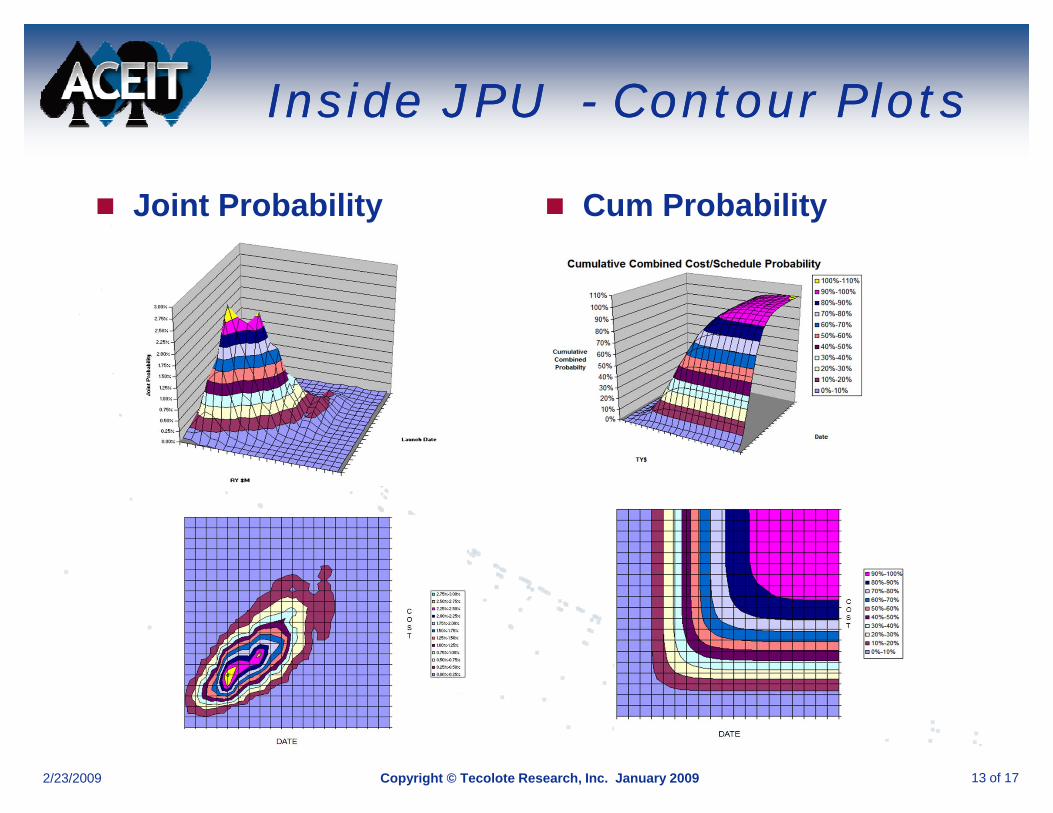
Inside JPU - Contour PlotsInside JPU - Contour Plots
Joint Probability Cum ProbabilityJoint Probability Cum Probability
13 of 172/23/2009 Copyright © Tecolote Research, Inc. January 2009
More than Cost & ScheduleMore than Cost & Schedule
ACE Example file demonstrations (06 – Advanced Risk.aceit)ACE Example file demonstrations (06 Advanced Risk.aceit)Operational Life and Total O&M Cost
How is total O&M cost a function of op life? O Fi ld dU i Fi ldi S h d l Lif i d l l h iOpFieldedUnits = Fielding Schedule. Life is used to calculate how many units are operating in the field at any one time. Cost for O&S is largely based on the number of units operating in the field.
RDTE Costs for Nav/Guid of Air Vehicle & Nav/Guid Weight (lbs)CER calculating Cost relies on Nav/Guid WeightH d di t ib ti f i ht i t t t l t?How does distribution of weights impact total cost?
Analyze the joint probability of the technical parameter to a total y j p y pcost
14 of 172/23/2009 Copyright © Tecolote Research, Inc. January 2009
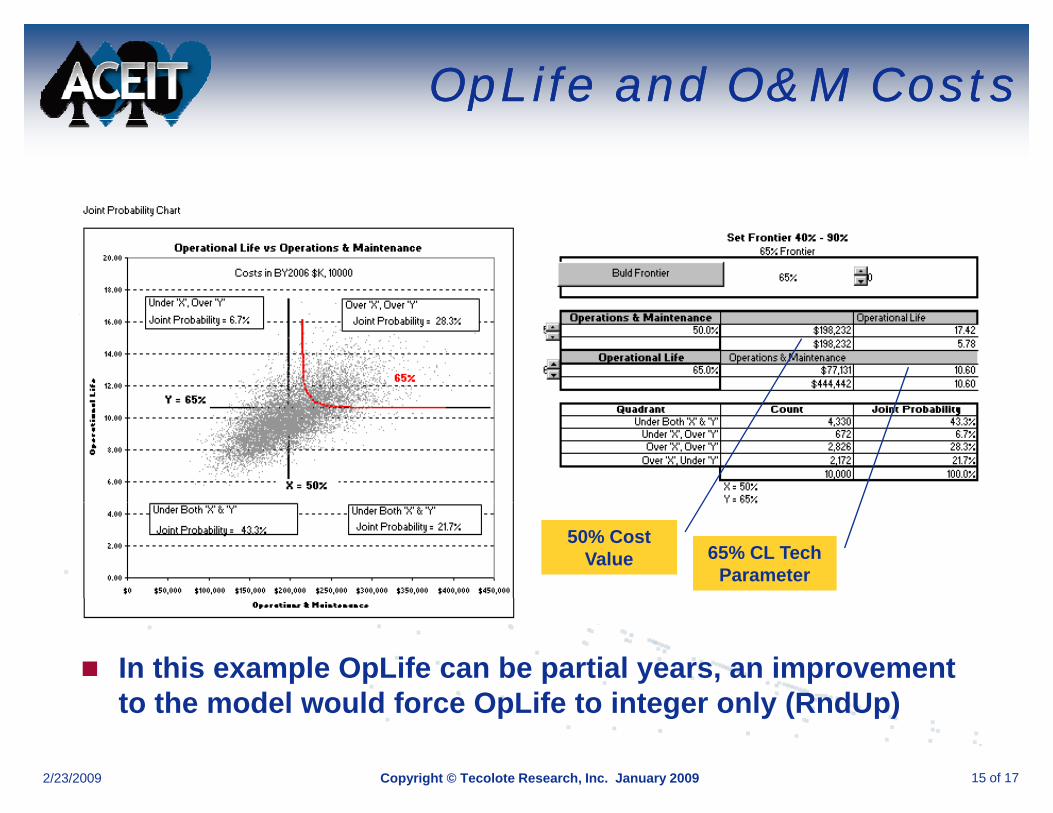
OpLife and O&M CostsOpLife and O&M Costs
65% CL Tech Parameter
50% Cost Value
In this example OpLife can be partial years, an improvement t th d l ld f O Lif t i t l (R dU )
15 of 172/23/2009 Copyright © Tecolote Research, Inc. January 2009
to the model would force OpLife to integer only (RndUp)
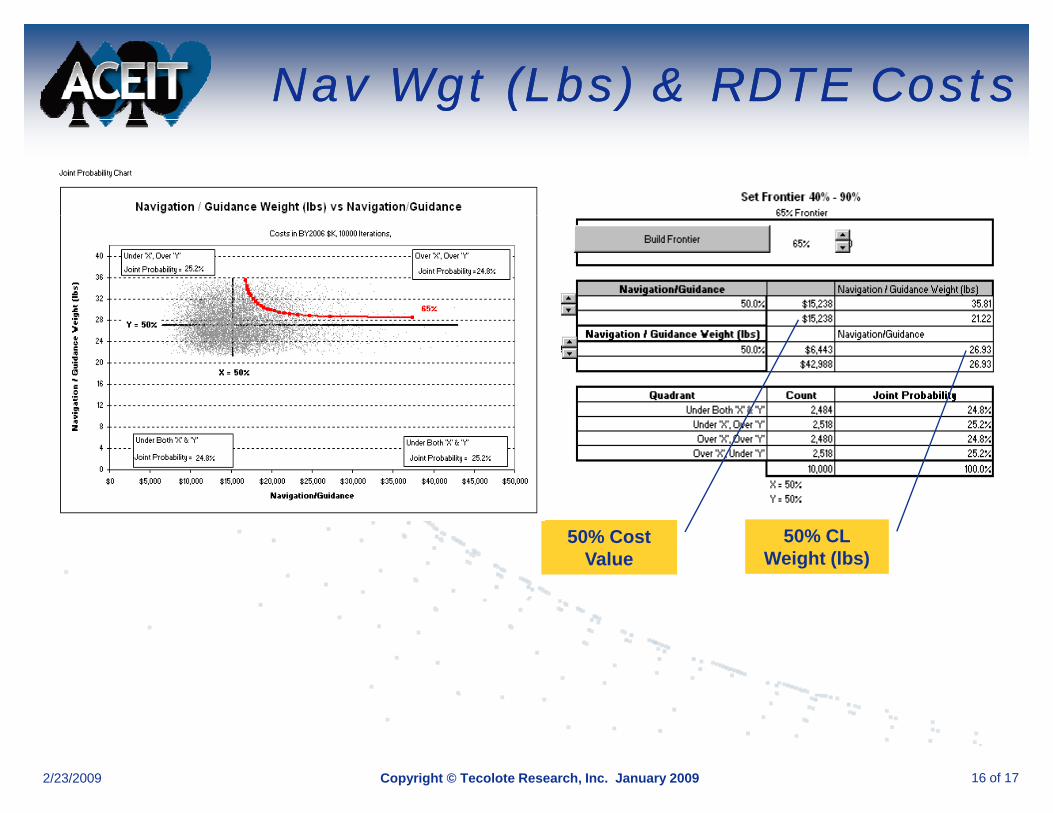
Nav Wgt (Lbs) & RDTE CostsNav Wgt (Lbs) & RDTE Costs
50% CL Weight (lbs)
50% Cost Value
16 of 172/23/2009 Copyright © Tecolote Research, Inc. January 2009
ConclusionConclusion
JPU is projected to be delivered with ACEIT v7 2JPU is projected to be delivered with ACEIT v7.2
Intent is to make JPU Tool Independent; that is theIntent is to make JPU Tool Independent; that is, the user can use simulation results from a variety of sources (ACE, CBall, @Risk, etc) to generate the reports
Easily constructs JCL visualizations
Easily conduct JCL on many variables, not just cost & schedule
17 of 172/23/2009 Copyright © Tecolote Research, Inc. January 2009