Accurately Simulating Real-World Behavior · The images below show output from NEi Nastran ......
5
www.NEiSoftware.com © 2010 All Rights Reserved. 1-877-NASTRAN 1 The defining line between linear and nonlinear is gray at best. Traditionally, in finite element analysis, there has been a set of criteria that determines if nonlinear effects are important to a particular model. If any of these criteria are present, a nonlinear analysis is needed to accurately simulate real-world behavior. While this criteria still holds true, new capabilities such as linear contact and new materials such as composites further blur the line of when it is necessary to carry out a full nonlinear analysis. Accurately Simulating Real-World Behavior
Transcript of Accurately Simulating Real-World Behavior · The images below show output from NEi Nastran ......

www.NEiSoftware.com © 2010 All Rights Reserved. 1-877-NASTRAN
1
The defining line between linear and nonlinear is gray at best. Traditionally, in finite element analysis, there has been a set of criteria that determines if nonlinear effects are important to a particular model. If any of these criteria are present, a nonlinear analysis is needed to accurately simulate real-world behavior. While this criteria still holds true, new capabilities such as linear contact and new materials such as composites further blur the line of when it is necessary to carry out a full nonlinear analysis.
Accurately Simulating Real-World Behavior
www.NEiSoftware.com © 2010 All Rights Reserved. 1-877-NASTRAN
2
Before delving into advanced material types, a look at the traditional nonlinear criteria is an important first step. A nonlinear effect can be broken down into several sub categories:
1. Large displacement effects
2. Nonlinear materials (plasticity, nonlinear stress strain curves)
3. Nonlinear boundary conditions such as contact or nonlinear springs/dampers
Large displacement effects are a collection of different nonlinear properties. The first type is simply large deflections -movements or rotations of a part. For instance, if you expect a part to rotate or deflect 45 degrees, then a nonlinear analysis is required. In fact, any rotation more than about 10 deg will start to have increasing error in a linear analysis. This is
because linear analysis assumes small displacement theory in which Sin(θ)≈ (θ). Another nonlinear effect that goes hand-in-hand with this is follower-forces. Follower forces simply mean that the direction of the forces move with the deformations or movement of the part. Pressure loads are a perfect example of follower forces since they always act normal to a surface. As a part deforms, follower forces will adjust the direction of the loads to ensure they stay normal to the surface.
The second type is called stress stiffening (sometimes referred to as geometric stiffening). This effect is most pronounced in thin structures where the bending stiffness is very small compared to the axial stiffness. For instance, a thin walled pressure vessel will undergo significant stress stiffening as the part transitions from reacting the load in bending, to reacting the load in-plane.
Nonlinear material effects can be important when you want to find out what happens past initial yield stress of the material. Alternatively, non-metal materials like elastomers and plastics can show a highly nonlinear stress strain curve even at low strain values, so getting a more accurate picture of the stiffness of the material through its strain range is important to accurately predicting the stiffness of the overall model. Brittle materials such as cast iron have little inelastic deformation before failure, so a linear analysis approach for these types of materials is generally pretty acceptable. However, the majority of materials and even metals have some amount of ductility. This ductility allows hot-spots to locally yield, thus reducing the stresses compared to what a linear analysis would predict.
Figure 1. The deflection results using three different nonlinear settings. The first image shows the unrealistic “growth” that occurs when large displacement effects are turned off. The second image shows the results of large displacements turned on but follower forces turned off. The final image uses large displacement effects with follower forces and is the most accurate.
Figure 2. A pre-stiffened drum membrane is subjected to a uniform pressure load. It is fixed around the perimeter.
www.NEiSoftware.com © 2010 All Rights Reserved. 1-877-NASTRAN
3
Boundary conditions such as surface contact are generally regarded as nonlinear. However, a new trend has emerged lately that allows a contact analysis to run in a linear solution in some FEA applications. In deciding between a linear and nonlinear contact analysis, it is best to ask these questions:
1. Are there large movements in the model or any of the other nonlinear effects mentioned above?
2. Is there significant sliding between contact bodies in the model? Is the contact solution path dependent (for instance a snap-fit)?
3. Are detailed contact stresses needed in the model?
If the answer is yes to any of the 3 questions, it is generally recommended to run a nonlinear solution to get the best accuracy.
More and more industries are taking advantage of the unique characteristics of composite materials. These characteristics necessitate unique FEA solutions. Due to their inherent brittleness composites are not capable of absorbing energy during peak loading the way metallic materials would. In a metallic material, yielding can absorb a huge amount of energy through plasticity, thus often preventing catastrophic failure. In addition, composite materials have a large variability in their material properties, often forcing analysts to over-design their parts.
Traditional composite analysis consists of a linear solution that predicts first ply failure. This is a perfectly acceptable method, and with new failure theories
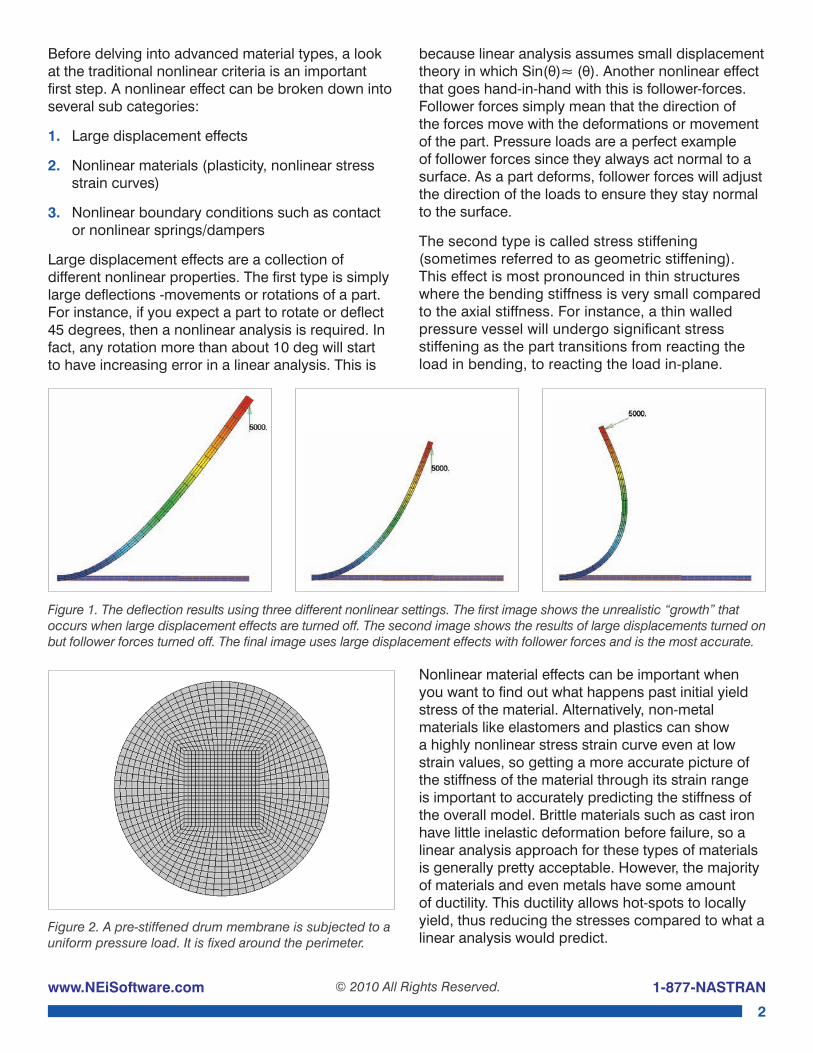
Figure 3. The resulting displacements from a nonlinear analysis. The first image is an actual deflection with large displacement effects turned on (peak deflection is 0.8 inches). The second image is the deformed shape with large displacements turned off. Note in the second image the deformation is scaled down, as the peak deflection is predicted at over 5,000 inches.
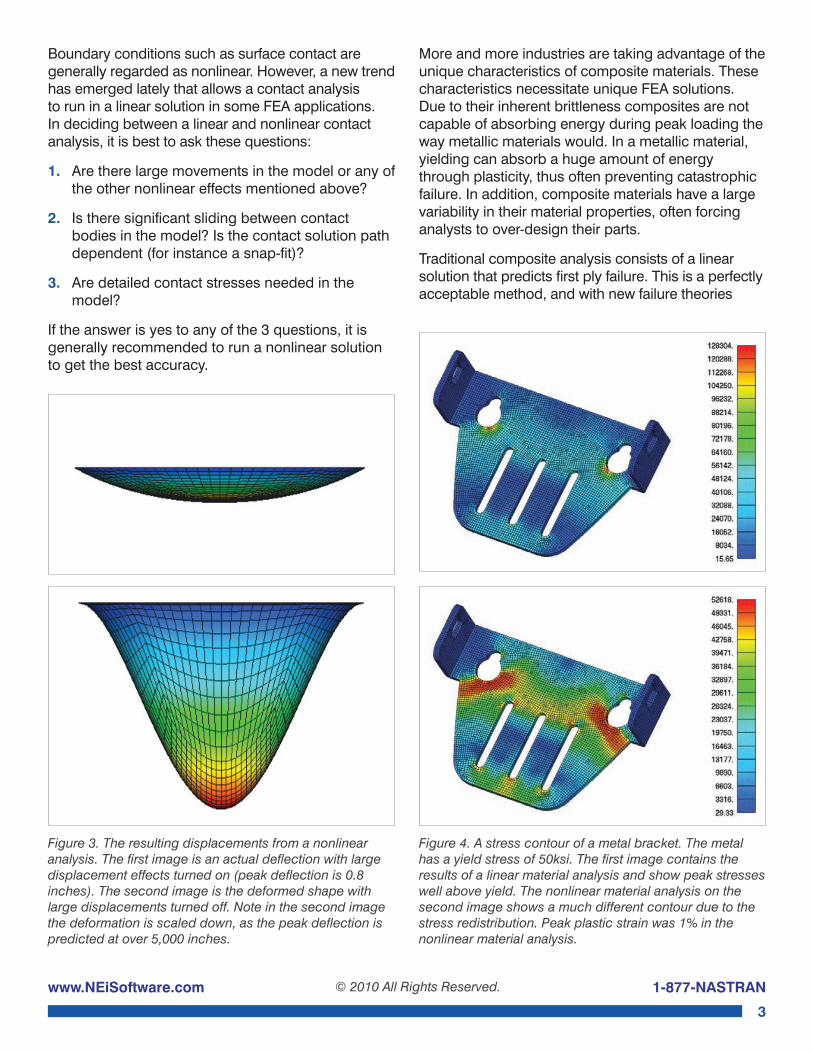
Figure 4. A stress contour of a metal bracket. The metal has a yield stress of 50ksi. The first image contains the results of a linear material analysis and show peak stresses well above yield. The nonlinear material analysis on the second image shows a much different contour due to the stress redistribution. Peak plastic strain was 1% in the nonlinear material analysis.

www.NEiSoftware.com © 2010 All Rights Reserved. 1-877-NASTRAN
4
such as Puck, LaRC02, and MCT, can provide very accurate results. However, in many situations it is important to know what happens after first ply failure. Does the component catastrophically fail or is it simply a local failure? Understanding the behavior of a composite part beyond the initial ply failure is important to designing optimized and safe parts.
Progressive Ply Failure Analysis (PPFA) is a nonlinear solution where failure criteria is set for each ply of a composite model. During the nonlinear iterations, as the stresses or strains exceed the allowables in any particular ply, that ply’s stiffness is reduced (either to zero, or by a knockdown factor). This ultimately provides a much better understanding of what happens after first ply failure. Deciding whether to
do a PPFA analysis (and hence a nonlinear analysis) ultimately comes down to the analyst. But needing to know the answers to any of the following questions would be a good indication that a PPFA analysis should be performed:
1. Does a first ply failure cause an abrupt failure of the component?
2. After first ply failure does the load redistribute, thus maintaining the load carrying capability of the part?
3. How much additional load can the component take after first ply failure?
The images below show output from NEi Nastran that is available in a PPFA analysis. Ultimately when deciding between linear and nonlinear analysis, often the best solution is to simply run both and compare the results. This not only helps to better understand the component at hand, but may reveal any nonlinearities that were not thought of before and may eventually lead to a safer, more optimized part.
Figure 5. The trailer hitch on top, while consisting of six parts in an assembly, can be run as a linear contact solution since all the parts are initially in contact and the displacements are small. The rivet model underneath, however, needs a nonlinear solution due to the large displacements involved and the need for a nonlinear plastic material model.
Figure 6. Simple composite panel.
Fixed Edge Uniform Load
Figure 7. Panel at 10% of total load.
Initial Shear Failures
Initial Compressive Failures
% of plies failed
www.NEiSoftware.com © 2010 All Rights Reserved. 1-877-NASTRAN
5
For more information on Nonlinear AnalysisVisit us on the web:www.NEiSoftware.com/nonlinear
Or contact the expert support staff of NEi Software:(714) [email protected]
About NEi SoftwareNEi Software is a world leader in CAE innovation supplying Nastran Finite Element Analysis (FEA), engineering simulation, and virtual testing software solutions. Engineers gain insight with digital prototypes, images, contour plots, graphs, and animations of linear and nonlinear structural stress, deformation, dynamics, vibration, kinematics, impact, heat transfer and fl uid dynamic (CFD) simulations. The website features case studies in aerospace, automotive, maritime, petroleum, medical, and consumer products with demonstration videos, webinars, tutorials, and training schedules.
Global Headquarters 5555 Garden Grove Blvd. Ste 300Westminster, CA 92683-1886United States
Phone: +1 (714) 899-1220Fax: +1 (714) 899-1369E-mail: [email protected]: www.NEiSoftware.com
NEi Software EMEA Offi ceThe Old Barrel StoreDraymans Lane, MarlowBuckinghamshire, SL7 2FFUnited Kingdom
Phone: +44 (0)1628-400645Fax: +44 (0)1628-891701E-mail: [email protected]: www.NEiSoftware.com/emea
NEi Software Asia Offi ceShinjuku Park TowerN30th Floor 3-7-1 Nishi-ShinjukuShinjuku-ku, Tokyo, 163-1030Japan
Phone: +81-(0)3-5326-3062Fax: +81-(0)3-5326-3001Email: [email protected]
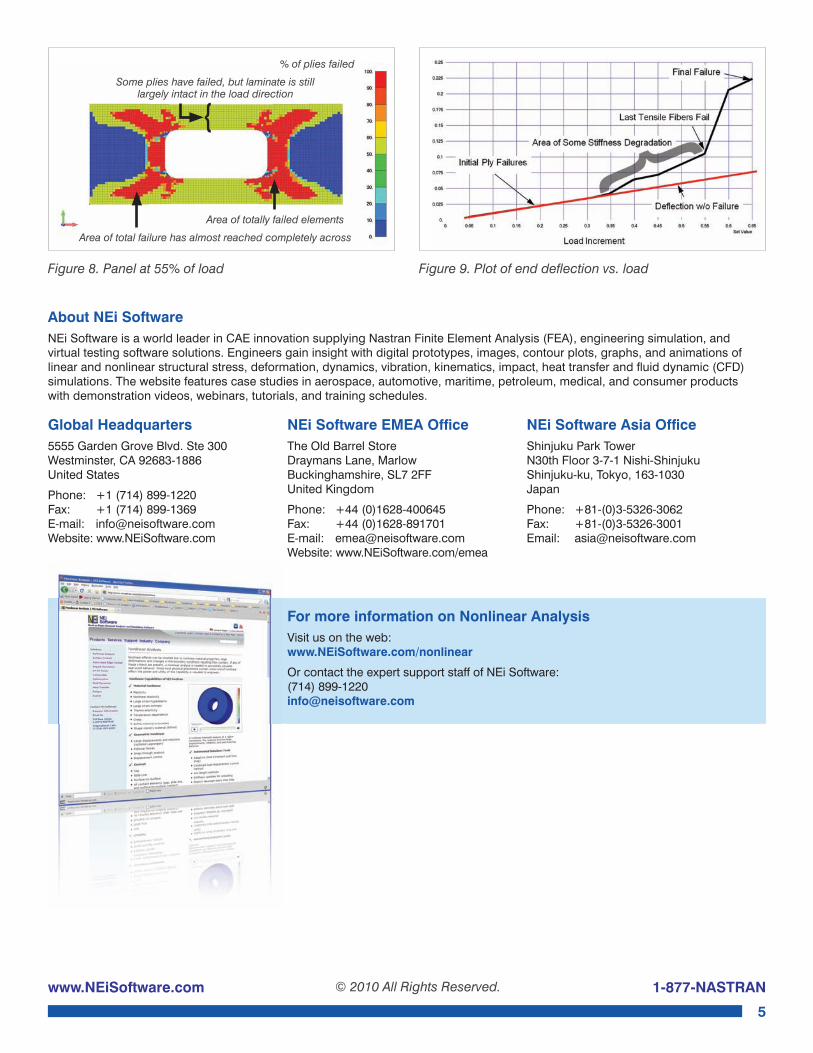
Figure 8. Panel at 55% of load Figure 9. Plot of end defl ection vs. load
Some plies have failed, but laminate is still largely intact in the load direction
Area of totally failed elements
Area of total failure has almost reached completely across
% of plies failed