Accurate Copy of Thesis Wid Title Page
140
THE ROLE OF UNIVERSITY EDUCATION IN BUILDING PERSONALITY AMONG PUNJAB UNIVERSITY STUDENTS A Thesis Submitted to the Department of Sociology, Institute of Social and Cultural Studies, University of the Punjab, Lahore in Partial Fulfillment of the Requirements for the Degree of Master’s in Sociology By Muhammad Ali Muhammad Safdar
-
Upload
nadeem-raza -
Category
Documents
-
view
26 -
download
1
Transcript of Accurate Copy of Thesis Wid Title Page

THE ROLE OF UNIVERSITY EDUCATION IN BUILDING PERSONALITY AMONG PUNJAB
UNIVERSITY STUDENTS
A Thesis Submitted to the Department of Sociology, Institute of Social and Cultural Studies,
University of the Punjab, Lahore in Partial Fulfillment of the Requirements for the Degree of
Master’s in Sociology
By
Muhammad AliMuhammad SafdarMuhammad Ashraf
SESSION 2008-2010

Biographical Sketch
The researcher Muhammad Ali was born to Muhammad Iqbal in village Khai Bodla,
Tehsil and District Bahawal Nagar. He did his Graduation from Government Degree
College Bahawal Nagar. The researcher Muhammad Safdar was born to Muhammad
Khan in village Bachian Wali, Tehsil Minchan Abad, and District Bahawal Nagar. He did
his Graduation Government Degree College Minchan Abad. The researcher Muhammad
Ashraf was born to Muhammad Anwar in Tehsil Pindi Bhatian, District Hafiz Abad.
These researchers joined the “Institute of Social and Cultural Studies” University of the
Punjab Lahore in Session 2008-2010 in M.Sc. Sociology Program.
Abstract
The present research is done to find the relationship between the role of university
education and development of personality of the students. The study has been conducted
within the framework of Learning Theories that are Behaviorism, Cognitivism, and
Constructivism. The hypothesis of the present research is “The role of university
education in developing personality among Punjab university students.
The universe of the present research is University of the Punjab Lahore. The researchers
collected the data from the thirteen faculties of the university. The respondents were of
B.A/ B.Sc/ B.com Honors, and M.A / M.Sc students who have spent at least one year of
their course of study because they can give meaningful justification of the impact of
university education on their personalities. The researchers used Systematic Sampling
and Structured Interview Schedule to collect data. After data collection “Data Sheet” was
prepared and Cross Tabulation was done. Chi-Square Test was used to test the
relationship between the university education and the personality development of the
students. The value of Chi-Square Test was 0.000 which was less than the level of
significance 0.05. So the alternative hypothesis was accepted and proved that there is
relationship between the independent and dependent variables.

Acknowledgments
The researchers feel pleasure to express their great gratitude to their respectable research
advisor Muhammad Farooq, for his valuable suggestions, thought provoking guidance,
tolerance and endurance during the process of present research. His encouragement
served as a source of inspiration to work enthusiastically for this research. The
researchers had the same feelings for their friends Zafar Kashmiri, Syed Auwn
Muhammad, Ahmed Riaz, who were always helpful to them.
The researchers are especially thankful to Dr.Riffat Munawar whose thought provoking
guidance helped them to accomplish the theoretical framework of their research.
The researchers are also obliged to the ISCS Staff; and especially the library staff
including Mushtaq Ahmed Kashmiri, Waqas, and Babar for their kind cooperation.
Chapter Contents Page
1. INTRODUCTION 09Statement of the problem 12
Significance 13Objectives of the study 14
2. LITERATURE REVIEW 153. THEORETICAL FRAMEWORK 19
4. METHODOLOGY 22
Universe 22Sampling 23Tool for data collection 24Construction of Questionnaire 25Pre-testing and finalization of Questionnaire 26Data collection and field experience 26Scoring 26
5. HYPOTHESIS’S CONCEPTULIZATION 30AND OPERATIONALIZATION OF THE CONCEPTS
Hypothesis 30
Variables 30Indicators of Independent variable
30Indicators of dependent variable 31Conceptualization 31Operationalization 32
6. GENERAL FINIDINGS OF THE STUDY 36
7. TESTING OF HYPOTHESIS 54
8. SUMMARY, CONCLUSION AND SUGGESTIONS 58
Summary 57Conclusion 59Suggestions 60
REFERENCES 61QUESTIONNAIRE 64
Sr. List of Tables Page
1 Distribution of respondents with regard to their gender. 36
2 Distribution of respondents with regard to their age. 37
3 Distribution of respondents with regard to their university education level. 37
4 Distribution of respondents with respect to their opinion about change in
dressing style after joining the university 38
.
5 Distribution of respondents with regard to their Opinion about change in
hair style after joining the university. 38
6 Distribution of respondents with regard to their opinion about change in
gestures during presentation after joining the university. 39
7 Distribution of respondents with regard to their Opinion about change in
postures during presentation after joining the university 39
8 Distribution of respondents with regard to their opinion about inspiration
from other university fellows 40
9 Distribution of respondents with regard to their Opinion about building
of self-esteem after joining the university 40
10 Distribution of respondents with regard to their opinion about consistency
comes in personality after joining the university 41
11 Distribution of respondents with regard to their Opinion about University
education creates leadership qualities in Students 41
12 Distribution of respondents with regard to their opinion about university
education generates and enhances tendency of tolerance learning in
Students 42

13 Distribution of respondents with regard to their opinion about university
education enhances decision making power of students 42

14 Distribution of respondents with regard to their opinion about university
education enhances self presentation of students 43
15 Distribution of respondents with regard to their opinion about change in
communication style after joining the university 43
16 Distribution of respondents with regard to their opinion about improvement
in way of talking after joining the university 44
17 Distribution of respondents with regard to their opinion about university
education enhances confidence of speaking of students 44
18 Distribution of respondents with regard to their opinion about university
education helps in removing hesitation of talking confidently of students 45
19 Distribution of respondents with regard to their opinion about frequently
used language by university students 45
20 Distribution of respondents with regard to their opinion about use of
English Language in everyday life does matter with personality building
of students 46
21 Distribution of respondents with regard to their opinion about
university education encourages use of English language in everyday
life of students. 46
22 Distribution of respondents with regard to their opinion about English
Language as a good academic tool to flourish communication ability
of students. 47
23 Distribution of respondents with regard to their opinion about becoming
more formal in communication after joining the university 47
24 Distribution of respondents with regard to their opinion about progressive
change in behaving style of students after joining the university
Distribution of respondents with regard to their opinion about university
education improves politeness in behaviour of students 48
25 Distribution of respondents with regard to their opinion about university
education improves politeness in behaviour of students 48

26 Distribution of respondents with regard to their opinion about university
education makes students cooperative person 49
27 Distribution of respondents with regard to their opinion about university
education enhances judging patterns of students 49
28 Distribution of respondents with regard to their opinion about university
education creates systematic way of analysis in students 49
29 Distribution of respondents with regard to their opinion about in what
ways university education creates systematic way of analysis in students 50
30 Distribution of respondents with regard to their opinion about students
learns much more about cooperation, compromising, analysis in
team work 51
31 Distribution of respondents with regard to their opinion about university
education improves social relations of students 52
32 Distribution of respondents with regard to their opinion about university
education reshapes and unfolds inner capabilities of students 53
33 Distribution of respondents with regard to their opinion about university
education has a significant role in building personality of the students 53

CHAPTER 1
Introduction
The traditional functions of universities are teaching and research. In its teaching
activities, universities provide the professional training for high-level jobs, as well as the
education necessary for the development of the personality. University research increased
the body of theoretical knowledge as well as its application to practical problems.
As Webster said:
“Education is the act or process of providing with knowledge, skills, competence
or usually desirable qualities of behavior or character of being so provided especially by a
formal course of study, institution or training.”
Education “the social institution through which society provides its members with
important knowledge, including basic facts, job skills, and cultural norms and values”.
The main function of education is socialization of the members of society. It is a very
important social institution as it plays a role of backbone in building nations of the
society. The role of university education is very important in building and enhancing
personalities of the students. It provides a higher level of education which defines the
careers of the students. As it gives educated youths to its nation.
“The quality of life for people and societies everywhere can be improved by
realizing the ideal of a quality education for all.”
Source: UNESCO Associated Schools.
.
Education plays an important role in making a nation strong and powerful. It unites and
integrates people. Education directly affects the development of a country and in this
criteria, education gains more importance and, of course, education wakes up conscience
and makes one realize that social evils definitely eat into the rituals of a society.
Illiteracy, on the other hand, is a curse and all problems in developing countries revolve
around this central problem. This problem of illiteracy in Pakistan is much more severe

and gigantic. The literacy rate in Pakistan remained among the lowest in Asia and the
world.
According to the census 1998, the total population of fifteen plus (15+) age group is 72.3
million (male 37.65 % and female 34.73 %) and overall literacy rate is 43% (male
553.73%, female 29%).
“United nation development program (UNDP) figures included in its report of
2002 state that Pakistan’s average annual expenditure on education, as a percentage of
GNP, stood at 2.7% over the decade. This was a decline from the 3.1% spent on average
during the 1988s and again represented one of the lowest investment in education in the
world. According to the economic survey for the year 2003, expenditure on education
had shown a declining trend since 1996 and for the current fiscal year a more 32% of
GDP had been allocated for education”. (State of Human Rights 2002:311)
We have in Pakistan, the rate of increase population is 3% but increase in literacy rate is
only 0.7% in one year. Pakistan is placed at the 138th in the ladder of 182 countries with
reference to literacy.
Our current research has been conducted one of the leading and major universities of
Asia that is “University of the Punjab Lahore”. It has great contribution in serving a huge
number of educated people to our society which are working in different private and
Government sectors all over the Pakistan and overseas. As the current Vice-Chancellor
Prof. Dr. Mujahid Kamran says:
“The University of the Punjab enjoys a respectable position as a seat of learning
amongst the reputed universities of the world on account of its rich cultural heritage and
accessible opportunities being provided to a multitude of our youth for attaining quality
education at an affordable cost. It is indeed a matter of great satisfaction for me to note
that significant improvement has been made in the sphere of imparting higher education
at the University. Innovative research in various new disciplines and new scientific
courses has recently been introduced which will greatly help to cultivate an atmosphere
essential for acquiring a high academic standard.
It is commendable that the University of the Punjab has created a modern infrastructure
to make it possible for students to update their knowledge in various scientific disciplines

since modern technology has become an essential vehicle of rapid progress. At the same
time, the University has been quite successful in maintaining a balance between modern
trends in education and its old traditions. As a Vice-Chancellor, I am confident that
efforts to excel in the field of higher education and the inculcation of moral values in the
students at the University Campus will continue in future with a great zeal”.
The researchers also want to describe what is personality development? it can be defined
as “Personality development is the development of the organized pattern of behaviors and
attitudes that makes a person distinctive. Personality development occurs by the ongoing
interaction of temperament, character, and environment”.
Almost everyday we describe and assess the personalities of the people around us.
Whether we realize it or not, these daily musings on how and why people behave as they
do are similar to what personality psychologists do.
A brief definition would be that “personality is made up of the characteristic patterns of
thoughts, feelings and behaviors that make a person unique. In addition to this,
personality arises from within the individual and remains fairly consistent throughout
life.”
The definition of personality also includes enduring characteristics and adaptations:
“Personality consists of enduring, distinctive thoughts, emotions, and behaviour that
characterize the way an individual adapts to the world”.
Some theorists believe that biological and genetic factors are responsible; others argue
that life experiences are more important. Some theorists claim that the way we think
about ourselves is the key to understanding personality, while others stress that the way
we behave toward each other is more important (Friedman & Schustack, 1999).
Some of the fundamental characteristics of personality include consistency, psychological
and physiological processes, impact behaviors and actions, and multiple expressions.
Consistency means “There is generally a recognizable order and regularity to behaviors.
Essentially, people act in the same ways or similar ways in a variety of situations”.
Psychological and physiological processes mean “Personality is a psychological
construct, but research suggests that it is also influenced by biological processes”.
Impact behaviors and actions mean “Personality does not just influence how we move
and respond in our environment; it also causes us to act in certain ways”. And Multiple
Expressions mean “Personality is displayed in more than just behavior. It can also be
seen in out thoughts, feelings, close relationships and other social interactions”
Statement of the Problem:
As educated and enlightened men and women would be best suited in resolving issues
and to participate in nation building. It is very difficult to decide which one is basic and
more significant but “Education” is the nucleus around which gathers all the forces of
progress and development in a country. It is a pillar on which rests the growth and
development of a nation.
The purpose of personality development is as follows:
To increase self-awareness - This will help you in forming motivated and
committed behavior.
To observe the different personalities and their behavioral traits - leading to the
mutually beneficial use of those differences
To achieve meaningful, measurable results through the work that would improve
the ability to work constructively with one another.
To achieve perfect co-ordination and improved teamwork, would improve
student’s ability to work in harmonization with one another.
To improve interpersonal and communication skills, would bolster students’
ability to work fast and efficiently with one another.
To learn conflict management techniques via experience, that would improve
students’ decision-making ability during crisis management.
To tap and/or boost the natural strengths and talents, in order to explore them to
derive maximum effect.
To boost the latent inner ability to explore leadership qualities. The ability to
make realistic plans and take steps to carry them out.
Skills in communication and problem solving. The capacity to manage strong
feelings and impulses while dealing with critical situation.
Personality development comprises of simultaneous efforts to improve every part
of personal, business and spiritual life.
There are many scientific and sociological studies have been conducted in the area of
development of personality but perhaps no study has yet been conducted about the role of
university education in developing personality of the students. Consequently this study is
focused upon the personality development of the students of the University of the Punjab
Lahore.
Sociological Significance:
The Hypothesis formulated for the present research is “The Role of University Education
in building personality among Punjab University Students”.
There is no sociological study have been conducted in the University of the Punjab
Lahore about the topic taken. The aim behind the present research is to study the role of
university education in developing personality of the students. For this purpose the
researchers have introduced some indicators of personality building which are enhanced
and developed after joining the university. These are Personality Traits (Appearance,
Self Esteem, and Consistency in Personality, Leadership Qualities, Tolerance Learning,
Decision Making Power and Self Presentation), Communication Learning, Behavior,
Systematic Learning Techniques, Group Work Learning, and Reshaping of Inner
Capabilities.
The researchers claim that these personality indicators described above are enhanced and
changed after joining the university. The present study will fill the research gap in this
particular area. The present may also be helpful to parents who do not encourage higher
education of their children especially of their daughters. It will also be very interesting to
students’ community as it unveils the sociological importance of the university education.

OBJECTIVES OF THE RESEARCH:
The Objectives of Our Research is to check out whether University Education creates,
reshapes, builds and enhances the following concepts or not in the personalities among
Punjab University students.
Self Presentation .
Leadership Qualities.
Systematic Learning Techniques
Reshaping of Inner Capabilities
CHAPTER 2
Review of the Relevant Literature
The important of review of literature lies in the fact that it high-lights the background of
the problem to be studied. It also provides further orientation about the problem and
eliminates possibility of unnecessary duplication of efforts.
There is no research available which directly relates to the present study, thus in the
present chapter an attempt has been made to review the studies which are partly to the
present research.
Sadiq (1986) conducted a study on “The impact of Housewives Education on their
rate of Fertility”. The hypothesis formulated for this research was “The Higher the Level
of Education of Females, the Lower the Rate of their Fertility”.
The research was conducted witch the framework of the theory of “Demographic
Regulation” by Bogue. The study was conducted on the housewives of the area of
Defence Society Lahore.
A Sample of 100 housewives was drawn. The researcher came to the conclusion that
higher education of females was negatively associated with the rate of fertility of women.
Firdaus (1985) conducted a study on “The level of education and vertical
mobility”. The hypothesis formulated for this research was “The higher the level of
education, the more the vertical mobility”. The study was conducted within the
framework of “Functional theory of Stratification” by Davis & Moore.
The universe for the study consisted of male Govt. employees residing in the area of
Wahdat Colony, Lahore. A sample of 100 respondents was drawn. The researcher
reached to the conclusion that there was a significant relationship between the level of
education and vertical mobility.

Ahmed (1985) conducted a study on the “Impact of education on the family
patterns of old Lahories”. The hypothesis of the study was “Higher the education, more
the positive attitude towards nuclear family pattern”.
The researcher was conducted within the framework of Learner’s theory of
modernization. The universe for the present study consisted of the respondents who had
been married for five years and were educated at least up to primary level. A sample of
86 respondents was taken. The researcher came to the conclusion that there was no strong
association between two variables that is education and attitude towards nuclear family
system.
Shaimoona Masood (1990) conducted a research on “Role of education in
creating awareness among women about environment pollution, it causes and effects”.
The hypothesis of the present study was “The higher the level of education of females,
the more their awareness about environmental pollution”.
The universe selected for the present study consisted of females who were above 21 years
of age and were the residents of main Saman Abad, main Krishan Nagar, Old Anarkali,
Sadat Park, and Dholan Wal. A sample of 100 respondents was drawn through systematic
random sampling. Interview schedule was used as a tool for data collection. After the
data collection, Gamma was applied to test the association between independent and
dependent variables. The calculated Gamma value was 0.98, which showed that there
was a high positive association between both the variables i.e., “Level of education and
level of awareness about environmental pollution”.
Muhammad Abu Bakkar (2009) conducted a study on “Impact of education on the
perceived severity of illness and self medication”. The hypothesis of the study was “More
the perceived severity of the illness, lesser will be self medication”. The universe is
comprised of all the governmental level High, Middle and Primary Schools of both the
boys and girls in town Farooq Abad and its suburb Saucha Sauda (Tehsil & District
Sheikhu Pura). A sample of 50 respondents was chosen by using the technique of simple
random sampling from the six selected schools of the above mentioned universe. Self
administrative questionnaire was used as a tool for data collection. The relationship
between perceived severity of illness and self medication was tested by using Chi-square
Test. The value of Chi-square Test led to the acceptance of null hypothesis in spite of the
research hypothesis. So it was concluded that the life chances, like economic conditions
and residential backgrounds are more effective than education in the perception,
interpretation and choice of health care system.
Hamid Ali (2009) conducted a research on “Discriminatory attitude among
parents in household resource allocation and role of education in human capital
investment”. The hypothesis of the study was “Low level of education of parents, the
higher the discriminatory attitude towards gender”. “Parents do not discriminate based on
sex of their children while investing in their human capital development”. The universe
comprised of the parents resident of rural areas of Jhelum, Toba-Tek-Singh, and Sheikhu
Pura. By Quota sampling 80 respondents were chosen in which 40 were males and 40
were females.
Only those respondents were interviewed who had at least one daughter and one son. The
findings of presents study supported the hypothesis. To see the relationship between the
level of education and the discrimination attitude towards gender, Chi-square Test was
applied. The result of the Chi-square test led to the acceptance of research hypothesis.
During the data collection, it was noticed that majority of un-educated parents had more
discriminatory attitude towards gender.
McKay and Kamber (1999) argue that quality control measures in isolation may
have limited impact if not accompanied by appropriate educational development
initiatives. Governments have been aware of the problems and constraints within the
education sector; however no administration has been able to make significant long-
lasting reforms to the system.
( Ralph G.Lewis, Douglas H.Smith, Total Quality in Higher Education.

Umm-e-Kalsoom Sial (2005) conducted a research on “Level of education of lady
councilors and its impact on their political participation”. The main objective of the
research was to check that how education of the lady councilors effect their working
efficiency and active political participation in local government system. The universe of
the present study consisted of two towns of Lahore district. Sixty women councilors
interviewed. A partially structured and partially unstructured and partially unstructured
interview schedule as developed for data collection. After collecting and analyzing the
data, it showed that there was a significant relationship between level of education of
lady councilors and their political participation in the local government. Results indicated
that women councilors who have the higher level of education, they are more empowered
and involved in decision-making process.

CHAPTER 3
THEORETICAL FRAMEWORK
The present research is conducted with in the framework of learning theories In
psychology and education, learning is commonly defined as a process that brings together
cognitive, emotional, and environmental influences and experiences for acquiring,
enhancing, or making changes in one's knowledge, skills, values, and world views
(Illeris, 2000; Ormorod, 1995).
There are three main categories of learning theories.
1. Behaviorism ,
2. Cognitivism , and
3. Constructivism .
Behaviorism focuses only on the objectively observable aspects of learning.
Cognitive theories look beyond behavior to explain brain-based learning. And
constructivism views learning as a process in which the learner actively constructs or
builds new ideas or concepts.
1. Behaviorism:
Behaviorism as a theory was primarily developed by B. F. Skinner. It loosely
encompasses the work of people like Edward Thorndike, Tolman, Guthrie, and Hull.
What characterizes these investigators are their underlying assumptions about the process
of learning. In essence, three basic assumptions are held to be true. First, learning is
manifested by a change in behavior. Second, the environment shapes behavior. And
third, the principles of contiguity (how close in time two events must be for a bond to be
formed) and reinforcement (any means of increasing the likelihood that an event will be
repeated) are central to explaining the learning process. For behaviorism, learning is the
attainment of new behavior through conditioning.
There are two types of possible conditioning:
a. Classical conditioning
b. Operant conditioning
2. Cognitivism:
Gestalt psychologists proposed looking at the patterns rather than isolated events. Gestalt
views of learning have been incorporated into what have come to be labeled cognitive
theories. Two key assumptions underlie this cognitive approach: (1) that the memory
system is an active organized processor of information and (2) that prior knowledge plays
an important role in learning. Cognitive theories look beyond behavior to explain brain-
based learning. Cognitivists consider how human memory works to promote learning.
For example, the physiological processes of sorting and encoding information and events
into short term memory and long term memory are important to educators working under
the cognitive theory. The major difference between gestaltists and behaviorists is the
locus of control over the learning activity: the individual learner is more key to gestaltists
than the environment that behaviorists emphasize.
3. Constructivism:
Constructivism views learning as a process in which the learner actively constructs or
builds new ideas or concepts based upon current and past knowledge or experience. In
other words, "learning involves constructing one's own knowledge from one's own
experiences." Constructivist learning, therefore, is a very personal attempt, whereby
internalized concepts, rules, and general principles may consequently be applied in a
practical real-world context. This is also known as social constructivism.
Social constructivists posit that knowledge is constructed when individuals engage
socially in talk and activity about shared problems or tasks. Learning is seen as the
process by which individuals are introduced to a culture by more skilled
members"(Driver et al., 1994) Constructivism itself has many variations, such as Active
learning, discovery learning, and knowledge building. Regardless of the variety,
constructivism promotes a student's free exploration within a given framework or
structure. The teacher acts as a facilitator who encourages students to discover principles
for themselves and to construct knowledge by working to solve realistic problems.
Aspects of constructivism can be found in self-directed learning, transformational
learning, experiential learning, situated cognition, and reflective practice and religious
practice.
Justification:
The researchers applied learning theories with the present research because the present
study is linked with learning process. Students remain in the process of learning
throughout their life course and the time period they spend in universities is one of their
learning periods. As Behaviorism focuses only on the objectively observable aspects of
learning. It means behaviors are modified and changed by observable factors and the
objectives of the present research also claims that personality is developed and enhanced
by academic environment of the university. Personality factors which are enhanced
include appearance, communication, self presentation, analysis learning techniques, and
leadership qualities etc.
Cognitive theories focus on brain-based learning. It is linked with the present study as
systematic learning techniques are always brain-based learning and it is one of the
present research objectives.
And Constructivism views learning as a process in which the learner actively constructs
or builds new ideas or concepts. It is linked with the present research as self presentation
is constructed and modified by the academic environment of the university.

CHAPTER 4
METHODOLOGY
Methodology or research design is the science of doing something systematically and
objectively. This process involves making decisions about many practical details on
doing the research project. This chapter gives a clarification of taking this study into the
empirical regions from theoretical grounds.
Universe:
A universe or population is a specific pool of cases that researches want to study. All the
persons who are concerned for the research are called unit of analysis. Thus the sampled
population should include all persons having ability to respond meaningfully to research
questions derives by the researchers. The universe for the present research comprised of
University of the Punjab Lahore. The universe consists of thirteen faculties as follows:
1. Faculty of Arts and Humanities.
2. Faculty of Behavioral & Social Sciences.
3. Faculty of Commerce.
4. Faculty of Economics & Management Sciences
5. Faculty of Education.
6. Faculty of Engineering & Technology.
7. Faculty of Islamic Studies.
8. Faculty of Law.
9. Faculty of Life Sciences.
10. Faculty of Medicine and Dentistry.
11. Faculty of Oriental Learning.
12. Faculty of Pharmacy.
13. Faculty of Science.
Justification:
The universe for the present study was selected on the following basis:
1. The above mentioned universe was selected because it was in easy access of the
researchers and convenient to collect data.
2. The researchers selected it because the research hypothesis is entirely based on
the study of University of the Punjab students.
3. Another reason to select this universe is that no research has been done on this
topic and this university.
4. The researchers selected it d because of its vital role in producing huge number of
educated persons each year as compared to other universities of the country.
5.
Sampling Technique:
Sampling is a process of systematically selecting cases for inclusion in a research project.
It is a power full and effective technique with wide applications beyond social research. It
enable us to get sufficient from a relatively few respondents to describe characteristics of
whole population. After specifying the universe, the next step in conducting a research is
to draw a sample. Since it is difficult to manage the pool of all cases, the researches
measure variables on the smaller set cases and generalize results accurately to all cases.
The question arises, how is it possible to use few cases for the generalization of so many.
Actually the research is not based on tricks or magic but on logical statistical reasoning
that has been testing repeatedly with empirical evidence.
For the present study, researchers used Systematic Sampling. It is a simple random
sampling with a shortcut for random selection. The first step is to number each element in
the sampling frame. Instead of using a list of random numbers, a researcher calculates a
sampling interval. The sampling interval tells the researcher how to select elements in the
frame before selecting one for the sample.
In the present study sample size was 100 respondents. These were selected by using
systematic sampling technique.

Tool for Data Collection:
Selection of technique for data collection is an important factor to get comprehensive
result for the present research. There are some tool for collecting the data like interview
schedule, interview guide, questionnaire construction and focus group discussion. The
tool used for present research was interview schedule as it seemed to be most appropriate
data collecting tool.
The researchers adopted this technique of data collection on the following grounds:
1. The researchers used interview schedule because the aim of research was to
collect comprehensive but brief information on all aspects of the personality
development.
2. The researchers used interview schedule because information might be obtained
in structural observation, pre-arranged questions could be recorded and
complexity and confusion of the question can be removed.
3. It might be helpful to researchers to realize responses are genuine and accurate.
4. Another positive point of using interview schedule was that it might ensure high
response rate.
5. Respondents of the present research were both male and female and of LLB,
BBA, B.Com Honors, B.Sc. Honors and M.A/M.Sc.
The researchers used structured questionnaire in the present study (closed-ended
questions were used). The language of questionnaire was English.

Construction of Questionnaire:
A good questionnaire forms an integrated whole. The researcher weaves questions
together so they flow smoothly. He or she includes introductory remarks and instructions
for clarification and measures each variable with one or more survey questions. The
principles of question writing are illustrated n the 10 things to avoid when writing survey
questions.
1. Avoid jargon, slang, and abbreviations.
2. Avoid ambiguity, confusion, and vagueness.
3. Avoid emotional language and prestige bias.
4. Avoid double-barreled questions.
5. Avoid leading questions.
6. Avoid asking questions that are beyond respondent’s capabilities.
7. Avoid false premises.
8. Avoid asking about distant future intentions.
9. Avoid double negatives.
10. Avoid overlapping or unbalanced response categories.
In the present study researchers have introduced 9 sections of questions. The first section
consists of Demographic section in which researchers asked about student’s name, sex,
age, department, degree/ program, semester and medium of schooling. The other sections
comprised of 35 questions for the measurement of dependent variables. All the questions
are in written in very easy language and according to research ethics. All questions are
close ended according to the demand of the present study and to save the respondents’
time.

Pre-Testing and Finalization of Questionnaire:
The researchers have done pre-testing of questionnaire before starting their research in
the field. By doing this, researchers have come to know some drawbacks and ambiguities
in the questionnaire. After pre-testing, they removed the expected some unnecessary
things and questions and amended their questionnaire in a smooth flow and easy form
and gave it a proper form and finalized it.
Data Collection and Field Experience:
The researchers went to the selected universe for the purpose of data collection. The
whole procedure of data collection was done in the span of one week. The researchers,
when went to field, most of the students responded positively. There were few students
who did not cooperate and denied to give time. The researchers had to collect data from
the whole university both from Allama Iqbal Campus and Quaid-e-Azam Campus. The
researchers chose the morning time to collect data because most of the programs are
limited up to morning time. The researchers also noted that some respondents enjoyed
and appreciated the research topic
Scoring:
Scoring of the responses obtained from the respondents is done for the statistical
manipulation of data. The main scoring scheme formulated in the questionnaire is Likert
Scale coding used in almost all questions except for one or two questions.
Scoring Scheme for Independent Variable:
In order to measure the independent variable researchers constructed one question only
that is University Education Level.

Independent variable:
Level of University education:
Level of University Education Score
B.A (Honors) / L.L.B 1
B.B.A 2
B.Com (Honors) 3
B.Sc. (Honors) 4
M.A / M.Sc 5
Scoring Scheme for Dependent Variable:
There are eight sections comprising of 30 questions of dependent variables like
communication learning, behavior / attitude, systematic learning techniques, group work
learning reshaping of inner capabilities, enhance social relations etc.
Response categories Score
Not at all 1
To some extent 2
To great extent 3
(Q no 1,2,3,4,5,7,8,9,10,13,14,21,22,24,27)

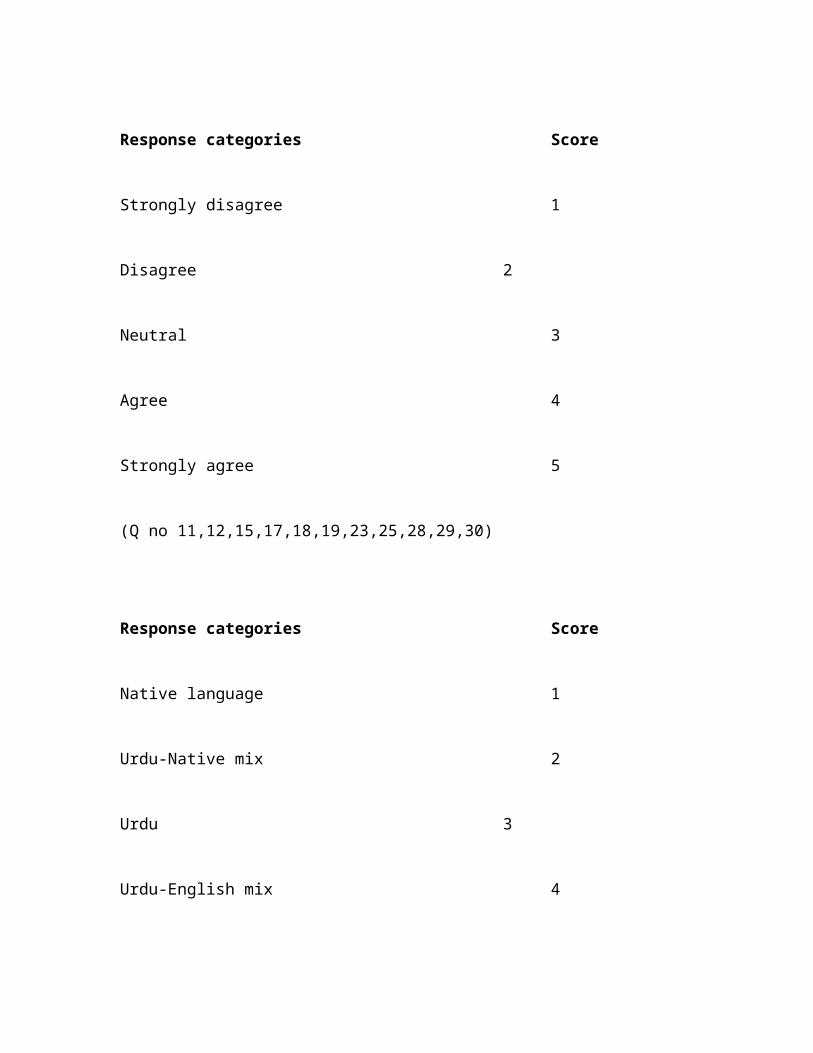
Response categories Score
Strongly disagree 1
Disagree 2
Neutral 3
Agree 4
Strongly agree 5
(Q no 11,12,15,17,18,19,23,25,28,29,30)
Response categories Score
Native language 1
Urdu-Native mix 2
Urdu 3
Urdu-English mix 4
English 5
(Q no 16)

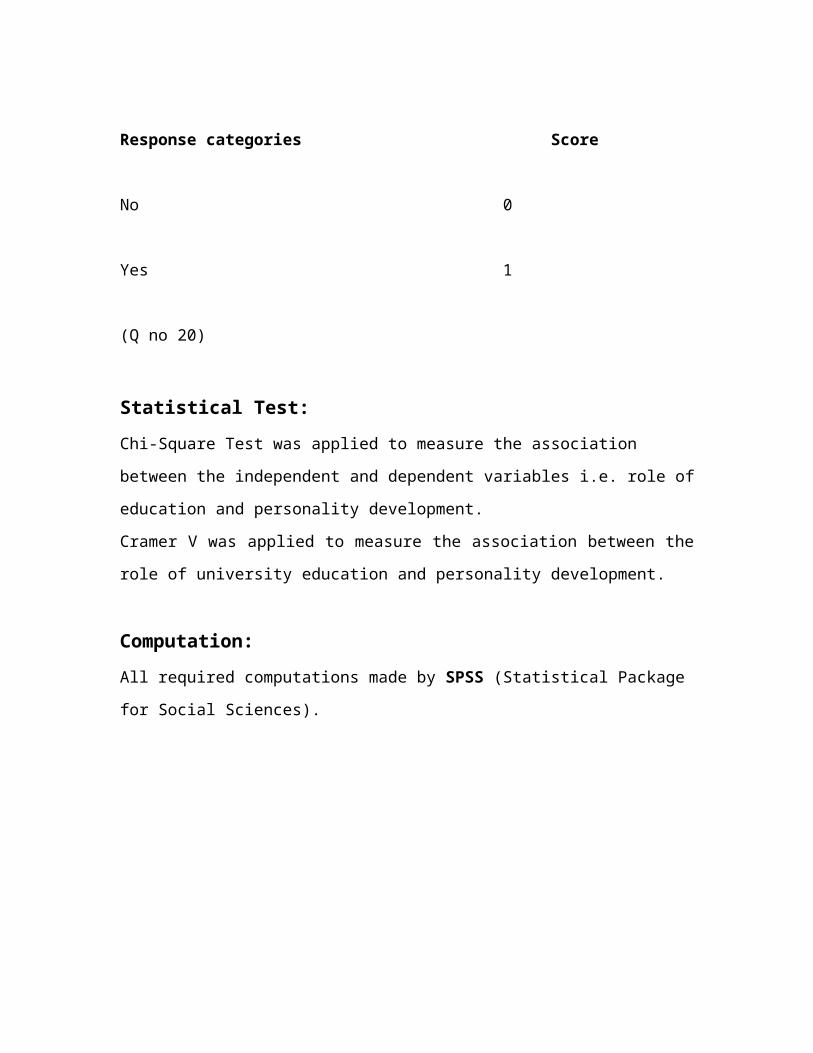
Response categories Score
No 0
Yes 1
(Q no 20)
Statistical Test:
Chi-Square Test was applied to measure the association between the independent and
dependent variables i.e. role of education and personality development.
Cramer V was applied to measure the association between the role of university
education and personality development.
Computation:
All required computations made by SPSS (Statistical Package for Social Sciences).

CHAPTER 5
HYPOTHESIS’S CONCEPTULIZATION
AND OPERATIONALIZATION
Hypothesis:
The hypothesis of the present study is as follows:
“The Role of University Education in Building Personality among Punjab University
Students”
By university education researchers mean “the education of B.A Honors, L.L.B, B.B.A,
B.Com Honors, B.Sc Honors, and M.A / M.Sc. The researchers mainly focused at
positive responses of M.A / M.Sc. students of different departments of the University of
the Punjab Lahore. And the “Personality development is the development of the
organized pattern of behaviors and attitudes that makes a person distinctive. Personality
development occurs by the ongoing interaction of temperament, character, and
environment”. It means the development of different personality traits like in
communication, self presentation, analysis learning and reshaping of inner capabilities of
the students.
Variables:
There are two types of variables taken in the present research are independent and
dependent variables. These are given below:
Indicators of Independent variable:
The independent variable taken in the present research is the “University Education Level
of the students”.

Indicators of Dependent variables:
The independent variables taken in the present study are personality development traits
like appearance, communication, self presentation, analysis learning and reshaping of
inner capabilities of the students.
Conceptualization:
The below stated description of the concepts used in the hypothesis will provide a
broader understanding of the dependent and independent variables.
University:
A university is an institution of higher education and research, which grants academic
degrees in a variety of subjects. A university is a corporation that provides both
undergraduate education and postgraduate education. The word university is derived from
the Latin universitas magistrorum et scholarium, roughly meaning "community of
teachers and scholars."
Education:
Education is the act or process of providing with knowledge, skills, competence or
usually desirable qualities of behavior or character of being so provided especially by a
formal course of study, institution or training.
Personality:
Personality is made up of the characteristic patterns of thoughts, feelings and behaviors
that make a person unique. In addition to this, personality arises from within the
individual and remains fairly consistent throughout life.
OPERATIONALIZATION
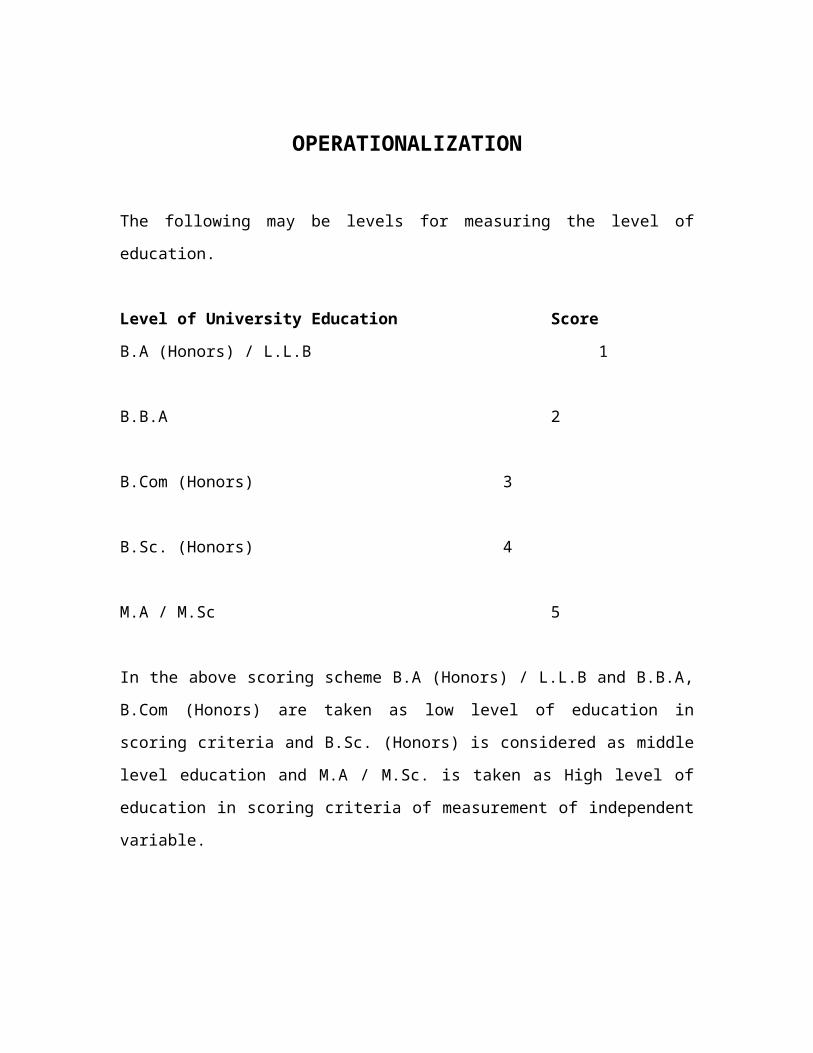
The following may be levels for measuring the level of education.
Level of University Education Score
B.A (Honors) / L.L.B 1
B.B.A 2
B.Com (Honors) 3
B.Sc. (Honors) 4
M.A / M.Sc 5
In the above scoring scheme B.A (Honors) / L.L.B and B.B.A, B.Com (Honors) are taken
as low level of education in scoring criteria and B.Sc. (Honors) is considered as middle
level education and M.A / M.Sc. is taken as High level of education in scoring criteria of
measurement of independent variable.
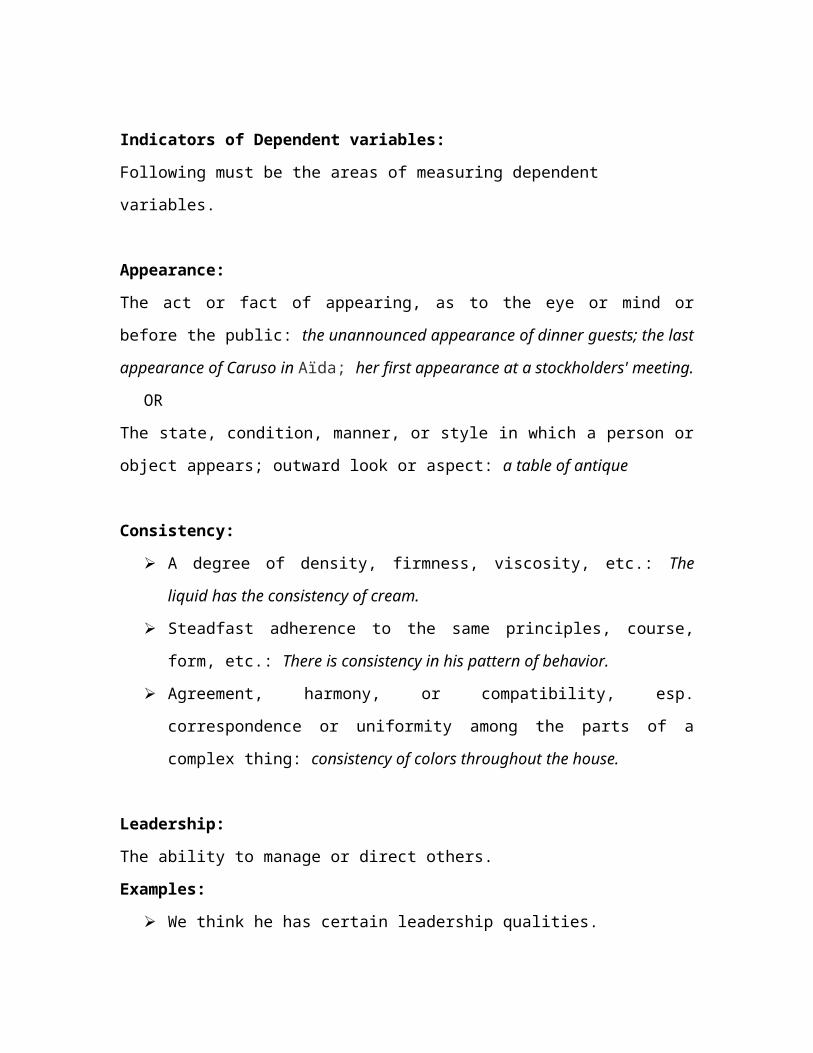
Indicators of Dependent variables:
Following must be the areas of measuring dependent variables.
Appearance:
The act or fact of appearing, as to the eye or mind or before the public: the
unannounced appearance of dinner guests; the last appearance of
Caruso in Aïda; her first appearance at a stockholders' meeting.
OR
The state, condition, manner, or style in which a person or object appears; outward look
or aspect: a table of antique
Consistency:
A degree of density, firmness, viscosity, etc.: The liquid has the consistency of
cream.
Steadfast adherence to the same principles, course, form, etc.: There is
consistency in his pattern of behavior.
Agreement, harmony, or compatibility, esp. correspondence or uniformity among
the parts of a complex thing: consistency of colors throughout the house.
Leadership:
The ability to manage or direct others.
Examples:
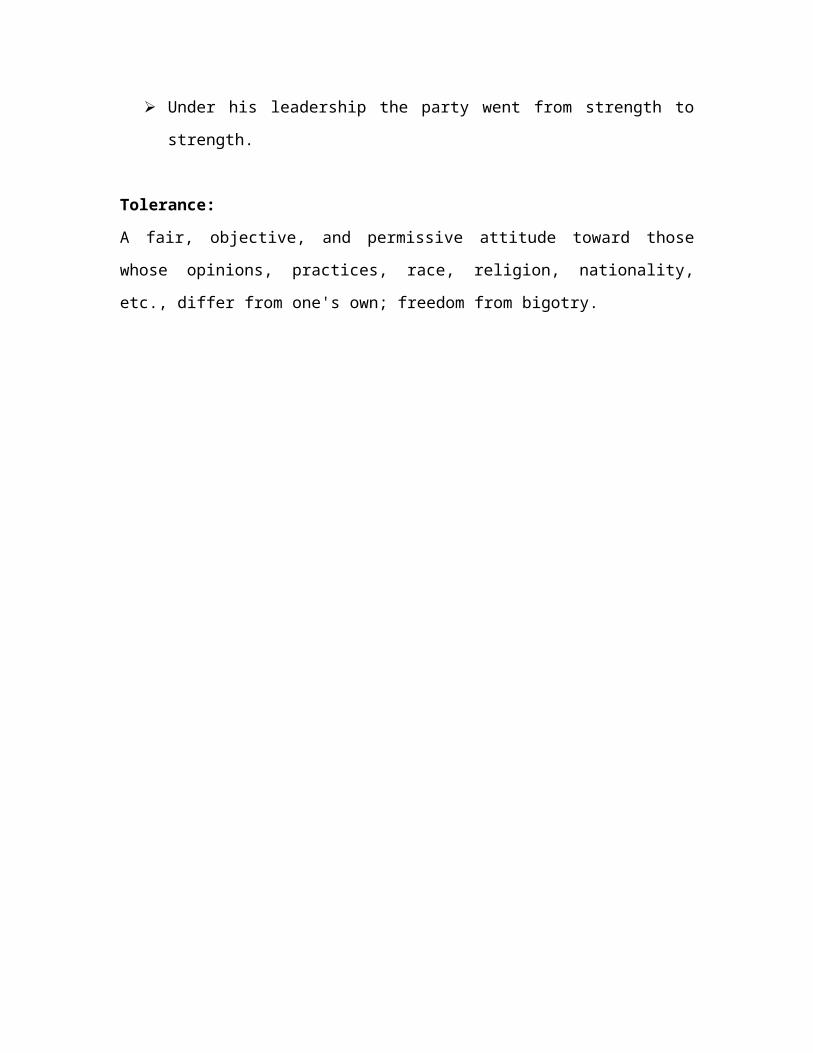
We think he has certain leadership qualities.
Under his leadership the party went from strength to strength.
Tolerance:
A fair, objective, and permissive attitude toward those whose opinions, practices, race,
religion, nationality, etc., differ from one's own; freedom from bigotry.

Self Presentation:
Self-presentation is defined as the attempt to control self-relevant images before real or
imagined others.
OR
“The way in which a person behaves in a given social situation”
Communication:
The exchange of information between people, e.g. by means of speaking, writing, or
using a common system of signs or behaviour.
OR
A spoken or written piece of information
Behavior:
“The way that somebody acts, especially towards other people”
Examples: Local people complained about the behaviour of the football fans. • His
behaviour towards her was quite natural.
Attitude:
“Evaluative statements or judgments concerning objects, people, or events”.
Example What is the government’s attitude to the problem?
Analysis:
A close examination of the parts or elements of something
Examples Job analysis • to make an analysis of the sales or a sales analysis • to carry out
an analysis of the market potential
Teamwork:
Working together as a group.

Capability:
Capability is the ability to perform actions. As it applies to human capital, capability is
the sum of expertise and capacity.
CHAPTER 6
GENERAL FINIDINGS OF THE STUDY
This chapter serves two purposes, it gives comprehensive view of the sample
characteristics and secondly the behavior patterns of respondents, relevant to present
research.
Sample Characteristics:
Gender:
Distribution of respondents with regard to their gender.
Table 1
Out of total respondents 65 % were male and 35% were female.
Category. Frequency Percent
Male 65 65.0
Female 35 35.0
Total 100 100.0

Age:
Distribution of respondents with regard to their age:
.
Table 2
Out of total respondents the students who were in age group between 15 to 20 were 21%,
and who were in age group between21 to 25 were 77%, and those were in between 26 to
30 were 1%.
University Education Level:
Distribution of respondents with regard to their university education level:
Table 1
Table 3
Out of total respondents 5% were L.L.B, 6% were B.B.A, 7% were B.Com Honors, and
11% were B.Sc.Honors, and 71% were of M.A/M.Sc students.
Category Frequency Percent
15 to 20 21 21.0
21 to 25 77 77.0
26 to 30 1 1.0
23 1 1.0
Total 100 100.0
Education Level Frequency Percent
B.A / L.L.B 5 5.0
B.B.A 6 6.0
B.Com Honors 7 7.0
B.Sc.Honors 11 11.0
M.A / M.Sc 71 71.0
Total 100 100.0
Change in dressing style:
Distribution of respondents with respect to their opinion about change in dressing style
after joining the university.
Table 4
The above table reveals that 24% of respondents gave the zero response in this manner
and 48% of respondents gave the response to some extent and in the last 28%
respondents gave the response to great extent.
Change in hair style:
Distribution of respondents with regard to their Opinion about change in hair style after
joining the university.
Table.5
The above table reveals that 54% of respondents gave the zero response in this manner
and 35% of respondents gave the response to some extent and in the last 11%
respondents gave the response to great extent.
Response
Category Frequency Percent
Not at all 24 24.0
To some extent 48 48.0
To great extent 28 28.0
Total 100 100.0
Response
Category Frequency Percent
Not at all. 54 54.0
To some extent 35 35.0
To great extent. 11 11.0
Total 100 100.0
Change in gestures during presentation:
Distribution of respondents with regard to their opinion about change in gestures during
presentation after joining the university.
Table 6
The above table reveals that 25 % of respondents gave the zero response in this manner
and 53% of respondents gave the response to some extent and in the last 22%
respondents gave the response to great extent.
Change in postures during presentation:
Distribution of respondents with regard to their Opinion about change in postures during
presentation after joining the university
Table 7
The above table reveals that 43% of respondents gave the zero response in this manner
and 33% of respondents gave the response to some extent and in the last 24%
respondents gave the response to great extent.
Response
Category Frequency Percent
Not at all. 25 25.0
To some extent 53 53.0
To great extent. 22 22.0
Total 100 100.0
Response
Category Frequency Percent
Not at all. 43 43.0
To some extent 33 33.0
To great extent. 24 24.0
Total 100 100.0
Opinion about inspiration:
Distribution of respondents with regard to their opinion about inspiration from other
university fellows:
Table 8
The above table reveals that 30% of respondents gave the zero response in this manner
and 46% of respondents gave the response to some extent and in the last 24%
respondents gave the response to great extent.
Opinion about building of self esteem:
Distribution of respondents with regard to their Opinion about building of self-esteem
after joining the university:
Table 9
The above table reveals that 11% of respondents gave the zero response in this manner
and 52% of respondents gave the response to some extent and in the last 37%
respondents gave the response to great extent.
Response
Category Frequency Percent
Not at all. 30 30.0
To some extent. 46 46.0
To great extent. 24 24.0
Total 100 100.0
Response Category Frequency Percent
No Effect. 11 11.0
Moderate Level. 52 52.0
High Level. 37 37.0
Total 100 100.0
Opinion about consistency:
Distribution of respondents with regard to their opinion about consistency comes in
personality after joining the university:
Table.10
The above table reveals that 11% of respondents gave the zero response in this manner
and 63% of respondents gave the response to some extent and in the last 26%
respondents gave the response to great extent.
Opinion about leadership qualities:
Distribution of respondents with regard to their Opinion about University education
creates leadership qualities in Students:
Table11
The above table reveals that 10% of respondents gave the zero response in this manner
and 46% of respondents gave the response to some extent and in the last 44%
respondents gave the response to great extent.
Response Category Frequency Percent
Not at all. 11 11.0
To some extent. 63 63.0
To great extent. 26 26.0
Total 100 100.0
Response
Category Frequency Percent
Not at all. 10 10.0
To some extent. 46 46.0
To great extent. 44 44.0
Total 100 100.0
Opinion about tolerance learning:
Distribution of respondents with regard to their opinion about university education
generates and enhances tendency of tolerance learning in students:
Table 12
The above table reveals that 9% of respondents gave the zero response in this manner and
40% of respondents gave the response to some extent and in the last 51% respondents
gave the response to great extent.
Opinion about enhancement of decision making:
Distribution of respondents with regard to their opinion about university education
enhances decision making power of students:
Table.13
The above table reveals that 7% of respondents gave the zero response in this manner and
45% of respondents gave the response to some extent and in the last 48% respondents
gave the response to great extent.
Response
Category Frequency Percent
Not at all. 9 9.0
To some extent. 40 40.0
To great extent. 51 51.0
Total 100 100.0
Response
Category Frequency Percent
Not at all. 7 7.0
To some extent. 45 45.0
To great extent. 48 48.0
Total 100 100.0

Opinion about self presentation:
Distribution of respondents with regard to their opinion about university education
enhances self presentation of students:
Table 14
The above table reveals that 2% of respondents were neutral, 17% were agree and 81%
were strongly agree in this manner.
Opinion about communication style:
Distribution of respondents with regard to their opinion about change in communication
style after joining the university:
Table.15
The above table reveals that 1% of respondents were strongly disagree, 6% were
disagree, 18% were neutral, 52% were agree and 23% were strongly agree in this manner.
Response
Category Frequency Percent
Neutral 2 2.0
Agree 17 17.0
Strongly agree. 81 81.0
Total 100 100.0
Response
Category Frequency Percent
Strongly disagree 1 1.0
Disagree 6 6.0
Neutral 18 18.0
Agree 52 52.0
Strongly agree. 23 23.0
Total 100 100.0

Opinion about way of talking:
Distribution of respondents with regard to their opinion about improvement in way of
talking after joining the university:
Table 16
The above table reveals that 6% of respondents gave the zero response in this manner and
59% of respondents gave the response to some extent and in the last 35% respondents
gave the response to great extent.
Opinion about confidence of speaking:
Distribution of respondents with regard to their opinion about university education
enhances confidence of speaking of students:
Table 17
The above table reveals that 1% of respondents gave the zero response in this manner and
42% of respondents gave the response to some extent and in the last 57% respondents
gave the response to great extent.
Response
Category Frequency Percent
Not at all. 6 6.0
To some extent. 59 59.0
To great extent. 35 35.0
Total 100 100.0
Response
Category Frequency Percent
Not at all. 1 1.0
To some extent. 42 42.0
To great extent. 57 57.0
Total 100 100.0

Opinion about removing hesitation of talking:
Distribution of respondents with regard to their opinion about university education helps
in removing hesitation of talking confidently of students:
Table18
The above table reveals that 2% of respondents were disagree, 7%were neutral, 64%
were agree and 27% were strongly agree in this manner.
Opinion about frequently used language:
Distribution of respondents with regard to their opinion about frequently used language
by university students:
Table 19
The above table reveals that 4% of respondents use native language, 12% use Urdu-
native mix, 15% use Urdu, 65% use Urdu-English mix and 4% use English language.
Response
Category. Frequency Percent
Disagree 2 2.0
Neutral 7 7.0
Agree 64 64.0
Strongly agree. 27 27.0
Total 100 100.0
Response
Category. Frequency Percent
Native Language 4 4.0
Urdu-Native Mix 12 12.0
Urdu 15 15.0
Urdu-English Mix 65 65.0
English 4 4.0
Total 100 100.0

Opinion about use of English Language:
Distribution of respondents with regard to their opinion about use of English Language in
everyday life does matter with personality building of students:
Table20
The above table reveals that 3% of respondents were strongly disagree, 12% were
disagree, 16% were neutral, 38% have agree response and 31% were strongly agree in
this manner.
Opinion about use of English language in everyday life of students:
Distribution of respondents with regard to their opinion about university education
encourages use of English language in everyday life of students:
Table21
The above table reveals that 1% of respondents were strongly disagree, 9% were
disagree, 21% were neutral, 53% were agree and 16% percent were strongly agree.
Response
Category. Frequency Percent
Strongly disagree 3 3.0
Disagree 12 12.0
Neutral 16 16.0
Agree 38 38.0
Strongly agree. 31 31.0
Total 100 100.0
Response
Category. Frequency Percent
Strongly disagree 1 1.0
Disagree 9 9.0
Neutral 21 21.0
Agree 53 53.0
Strongly agree. 16 16.0
Total 100 100.0

Opinion about English Language as a good academic tool:
Distribution of respondents with regard to their opinion about English Language as a
good academic tool to flourish communication ability of students:
Table22
The above table reveals that 5% of respondents were strongly agree, 10% were disagree,
17% were neutral, 44% were agree and 24% were strongly agree.
Opinion about becoming more formal in communication:
Distribution of respondents with regard to their opinion about becoming more formal in
communication after joining the university:
Table23
The above table reveals that 32% of respondents gave the zero response in this manner
and 68% of respondents gave the response of yes.
Response Category. Frequency Percent
Strongly disagree. 5 5.0
Disagree 10 10.0
Neutral 17 17.0
Agree 44 44.0
Strongly agree. 24 24.0
Total 100 100.0
Response
Category. Frequency Percent
No 32 32.0
Yes 68 68.0
Total 100 100.0

Opinion about progressive change in behaving style:
Distribution of respondents with regard to their opinion about progressive change in
behaving style of students after joining the university:
Table24
The above table reveals that 7% of respondents gave the zero response in this manner and
62% of respondents gave the response to some extent and in the last 31 % respondents
gave the response to great extent.
Opinion about improvement in politeness in behaviour:
Distribution of respondents with regard to their opinion about university education
improves politeness in behaviour of students:
Table25
The above table reveals that 21% of respondents gave the zero response in this manner
and 46% of respondents gave the response to some extent and in the last 33%
respondents gave the response to great extent.
Response
Category. Frequency Percent
Not at all. 7 7.0
To some extent. 62 62.0
To great extent. 31 31.0
Total 100 100.0
Response
Category. Frequency Percent
Not at all. 21 21.0
To some extent. 46 46.0
To great extent. 33 33.0
Total 100 100.0

Opinion about cooperation learning:
Distribution of respondents with regard to their opinion about university education makes
students cooperative person:
Table25
The above table reveals that 1% of respondents were strongly disagree, 4%were disagree,
19%were neutral, 55% were agree and 21% were strongly agree.
Opinion about judging patterns:
Distribution of respondents with regard to their opinion about university education
enhances judging patterns of students:
Table.26
The above table reveals that 4% of respondents gave the zero response in this manner and
58% of respondents gave the response to some extent and in the last 38% respondents
gave the response to great extent.
Response
Category. Frequency Percent
Strongly disagree 1 1.0
Disagree 4 4.0
Neutral 19 19.0
Agree 55 55.0
Strongly agree 21 21.0
Total 100 100.0
Response
Category. Frequency Percent
Not at all 4 4.0
To some extent 58 58.0
To great extent 38 38.0
Total 100 100.0
Opinion about systematic way of analysis:
Distribution of respondents with regard to their opinion about university education
creates systematic way of analysis in students:
Table27
The above table reveals that 3% of respondents were disagree in this manner and 27%
were neutral, 57% were agree, and 13% were of strongly agree response
Opinion about how students learn systematic analysis:
Distribution of respondents with regard to their opinion about in what ways university
education creates systematic way of analysis in students:
Table28
The above table reveals that 3% of respondents gave response of report writing in this
manner, 29% of respondents gave the response of academic writing, 15 % respondents
Response
Category. Frequency Percent
Disagree 3 3.0
Neutral 27 27.0
Agree 57 57.0
Strongly agree 13 13.0
Total 100 100.0
Response Category. Frequency Percent
By report writing 3 3.0
By academic discussions 29 29.0
By attending
seminars/conferences15 15.0
Any other 12 12.0
All above 41 41.0
Total 100 100.0

gave the response of attending seminars, 12% were in favor of any other option, and 41%
were in favor of all asked response category.
Opinion about team work learning:
Distribution of respondents with regard to their opinion about students learns much more
about cooperation, compromising, analysis in team work:
Table29
The above table reveals that 5% of respondents gave the zero response in this manner and
41% of respondents gave the response to some extent and in the last 54% respondents
gave the response to great extent.
Response
Category. Frequency Percent
Not at all 5 5.0
To some extent 41 41.0
To great extent 54 54.0
Total 100 100.0

Opinion about improvement in social relations:
Distribution of respondents with regard to their opinion about university education
improves social relations of students:
Table.30
The above table reveals that 3% of respondents strongly disagree in this manner and 4%
of respondents were disagree, 19% respondents were neutral, 48% were agree and 26%
were strongly agree.
Response
Category. Frequency Percent
Strongly disagree 3 3.0
Disagree 4 4.0
Neutral 19 19.0
Agree 48 48.0
Strongly agree 26 26.0
Total 100 100.0
Opinion about reshaping of inner capabilities of students:
Distribution of respondents with regard to their Opinion about University Education
reshapes and unfolds inner capabilities of students:
Table.31
The above table reveals that 1% of respondents gave the strongly disagree response in
this manner and 3% of respondents gave the response of disagree and 8% respondents
gave the response of neutral, 11% were agree, and 77% were strongly agree
Opinion about the role of university education:
Distribution of respondents with regard to their Opinion about University Education has a
significant role in building personality of the students:
Table.32
The above table reveals that 5% of respondents gave the neutral response in this manner
and 41% of respondents gave the response of agree and in the last 54% respondents gave
the response of strongly agree.
Response
Category. Frequency Percent
Strongly Disagree 1 1.0
Disagree 3 3.0
Neutral 8 8.0
Agree 11 11.0
Strongly Agree 77 77.0
Total 100 100.0
Response
category Frequency Percent
Neutral 5 5.0
Agree 41 41.0
Strongly Agree 54 54.0
Total 100 100.0

CHAPTER 7
TESTING OF HYPOTHESIS
Hypothesis formulated for the present research is as follows:
“The role of university education in developing personality among Punjab University
students”
It was assumed that there might be some relationship between university education and
personality development.
Chi-Square Test was applied to test the hypothesis.
The formula of Chi-Square Test is:
Before applying the statistical test the researchers formulated the null hypothesis Ho and
alternative hypothesis H1.
Ho The university education does not build personality of the students.
H1 The university education builds personality of the students.
In the present study, the researchers denote personality building with the variable “self
presentation”. The researchers did cross tabulation between university education level
and self presentation of students to test the hypothesis by using Chi-Square Test. They
also did cross tabulation between university education level and variable “reshaping of
inner capabilities”.
The researchers set the following standard to apply Chi-Square Test:
Level of significance (α) = 0.05 or 5%
Degree of freedom (D.F) = 8
In the above table the p-value of Chi-Square Test is 0.000 which is less than the level of
significance which is 0.05. It shows that the two variables are associated and significant.
So we reject our null hypothesis Ho and accept the alternative hypothesis H1. So there is
a relationship between university education and personality development. Now the
researchers give the strength of relationship between the independent and dependent
variables. As the table of cross tabulation is of 3 by 3 order, so the researchers will give
the association by using Cramer’s V.
Chi-Square Tests
Value df
Asymp. Sig. (2-
sided)
Pearson Chi-Square 85.072a 8 .000
Likelihood Ratio 65.575 8 .000
N of Valid Cases 100
a. 11 cells (73.3%) have expected count less than 5. The minimum
expected count is .10.

Symmetric Measures
Value Approx. Sig.
Nominal by Nominal Phi .922 .000
Cramer's V .652 .000
N of Valid Cases 100
In the above table the value of Cramer’s V is 0.652. This value shows that there is strong
relationship between the dependent and independent variables of the current research
hypothesis.
Second cross tabulation:
Level of significance (α) = 0.05 or 5%
Degree of freedom (D.F) = 8
Chi-Square Tests
Value df
Asymp. Sig. (2-
sided)
Pearson Chi-Square 81.977a 16 .000
Likelihood Ratio 68.387 16 .000
N of Valid Cases 100
a. 20 cells (80.0%) have expected count less than 5. The minimum
expected count is .05.
In the above table the p-value of Chi-Square Test is 0.000 which is less than the level of
significance which is 0.05. It shows that the two variables are associated and significant.
So we reject our null hypothesis Ho and accept the alternative hypothesis H1. So there is
a relationship between university education and personality development. Now the
researchers give the strength of relationship between the independent and dependent
variables. As the table of cross tabulation is of 3 by 3 order, so the researchers will give
the association by using Cramer’s V.
Symmetric Measures
Value Approx. Sig.
Nominal by Nominal Phi .905 .000
Cramer's V .453 .000
N of Valid Cases 100
In the above table the value of Cramer’s V is 0.453. This value shows that there is
moderate relationship between the dependent and independent variables of the current
research hypothesis.

CHAPTER 8
SUMMARY, CONCLUSION AND SUGGESTIONS
SUMMARY:
The purpose of present research was to find the relationship between the role of
university education and development of personality of the students. The study was
conducted within the framework of Learning Theories that are Behaviorism,
Cognitivism, and Constructivism. The hypothesis of the present research was “The role
of university education in developing personality among Punjab university students.
The universe of the present research was University of the Punjab Lahore. The
researchers collected the data from the thirteen faculties of the university. The
respondents were of B.A/ B.Sc/ B.com Honors, and M.A / M.Sc students which have
spent at least one year of their course of study because they can give meaningful
justification of the impact of university education on their personalities. The researchers
used Systematic Sampling and Structured Interview Schedule to collect data. After data
collection “data sheet” was prepared and cross tabulation was done. Chi-square test was
used to test the relationship between the university education and the personality
development of the students.
CONCLUSION:
After the analysis of the whole data, the researchers have come to the following
conclusions:
I. There was a strong relationship between the university education and the
development of personality.
II. The M.A/ M.Sc students gave more positive responses as compared to other
programs students. Because they are at more mature level and can easily observed
the changes come in their personality with the increase of knowledge and
experience.
III. The B.A and B.Sc students also showed positive attitude towards the present
research topic.
IV. Almost 80% of the respondents showed that the personality of a student is really
developed, reshaped and enhanced in the academic environment of the university.
V. The present research is also useful for parents who do not favor the higher
education especially university education of their daughters.
VI. The researchers came to know that “University of the Punjab is playing a vital and
very important role in developing personality of the students.

Suggestions:
I. The present study was conducted in the University of the Punjab Lahore. The
researchers suggest that the same study can be conducted on other universities of
Pakistan.
II. The results of present study showed that universities are playing important roles
in developing personalities of the students. So the researchers suggest that
universities should focus more on manners and discipline issues of the students.
III. The researchers suggest that other studies can also be conducted on other
personality figures.
IV. The researchers suggest that other academic activities of students can also be
studied like “the writing approaches of university students” etc.
V. The present research is done on majority of male respondents and sample size of
100 respondents. The researchers suggest that another study can be conducted by
taking equal number of males and females respondents and by increasing sample
size of respondents.
VI. A comprehensive study can also be done by making comparison of roles of
colleges and universities in developing personality of the students.
References
Ahmed, Israr 1985. “Impact of education on the family patterns of old Lahorities.” An
unpublished M.A. Thesis, Lahore: Institute of social and cultural studies, University of
the Punjab.
Abubakkar, Muhammad 2009. “Impact of education on the perceived severity of illness
and self medication.” An unpublished M.A. Thesis, Lahore: Institute of social and
cultural studies, University of the Punjab.
Ali, Hamid 2009. “Discriminatory attitude among parents in household resource
allocation and role of education in human capital investment”. An unpublished M.A.
Thesis, Lahore: Institute of social and cultural studies, University of the Punjab.
Firdaus, Nuzhat 1985. “The level of education and vertical mobility.” An unpublished
M.A. Thesis, Lahore: Institute of social and cultural studies, University of the Punjab.
Macionis, John J.(2008). Sociology. (11th ed).
Masood, Shamoona 1990. “ Role of education in creating awareness among women about
environmental pollution, its causes and effects.” An unpublished M.A. Thesis, Lahore:
Institute of social and cultural studies, University of the Punjab.
Neuman, W.Lawrence (2008).Social Research Methods. Second impression. ( 6th ed).
Rashtriya Printers.

Sadiq, Razia 1986. “The impact of housewives education on their rate of fertility”. An
unpublished M.A. Thesis, Lahore: Institute of social and cultural studies, University of
the Punjab.
Sial, Umme-Kalsoom 2005. “Level of education of lady counselors and its impact on
their political participation.” An unpublished M.A. Thesis, Lahore: Institute of social and
cultural studies, University of the Punjab.
Wehmeier, Sally. (2000). Oxford Advanced Learner’s Dictionary. (6th ed). Oxford
University Press.
Web References:
AACAP and David Pruitt. Your Child: Emotional, Behavioral, and Cognitive
Development from Infancy through Pre-Adolescence. New York: Harper Collins, 1998.
AACAP and David Pruitt. Your Adolescent: Emotional, Behavioral, and Cognitive
Development from Early Adolescence through the Teen Years. New York: Harper
Collins. (Sep. 2010).
Dictionary online
(http://dictionary.reference.com/browse/Consistency. (Sep. 2010)
Dictionary online
http://dictionary.reference.com/browse/Tolerance.(Sep. 2010)
English dictionary
http://www.englishdefined.com/definition/teamwork.(Sep. 2010)
Eric.Ed.Com
http://www.eric.ed.gov/ERICWebPortal. (Sep. 2010)
English dictionary http://www.englishdefined.com/definition/leadership . (Sep. 2010)
Media dictionary online.
http://www.mediadictionary.com/definition/communication. (Sep. 2010)
Media dictionary online.
(http://www.mediadictionary.com/definition/self-presentation.(Sep. 2010)
Psychology.com
http://psychology.about.com/od/overviewofpersonality/a/persondef. (Sep. 2010)
Wikipedia, the free encyclopedia.
http://en.wikipedia.org/wiki/Learning_theory_(education). (Sep. 2010)
Wikipedia, the free encyclopedia.
http://en.wikipedia.org/wiki/University. (Sep. 2010)
Questionnaire
The Role of University Education in Building Personality
among Punjab University Students
Research AdvisorFarooq Ahmad
Researchers Institute of Social & Cultural StudiesMuhammad Ali University of the Punjab, Muhammad Safdar Quad-e-Azam Campus, Lahore.Muhammad Ashraf
Demographic Section
Question ID:
Student Name:
Gender:
Age:
Department:
Degree Program: (L.L.B/B.A / B.Com/ B.Sc Honors MA/M.Sc)
Semester:
Medium of schooling: (English, Urdu, etc)

Section -1: Personality Traits
I: Appearance
1: Do you think that there is change in your dressing style during course presentations
after joining the University?
1. Not at all.2. To some extent.3. To great extent.
2: Do you think that there is change in your hair style during course presentations after joining the University?
1. Not at all.
2. To some extent.3. To great extent.
3: Do you think that there is change in your gestures (facial expressions) during course presentations after joining the University?
1. Not at all.
2. To some extent.3. To great extent.
4: Do you think that there is change in your postures (standing style) during course presentations after joining the University?
1. Not at all.
2. To some extent.3. To great extent.
5: Did you get inspired from other University fellows?
1. Not at all.
2. To some extent.3. To great extent.
II: Self Esteem

6: Do you think that University Environment builds the Self Esteem of student’s up to?1. No Effect.
2. Moderate Level.3. High Level

III: Consistency in Personality
7: Do you think that the academic environment of University has made you a consistent person?
1. Not at all.
2. To some extent.3. To great extent.
IV: Leadership Qualities
8: Do you agree that University Academic Environment creates leadership qualities in students?
1. Not at all.
2. To some extent.3. To great extent.
V: Tolerance Learning
9: Do you agree that University Education generates and enhances the tendency of tolerance among students of different areas, backgrounds and linguistic features?
1. Not at all.
2. To some extent.3. To great extent.
VI: Enhance Decision Making Power
10: Do you believe that University Education enables a student to reach at a proper decision on the basis of people, events or things?
1. Not at all.
2. To some extent.3. To great extent.

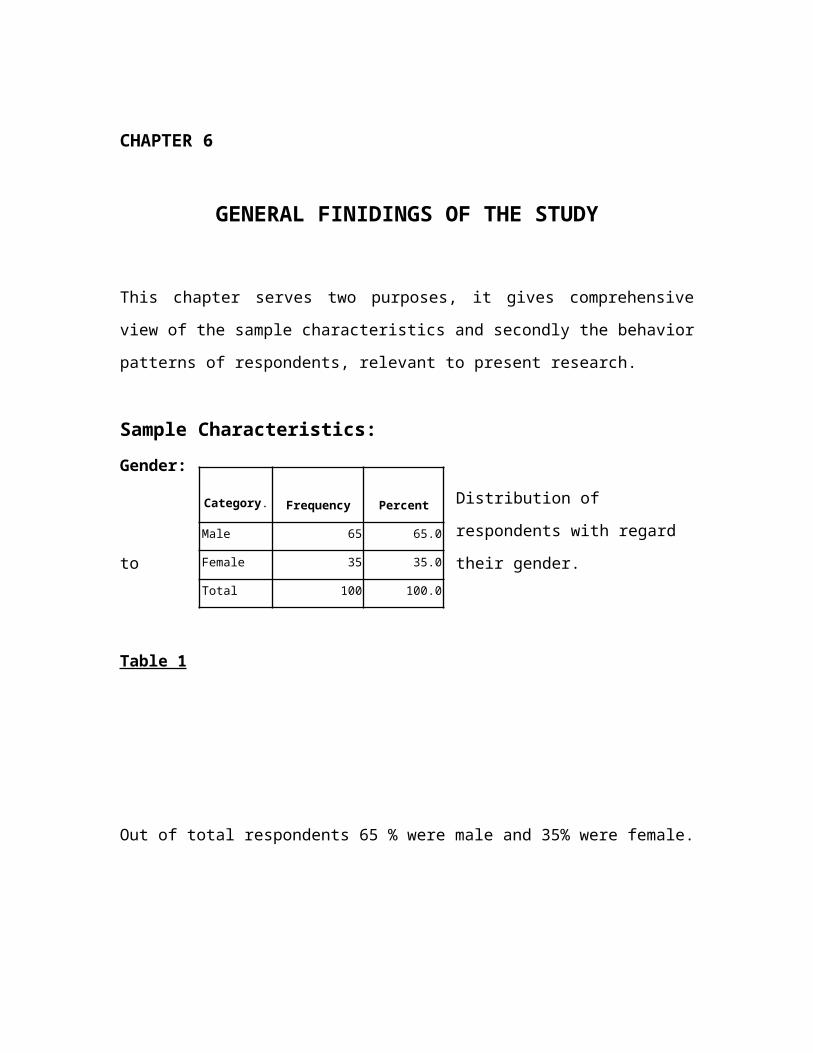
VII: Self Presentation 11: Do you believe that University Education enhances self presentation of students by participating in class presentations, other curriculum activities like sports, speech competitions, performing drama skits, attending seminars etc?
1. Strongly disagree.
2. Disagree3. Neutral4. Agree5. Strongly agree.
Section -2: Communication Learning
12: Do you think that there is change in your communication style after joining the University?
1. Strongly Disagree.2. Disagree.3. Neutral.4. Agree.5. Strongly Agree.
13: Do you think that there is improvement in your way of talking after joining the University?
1. Not at all.
2. To some extent.3. To great extent.
14: Do you agree that University Education contribute in enhancing your confidence of speaking?
1. Not at all.
2. To some extent.3. To great extent.
15: Do you agree that University Education helped in removing your hesitation of talking confidently?
1. Strongly Disagree.2. Disagree.

3. Neutral.4. Agree.5. Strongly Agree.

16: What kind of language you frequently use in your communication?
1. Native Language.2. Urdu-Native Mix.3. Urdu.4. Urdu-English Mix.5. English.
17: Do you agree that the use of English language in every day life does matter with personality building of students especially in University environment?
1. Strongly Disagree.2. Disagree.3. Neutral.4. Agree.5. Strongly Agree.
18: Do you think that University Education encourages the use of English language in everyday life of students?
1. Strongly Disagree.2. Disagree.3. Neutral.4. Agree.5. Strongly Agree.
19: Do you think that English is a good academic tool to flourish the communication ability of a student?
1. Strongly Disagree.2. Disagree.3. Neutral.4. Agree.5. Strongly Agree.
20: Have you become more formal in your communication after joining the University?
0. No.1. Yes.

Section-3: Behavior / Attitude
21: Do you think that is there any progressive change in your behaving style after joining the University?
1. Not at all.2. To some extent.3. To great extent.
22: Do you agree that University Education improved politeness in your behavior?
1. Not at all.2. To some extent.3. To great extent.
23: Do you agree that University Education has made you a cooperative person?
1. Strongly Disagree.2. Disagree.3. Neutral.4. Agree.5. Strongly Agree.
24: Do you agree that University Education enhanced your judging patterns about people, events or things after joining the University?
1. Not at all.2. To some extent.3. To great extent.
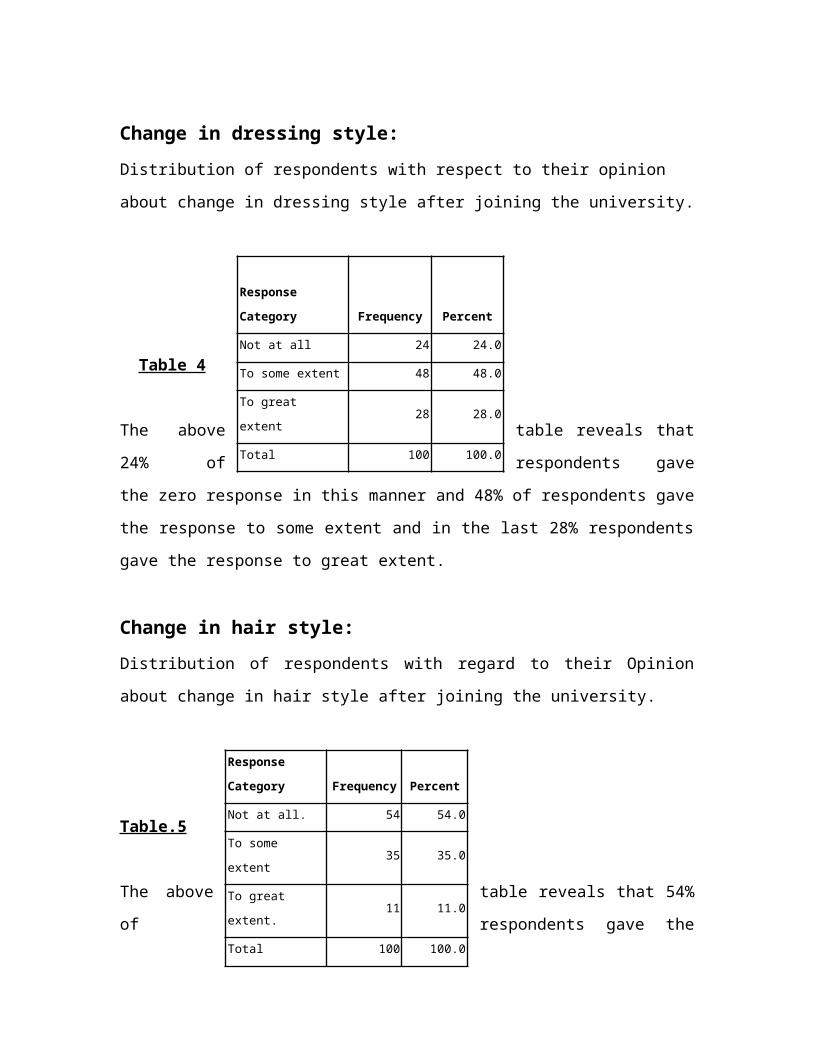
Section -4: Systematic Learning Techniques
25: Do you really think that University education created systematic way of analysis about people, events or things and society with logical reasoning?
1. Strongly Disagree.2. Disagree.3. Neutral.4. Agree.5. Strongly Agree.
26: In what ways University Education created systematic way of analysis in your personality?
1. By report writing.2. By academic discussions.3. By attending seminars/conferences.4. Any other.5. All above.
Section -5: Group Work Learning
27: Do you believe that students learn much more about cooperation, tolerance, patience, compromising, analysis etc during team or group work tasks?
1. Not at all.2. To some extent.3. To great extent.
Section -6: Enhance Social Relations
28: Have your social relations improved and have you become more social after joining the University?
1. Strongly Disagree.2. Disagree.3. Neutral.4. Agree.5. Strongly Agree.
Section -7: Reshaping Of Inner Capabilities
29: Do you agree that getting education in University reshapes and unfolds inner capabilities of students in a more productive way to make them proper functional member of the society?
1. Strongly Disagree.2. Disagree.3. Neutral.4. Agree.5. Strongly Agree.
Section -8: Conclusive Question
30. Do you believe that University Education has a significant role in building personality of the students?
1. Strongly Disagree.2. Disagree.3. Neutral.4. Agree.5. Strongly Agree.
Thank you for the Cooperation.