Accuracy of an expanded early warning score for patients ... et al_Br J Surg 2012_99(2...unit (ICU)...
15
1 Original article Accuracy of an expanded early warning score for patients in general and trauma surgical wards Tim Smith, Dennis Den Hartog, Tineke Moerman, Peter Patka, Esther M.M. Van Lieshout and Niels W.L. Schep* Department of Surgery-Traumatology, Erasmus MC, University Medical Center Rotterdam, Rotterdam, The Netherlands Correspondence to: E.M.M. Van Lieshout, PhD, Erasmus MC, University Medical Center Rotterdam, Department of Surgery-Traumatology, PO Box 2040, 3000 CA Rotterdam, The Netherlands (e-mail: [email protected]) *Current address: Department of Surgery-Traumatology. Academic Medical Center Amsterdam, Amsterdam, The Netherlands Background: Early warning scores may aid the prediction of major adverse events in hospitalized patients. Recently, an expanded early warning score (EWS) was introduced in the Netherlands. The aim of this study was to assess the relationship between this EWS and the occurrence of major adverse clinical events during hospitalization of patients admitted to a general and trauma surgery ward. Methods: This was a prospective cohort study of consecutive patients admitted to the general and trauma surgery ward of a university medical centre (March–September 2009). Follow-up was limited to the time the patient was hospitalized. Logistic regression analysis was used to
Transcript of Accuracy of an expanded early warning score for patients ... et al_Br J Surg 2012_99(2...unit (ICU)...
1
Original article
Accuracy of an expanded early warning score for patients in
general and trauma surgical wards
Tim Smith, Dennis Den Hartog, Tineke Moerman, Peter Patka, Esther M.M. Van
Lieshout and Niels W.L. Schep*
Department of Surgery-Traumatology, Erasmus MC, University Medical Center Rotterdam,
Rotterdam, The Netherlands
Correspondence to: E.M.M. Van Lieshout, PhD, Erasmus MC, University Medical Center
Rotterdam, Department of Surgery-Traumatology, PO Box 2040, 3000 CA Rotterdam, The
Netherlands (e-mail: [email protected])
*Current address: Department of Surgery-Traumatology. Academic Medical Center
Amsterdam, Amsterdam, The Netherlands
Background: Early warning scores may aid the prediction of major adverse events in
hospitalized patients. Recently, an expanded early warning score (EWS) was introduced in
the Netherlands. The aim of this study was to assess the relationship between this EWS and
the occurrence of major adverse clinical events during hospitalization of patients admitted to
a general and trauma surgery ward.
Methods: This was a prospective cohort study of consecutive patients admitted to the general
and trauma surgery ward of a university medical centre (March–September 2009). Follow-up
was limited to the time the patient was hospitalized. Logistic regression analysis was used to

2
assess the relationship between the EWS and the occurrence of the composite endpoint
consisting of death, reanimation, unexpected intensive care unit admission, emergency
surgery and severe complications. Performance of the EWS was analysed using sensitivity,
specificity, predictive values and receiver–operator characteristic (ROC) curves.
Results: A total of 572 patients were included. During a median follow-up of 4 days, 46 (8
per cent) patients reached the composite endpoint (two deaths, two reanimations, 17 intensive
care unit admissions, 44 severe complications, one emergency operation). An EWS ≥ 3,
adjusted for baseline American Society of Anesthesiology classification, was associated with
a significantly higher risk of reaching the composite endpoint (odds ratio 11·3, 95 per cent
confidence interval (c.i.) 5·5 to 22·9). The area under the ROC curve was 0·87 (95 per cent
c.i. 0·81 to 0·93). When considering an EWS ≥ 3 to be a positive test result, sensitivity was
74 per cent and specificity was 82 per cent.
Conclusion: An EWS ≥ 3 is an independent predictor of major adverse events in patients
admitted to a general and trauma surgery ward.
Introduction
A large proportion of the in-hospital mortality is predictable and preventable if early
recognition of clinical deterioration is achieved1–3. From observational studies it appears that
in the majority of patients an adverse clinical event (e.g. death, reanimation or intensive care
unit (ICU) admission) is preceded by early clinical warning signs3–6. However, these signs
are frequently not recognized, misinterpreted or not properly treated7. The aim of early
warning scores (EWS) is to aid early recognition of clinical deterioration in patients and
consequently initiate early interventions to prevent further decline. Examples of available
EWS include ‘medical emergency teams’ (MET), ‘acute life-threatening early recognition

3
and treatment’ (ALERT), and ‘critical care outreach service’ (CCOS)8–11. However, high
quality evidence on the performance of EWS is lacking12,13.
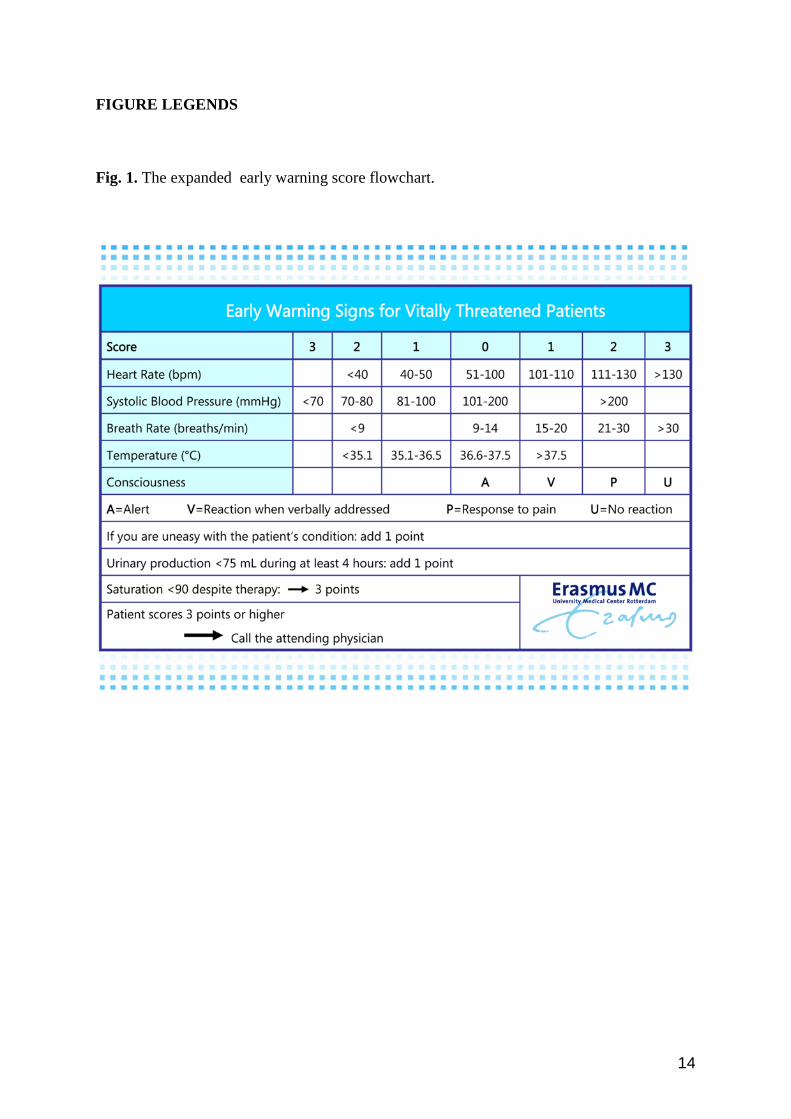
In 2009, an expanded EWS was introduced in the Netherlands14. The score is
composed of the clinical parameters heart rate, systolic blood pressure, respiratory rate,
temperature, level of consciousness, urine production, and concern of the nursing staff about
the patient. The EWS used in the present study is based on the Modified Early Warning
Score, but also includes the variables urine production, neurological status and concern of
nursing staff about the patient’s condition15. In an attempt to improve patient safety, this
EWS was introduced and implemented in 2009 in several Dutch hospitals, including our
university medical centre. The use of the EWS is recommended by the Dutch national
committee on improvement of healthcare (Centraal Begeleidings Orgaan (CBO) and safety
programme VMS)14. However, no robust evidence on the performance of this EWS in
predicting clinical deterioration was available at the time of its implementation. Moreover,
this EWS had not been validated in a large population before. Therefore, the aim of the
present study was to analyse the relationship between the EWS and the occurrence of major
adverse events in surgical patients during hospitalization on a general and trauma surgery
ward.
Methods
Study design and population
This study was designed as a single-centre prospective cohort study. The study population
consisted of all consecutive patients admitted to the general and trauma surgery ward of a
Level 1 trauma centre in the Netherlands between 1 March and 30 September 2009. No
exclusion criteria were applied. The local medical ethics committee approved this study.

4
Data collection
Data collection covered demographic characteristics, the American Society of
Anesthesiologists physical status classification (ASA class) and diagnosis at admission. At
the time of admission, vital functions including systolic and diastolic blood pressures, heart
rate, respiratory rate, temperature, level of consciousness and urine production were recorded.
Concern of the nursing staff about the patient’s condition was also scored. These variables
were combined into the EWS (Fig. 1). Three times a day, the EWS values of all admitted
patients were determined during the clinical round in the morning, afternoon and evening. In
addition, if a patient’s clinical state deteriorated, an EWS was determined and registered.
Planned ICU admissions (e.g. after major surgery in high-risk patients) were not taken into
account. The highest EWS observed during hospitalization, corresponding to the worst
clinical situation of the patient, was used in the analysis. The EWS scores were dichotomized
into EWS < 3 versus EWS ≥ 3. This cut-off value was prespecified, based upon the
recommendations of the Dutch CBO guideline. Herein, clinical evaluation of the patient’s
condition by the attending physician was advised if the EWS was 3 or more. The association
between the EWS and the occurrence of adverse events was studied in a pre-introduction
setting. Therefore, the EWS was determined regularly but was not used to trigger the
intervention team. However, the physician who decided whether the intervention team was
triggered was not blinded to the EWS.
Follow-up
Follow-up was limited to the time the patient was hospitalized. A trained research nurse
scored for death, reanimation, unexpected ICU admission, emergency operations and severe
complications during follow-up. Planned ICU admissions (e.g. after major surgery in high-
risk patients) were not taken into account. Severe complications were defined as

5
complications that were potentially lethal and of which the outcome could have been
potentially influenced if the complication was recognized early.
Data analysis
Statistical analyses were performed using SPSS for Windows, version 17·0 (SPSS,
Chicago, Illinois, USA) and STATA for Windows, version 11 (StataCorp, College
Station, Texas, USA). Continuous variables are expressed as the mean(s.d.) if normally
distributed or otherwise as the median (interquartile ratio). Categorical variables are
expressed as frequency (percentage). Means were compared using the independent samples t
test if normally distributed or using the Mann–Whitney U test if the distribution was skewed.
Logistic regression models with preselected co-variables were used to obtain multivariable
adjusted risk estimates. All risk estimates are reported as odds ratio (OR) with 95 per cent
confidence interval (c.i.). The goodness-of-fit of the model was evaluated using the Hosmer–
Lemeshow statistic. A composite endpoint consisting of death, reanimation, ICU admission,
emergency operation and severe complications was used as the dependent variable. When a
patient reached at least one of the above-mentioned complications the composite endpoint
was considered positive. The performance of the EWS was assessed by calculating the
sensitivity, specificity, positive predictive value and negative predictive value. The
performance was summarized in a receiver–operator characteristic (ROC) curve. The area
under the ROC curve was calculated subsequently. If the EWS was equal to or exceeded the
predefined cut-off of 3 points, the test was considered positive; if the EWS was less than 3,
the test was considered negative. The performance of the EWS when using other cut-off
values was evaluated in terms of sensitivity, specificity, positive predictive value and
negative predictive value.
6
Results
Study population
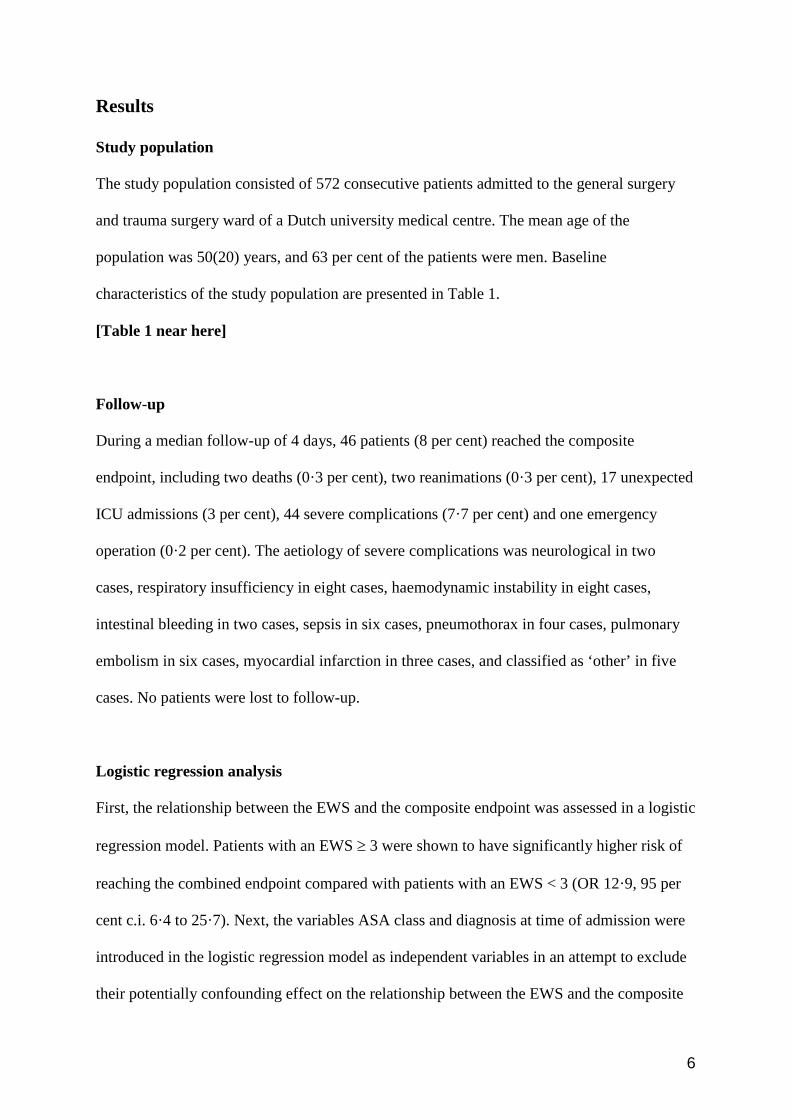
The study population consisted of 572 consecutive patients admitted to the general surgery
and trauma surgery ward of a Dutch university medical centre. The mean age of the
population was 50(20) years, and 63 per cent of the patients were men. Baseline
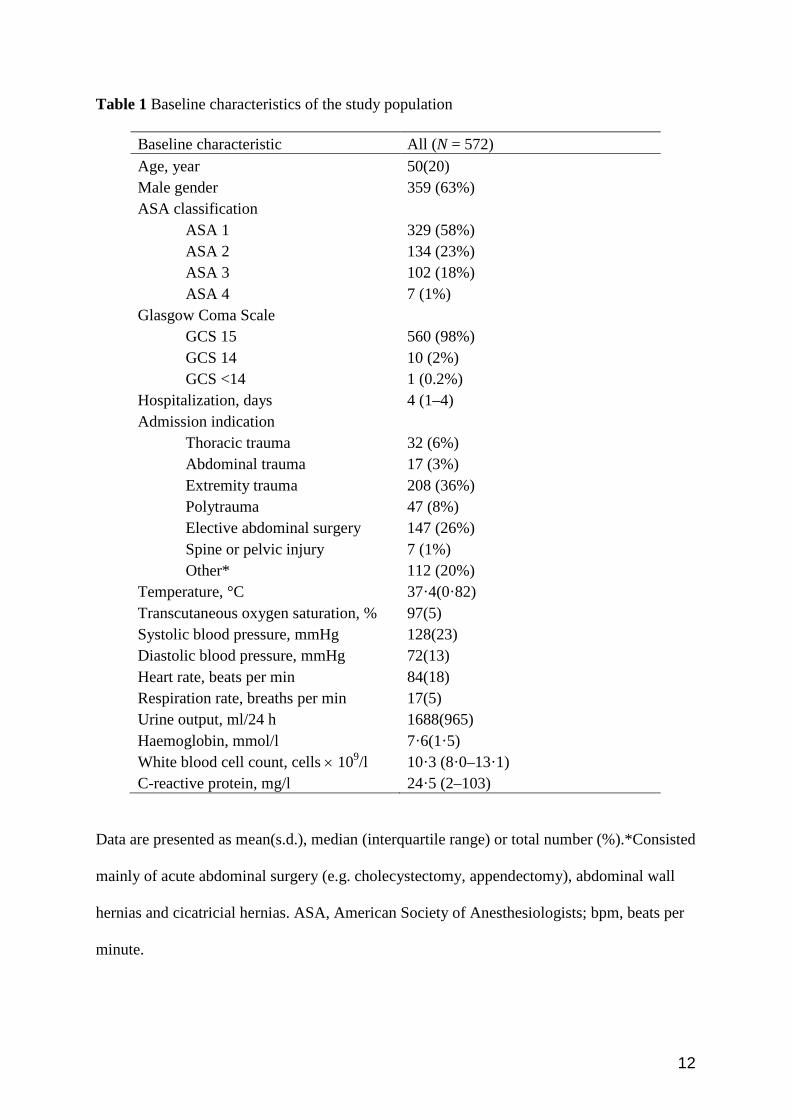
characteristics of the study population are presented in Table 1.
[Table 1 near here]
Follow-up
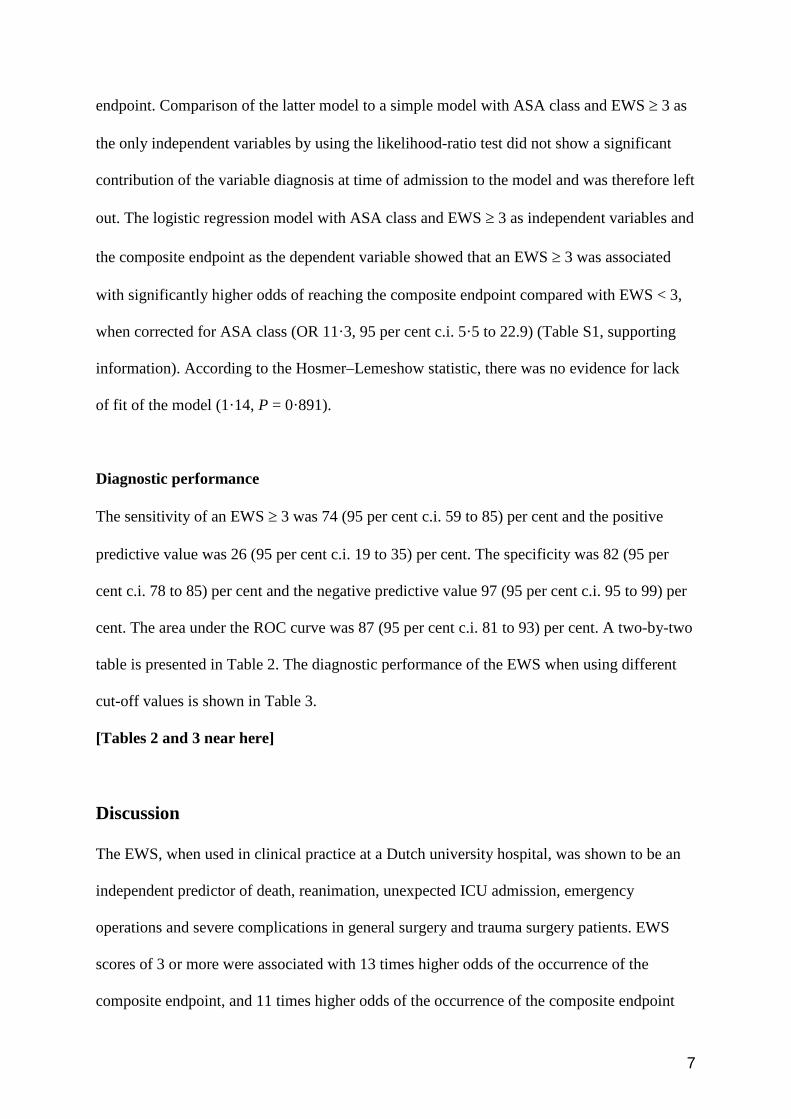
During a median follow-up of 4 days, 46 patients (8 per cent) reached the composite
endpoint, including two deaths (0·3 per cent), two reanimations (0·3 per cent), 17 unexpected
ICU admissions (3 per cent), 44 severe complications (7·7 per cent) and one emergency
operation (0·2 per cent). The aetiology of severe complications was neurological in two
cases, respiratory insufficiency in eight cases, haemodynamic instability in eight cases,
intestinal bleeding in two cases, sepsis in six cases, pneumothorax in four cases, pulmonary
embolism in six cases, myocardial infarction in three cases, and classified as ‘other’ in five
cases. No patients were lost to follow-up.
Logistic regression analysis
First, the relationship between the EWS and the composite endpoint was assessed in a logistic
regression model. Patients with an EWS ≥ 3 were shown to have significantly higher risk of
reaching the combined endpoint compared with patients with an EWS < 3 (OR 12·9, 95 per
cent c.i. 6·4 to 25·7). Next, the variables ASA class and diagnosis at time of admission were
introduced in the logistic regression model as independent variables in an attempt to exclude
their potentially confounding effect on the relationship between the EWS and the composite
7
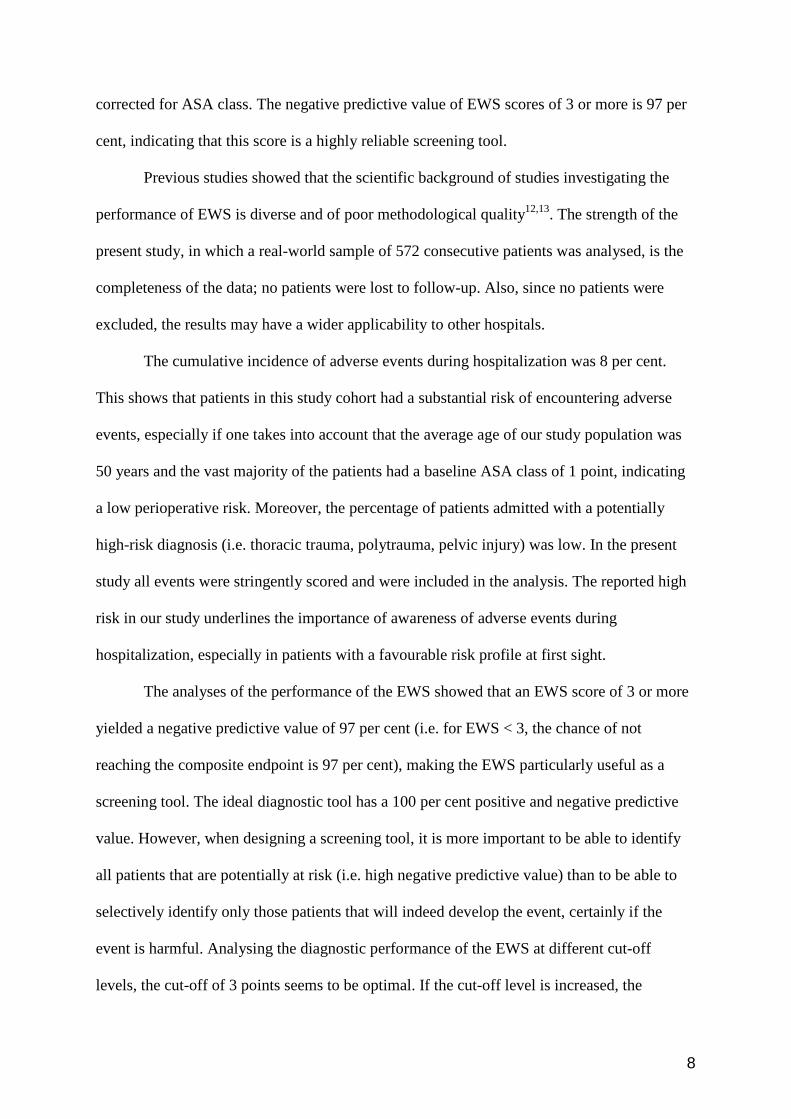
endpoint. Comparison of the latter model to a simple model with ASA class and EWS ≥ 3 as
the only independent variables by using the likelihood-ratio test did not show a significant
contribution of the variable diagnosis at time of admission to the model and was therefore left
out. The logistic regression model with ASA class and EWS ≥ 3 as independent variables and
the composite endpoint as the dependent variable showed that an EWS ≥ 3 was associated
with significantly higher odds of reaching the composite endpoint compared with EWS < 3,
when corrected for ASA class (OR 11·3, 95 per cent c.i. 5·5 to 22.9) (Table S1, supporting
information). According to the Hosmer–Lemeshow statistic, there was no evidence for lack
of fit of the model (1·14, P = 0·891).
Diagnostic performance
The sensitivity of an EWS ≥ 3 was 74 (95 per cent c.i. 59 to 85) per cent and the positive
predictive value was 26 (95 per cent c.i. 19 to 35) per cent. The specificity was 82 (95 per
cent c.i. 78 to 85) per cent and the negative predictive value 97 (95 per cent c.i. 95 to 99) per
cent. The area under the ROC curve was 87 (95 per cent c.i. 81 to 93) per cent. A two-by-two
table is presented in Table 2. The diagnostic performance of the EWS when using different
cut-off values is shown in Table 3.
[Tables 2 and 3 near here]
Discussion
The EWS, when used in clinical practice at a Dutch university hospital, was shown to be an
independent predictor of death, reanimation, unexpected ICU admission, emergency
operations and severe complications in general surgery and trauma surgery patients. EWS
scores of 3 or more were associated with 13 times higher odds of the occurrence of the
composite endpoint, and 11 times higher odds of the occurrence of the composite endpoint
8
corrected for ASA class. The negative predictive value of EWS scores of 3 or more is 97 per
cent, indicating that this score is a highly reliable screening tool.
Previous studies showed that the scientific background of studies investigating the
performance of EWS is diverse and of poor methodological quality12,13. The strength of the
present study, in which a real-world sample of 572 consecutive patients was analysed, is the
completeness of the data; no patients were lost to follow-up. Also, since no patients were
excluded, the results may have a wider applicability to other hospitals.
The cumulative incidence of adverse events during hospitalization was 8 per cent.
This shows that patients in this study cohort had a substantial risk of encountering adverse
events, especially if one takes into account that the average age of our study population was
50 years and the vast majority of the patients had a baseline ASA class of 1 point, indicating
a low perioperative risk. Moreover, the percentage of patients admitted with a potentially
high-risk diagnosis (i.e. thoracic trauma, polytrauma, pelvic injury) was low. In the present
study all events were stringently scored and were included in the analysis. The reported high
risk in our study underlines the importance of awareness of adverse events during
hospitalization, especially in patients with a favourable risk profile at first sight.
The analyses of the performance of the EWS showed that an EWS score of 3 or more
yielded a negative predictive value of 97 per cent (i.e. for EWS < 3, the chance of not
reaching the composite endpoint is 97 per cent), making the EWS particularly useful as a
screening tool. The ideal diagnostic tool has a 100 per cent positive and negative predictive
value. However, when designing a screening tool, it is more important to be able to identify
all patients that are potentially at risk (i.e. high negative predictive value) than to be able to
selectively identify only those patients that will indeed develop the event, certainly if the
event is harmful. Analysing the diagnostic performance of the EWS at different cut-off
levels, the cut-off of 3 points seems to be optimal. If the cut-off level is increased, the
9
specificity of the EWS is also increased, but sensitivity is lacking (54 per cent at a cut-off of
4 points).
At this time, the EWS is being used in our university medical centre in different
surgical wards. If a patient scores above the predetermined cut-off value of EWS ≥ 3 at a
certain time, the attending physician is warned by the nursing staff in order to evaluate the
patient’s condition and to establish a treatment plan if needed. When the patient does not
respond on this implemented treatment the ICU physician is asked to evaluate the patient’s
condition at an early stage. Whether this strategy will lower the percentage of adverse events
will be the subject of a later study. A previous randomized clinical trial did not show a
significant reduction in cardiac arrest rates after the introduction of a medical emergency
team, but this was possibly because of its underpowered sample size8. A recent study
analysing the effectiveness of implementation of a medical emergency team showed a
decreased cardiac arrest rate and in-hospital death rate after implementation but did not report
on other outcome parameters such as ICU admission or emergency surgery16.
The present study has some limitations. First, the physician making the decision about
what intervention to use was not blinded to the EWS score. Second, the nurse making
decisions about the outcome was also not blinded to the EWS score. This could have caused a
bias, since both the decision to intervene and the decision of whether the composite endpoint
was reached could have been influenced by the EWS score value. On the other hand, we do
not believe that this would have introduced major bias; the interventions that were registered
were not likely to be triggered by the EWS score alone, and the endpoints used were rather
hard and not open for interpretation. Further research should focus on more precise risk
stratification of patients and on cost-effectiveness analyses of this strategy. Furthermore,
research on potential survival benefit due to early recognition of clinical deterioration and
10
subsequent early intervention should be performed. The extended EWS is now used in
routine clinical care in our hospital.
Disclosure
The authors declare no conflict of interest, and no funding was obtained for the study.
References
1 Goldhill DR, White SA, Sumner A. Physiological values and procedures in the 24 h
before ICU admission from the ward. Anaesthesia 1999; 54: 529–534.
2 McGloin H, Adam SK, Singer, M. Unexpected deaths and referrals to intensive care of
patients on general wards. Are some cases potentially avoidable? J R Coll Physicians
Lond 1999; 33: 255–259.
3 Smith AF, Wood J. Can some in-hospital cardio-respiratory arrests be prevented? A
prospective survey. Resuscitation 1998; 37: 133–137.
4 Franklin C, Mathew J. Developing strategies to prevent inhospital cardiac arrest:
analyzing responses of physicians and nurses in the hours before the event. Crit Care
Med 1994; 22: 244–247.
5 Kause J, Smith G, Prytherch D, Parr M, Flabouris A, Hillman K et al. A comparison of
antecedents to cardiac arrests, deaths and emergency intensive care admissions in
Australia and New Zealand, and in the United Kingdom – the ACADEMIA study.
Resuscitation 2004; 62: 275–282.
6 Schein RM, Hazday N, Pena M, Ruben BH, Sprung CL. Clinical antecedents to in-
hospital cardiopulmonary arrest. Chest 1990; 98: 1388–1392.
7 Prado R, Albert RK, Mehler PS, Chu ES. Rapid response: a quality improvement
conundrum. J Hosp Med 2009; 4: 255–257.

11
8 Hillman K, Chen J, Cretikos M, Bellomo R, Brown D, Doig S et al. Introduction of the
medical emergency team (MET) system: a cluster-randomised controlled trial. Lancet
2005; 365: 2091–2097.
9 Smith GB, Osgood VM, Crane S. ALERT – a multiprofessional training course in the
critical care of the acutely ill adult patient. Resuscitation 2002; 52: 281–286.
10 Gao H, McDonnell A, Harrison DA, Moore T, Adam S, Daly K et al. Systematic
review and evaluation of physiological track and trigger warning systems for
identifying at-risk patients on the ward. Intensive Care Med 2007; 33: 667–679.
11 Moldenhauer K, Sabel A, Chu ES, Mehler PS. Clinical triggers: an alternative to a
rapid response team. Jt Comm J Qual Patient Saf 2009: 35: 164–74
12 McGaughey J, Alderdice F, Fowler R, Kapila A, Mayhew A, Moutray M. Outreach and
Early Warning Systems (EWS) for the prevention of intensive care admission and death
of critically ill adult patients on general hospital wards. Cochrane Database Syst Rev
2007; (3)CD005529.
13 Aneman A, Parr M. Medical emergency teams: a role for expanding intensive care?
Acta Anaesthesiol Scand 2006; 50: 1255–1265.
14 VMS zorg (in Dutch). http://www.vmszorg.nl/10-Themas/Vitaal-bedreigde-patient (20
September 2011).
15 Subbe CP, Kruger M, Rutherford P, Gemmel L. Validation of a modified early warning
score in medical admissions. QJM 2001; 94: 521–526.
16 Konrad D, Jäderling G, Bell M, Granath F, Ekbom A, Martling CR. Reducing in-
hospital cardiac arrests and hospital mortality by introducing a medical emergency
team. Intensive Care Med 2010; 36: 100–106.
12
Table 1 Baseline characteristics of the study population
Baseline characteristic All (N = 572) Age, year 50(20) Male gender 359 (63%) ASA classification ASA 1 329 (58%) ASA 2 134 (23%) ASA 3 102 (18%) ASA 4 7 (1%) Glasgow Coma Scale GCS 15 560 (98%) GCS 14 10 (2%) GCS <14 1 (0.2%) Hospitalization, days 4 (1–4) Admission indication Thoracic trauma 32 (6%) Abdominal trauma 17 (3%) Extremity trauma 208 (36%) Polytrauma 47 (8%) Elective abdominal surgery 147 (26%) Spine or pelvic injury 7 (1%) Other* 112 (20%) Temperature, °C 37·4(0·82) Transcutaneous oxygen saturation, % 97(5) Systolic blood pressure, mmHg 128(23) Diastolic blood pressure, mmHg 72(13) Heart rate, beats per min 84(18) Respiration rate, breaths per min 17(5) Urine output, ml/24 h 1688(965) Haemoglobin, mmol/l 7·6(1·5) White blood cell count, cells × 109/l 10·3 (8·0–13·1) C-reactive protein, mg/l 24·5 (2–103)
Data are presented as mean(s.d.), median (interquartile range) or total number (%).*Consisted
mainly of acute abdominal surgery (e.g. cholecystectomy, appendectomy), abdominal wall
hernias and cicatricial hernias. ASA, American Society of Anesthesiologists; bpm, beats per
minute.

13
Table 2 Two-by-two table for patients reaching the endpoint and for patients not reaching the
composite endpoint, dichotomized for EWS < 3 versus EWS ≥ 3
Endpoint No endpoint Total
EWS ≥ 3 34 95 129
EWS < 3 12 431 443
Total 46 526 572
EWS, early warning score.
Table 3 Sensitivity, specificity, positive predictive value and negative predictive value at
different cut-off points of the EWS
Cut-off
value
Sensitivity (%) Specificity (%) Positive predictive
value (%)
Negative predictive
value (%)
EWS ≥ 1 96 (84, 99) 24 (21, 28) 10 (7, 13) 98 (94, 99)
EWS ≥ 2 91 (78, 97) 57 (53, 62) 16 (12, 21) 99 (96, 99)
EWS ≥ 3 74 (59, 85) 82 (78, 85) 26 (19, 35) 97 (95, 99)
EWS ≥ 4 54 (39, 69) 94 (91, 95) 42 (30, 56) 96 (94, 97)
EWS ≥ 5 50 (35, 65) 99 (97, 99) 77 (57, 89) 96 (94, 97)
Data are presented as point estimate (corresponding 95% confidence interval). EWS, early
warning score.
14
FIGURE LEGENDS
Fig. 1. The expanded early warning score flowchart.
15
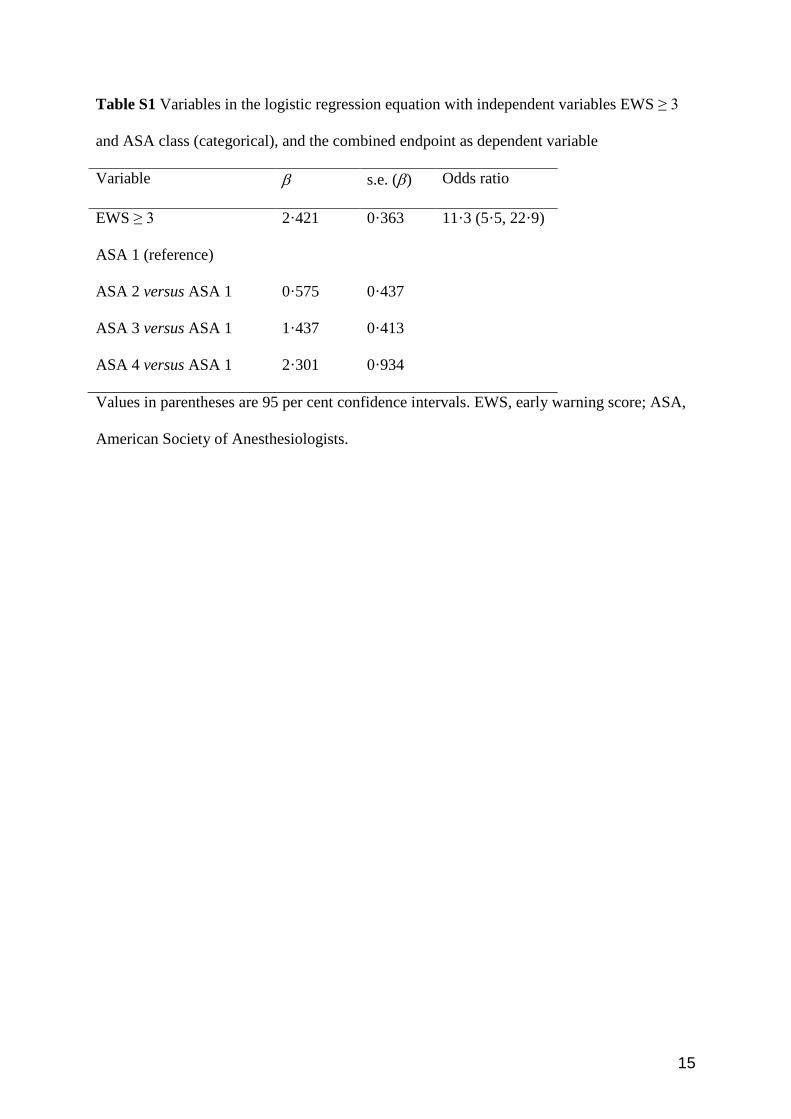
Table S1 Variables in the logistic regression equation with independent variables EWS ≥ 3
and ASA class (categorical), and the combined endpoint as dependent variable
Variable β s.e. (β) Odds ratio
EWS ≥ 3 2·421 0·363 11·3 (5·5, 22·9)
ASA 1 (reference)
ASA 2 versus ASA 1 0·575 0·437
ASA 3 versus ASA 1 1·437 0·413
ASA 4 versus ASA 1 2·301 0·934
Values in parentheses are 95 per cent confidence intervals. EWS, early warning score; ASA,
American Society of Anesthesiologists.