Accuracy in Web Analytics Reporting on Digital Libraries Patrick OBrien, Montana State University...
40
Accuracy in Web Analytics Reporting on Digital Libraries Patrick OBrien, Montana State University Ricky Erway, OCLC Research Martha Kyrillidou, Association of Research Libraries Kenning Arlitsch, Montana State University CNI Membership Meeting, Washington D.C. December 9, 2013
-
Upload
margaret-sullivan -
Category
Documents
-
view
214 -
download
2
Transcript of Accuracy in Web Analytics Reporting on Digital Libraries Patrick OBrien, Montana State University...

Accuracy in Web Analytics Reporting on Digital Libraries
Patrick OBrien, Montana State University
Ricky Erway, OCLC Research
Martha Kyrillidou, Association of Research Libraries
Kenning Arlitsch, Montana State University
CNI Membership Meeting, Washington D.C.December 9, 2013

Web analytics
Tracking, compiling, and analyzing statistics about use of a website

Libraries as socially acceptable alternative
Source: http://is.gd/ejTqRv

Considerations
Privacy Usage of non-html Web assets Blinded by big numbers Spiders, robots, proxy servers, caching Apples to oranges Quantitative vs. qualitative
Why
First the big question Study use of library web properties Site redesign planning Assess changes to the user interface Staff deployment Support budget needs, ROI User satisfaction Reporting to parent institution, ARL, NCES …

What
What are users searching for? Which features are used? Where do our users come from? Which documents are downloaded? How long do users stay on our site? What are their navigation paths? How do we compare over time? How do we compare to others?
How
Hits Page views Time on page Visitors (Unique? New?) Visits Return visits Bounce rate

Tools
Web Analytics Google Analytics Adobe Analytics, IBM Digital Analytics, WebTrends … Piwik, AWStats… (open source)
Heatmaps • CrazyEgg• ClickTale, Clickdensity

www.arl.org
ARL perspectives on accuracy in web analytics reporting on digital libraries

The need for assessment
Underlying need to demonstrate our worth The reallocation of resources from traditional
services and functions Rapid shifts in information-seeking behavior Increasing user demands
www.arl.org
Association of Research Libraries
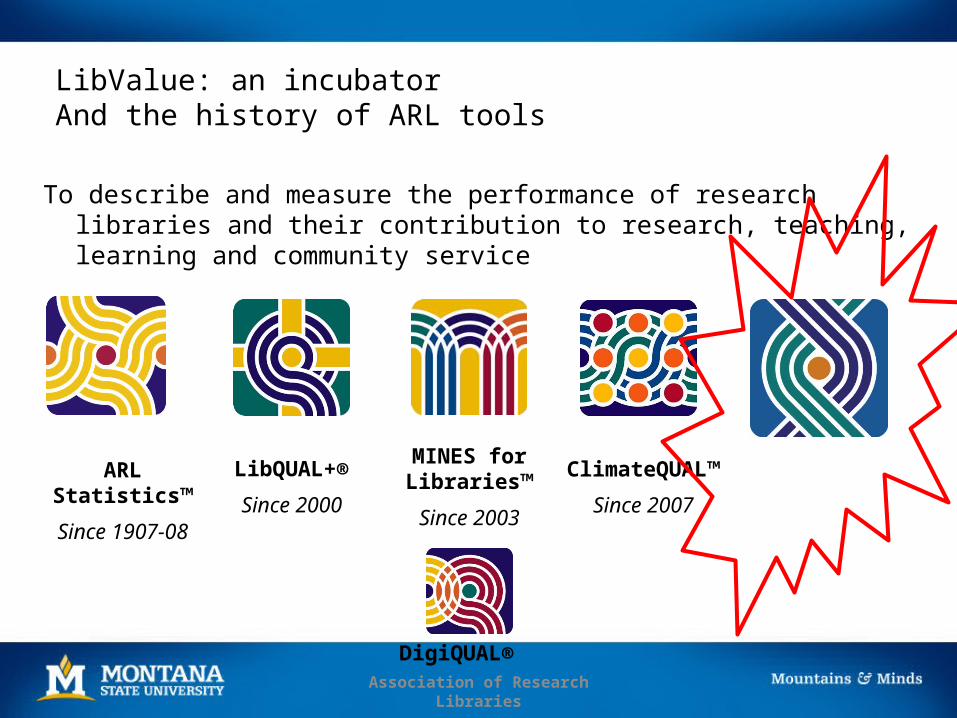
LibValue: an incubator And the history of ARL tools
To describe and measure the performance of research libraries and their contribution to research, teaching, learning and community service
ARL Statistics™
Since 1907-08
LibQUAL+®
Since 2000
MINES for Libraries™
Since 2003
DigiQUAL®
ClimateQUAL™
Since 2007

Association of Research Libraries
ARL Statistics and web analytics
E-metrics dating back in 2001 Founding member of COUNTER Testing data elements with mixed success
Downloads, searches, and federated searches
Latest Challenge: searches from ‘discovery’ systems

… gripes … from coll-assess
“unfortunately, because of the way Discovery systems work, they never interact directly with the source database or platform. Instead, all searches are conducted entirely within the Discovery system’s platform. Thus, there is no search to record at the source database end. So, it is not reported in the DB1 reports as Federated Searches/Sessions. This is a biiiiiiig problem for us”
“clients need to complain about the lack of good stats available to us and to demand something better …. I know of some institutions that have implemented Google Analytics tracking for <discovery system> so that they can collect information about the content that users click on from within the <> index. We really shouldn't have to be doing this
www.arl.org

The Printed Library Materials I Need for My Work
www.libqual.org

Print and/or Electronic Journal Collections I Require for My Work
www.libqual.org

A Library Website Enabling Me to Locate Information on My Own
www.libqual.org

MINES for Libraries – Scholars Portal @ OCUL
9th Northumbria Conference, 23rd August 201117
In the Library
Off-campus
On-campus but not in the library
In the Library Off-campus On-campus but not in the library
LibValue
Special Collections – Google Analytics application
LibValue: Digitized Special Collections (video on YouTube)Thursday, August 15, 2013, 1:00–2:00 p.m. eastern
Presenters: Gayle Baker, Professor and Electronic Resources Coordinator, University of Tennessee Libraries Ken Wise, Associate Professor, University of Tennessee Libraries
www.arl.org

2010: began looking for metrics on digital collection accessibility and use at Utah 12+ Billion
Number of search queries submitted to Google each month by Americans*
12% Percentage of University of Utah digital collection content
indexed by Google 0.5%
Percentage of scholarly papers in Utah’s open access IR accessible to researchers via Google Scholar
* http://www.comscore.com/Press_Events/Press_Releases/2012/1/comScore_Releases_December_2011_U.S._Search_Engine_Rankings

Basic SEO has improved collection accessibility in Google across the board…
Average
0% 25% 50% 75% 100%
92%
79%
51%
12%
07/05/10 04/04/11 11/30/11 12/05/13
Google Index Ratio - All Collections*
• Google Index Ratio = URLs submitted / URLs Indexed by Google• ~150 collections containing ~170,00 URLs (07/2010) and ~170 collections containing ~282,000 URLs (12/2013)
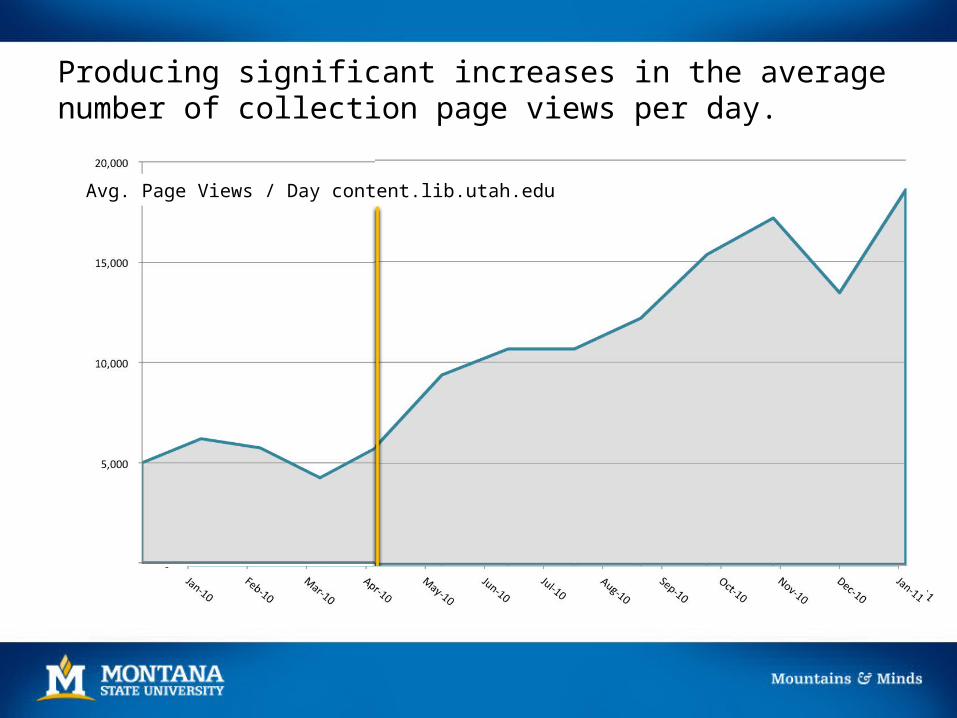
Producing significant increases in the average number of collection page views per day.
Avg. Page Views / Day content.lib.utah.edu

…resulting in more referrals and visitors
12 week comparison 2010 vs. 2012

Themes discovered
Traditional SEO is an afterthought Librarians think too small about potential traffic Organizational communication is poor Data in repositories are often messy Analytics are usually poorly implemented Vendors are slow to catch on to SEO problems Software tools don’t exist to implement semantic
web SEO

Recommended SEO Process
1. Institutionalize SEO Accurate Measurement Tools Strategic Plan
2. Traditional SEO Get Indexed = Index Ratio Get Visible = Search Engine Results Page (SERP)
3. Semantic SEO Get Relevant = Click Through Ratios (CTR)
• Metadata• Linked Open Data (LOD)• Schema.org

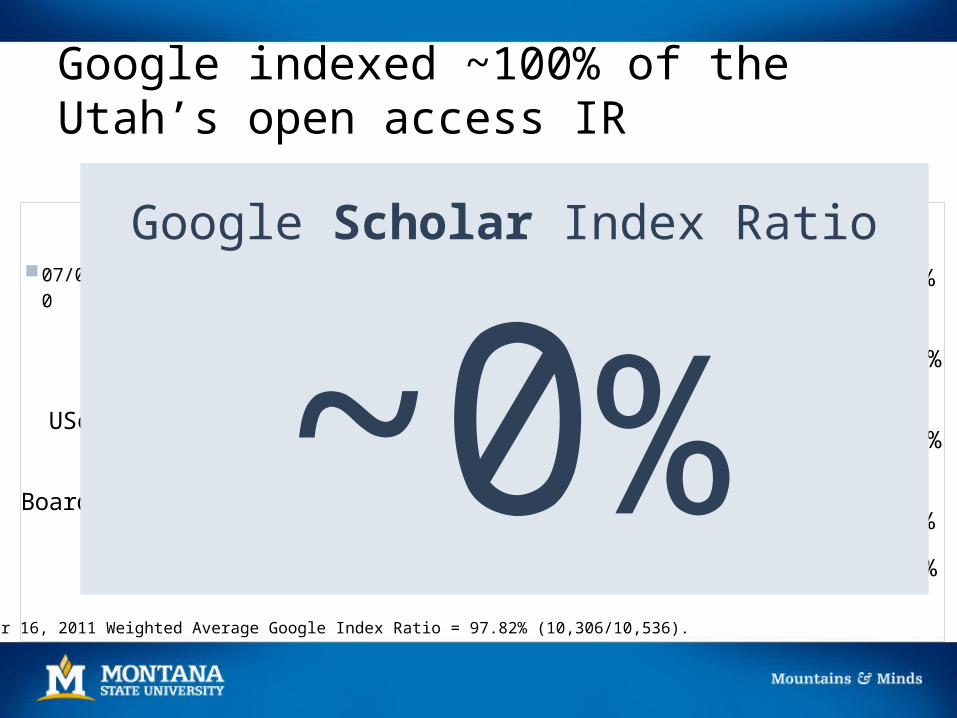
Google indexed ~100% of the Utah’s open access IR
Google Index Ratio
Board of Regents
UScholar Works
ETD 2
ETD 1
0% 25% 50% 75% 100%
97%
98%
98%
97%
47%
51%
68%
69%
4%
23%
0%
12%07/05/10
11/19/10
10/16/11 Weighted Average =
97.8%
*October 16, 2011 Weighted Average Google Index Ratio = 97.82% (10,306/10,536).
Google Scholar Index Ratio
~0%
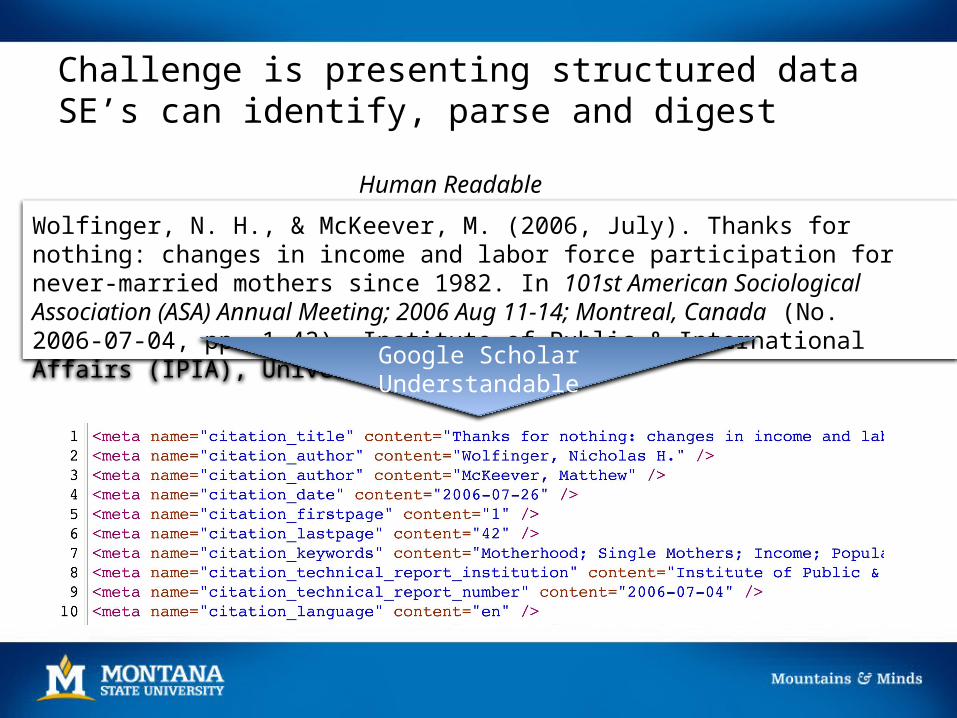
Challenge is presenting structured data SE’s can identify, parse and digest
Wolfinger, N. H., & McKeever, M. (2006, July). Thanks for nothing: changes in income and labor force participation for never-married mothers since 1982. In 101st American Sociological Association (ASA) Annual Meeting; 2006 Aug 11-14; Montreal, Canada (No. 2006-07-04, pp. 1-42). Institute of Public & International Affairs (IPIA), University of Utah.
Human Readable
Google ScholarUnderstandable

Google Scholar (GS) Structured Data
Less than 1% of University of Utah’s 8,000+ scholarly papers in GS index
Conducted 3 pilot test n=19; GS Index Ratio = 0% n=19; GS Index Ratio = 62% n=56; GS Index Ratio = 90%
Metadata cleanup of 3 IR collections July 2012

Utah’s open access IR items indexed by Google Scholar ~0 items to ~4,250 items
Google Scholar Index Ratio
ETD 1
ETD 2
ETD3
UScholar Works
0% 25% 50% 75% 100%
84%
80%
70%
16% 12/05/13GS Visitor or Page View Increase
~0%

Discovered most analytics have potential accuracy issues for digital collections
Log Files Over count visits & downloads
due to spiders, etc.
Under count page views due to web caching – up to 30% IR
Log File Analyzers

Analytics Services do not track non-HTML downloads out of the box
Non-HTML
Page Tagging{JavaScript}
Analytics Service
Analytics Services Under count non-HTML (e.g.,
PDF) file downloads
HTML
IRDownloadSpecial
Config
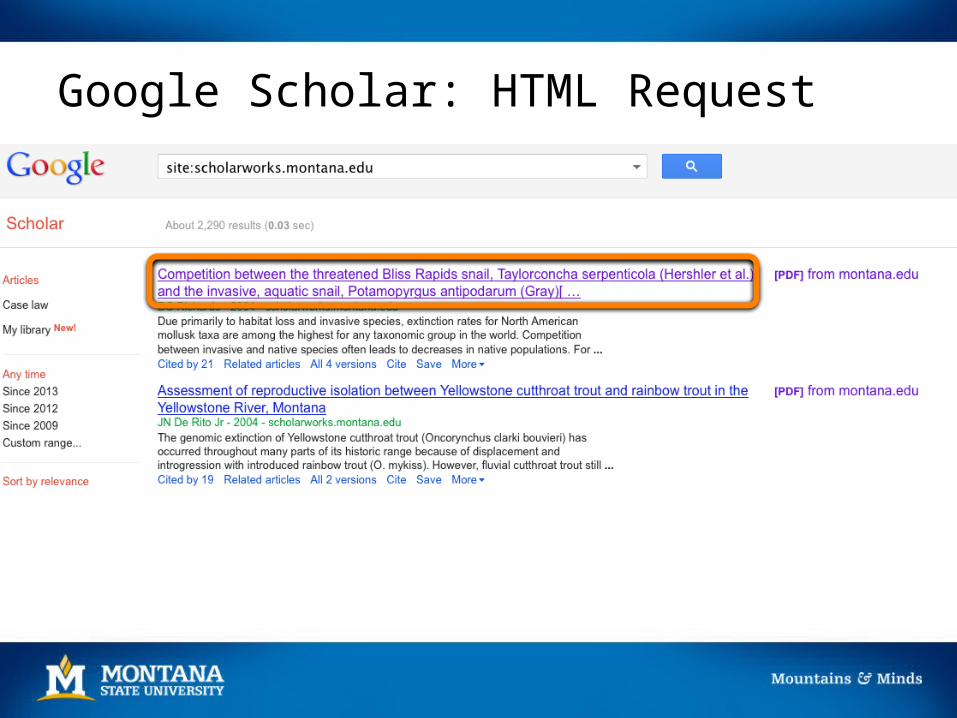
Google Scholar: HTML Request
Text

Title

Analytics Services do not track non-HTML file downloads via direct external links
Non-HTML
HTMLAnalytics Service
Page Tagging{JavaScript}
IR

Google Scholar: PDF Request
Text


Univ of Utah open access IR items indexed by Google Scholar ~0 items to ~4,250 items
Google Scholar Index Ratio
ETD 1
ETD 2
ETD3
UScholar Works
0% 25% 50% 75% 100%
84%
80%
70%
16% 12/05/13

A large number Google Scholar users appear to be undercounted via Analytics services. 125
Minimum number of Google Scholar visitors invisible to Utah’s open access IR
~200 Minimum number of PDF downloads by Google Scholar
visitors invisible to the Utah’s open access IR 5
Number of days analyzed

Montana State – ARL - OCLC partnership
Gather more data• Requires additional data sets• Call for participation
Develop solutions• Discuss policy implications• Training• Configurations

Thank You - Questions?
Patrick OBrien – [email protected] Ricky Erway – [email protected] Martha Kyrillikou – [email protected] Kenning Arlitsch – [email protected]