Accumulation mode aerosol, pockets of open cells, and...
15
Accumulation mode aerosol, pockets of open cells, and particle nucleation in the remote subtropical Pacific marine boundary layer Markus D. Petters, 1,2 Jefferson R. Snider, 1 Bjorn Stevens, 3 Gabor Vali, 1 Ian Faloona, 4 and Lynn M. Russell 5 Received 13 December 2004; revised 22 June 2005; accepted 22 July 2005; published 25 January 2006. [1] We analyze a marine boundary layer cloud field encountered during the second research flight of the second Dynamics and Chemistry of Marine Stratocumulus Experiment. The cloud field is distinguished by the presence of pockets of open cells. Differences between the pockets and the surrounding stratocumulus clouds are studied utilizing in situ and satellite data. The pockets are characterized as regions where cloud radar echo tops are unusually variable, accumulation mode aerosol concentrations are low, and Aitken mode particles with a mode diameter at 0.02 mm dominate aerosol number concentration. The Aitken mode particles are thought to be generated by a nucleation event which occurred within the marine boundary layer. The low accumulation mode concentrations associated with the pockets are proposed to be necessary for their maintenance. Citation: Petters, M. D., J. R. Snider, B. Stevens, G. Vali, I. Faloona, and L. Russell (2006), Accumulation mode aerosol, pockets of open cells, and particle nucleation in the remote subtropical Pacific marine boundary layer, J. Geophys. Res., 111, D02206, doi:10.1029/2004JD005694. 1. Introduction [2] Cloud condensation nuclei (CCN) play a critical role in the formation [Hegg, 1999], lifetime [Albrecht, 1989], and dissipation [Ackerman et al., 1993] of marine stratocu- mulus clouds. All of these studies focus on connections between CCN, the generation of drizzle, and CCN scav- enging. An important effect of drizzle is the reduction of height-integrated cloud liquid water content (LWC), com- monly known as the cloud liquid water path (LWP). Where the LWP is reduced, the cloud infrared (IR) radiative cool- ing rate is decreased [Stephens, 1978; Nicholls, 1984] and the cloud topped marine boundary layer (MBL) may tran- sition to a sea fog [Ackerman et al., 1993]. Stevens et al. [1998] show in their simulation of drizzling and nondriz- zling stratocumulus that drizzle stabilizes the boundary layer via its action on the budgets of heat and water substance. A plausible consequence may be the transition from stratocumulus-like to cumulus-like MBL circulation forming in response to drizzle [Stevens et al., 1998]. The latter seems supported by observations of pockets of open cells which are persistent regions where open cell structure and heavy drizzle interrupt a more uniform stratocumulus cloud deck [Stevens et al., 2005]. These authors focus on the remotely sensed macrophysical characteristics of pock- ets of open cells. Utilizing data from the same measurement platforms, we extend their analysis, placing emphasis on cloud and aerosol properties and their relationship to the macrophysical characteristics of pockets of open cells. [3] Effects of CCN on cloud droplet number concentra- tion (CDNC), cloud droplet effective radius (r e ), and albedo are well documented [Houghton et al., 2001, and references therein]. Equally well studied are aerosol source processes over the open oceans. These are formation via homoge- neous nucleation of supersaturated vapor [Charlson et al., 1987; O’Dowd et al., 2002], henceforth particle nucleation, particle injection via the bubble burst process [Blanchard and Woodcock, 1980; O’Dowd and Smith, 1993; Nilsson et al., 2001], and transport. Particle nucleation events have been documented in the tropical MBL [Clarke et al., 1998b], close to shore [Covert et al., 1992; Hoppel et al., 1994; O’Dowd et al., 2002], and at polar latitudes [O’Dowd et al., 1997]. From these observations, as well as modeling studies of particle nucleation, it is recognized that particle nucleation rates are sensitive to the abundance of sea salt aerosol. The latter provide particle surface area onto which vapors may condense, thus relegating particle nucleation to low wind (i.e., low sea salt) regimes [e.g., Pirjola et al., 2000]. Nevertheless, the case for particle nucleation in the remote MBL remains contentious, most notably because particles may also enter the MBL via transport from the free troposphere (FT) [Covert et al., 1996; Clarke et al., 1998b; Russell et al., 1998]. Overall, the relative contributions of transport, either vertically or horizontally, versus particle nucleation and the bubble burst processes remain unclear [Raes et al., 1997]. JOURNAL OF GEOPHYSICAL RESEARCH, VOL. 111, D02206, doi:10.1029/2004JD005694, 2006 1 Department of Atmospheric Science, University of Wyoming, Laramie, Wyoming, USA. 2 Now at Department of Atmospheric Science, Colorado State University, Fort Collins, Colorado, USA. 3 Department of Atmospheric Science, University of California, Los Angeles, California, USA. 4 Department of Land, Air and Water Resources, University of California, Davis, California, USA. 5 Scripps Institution of Oceanography, University of California, San Diego, California, USA. Copyright 2006 by the American Geophysical Union. 0148-0227/06/2004JD005694$09.00 D02206 1 of 15
-
Upload
phunghuong -
Category
Documents
-
view
213 -
download
0
Transcript of Accumulation mode aerosol, pockets of open cells, and...
Accumulation mode aerosol, pockets of open cells, and particle
nucleation in the remote subtropical Pacific marine boundary layer
Markus D. Petters,1,2 Jefferson R. Snider,1 Bjorn Stevens,3 Gabor Vali,1 Ian Faloona,4
and Lynn M. Russell5
Received 13 December 2004; revised 22 June 2005; accepted 22 July 2005; published 25 January 2006.
[1] We analyze a marine boundary layer cloud field encountered during the secondresearch flight of the second Dynamics and Chemistry of Marine StratocumulusExperiment. The cloud field is distinguished by the presence of pockets of open cells.Differences between the pockets and the surrounding stratocumulus clouds are studiedutilizing in situ and satellite data. The pockets are characterized as regions where cloudradar echo tops are unusually variable, accumulation mode aerosol concentrations are low,and Aitken mode particles with a mode diameter at 0.02 mm dominate aerosol numberconcentration. The Aitken mode particles are thought to be generated by a nucleationevent which occurred within the marine boundary layer. The low accumulation modeconcentrations associated with the pockets are proposed to be necessary for theirmaintenance.
Citation: Petters, M. D., J. R. Snider, B. Stevens, G. Vali, I. Faloona, and L. Russell (2006), Accumulation mode aerosol, pockets of
open cells, and particle nucleation in the remote subtropical Pacific marine boundary layer, J. Geophys. Res., 111, D02206,
doi:10.1029/2004JD005694.
1. Introduction
[2] Cloud condensation nuclei (CCN) play a critical rolein the formation [Hegg, 1999], lifetime [Albrecht, 1989],and dissipation [Ackerman et al., 1993] of marine stratocu-mulus clouds. All of these studies focus on connectionsbetween CCN, the generation of drizzle, and CCN scav-enging. An important effect of drizzle is the reduction ofheight-integrated cloud liquid water content (LWC), com-monly known as the cloud liquid water path (LWP). Wherethe LWP is reduced, the cloud infrared (IR) radiative cool-ing rate is decreased [Stephens, 1978; Nicholls, 1984] andthe cloud topped marine boundary layer (MBL) may tran-sition to a sea fog [Ackerman et al., 1993]. Stevens et al.[1998] show in their simulation of drizzling and nondriz-zling stratocumulus that drizzle stabilizes the boundarylayer via its action on the budgets of heat and watersubstance. A plausible consequence may be the transitionfrom stratocumulus-like to cumulus-like MBL circulationforming in response to drizzle [Stevens et al., 1998]. Thelatter seems supported by observations of pockets of opencells which are persistent regions where open cell structure
and heavy drizzle interrupt a more uniform stratocumuluscloud deck [Stevens et al., 2005]. These authors focus onthe remotely sensed macrophysical characteristics of pock-ets of open cells. Utilizing data from the same measurementplatforms, we extend their analysis, placing emphasis oncloud and aerosol properties and their relationship to themacrophysical characteristics of pockets of open cells.[3] Effects of CCN on cloud droplet number concentra-
tion (CDNC), cloud droplet effective radius (re), and albedoare well documented [Houghton et al., 2001, and referencestherein]. Equally well studied are aerosol source processesover the open oceans. These are formation via homoge-neous nucleation of supersaturated vapor [Charlson et al.,1987; O’Dowd et al., 2002], henceforth particle nucleation,particle injection via the bubble burst process [Blanchardand Woodcock, 1980; O’Dowd and Smith, 1993; Nilsson etal., 2001], and transport. Particle nucleation events havebeen documented in the tropical MBL [Clarke et al.,1998b], close to shore [Covert et al., 1992; Hoppel et al.,1994; O’Dowd et al., 2002], and at polar latitudes [O’Dowdet al., 1997]. From these observations, as well as modelingstudies of particle nucleation, it is recognized that particlenucleation rates are sensitive to the abundance of sea saltaerosol. The latter provide particle surface area onto whichvapors may condense, thus relegating particle nucleation tolow wind (i.e., low sea salt) regimes [e.g., Pirjola et al.,2000]. Nevertheless, the case for particle nucleation in theremote MBL remains contentious, most notably becauseparticles may also enter the MBL via transport from the freetroposphere (FT) [Covert et al., 1996; Clarke et al., 1998b;Russell et al., 1998]. Overall, the relative contributions oftransport, either vertically or horizontally, versus particlenucleation and the bubble burst processes remain unclear[Raes et al., 1997].
JOURNAL OF GEOPHYSICAL RESEARCH, VOL. 111, D02206, doi:10.1029/2004JD005694, 2006
1Department of Atmospheric Science, University of Wyoming,Laramie, Wyoming, USA.
2Now at Department of Atmospheric Science, Colorado StateUniversity, Fort Collins, Colorado, USA.
3Department of Atmospheric Science, University of California, LosAngeles, California, USA.
4Department of Land, Air and Water Resources, University ofCalifornia, Davis, California, USA.
5Scripps Institution of Oceanography, University of California, SanDiego, California, USA.
Copyright 2006 by the American Geophysical Union.0148-0227/06/2004JD005694$09.00
D02206 1 of 15

[4] In this study, we analyze satellite and in situ data fromthe second flight (flight 2, 11 July 2001) of the secondDynamics and Chemistry of Marine Stratocumulus(DYCOMS-II) experiment as a case study. In a companionstudy, van Zanten and Stevens [2005] examined the struc-ture of drizzle within the pockets. Our emphasis is onlinkages between the pockets, low accumulation modeaerosol concentration (mode diameter �0.2 mm), and Aitkenmode aerosol (mode diameter �0.02 mm). We also presentevidence that the latter likely originated via particle nucle-ation within the MBL. We propose mechanisms involvinglow accumulation mode concentrations as an importantfactor in the maintenance of pockets of open cells.
2. Instrumentation and Methods
2.1. DYCOMS-II
[5] The DYCOMS-II field campaign [Stevens et al.,2003a] took place in July 2001, and focused on thecharacterization of the nocturnal cloudy MBL at a distanceof �350 km west of the southern California coastline(�32�N, 122�W). Prior studies of this stratocumulus regimewere made during daytime [Albrecht et al., 1988; Lenschowet al., 1988]. The DYCOMS-II field program utilized theNSF/NCAR C-130 aircraft operated by the National Sci-ence Foundation and the National Center for AtmosphericResearch, Boulder, CO. Seven flights employed a steppedcircular flight pattern conducted both in the MBL and FT;flight 2 (11 July 2001) is the focus of this analysis. Figure 1shows that the flight was divided into constant altitudesegments of duration of 30 or 60 min. The pattern consistedof groups of one (30 min) or two (60 min) 60 km diameter
circles flown above cloud, in cloud, and below cloud.Numbers indicate the label of the circle referred to in thetext, e.g., in-cloud #1. Circles were flown in the clockwisedirection and then in the counterclockwise direction. Ferrytime to the study domain was �35 min and the researchportion of the flights (�6 hours) was a quasi-Lagrangianstudy focused on the MBL. This was achieved by allowingthe aircraft to drift with the mean wind. During flight 2, theobserved circle centerpoints lagged with respect to wind-advected positions.[6] Average cloud depth during flight 2 was 360 m and
was typical for the clouds observed during the project[Stevens et al., 2003a]. Marine boundary layer CCN con-centrations active at 0.44% water supersaturation were thelowest observed during the campaign (81 ± 28 cm�3
[Petters, 2004]). The circle-averaged drizzle flux at cloudbase was unusually large (1.2 mm d�1 [van Zanten et al.,2005]) and drizzle fluxes were strongest inside the pocketsof open cells [Stevens et al., 2005].
2.2. Instrumentation
[7] The C-130 was fitted with the aerosol and cloudmicrophysics probes summarized in Table 1. We refer tothese instruments via the abbreviations given in parenthesesadjacent to the formal probe names. The first three tableentries (CCN, CN and RDMA) are aerosol instrumentsoperated inside the fuselage of the C-130. The CN instru-ment [Twohy, 1991] sampled from a reverse-facing inlet andthe CCN and RDMA sampled via a solid diffuser inlet. Thelast four entries of Table 1 refer to cloud microphysicsprobes mounted external to the fuselage, below the wings.We also utilize LWC and re from a PVM-100 cloud waterprobe [Gerber et al., 1994], vertical velocity (w) from a gustprobe system, downwelling IR irradiance (FIR#) from apyrgeometer, upwelling IR radiance expressed as radiativetemperature (T") from a radiometer, reflectivity data fromthe Wyoming Cloud Radar [Pazmany et al., 1994; Vali etal., 1998], and satellite measured upwelling IR radiance at11 mm expressed as brightness temperature (Tb11). Addi-tional information on instrumentation and data processingare given in Appendix A and a complete description ofthese instruments is presented by Stevens et al. [2003b].Symbols and acronyms are defined in the notation section.
2.3. Azimuthal Grid
[8] Typically, in situ data obtained from research aircraftare presented as time series. Because of the quasi-Lagrang-ian circular flight pattern employed during DYCOMS-II, anangular coordinate is more natural to use and allows spatialvariability to be clearly seen. For this reason, we present theC-130 data versus azimuthal angle (F) with F = 0�indicating the most northern point on the C-130 circle.Larger values of F progress clockwise from that referencepoint. With the exception of C-130 data from the below-cloud #3 circle and the in-cloud #5 circle, where we plot1 Hz data, the in situ data are shown as one degree (�5 s)averages.
2.4. Aerosol and CCN
[9] In the measurement community, CCN are defined asparticles that activate to form cloud droplets when subjectedto a fixed, or systematically varying, water supersaturation
Figure 1. Height-time of the research portion of flight 2.This pattern was typical for the DYCOMS-II entrainmentflights. Numbers indicate the label of the circle referred to inthe text. Average cloud top and cloud base altitudes are alsoshown. Note the break in scale for the second above-cloudsegment, flown at 2500 msl. The abbreviation ‘‘msl’’denotes meters above sea level.
D02206 PETTERS ET AL.: AEROSOL AND POCS DURING DYCOMS-II
2 of 15
D02206

within a droplet growth chamber. Since values of the clouddroplet number concentration predicted from CCN agreewith droplet concentrations measured in adiabatic regionsof marine stratocumulus [Yum et al., 1998; Snider andBrenguier, 2000] the utility of this CCN definition, as wellas CCN measurement, is obvious. Conversely, the predictionof CCN from measured aerosol size spectra, which is astandard technique in the cloud modeling community, iscomplicated by our limited understanding of the chemicalcomposition and mixing state of the aerosol [Covert et al.,1998; Chuang et al., 2000; Zhou et al., 2001; Cantrell et al.,2001; Snider et al., 2003]. In spite of the discrepanciesdiscussed in these references we will utilize particle concen-trations, measured by the PCASP, as a surrogate for 1 HzCCN measurements. Further we will equate the PCASP-measured concentration with the accumulation mode con-centration and refer to the latter as AMC. This is not strictlycorrect, since the accumulation modes observed duringDYCOMS-II often peaked near the minimum size detectedby the PCASP (0.1 mm, Table 1). Furthermore, the PCASPalso detects particles in a coarse mode centered at D �1 mmbut these do not contribute substantially to the numbercount reported by the PCASP. This particular application ofthe PCASP data set is motivated by our need for clouddroplet nuclei concentration measurements at a rate sub-stantially larger than that provided by the UWyo CCNinstrument (0.03 Hz).
2.5. Definition of the Disturbed, the Cloud-Free andthe Stratiform Regions
[10] Figure 2 shows the spatial distribution of brightnesstemperature at 11 mm (Tb11) at 0900 UTC. A region ofbroken cloudiness is apparent to the northwest of the C-130flight track and is delineated by the left open polygon.Apparent in the latter are pockets where open cell structuresinterrupt the more uniform stratocumulus cloud deck. Werefer to this as the ‘‘disturbed region.’’ An analysis of thetilde-shaped structure, henceforth ‘‘the pocket,’’ lying alongthe northern border of the disturbed region is given byStevens et al. [2005]. These authors demonstrate that it iscomposed of open cells which have an erect honeycombstructure composed of cloudy and precipitating ‘‘cell walls,’’surrounding an inner ‘‘cell core,’’ where depleted amounts ofcondensed water (i.e., droplets and drizzle) were observed.
[11] The region to the east of the C-130 flight track, alsodelineated with the right-hand open polygon and withmaximum Tb11 centered at 32�N, 121�W, shows enhancedvalues of Tb11 indicating reduced LWP corresponding toeither very thin cloud or clear sky. We will refer to thisregion as the ‘‘cloud-free region.’’ At first glance, the cloud-free region appears similar to the disturbed region. However,the temporal evolution of the disturbed and cloud-freeregions is very different. Figure 3 shows the advectedpositions of the two open polygons marking the disturbed
Table 1. Aerosol and Cloud Microphysics Instrumentation Operated on the C-130 Aircraft During
DYCOMS-IIa
Instrument Measurement Size Range, mm Channels
UWyo CCN (CCN) CCN 0.10% < sb < 0.99% N/ATSI 3760 CPCc (CNd) CN D > 0.016 N/ARDMAe aerosol size 0.01 < D < 0.13 62DMT SSP-200 (PCASPf, AMCg) aerosol size 0.1 < D < 3.0 29DMT SSP-100 (CDNCh) cloud droplets 1 < D < 47 40DMT SPP-2D-25 (2D-C) drizzle drops 17 < D < 1592 62Gerber PVM-100 (LWCi) LWC 3 < D < 47 N/A
aSizes are given in diameter. N/A denotes not applicable.bSupersaturation.cCondensation particle counter.dCondensation nuclei.eRadial differential mobility analyzer.fPassive cavity aerosol spectrometer probe.gAccumulation mode concentration.hCloud droplet number concentration.iLiquid water content.
Figure 2. Spatial distribution of Tb11 at the start of theresearch portion of flight 2. Time in the image indicatesthe time of the satellite data acquisition. The flight track ofthe 60 km circle most coincident with the satellite image isalso depicted (cf. Figure 1). Open polygons delineate thedisturbed and the stratiform region. See text for details.
D02206 PETTERS ET AL.: AEROSOL AND POCS DURING DYCOMS-II
3 of 15
D02206

and the cloud-free region. These boundaries are adjustedevery 30 min in accord with the wind speed and directionmeasured by the C-130 within the MBL. The flight track ofthe C-130 circle most coincident with the satellite imageis also depicted. It is evident that the disturbed region isadvecting into the C-130 study domain from the northwest.Furthermore, the time sequence shows that the thin cloudswithin the cloud-free region thickened to form a stratiformcloud layer. This thickening was completed at �1100 UTCand subsequent to that we refer to the region enclosed bythe right-hand polygon as the ‘‘stratiform region.’’ Con-versely, the disturbed region is persistent and shows littlechange in appearance throughout the night. No such asser-tion can be made about the persistence of individual cellscomposing the disturbed region because the spatial dimen-sion of the cells approaches the resolution of the satellitedata (4 � 4 km, Appendix A5). Between 0830 and1430 UTC the C-130 probed both the disturbed and thestratiform region below cloud, in cloud, and above cloud.Utilizing this data we analyze and discuss aerosol, cloud,and thermodynamic properties of the two regions.
3. Results
3.1. Radar Data
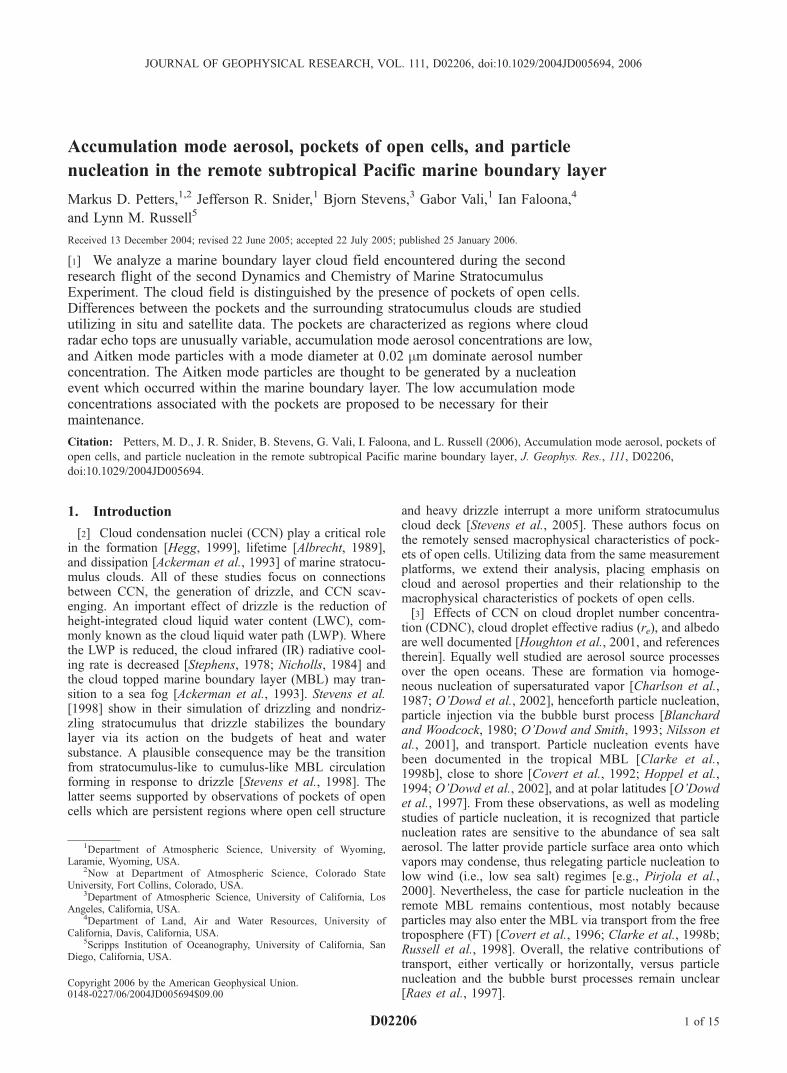
[12] Contrasts between the disturbed and the stratiformregions are evident in the radar reflectivity profile data
shown in Figure 4. Because of ambiguity arising from thefact that radar reflectivity varies with the 6th moment of thedrop size spectrum, echoes are best interpreted as eitherhydrometeors suspended in the updraft (cloud), or hydro-meteors with substantial velocities relative to the updraft(drizzle), or precipitation below cloud base.[13] In the northwest quadrant of the circle, strong echoes
reaching the surface are evident and interrupted by apronounced cell core where weaker echoes do not reachthe surface, and where echo tops are lower. No drizzle, andmore horizontally uniform radar echoes, are evident in thestratiform region to the southeast.
3.2. Disturbed Versus Stratiform Region
[14] In Figure 5 we juxtapose C-130 data from the below-cloud #1 (bottom five left-hand plots), in-cloud #3 (middlefour left-hand plots), and above-cloud #1 (top four left-handplots) circles with satellite-retrieved values of Tb11 (threeright-hand plots). The latter show Tb11 fields similar toFigure 3 but here the geographic domain is reduced by50%. Results are stacked according to flight level. To firstapproximation we assume that data acquired during differ-ent circles, and acquired at the same F, are verticallyaligned. This is not strictly correct, because the centers ofthe C-130 circles lagged behind the advected air mass(section 2.1). For this reason, we cannot resolve the verticalstructure of features at scales finer than DF �30� (�16 km).
Figure 3. Temporal evolution of Tb11 during flight 2. Satellite images are presented as in Figure 2 butwith the geographic domain reduced. The open polygons delineate the disturbed and the stratiform regionand are advected with the mean MBL wind. See text for details.
D02206 PETTERS ET AL.: AEROSOL AND POCS DURING DYCOMS-II
4 of 15
D02206
3.2.1. Below Cloud[15] During the below-cloud #1 circle, potential temper-
ature (q) is higher and water vapor mixing ratio (r) isslightly smaller in the stratiform region. These differencestranslate into a contrast of lifted condensation level (LCL)between the disturbed and the stratiform region. In thedisturbed region, and during the few times aerosol dataare not corrupted by liquid water shattering (Appendix A),condensation nuclei concentrations are enhanced and accu-mulation mode concentrations are reduced compared to thatin the stratiform region. A size-discriminated view of thesemicrophysical contrasts is presented in Figure 6. Figure 6(top) shows condensation nuclei and accumulation modeconcentrations (AMC, section 2.4) observed during thebelow-cloud #2 circle. Vertical solid and dashed linesindicate the start and end of the RDMA scan. Drizzle didnot affect either size spectrum. In the disturbed regionCN-to-AMC ratios are large compared to the stratiformregion and Aitken mode particles with D �0.02 mm domi-nate aerosol number (Figure 6, bottom, left plot). Apprecia-ble concentrations of Aitken mode particles are not evidentin the stratiform region (Figure 6, bottom, right plot).3.2.2. In Cloud[16] During the in-cloud #3 circle (Figure 5), the dis-
turbed region is distinguished by reduced cloud dropletnumber concentrations, larger values of re, and substantialconcentrations of particles detected by the 2D-C probe, asurrogate for drizzle. A positive correlation of accumulationmode concentration below cloud and cloud droplet numberconcentration measured at similar azimuth angle is alsoevident. No such correlation is observed between below-cloud CN and cloud droplet number concentration. Aerosoland cloud microphysical contrasts between the disturbedregion and the stratiform region are consistent with thesecond indirect effect of aerosols on clouds (i.e., fewercloud droplets and larger re coinciding with drizzle).3.2.3. Above Cloud[17] The four top left plots of Figure 5 contrast air
properties sampled above the disturbed and the stratiformregion. In the latter, the air is warmer and dryer, T"
(Appendix A5) is relatively steady, and radar echo topheights are relatively uniform. The uniform radar echo topheights in the stratiform region are in contrast with thatretrieved from the disturbed region (F �300�), wherereduced cloud top heights are evident in the radar echotop and T" time series. There is also evidence of locallyelevated echo tops in the disturbed region, compared toaverage values in the stratiform region.
3.3. Internal Structure
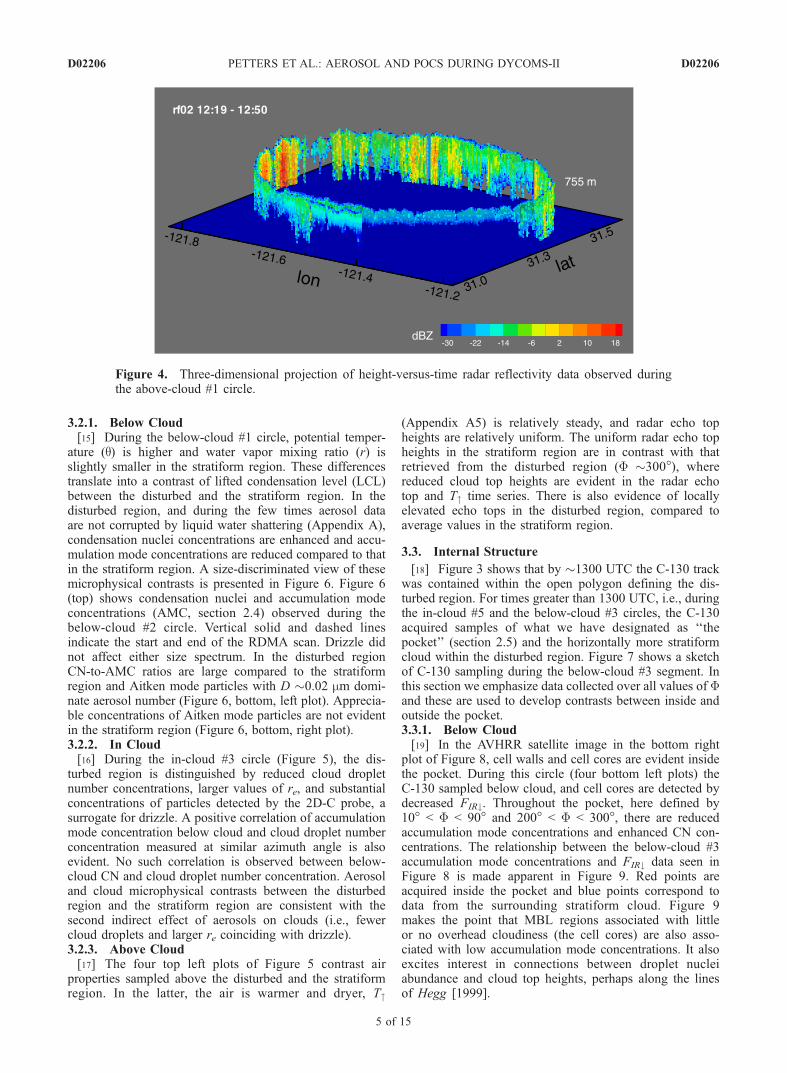
[18] Figure 3 shows that by �1300 UTC the C-130 trackwas contained within the open polygon defining the dis-turbed region. For times greater than 1300 UTC, i.e., duringthe in-cloud #5 and the below-cloud #3 circles, the C-130acquired samples of what we have designated as ‘‘thepocket’’ (section 2.5) and the horizontally more stratiformcloud within the disturbed region. Figure 7 shows a sketchof C-130 sampling during the below-cloud #3 segment. Inthis section we emphasize data collected over all values of Fand these are used to develop contrasts between inside andoutside the pocket.3.3.1. Below Cloud[19] In the AVHRR satellite image in the bottom right
plot of Figure 8, cell walls and cell cores are evident insidethe pocket. During this circle (four bottom left plots) theC-130 sampled below cloud, and cell cores are detected bydecreased FIR#. Throughout the pocket, here defined by10� < F < 90� and 200� < F < 300�, there are reducedaccumulation mode concentrations and enhanced CN con-centrations. The relationship between the below-cloud #3accumulation mode concentrations and FIR# data seen inFigure 8 is made apparent in Figure 9. Red points areacquired inside the pocket and blue points correspond todata from the surrounding stratiform cloud. Figure 9makes the point that MBL regions associated with littleor no overhead cloudiness (the cell cores) are also asso-ciated with low accumulation mode concentrations. It alsoexcites interest in connections between droplet nucleiabundance and cloud top heights, perhaps along the linesof Hegg [1999].
Figure 4. Three-dimensional projection of height-versus-time radar reflectivity data observed duringthe above-cloud #1 circle.
D02206 PETTERS ET AL.: AEROSOL AND POCS DURING DYCOMS-II
5 of 15
D02206

[20] In Figure 10 we contrast the power spectral density(Sw(f)) of the below-cloud #3 w time series inside (1338–1343 UTC; 250� < F < 300�; dotted line) and outside thepocket (1343–1348 UTC; 300� < F < 360�; solid line).These times were chosen because contiguous regions arenecessary to calculate Sw(f) and because equal sample sizeensures comparable statistical significance. We employ amethod of calculating and presenting Sw(f) which is areapreserving (Appendix A2). Values of length scales, shownon the top abscissa, are obtained from f and the C-130 speed
(108 m s�1), assuming stationary isotropic turbulence. If itis also assumed that the eddies are spatially and temporallycoherent, i.e., they do not dissipate within one eddy turn-over time, then the peak at f � 0.2 Hz indicates that eddiesof aspect ratio one dominate the turbulence field, particu-larly outside the pocket (solid line). Larger-scale eddies alsocontribute to the turbulence, evident in the peaks at lowerfrequency. Inside the pocket, the total w variance is reduced;that is, the area under the dotted curve is smaller relative tothat outside the pocket, and this reduction in most pro-
Figure 5. C-130 data corresponding to the disturbed and stratiform regions observed during the below-cloud (bottom five left-hand plots), in-cloud #3 circle (middle four left-hand plots), and above-cloud #1circle (top four left-hand plots). Satellite images are presented as in Figure 3 but with the geographicdomain reduced. The aircraft indicates the position of the C-130 at the time of the satellite image. Unitsare AMC (cm�3), CN (cm�3), q (�C), r (g kg�1), LCL (m), CDNC (cm�3), 2D-C (L�1), LWC (g m�3), re(mm), CT (radar echo top height, m), and T" (�C). The shaded region delineates the extent of thestratiform region. Flight circles are ‘‘stacked’’ according to flight level.
D02206 PETTERS ET AL.: AEROSOL AND POCS DURING DYCOMS-II
6 of 15
D02206

nounced at f � 0.2 Hz. At lower frequencies (f � 0.05), ashift in length scales between inside and outside the pocketis also apparent. Such a shift could be indicative ofturbulence that is organized at larger scales inside the pocketbut may also be the result of sampling a gravity wave at twodifferent angles, inside and outside the pocket.[21] Vertical velocity statistics sampled inside and outside
the pocket are presented in Figures 11a and 11b. Timesegments corresponding to inside and outside the pocket arechosen as in Figure 10. For both time segments the w dis-tributions (top plots) and FIR# distributions (bottom leftplots) are shown, and these are referred to as the marginaldistributions. Also presented are conditional w distributionssampled within D FIR# = 10 W m�2 intervals (bottom rightplots). Comparing the statistics of the marginal w distribu-tions confirms the assertion that inside the pocket thew variance is reduced, consistent with Figure 10, and alsoshows that the marginal w distribution is positively skewedinside the pocket. No significant trend emerges whencomparing the conditionally sampled distributions insidethe pocket. This comparison indicates that the turbulencefields in the cell cores, i.e., where FIR# is reduced, arecomparable to those in the cell walls.3.3.2. In Cloud[22] During the in-cloud #5 circle (Figure 8, four middle
left plots), the cell cores are detected by increased T". Herewe employ q as tracer of FT air and utilize cloud dropletnumber concentration to determine whether or not it iscloudy. An increase in q at 30� < F < 110� is evident.These increases are thought to be due to the presence of FTair at flight altitude as it appears from both the q and cloud
droplet number concentration time series the aircraft wassampling above the capping inversion. This is in contrast toinside the pocket, here defined by 260� < F < 360�, where qis steady at 17�C and indicating that these in situ sampleswere taken within the MBL.[23] The six top left plots of Figure 8 are an inset of the
in-cloud #5 data taken inside the pocket. A correlation isapparent between the T" (indicating cell cores) and the radarreflectivity profile data. Some cores are characterized byradar reflectivities below flight level. At flight level, theseparticular cell cores are cloud-free (CDNC = 0 cm�3),relative humidity (RH) is high (�95%), and accumulationmode concentration is generally less than 40 cm�3. In twocell cores (1303:40–1304:00 and 1305:50–1306:10 UTC)accumulation mode concentration is <2 cm�3. The lowaccumulation mode concentration within the cell cores(2–40 cm�3) are in marked contrast to the attendant valuesof CN (�400 cm�3). The latter observation is consistentwith Aitken mode particles evident in the aerosol sizespectrum sampled in one of the cell cores (1301:22–1302:22 UTC, Figure 8, top right plot), and also presentbelow cloud in the disturbed region (Figure 6). The fact thataerosol microphysical properties (spectra and CN-to-AMCratios) within the upper reaches of the MBL agree withthose below cloud, strongly suggests that aerosol within theMBL is well mixed. The values of q between 15 and 17�Cboth below cloud (Figure 5) and immediately below theMBL capping inversion (Figure 8), plus the observation ofRH �95% support this assertion. In the adjacent cell walls,droplet concentrations are limited at 60 cm�3 and radarreflectivities extend from above flight level to the seasurface.
3.4. Summary of Cell Structure
[24] To summarize our results we present a magnifiedview of the structure of the open cell observed between1300:28 and 1303:28 UTC. In Figure 12 we illustrate theLCL, flight level and estimated inversion heights, delineatebetween cell wall and cell core and superimpose these withthe reflectivity profiles and the cloud droplet numberconcentration and the accumulation mode concentrationtime series. From the observations shown here, and those
Figure 6. (top) Condensation nuclei and accumulationmode concentration (AMC) for the below-cloud #2 circle(Figure 1). (bottom) Two aerosol size spectra acquired atF �46� and F � 150�. The vertical solid and dashed linesindicate the start and end of the RDMA scan (AppendixA1). Points where cloud water or drizzle were present areremoved from the time series. The shading (Figure 6, top)indicates the stratiform region (section 2.5).
Figure 7. Sketch of the C-130 sampling the pocket andthe horizontally more stratiform cloud during the below-cloud #3 circle.
D02206 PETTERS ET AL.: AEROSOL AND POCS DURING DYCOMS-II
7 of 15
D02206
obtained from the foregoing analysis, we characterize thestructure of a cell as follows: (1) Horizontally, a cell iscomposed of a narrow cell wall with strong radar reflectiv-ity, and a broad cell core containing intermittent cloud ordrizzle characterized by reflectivities smaller than that in thecell walls. (2) Below the LCL, radar reflectivities are moreintense in the cell walls. (3) Below the LCL, and in the cell
cores, the accumulation mode concentrations are limited at40 cm�3 and turbulence intensity is similar to that in the cellwalls. (4) The radar echo tops are higher in the cell wallsand variable radar echo tops are observed in the cell core.One example of echo top height variability is apparent inthe region of enhanced radar reflectivity centered at1301:45 UTC extending with relatively low reflectivities
Figure 8. C-130 data corresponding to the below-cloud #3 circle (bottom four left-hand plots), in-cloud(middle four left-hand plots), and the northwest quadrant of the in-cloud #5 circle (top six left-handplots). The right-hand plots show Tb11 (�C) from the NOAA 12 AVHRR (bottom right plot), Tb11 from theGOES 10 satellite (middle right plot), and the particle aerosol size spectrum (top right plot). Acquisitiontime interval of the aerosol size spectrum is also shown. Satellite images are presented as in Figure 5 butwith the geographic domain reduced. The units are w (m s�1), FIR# (W m�2), AMC (cm�3), CN (cm�3), q(�C), CDNC (cm�3), T" (�C), z (msl), and RH (%). The six top left plots are an inset of the in-cloud data(260� < F < 360�) with the corresponding times (UTC) indicated at the top. The image in the lowest ofthese plots is a radar reflectivity profile (dBZ), and the horizontal line indicates the C-130 flight level.The white color corresponds to data below the instrument noise threshold.
D02206 PETTERS ET AL.: AEROSOL AND POCS DURING DYCOMS-II
8 of 15
D02206

(< �10 dBZ) to the sea surface but with radar echo tops notextending to flight level.
4. Aitken Mode Particles
[25] Here we discuss whether the Aitken particles are, orare not, effective droplet nuclei. The generally acceptedtheory holds that particle nucleation in the remote oceanicMBL is the result of condensing H2SO4 and methanesulfonic acid. These compounds are derived from photo-oxidation of dimethylsulfide vented by the ocean surfacewaters. Data show that in remote marine atmospheres NH4
+
to non-sea-salt SO42� molar ratios are often near unity
[Quinn et al., 1990] and thus we assume that the Aitkenmode particles are composed of NH4HSO4.[26] During flight 2, the maximum applied supersatura-
tion in the UWyo CCN instrument was 1%. CCN concen-trations at s = 1% did not significantly exceed those at s <1%, indicating that the Aitken particles did not activateinside the CCN instrument and demonstrates that Aitkenparticle activation in the cloud is contingent on s > 1%.According to Kohler theory [Snider et al., 2003], the criticalsupersaturation, i.e., the supersaturation necessary to acti-vate a pure NH4HSO4 particle with D = 0.020 mm is 1.8%.[27] A closed adiabatic parcel model was utilized to
predict cloud droplet concentration with inputs consistingof aerosol size spectra, aerosol chemical composition, andupdraft [Snider et al., 2003]. Frequency distributions ofcloud droplet number concentration are calculated frompredictions based on an ensemble of w acquired duringthe below-cloud #3 circle (250� < F < 300�, 1338–1343 UTC, Figure 11) and compared to the correspondingobserved frequency distribution of cloud droplet numberconcentration, within the pocket (260� < F < 360�, 1259–1308 UTC). The aerosol size spectrum inside the pocket is
modeled utilizing a two mode lognormal distribution: n1(Aitken mode) = 404 cm�3, �D1 = 0.020 mm, s1 = 1.24; n2(accumulation mode) = 32 cm�3, �D2 = 0.128 mm, s2 = 1.79.These coefficients were obtained by fitting the aerosolsize spectrum acquired inside a cell core (1301:22 UTC,Figure 6, top right plot). Subsequent to the fitting, theconcentration of the Aitken mode (i.e., n1) was scaled toforce agreement between the total particle concentrationused to initialize the parcel model and the measured CNconcentration (Appendix A1). The parcel model was ini-tialized with T = 12�C, p = 945 hPa, RH = 98%, solublesolute mass fraction of unity, and the condensation coeffi-cient (a) either 0.04 or unity [Pruppacher and Klett, 1997].Parcel model descriptions like this typically overestimatedroplet concentrations which is attributed to our limitedunderstanding of the chemical composition and mixingstate of the aerosol [e.g., Snider et al., 2003]. However,entrainment and collision/coalescence may reduce dropletconcentration, relative to that produced by activationalone, and thus contributes to the overestimation of thepredicted (adiabatic) droplet concentration [Pawlowskaand Brenguier, 2000].[28] Statistics presented in Figure 13 indicate that there is
reasonable consistency between the predicted and observedcloud droplet ensembles, regardless of what is assumed forthe condensation coefficient. The model calculations indi-cate that �40 cm�3 should activate into cloud droplets. Ofthese 40 cm�3, 32 cm�3 are drawn from the accumulationmode. Only 8 out of 404 (�2%) of the Aitken modeparticles were activated by the model, because the relativelyweak updrafts limit the peak supersaturation in ascendingparcels. On the basis of this we assert that NH4HSO4 is aconsistent chemical composition for the aerosol particles,
Figure 9. Scatterplot of accumulation mode concentrationand FIR# for the below-cloud #3 circle. Data acquired insidethe pocket (10� < F < 90� and 200� < F <300�) are red, anddata acquired elsewhere are blue.
Figure 10. Power spectral density Sw(f) per decimallogarithmic frequency interval obtained from the 25 Hz wtime series inside (1338–1343 UTC, dotted) and outside(1343–1348 UTC, solid) the pocket.
D02206 PETTERS ET AL.: AEROSOL AND POCS DURING DYCOMS-II
9 of 15
D02206

but the possibility that it is composed of other compounds,equally or slightly less hygroscopic than the assumedNH4HSO4, cannot be dismissed.
4.1. Origin
[29] Here we explore the origin of the Aitken particlesanalyzing the spatial context in which they were observed.The presence of Aitken particles in the FT is not indicated insize spectra acquired during the above-cloud circles. Duringthe sounding at the end of the below-cloud #3 circle(Figure 1), CN-to-AMC ratios dropped from 20 ± 6 insidethe MBL to 6 ± 2 in the FT. This establishes the point thatFT-to-MBL entrainment is an insufficient explanation forthe Aitken mode particles observed in the boundary layer.Furthermore, Aitken particles were not detected toward theNorth American continent (cf. Figure 5, bottom left plots)and prevailing winds were northwesterly both in the FT andMBL, so we assert that the source of the Aitken particles istoward the northwest, most probably because of a particlenucleation event which occurred within the MBL.[30] Observed nanoparticle growth rates subsequent to
particle nucleation events range between 0.003 and0.01 mm h�1 [Hoppel et al., 1994; Weber et al., 1998b;Jennings and O’Dowd, 2000]. On the basis of these growthrates �2 to 4 hours of sustained growth suffices to yield theobserved Aitken mode diameter (0.02 mm). However, theelusiveness of the actual nucleation event, and of the sourcestrength of the condensing species, makes affirmativeassertions about the age of the Aitken particles difficult.[31] Conditions inside the pocket, and perhaps also con-
ditions leading to the genesis of pockets of open cells, arefavorable for particle nucleation. Broken cloud cover isexpected to have enhanced the actinic flux during the
daytime, driving the photochemical oxidation of DMS.Inside the pocket, but outside the regions of drizzle, thePCASP was used to estimate the particle surface area. Valuesof 5.9 ± 0.4 mm2 cm�3 were below the critical threshold of10 mm2 cm�3 where particle nucleation is favored overcondensation [Clarke et al., 1998a]. Similar to our observa-tion, aerosol originating from a nucleation event occurringclose to the top of a morning stratocumulus layer weredocumented by Hegg et al. [1991]. These authors found alarge increase in CN concentration and these particles didnot activate inside a CCN chamber at s = 1%. In their case,however, sampling artifacts or transport across the FT/MBLinterface cannot be dismissed [Paluch and Lenschow, 1992].
5. Discussion
[32] We document mesoscale contrasts between a pocketof open cells (the pocket) and an adjacent region ofstratiform cloud. Inside the pocket narrow cell walls(1–6 km in width), with heavy drizzle, surround cell cores(6–12 km in width) characterized by cloud thinning andeven clearing. We document the variable radar echo topheights (Figure 12) and the unusually low accumulationmode concentrations (Figure 9) inside the pocket. Also ofnote is the fact that the Aitken mode particles are noteffective cloud droplet nuclei (section 4) which establishesour initial premise (section 2.4) that droplet nuclei concen-trations are approximated by PCASP-measured concentra-tions. We now propose explanations contributing to themaintenance of pockets of open cells in terms of dynamicaland the microphysical mechanisms.[33] From a dynamical perspective, a transition from
stratocumulus-like to cumulus-like circulation can occur in
Figure 11. Vertical velocity statistics sampled (a) inside and (b) outside the pocket. Time segments arechosen as in Figure 10. Shown are the marginal w distributions (top plots) and marginal FIR# distributions(bottom left plots). Also shown are conditional w distributions sampled within D FIR# = 10 W m�2
intervals (bottom right plots). Vertical lines show the minimum, lower quartile, median, upper quartile,and maximum w, respectively. Circles correspond to the mean, horizontal lines correspond to the mean ±one standard deviation, and s and sk denote the standard deviation and the skewness of the marginal wdistributions.
D02206 PETTERS ET AL.: AEROSOL AND POCS DURING DYCOMS-II
10 of 15
D02206

response to the diabatic effects of precipitation on the MBL[Stevens et al., 1998]. Such large eddy simulation studiesdemonstrate that within a nocturnal precipitating MBL,cumulus-like updrafts are accompanied by broader andgentler regions of downdraft. This turbulence field is incontrast to smaller-scale eddies, with aspect ratio of orderone, typically associated with stratocumulus. Althoughsome aspects of the observations of pockets of open cellsare consistent with the simulation, e.g., the cloud spacingwithin the pocket (Figure 8) and the tendency towardreduced w variance and positive w skewness (Figure 11),the data show the same dominant eddy mode at f � 0.2 Hzinside the pocket and the surrounding more stratiformregion and do not reveal the upscale organization anticipatedby the model (Figure 10). The power spectral analysis,however, does not make a convincing case for the absenceof cumulus-like circulation within the pocket, and in fact thecell cores may be a manifestation of the model-anticipateddowndraft structure. Further, there is some evidence for thepresence of gravity waves (section 3.3.1), and if that is
indeed the case these may have an organizing influence onthe cell wall and cell core structure of the pocket.[34] From an aerosol and cloud microphysical perspective,
pockets of open cells may be viewed as a region of reduceddroplet nuclei abundance where the rapid onset of drizzle,combined with spatial variability in droplet nuclei induced bydrizzle scavenging, precludes the formation of a stratiformcloud layer. Parcel models which include collision/coales-cence demonstrate that in a low droplet nuclei regime cloudtop heights are modulated by droplet nuclei abundance[Hegg, 1999]. When droplet nuclei abundance is decreased,autoconversion rates are enhanced and mean droplet diam-eters approach the autoconversion threshold (D � 20 mm)within a few tens of meters of cloud base [Pawlowska andBrenguier, 2003]. In this context autoconversion refers to theself collection of droplets forming precipitation embryos. Itfollows that the overall effect of reduced droplet nucleiabundance is the accelerated onset of drizzle formation. Asdroplet mass is shunted into drizzle via autoconversion,updrafts loose condensate during ascent and cloud tops
Figure 12. (top) Accumulation mode concentration (AMC) and cloud droplet number concentrationtime series and (bottom) radar reflectivity profiles (dBZ) acquired during the in-cloud #5 circle between1300:28–1303:28 UTC. (bottom) C-130 flight level, the estimated top of the inversion, the LCL, cellwalls and cell core (Figure 12, bottom), accumulation mode aerosol concentration in the cell core, andcloud droplet number concentration in the cell wall (Figure 12, top).
D02206 PETTERS ET AL.: AEROSOL AND POCS DURING DYCOMS-II
11 of 15
D02206

become sensitive to initial droplet nuclei abundance [Hegg,1999]. Observations of low droplet nuclei concentrations(Figure 9) and variable radar echo tops (Figure 12) areconsistent with these parcel model predictions.[35] Both the dynamical and the microphysical mecha-
nisms are causally linked to droplet nuclei abundance.Known sources of droplet nuclei in the remote MBL areentrainment and the sea-to-atmosphere flux. For the former,entrainment velocities �0.6 cm s�1 [Faloona et al., 2005]combined with observed FT-to-MBL aerosol gradients pro-duce a flux which is too weak to compete with removalwithin the precipitating cell walls where drizzle fluxes are�10 mm d�1. Observed horizontal winds within the pocketare relatively low (5–8 m s�1) indicating that the sea-to-atmosphere flux is also uncompetitive [Mason, 2001;Nilsson et al., 2001]. As a result, the MBL droplet nucleiand particle surface area tendencies are conjectured to benegative, cloud fraction is diminished in response to en-hanced rates of autoconversion, aerosol precursor photolysisrates within the MBL are increased, and the region becomespredisposed for particle nucleation. Implicit in this view isthe plausibility that cloud processing of the aerosol (i.e.,nucleation scavenging, coalescence, and precipitation) per-turb the abundance of droplet nuclei within the MBL andthus play a role in regulating cloud fraction and particlenucleation over the oceans.[36] Because of the implications raised in the foregoing
discussion, a word of caution is in order. What we have
designated mechanisms are in fact rationalizations of stra-tocumulus response to low droplet nuclei abundance. Thusthese mechanisms are the quintessence of computationalmodels, but the latter are not a priori applicable to pocketsof open cells. Consistency between observations and theproposed mechanisms neither fully validates these modelsnor fully elucidates pockets of open cells. Although we areconfident that scarcity of cloud condensation nuclei main-tain the pockets, the mechanism itself is not clear. Furtherinsights into the mechanics of this phenomenon will requirecharacterizations of the horizontal fields (i.e., cloud, aerosol,actinic flux, and gaseous precursors), of the thermodynamicstratification, and of the temporal evolution of the internalstructure of pockets of open cells.
6. Conclusions
[37] Mesoscale differences between pockets of opencells and surrounding stratiform clouds are reported. Insitu data demonstrate that inside pockets of open cells,radar echo tops are variable, droplet nuclei concentrationsare low, and Aitken particles dominate aerosol concentra-tion. The latter are suggested to result from a particlenucleation event that occurred within the MBL. It isproposed that low droplet nuclei concentrations maintainpockets of open cells via dynamical and microphysicalmechanisms. These linkages between droplet nuclei abun-dance and pockets of open cells imply that the remoteMBL may be more susceptible to modification by cloudcondensation nuclei than thought previously.
Appendix A: Instrumentation
A1. Aerosol Size Spectra
[38] The passive cavity aerosol spectrometer probe(PCASP) used during DYCOMS-II is an updated versionof this instrument with twice the size resolution of itspredecessor. Because there is noise present in the lowestchannel of the PCASP, we only utilize PCASP measure-ments corresponding to sizes larger than 0.1 mm [Twohy etal., 2005]. The manufacturer-defined sizing, which assumesa refractive index of 1.59, was used for our data analysis.[39] The radial differential mobility analyzer (RDMA) is
designed for measurement of aerosol size spectra in the 0.01to 0.13 mm size range [Russell et al., 1996]. Polydisperseaerosols are brought to charge equilibrium and classified as afunction of aerosol electric mobility by varying the electricpotential inside the RDMA from 0 to �5000 V and from�5000 to 0 V. We refer to these variations of the RDMAvoltage (60 s each) as the upscan and downscan, respectively.Particles classified on the basis of their electric mobility arecounted by a condensation particle counter (CPC) whereparticles larger than 0.008 mm are detected with �100%efficiency [Russell et al., 1996]. The resulting electric mobil-ity spectra were inverted to size spectra and sizes werecalculated from electric mobility using scan-averaged pres-sure (p) and temperature (T). Particle sizes were interpolatedonto a geometrically stepped grid ranging from 0.006 to0.13 mm with D log10D = 0.05. No attempt was made tocorrect the size spectra for diffusional broadening.[40] We construct aerosol size spectra by combining
PCASP size spectra measured at sizes larger than 0.13 mm
Figure 13. Statistics of observed and predicted ensemblesof cloud droplet number concentration inside the pocket.Horizontal lines show the minimum, lower quartile, median,upper quartile, and maximum droplet concentration,respectively. Circles correspond to the mean, and verticallines correspond to the mean ± one standard deviation of thedistribution.
D02206 PETTERS ET AL.: AEROSOL AND POCS DURING DYCOMS-II
12 of 15
D02206
with RDMA spectra measured at smaller sizes. During flight2, when abundant Aitken mode particles were present, CNconcentrations derived from PCASP/RDMA size spectrawere �35% lower than those from the TSI 3760. Sincecomparisons made on other flight days agreed within ±10%[Petters, 2004], we conjecture that the 35% discrepancy forflight 2 is due to reduced transmission of Aitken modeparticles in the tubing leading to the RDMA, compared totransmission in the tubing leading to the TSI 3760. Weaccounted for the 35% disparity by scaling the fitted concen-tration of the Aitken mode (i.e., n1, section 4) until agreementwas achieved between total particle concentration, used forthe parcel model initialization, compared with averagesderived from CN measurements made with the TSI 3760.This correction, however, had an insignificant impact on theconcentration of activated cloud droplets predicted insection 4.
A2. Power Spectral Densities
[41] Power spectral densities (Sw(f) = ds2/dlog10f), de-fined as the w variance per decimal logarithmic frequencyinterval, were calculated from the 25 Hz time series afterremoving linear trends and applying a 10% cosine-taperfunction. These are presented in an area-preserving formatby plotting linear values of Sw(f) versus the decimal loga-rithm of frequency.
A3. Liquid Water Shattering
[42] Aerosol data concurrent with the observation of cloudor drizzle are suspect because of liquid water shattering[Weber et al., 1998a; Guibert et al., 2003]. The method usedto select against data segments affected by shattering aredescribed by Petters [2004]. In brief, we define a ‘‘liquidwater reject’’ event as LWC > 0.1 g m�3 or 2D-C > L�1 orcloud droplet number concentration >1 cm�3 for 1 s, and ifthis is true we omit aerosol measurements from averages orfrom plotted time series. There is an instrument-dependentlag between liquid water reject events and the artifact[Petters, 2004] and this is accounted for here. Aerosol sizespectra were rejected when 3 or more liquid water rejectevents occurred during the 60 s up or down scans.
A4. Velocities
[43] Updraft velocity was obtained from a gust probesystem mounted on the aircraft radome. A bias of up to0.3 m s�1 is reported for this instrument [Brown, 1993].We remove this bias by forcing the mean of w to zero forconstant altitude segments.
A5. Remote Sensing
[44] Wyoming Cloud Radar reflectivity data were thresh-olded five standard deviations above the mean noise level[see Vali et al., 1998] and interpolated onto a 25 Hz � 20 mtime-altitude grid (Figure 8) after omitting the first threerange gates.[45] Visible reflectance and brightness temperature at
11 mmwavelength (Tb11) data were obtained from channels 1and 5 of the geostationary operational environmental satel-lite (GOES 10), respectively. Maximum spatial resolution ofthese fields is 1x1 km (channel 1) and 4 � 4 km (channel 5).When available, high-resolution Tb11 data were obtainedfrom channel 5 of the NOAA 12 polar orbiting advanced
very high resolution radiometer (AVHRR) at 1 � 1 kmmaximum spatial resolution.
Notation
D particle diameter.FIR# downwelling IR irradiance.T" upwelling IR radiance expressed as radiative
temperature.Tb11 satellite derived radiative temperature.
p pressure.r mixing ratio.re cloud droplet effective radius.T temperature.w vertical velocity.a condensation coefficient.s standard deviation.sk skewness.F azimuth angle.q potential temperature.
Sw(f) power spectral density.s supersaturation.f frequency.
RH relative humidity.AMC Accumulation Mode Concentration.
AVHRR Advanced Very High Resolution Radiometer.CCN Cloud Condensation Nuclei.
CDNC Cloud Droplet Number Concentration.CN Condensation Nuclei.CPC Condensation Particle Counter.
DYCOMS Dynamics and Chemistry of Marine Stratocu-mulus.
FT Free Troposphere.GOES Geostationary Operational Environmental
Satellite.IR Infrared.
LCL Lifted Condensation Level.LWC Liquid Water Content.LWP Liquid Water Path.MBL Marine Boundary Layer.
NCAR National Center for Atmospheric Research.RDMA Radial Differential Mobility Analyzer.
[46] Acknowledgments. This work was funded by NSF ATM-0103951. L. M. Russell acknowledges support from the NSF grant0104707 and the James S. McDonnell Foundation. We thank numerousemployees of NCAR-ATD and the University of Wyoming for their assis-tance. We also thank Margreet van Zanten for reviewing an early draft of themanuscript. Finally, we thank the editor and the reviewers for their critiques.
ReferencesAckerman, A. S., O. B. Toon, and P. V. Hobbs (1993), Dissipation ofmarine stratiform clouds and collapse of the marine boundary layer dueto the depletion of cloud condensation nuclei by clouds, Science, 262,226–229.
Albrecht, B. A. (1989), Aerosols, cloud microphysics, and fractional clou-diness, Science, 245, 1227–1230.
Albrecht, B. A., D. A. Randall, and S. Nicholls (1988), Observations ofmarine stratocumulus clouds during FIRE, Bull. Am. Meteorol. Soc., 69,618–626.
Blanchard, D. C., and A. H. Woodcock (1980), The production concentra-tion and vertical distribution of the sea salt aerosol, Ann. N.Y. Acad. Sci.,338, 330–347.
Brown, E. N. (1993), Measurement uncertainties of the NCAR air motionsystem, NCAR Tech. Note, TN-386+STR, Res. Aviation Facil., Atmos.Technol. Div., Natl. Cent. for Atmos. Res., Boulder, Colo. (Available asNTIS PB93-184208 from [email protected])
D02206 PETTERS ET AL.: AEROSOL AND POCS DURING DYCOMS-II
13 of 15
D02206

Cantrell, W., G. R. Cass, Z. Chowdhury, L. S. Hughes, K. A. Prather, S. A.Guazzotti, and K. R. Coffee (2001), Closure between aerosol particlesand cloud condensation nuclei at Kaashidhoo climate observatory,J. Geophys. Res., 106, 28,711–28,718.
Charlson, R. J., J. E. Lovelock, M. O. Andreae, and S. G. Warren (1987),Oceanic phytoplankton, atmospheric sulphur, cloud albedo and climate,Nature, 326, 655–661.
Chuang, P. Y., D. R. Collins, H. Pawlowska, J. R. Snider, H. H. Jonsson,J.-L. Brenguier, R. C. Flagan, and J. H. Seinfeld (2000), CCN measure-ments during ACE-2 and their relationship to cloud microphysical prop-erties, Tellus, Ser. B, 52, 843–867.
Clarke, A. D., J. L. Varner, F. Eisele, R. L. Mauldin, D. Tanner, andM. Litchy (1998a), Particle production in the remote marine atmosphere:Cloud outflow and subsidence during ACE 1, J. Geophys. Res., 103,16,397–16,409.
Clarke, A. D., et al. (1998b), Particle nucleation in the tropical bound-ary layer and its coupling to marine sulfur sources, Science, 282,89–92.
Covert, D. S., V. N. Kapustin, P. K. Quinn, and T. S. Bates (1992), Newparticle formation in the marine boundary layer, J. Geophys. Res., 97,20,581–20,589.
Covert, D. S., V. N. Kapustin, T. S. Bates, and P. K. Quinn (1996), Physicalproperties of marine boundary layer aerosol particles of the mid-Pacific inrelation to sources and meteorological transport, J. Geophys. Res., 101,6919–6930.
Covert, D. S., J. L. Gras, A. Wiedensohler, and F. Stratman (1998), Com-parison of directly measured CCN with CCN modeled from the number-size distribution in the marine boundary layer during ACE 1 at CapeGrim, Tasmania, J. Geophys. Res., 103, 16,597–16,608.
Faloona, I., D. Lenschow, T. Campos, B. Stevens, M. van Zanten,B. Blomquist, D. Thornton, A. Bandy, and H. Gerber (2005), Obser-vations of entrainment in eastern Pacific marine stratocumulus usingthree conserved scalars, J. Atmos. Sci., 62, 3268–3285.
Gerber, H., B. Arends, and A. S. Ackerman (1994), New microphysicssensor for aircraft use, Atmos. Res., 31, 235–252.
Guibert, S., J. R. Snider, and J.-L. Brenguier (2003), Aerosol activationin marine stratocumulus clouds: 1. Measurement validation for a clo-sure study, J. Geophys. Res., 108(D15), 8628, doi:10.1029/2002JD002678.
Hegg, D. A. (1999), Dependence of marine stratocumulus formation onaerosols, Geophys. Res. Lett., 26, 1429–1432.
Hegg, D. A., L. F. Radke, and P. V. Hobbs (1991), Measurements of aitkennuclei and cloud condensation nuclei in the marine atmosphere and theirrelation to the DMS-cloud climate hypothesis, J. Geophys. Res., 96,13,727–18,733.
Hoppel, W. A., G. M. Frick, J. W. Fitzgerald, and R. E. Larson (1994),Marine boundary layer measurement of new particle formation and effectsnonprecipitating clouds have on aerosol size distribution, J. Geophys.Res., 99, 14,443–14,459.
Houghton, J. T., Y. Ding, D. J. Griggs, M. Noguer, P. J. van der Linden,and D. Xiaosu (Eds.) (2001), Climate Change 2001: The ScientificBasis—Contribution of Working Group I to the Third AssessmentReport of the Intergovernmental Panel on Climate Change, CambridgeUniv. Press, New York.
Jennings, S. G., and C. D. O’Dowd (2000), Continuous measurements ofnew particle formation and the radiative effects of coastal particleproduction plumes, Rep. Ser. Aerosol Sci., 48, 40–47.
Lenschow, D. H., et al. (1988), Dynamics and chemistry of marine strato-cumulus (DYCOMS) experiment, Bull. Am. Meteorol. Soc., 69, 1058–1067.
Mason, B. J. (2001), The role of sea-salt particles as cloud condensationnuclei over the remote oceans, Q. J. R. Meteorol. Soc., 127, 2023–2032.
Nicholls, S. (1984), The dynamics of stratocumulus: Aircraft observationsand comparisons with a mixed layer model, Q. J. R. Meteorol. Soc., 110,783–820.
Nilsson, E. D., U. Rannik, E. Swietlicki, C. Leck, P. P. Aalto, J. Zhou, andM. Norman (2001), Turbulent aerosol fluxes over the Arctic Ocean:2. Wind-driven sources from the sea, J. Geophys. Res., 106, 32,139–32,154.
O’Dowd, C. D., and M. H. Smith (1993), Physicochemical properties ofaerosols over the northeast Atlantic: Evidence for wind speed relatedsubmicron sea-salt aerosol production, J. Geophys. Res., 98, 1137–1149.
O’Dowd, C. D., J. A. Lowe, M. H. Smith, B. Davidon, C. N. Hewitt,and R. M. Harrison (1997), Biogenic sulphur emissions and inferrednon-sea-salt sulphate cloud condensation nuclei in and around Antarti-ca, J. Geophys. Res., 102, 12,839–12,854.
O’Dowd, C. D., et al. (2002), Marine aerosol formation from biogeniciodine emissions, Nature, 417, 632–635.
Paluch, I. R., and D. H. Lenschow (1992), Comment on ‘‘Measurements ofAitken nuclei and cloud condensation nuclei in the marine atmosphere
and their relation to the DMS-cloud climate hypothesi’’ by D. A. Hegg etal., J. Geophys. Res., 97, 7657–7658.
Pawlowska, H., and J.-L. Brenguier (2000), Microphysical properties ofstratocumulus clouds during ACE-2, Tellus, 109, 868–887.
Pawlowska, H., and J.-L. Brenguier (2003), An observational study ofdrizzle formation in stratocumulus clouds for general circulationmodel (GCM) parameterizations, J. Geophys. Res., 108(D15), 8630,doi:10.1029/2002JD002679.
Pazmany, A. L., R. E. McIntosh, R. D. Kelly, and G. Vali (1994), Anairborne 95 GHz dual-polarized radar for cloud studies, IEEE Trans.Geosci. Remote Sens., 32, 731–739.
Petters, M. D. (2004), Cloud condensation nuclei: Measurement, predictionand effects on remote marine stratocumulus clouds, Ph.D. thesis, Dep. ofAtmos. Sci., Univ. of Wyo., Laramie.
Pirjola, L., C. D. O’Dowd, I. Brooks, and M. Kulmala (2000), Can newparticle formation occur in the marine boundary layer?, J. Geophys. Res.,105, 26,531–26,546.
Pruppacher, H. R., and J. D. Klett (1997), Atmospheric and OceanographicScience Library, vol. 18, Microphysics of Clouds and Precipitation, 2nded., Springer, New York.
Quinn, P. K., T. S. Bates, J. E. Johnson, D. S. Covert, and R. J. Charlson(1990), Interaction between the sulfur and reduced nitrogen cycles overthe central Pacific Ocean, J. Geophys. Res., 95, 16,405–16,416.
Raes, F. D. R. V., E. Cuevas, P. F. J. V. Velthoven, and J. M. Prospero(1997), Observations of aerosols in the free troposphere and marineboundary layer of the subtropical northeast Atlantic: Discussion of pro-cesses determining their size distribution, J. Geophys. Res., 102, 21,315–21,328.
Russell, L. M., S. H. Zhang, R. C. Flagan, and J. H. Seinfeld (1996),Radially classified aerosol detector for aircraft-based submicron aerosolmeasurements, J. Atmos. Oceanic Technol., 13, 598–609.
Russell, L. M., D. H. Lenschow, K. K. Laursen, P. B. Krummel, S. T.Siems, A. R. Bandy, D. C. Thornton, and T. S. Bates (1998), Bidirec-tional mixing in an ACE 1 marine boundary layer overlain by a secondturbulent layer, J. Geophys. Res., 103, 16,411–16,432.
Snider, J. R., and J.-L. Brenguier (2000), Cloud condensation nuclei andcloud droplet measurements during ACE-2, Tellus, Ser. B, 52, 828–842.
Snider, J. R., S. Guibert, and J.-L. Brenguier (2003), Aerosol activation inmarine stratocumulus clouds: 2. Kohler and parcel theory closure studies,J. Geophys. Res., 108(D15), 8629, doi:10.1029/2002JD002692.
Stephens, G. L. (1978), Radiation profiles in extended water clouds, I:Theory, J. Atmos. Sci., 35, 2111–2122.
Stevens, B., W. R. Cotton, G. Feingold, and C. Moeng (1998), Large eddysimulations of strongly precipitating, shallow, stratocumulus-toppedboundary layers, J. Atmos. Sci., 55, 3616–3638.
Stevens, B., et al. (2003a), Dynamics and Chemistry of Marine Stratocu-mulus—DYCOMS-II, Bull. Am. Meteorol. Soc., 84, 579–593.
Stevens, B., et al. (2003b), Dynamics and Chemistry of Marine Stratocu-mulus—DYCOMS-II, Bull. Am. Meteorol. Soc., 84, electron. suppl.
Stevens, B., G. Vali, K. Comstock, R. Wood, M. C. Zanten, P. H. Austin,C. S. Bretherton, and D. H. Lenschow (2005), Pockets of open cells(POCs) and drizzle in marine stratocumulus, Bull. Am. Meteorol. Soc.,86, 51–57.
Twohy, C. H. (1991), Airborne condensation nucleus counter user’s guide,NCAR Tech. Note TN-356+EDD, 21 pp., Natl. Cent. for Atmos. Res.,Boulder, Colo.
Twohy, C. H., M. D. Petters, J. R. Snider, B. Stevens, W. Tahnk, M. Wetzel,L. Russell, and F. Burnet (2005), Evaluation of the aerosol indirect effectin marine stratocumulus clouds: Droplet number, size, liquid water path,and albedo, J. Geophys. Res., 110, D08203, doi:10.1029/2004JD005116.
Vali, G., R. D. Kelly, J. French, H. Haimov, D. Leon, R. E. McIntosh, andA. Pazmany (1998), Finescale structure and microphysics of coastal stra-tus, J. Atmos. Sci., 55, 3540–3564.
van Zanten, M. C., and B. Stevens (2005), On the observed structure ofheavily precipitating marine stratocumulus, J. Atmos. Sci., 48, 40–47.
van Zanten, M., B. Stevens, G. Vali, and D. H. Lenschow (2005), Observa-tions of drizzle in nocturnal marine stratocumulus, J. Atmos. Sci., 62, 88–106.
Weber, R. J., A. D. Clarke, M. Litchy, L. J. G. Kok, R. D. Schillawski, andP. H. McMurry (1998a), Spurious aerosol measurements when samplingfrom aircraft in the vicinity of clouds, J. Geophys. Res., 103, 28,337–28,346.
Weber, R. J., P. H. McMurry, L. Mauldin, D. J. Tanner, F. L. Eisele,S. M. Brechtel, F. Kreidenweis, G. L. Kok, R. D. Schillawski, andD. Baumgardner (1998b), A study of new particle formation andgrowth involving biogenic and trace gas species measured duringACE 1, J. Geophys. Res., 103, 16,285–16,396.
Yum, S. S., J. G. Hudson, and X. Yonghong (1998), Comparison of cloudmicrophysics with cloud condensation nuclei spectra over the summer-time Southern Ocean, J. Geophys. Res., 103, 16,625–16,636.
D02206 PETTERS ET AL.: AEROSOL AND POCS DURING DYCOMS-II
14 of 15
D02206

Zhou, J., O. H. Swietlicki, P. P. Aalto, E. D. Hameri, K. Nilsson, andC. Leck (2001), Hygroscopic properties of aerosol particles over thecentral Arctic Ocean during summer, J. Geophys. Res., 106, 32,111–32,123.
�����������������������I. Faloona, Department of Land, Air and Water Resources, University of
California, Davis, CA 95616-8627, USA.
M. D. Petters, Department of Atmospheric Science, Colorado StateUniversity, Fort Collins, CO 80523-1371, USA. ([email protected])L. M. Russell, Scripps Institution of Oceanography, University of
California, San Diego, 9500 Gilman Drive, La Jolla, CA 92093-0221, USA.J. R. Snider and G. Vali, Department of Atmospheric Science, University
of Wyoming, 1000 E. University Avenue, Laramie, WY 82071-3038, USA.B. Stevens, Department of Atmospheric Science, Box 951565, University
of California, Los Angeles, CA 90095-1565, USA.
D02206 PETTERS ET AL.: AEROSOL AND POCS DURING DYCOMS-II
15 of 15
D02206


![Aerosol Transport and Conclusions · Aerosol Transport and Deposition ... Microsoft PowerPoint - Particle Transport__Ahmadi_NETL.ppt [Compatibility Mode] Author: gahmadi Created Date:](https://static.fdocuments.in/doc/165x107/5adef1cb7f8b9a1c248b6b05/aerosol-transport-and-conclusions-transport-and-deposition-microsoft-powerpoint.jpg)