Accounting Principles 8th Edition
90
Page 10-1
Transcript of Accounting Principles 8th Edition
Page
10-1
Page
10-2
Budgetary Control and
Responsibility Accounting
Managerial Accounting
Fifth Edition
Weygandt Kimmel Kieso
Page
10-3
study objectives
1. Describe the concept of budgetary control.
2. Evaluate the usefulness of static budget reports.
3. Explain the development of flexible budgets and the
usefulness of flexible budget reports.
4. Describe the concept of responsibility accounting.
5. Indicate the features of responsibility reports for cost
centers.
6. Identify the content of responsibility reports for profit
centers.
7. Explain the basis and formula used in evaluating
performance in investment centers.
Page
10-4
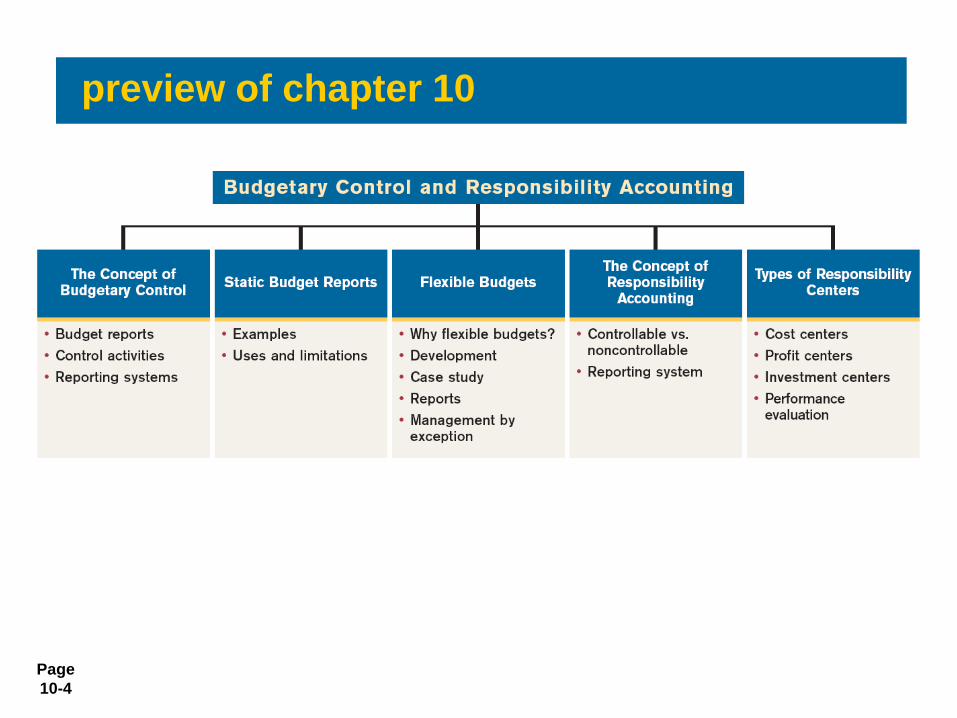
preview of chapter 10
Page
10-5
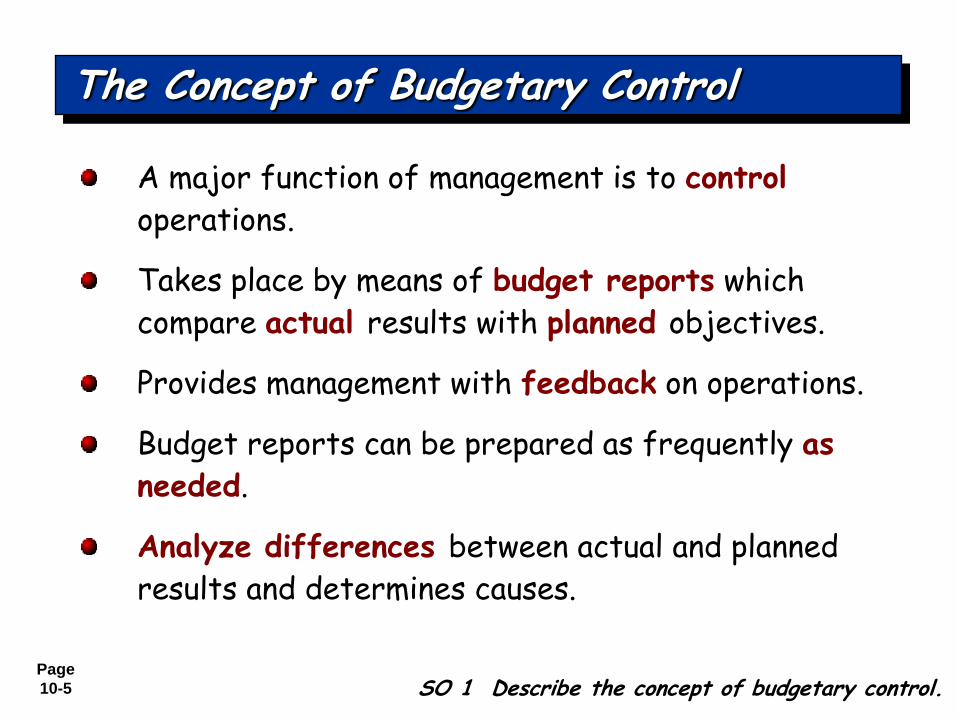
The Concept of Budgetary Control
A major function of management is to control
operations.
Takes place by means of budget reports which
compare actual results with planned objectives.
Provides management with feedback on operations.
Budget reports can be prepared as frequently as
needed.
Analyze differences between actual and planned
results and determines causes.
SO 1 Describe the concept of budgetary control.
Page
10-6
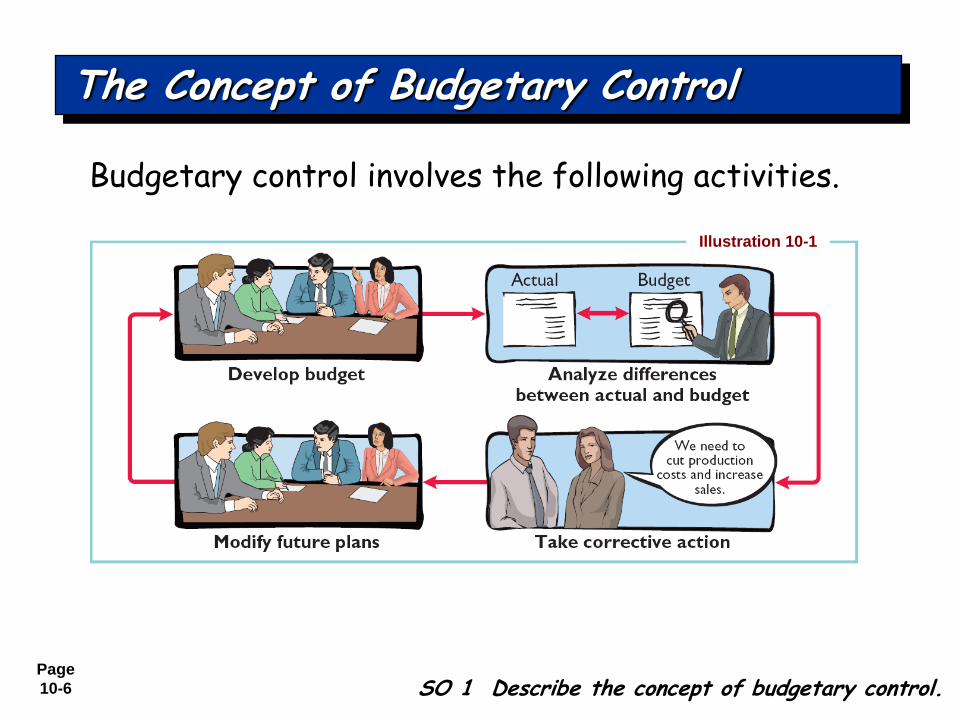
The Concept of Budgetary Control
Budgetary control involves the following activities.
Illustration 10-1
SO 1 Describe the concept of budgetary control.
Page
10-7
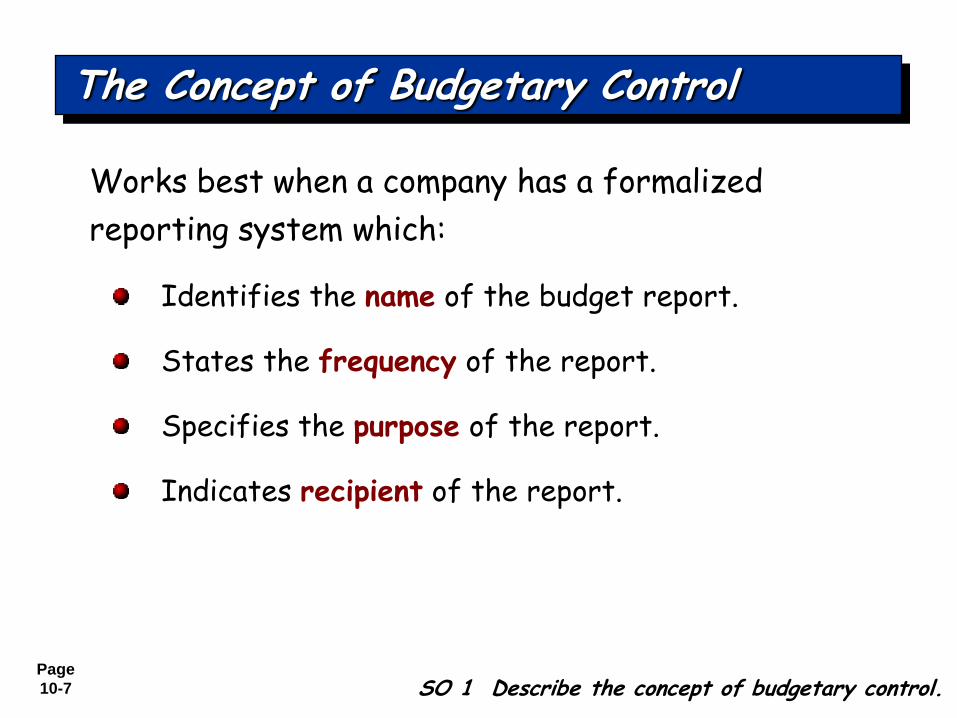
Works best when a company has a formalized
reporting system which:
Identifies the name of the budget report.
States the frequency of the report.
Specifies the purpose of the report.
Indicates recipient of the report.
SO 1 Describe the concept of budgetary control.
The Concept of Budgetary Control
Page
10-8
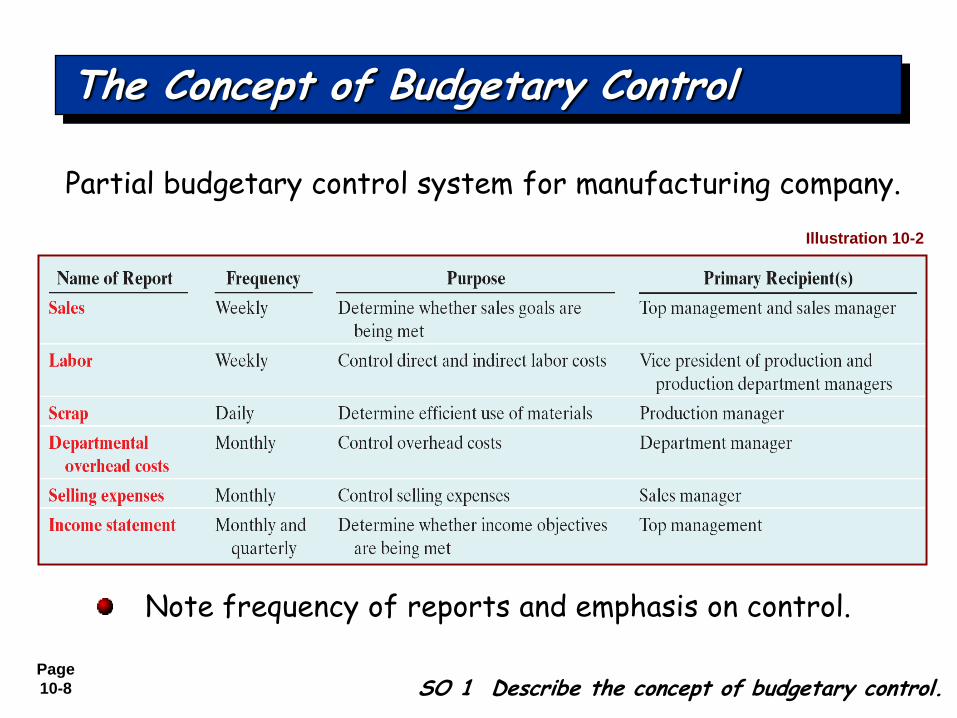
Partial budgetary control system for manufacturing company.
Illustration 10-2
SO 1 Describe the concept of budgetary control.
The Concept of Budgetary Control
Note frequency of reports and emphasis on control.
Page
10-9
Budgetary control involves all but one of the following:
a. Modifying future plans.
b. Analyzing differences.
c. Using static budgets.
d. Determining differences between actual and planned results.
Review Question
SO 1 Describe the concept of budgetary control.
The Concept of Budgetary Control
a. Modifying future plans.
b. Analyzing differences.
c. Using static budgets.
d. Determining differences between actual and planned results.
Page
10-10
When used in budgetary control, each budget
included in master budget is considered to be static.
A static budget is a projection of budget data at
one level of activity.
Ignores data for different levels of activity.
Compares actual results with budget data at the
activity level used in the master budget.
SO 2 Evaluate the usefulness of static budget reports.
Static Budget Reports
Page
10-11
Illustration 10-3
SO 2 Evaluate the usefulness of static budget reports.
Static Budget Reports
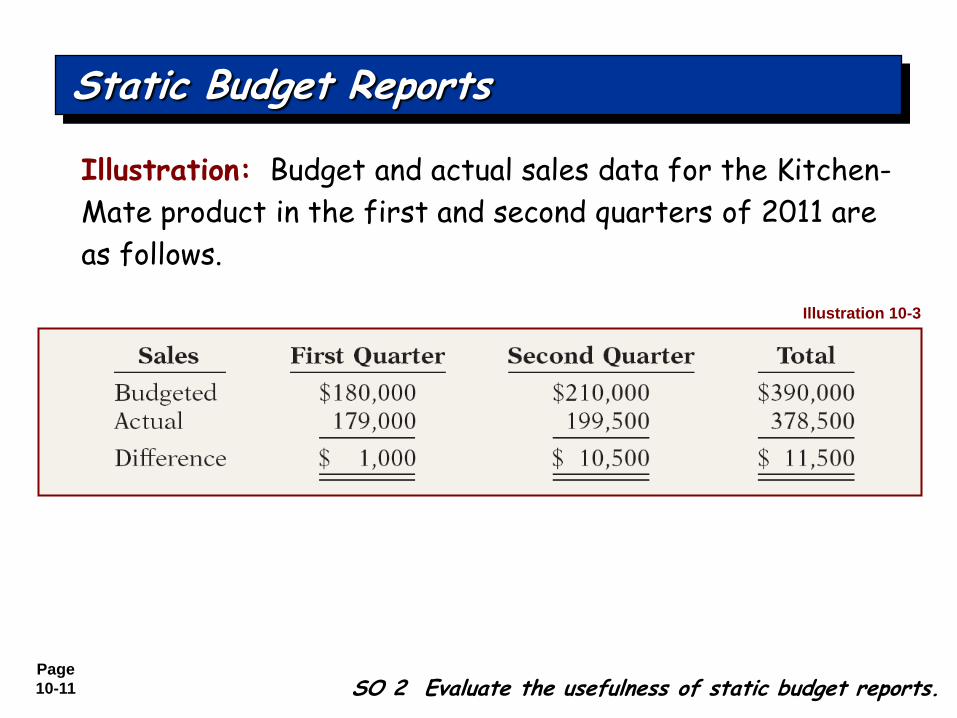
Illustration: Budget and actual sales data for the Kitchen-
Mate product in the first and second quarters of 2011 are
as follows.
Page
10-12 SO 2 Evaluate the usefulness of static budget reports.
Static Budget Reports
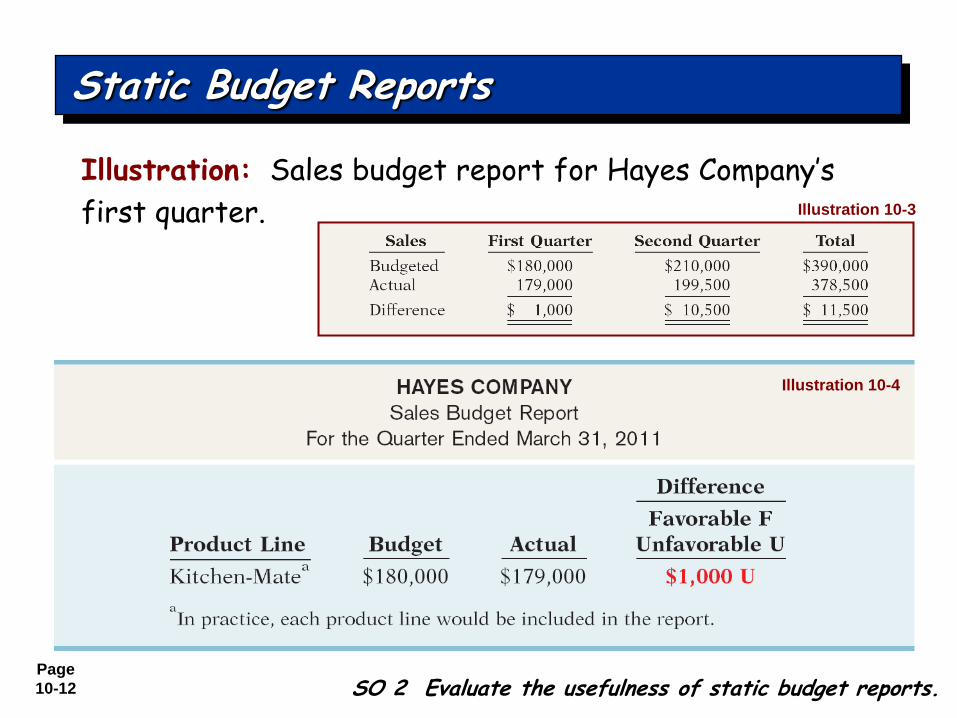
Illustration: Sales budget report for Hayes Company’s
first quarter. Illustration 10-3
Illustration 10-4
Page
10-13
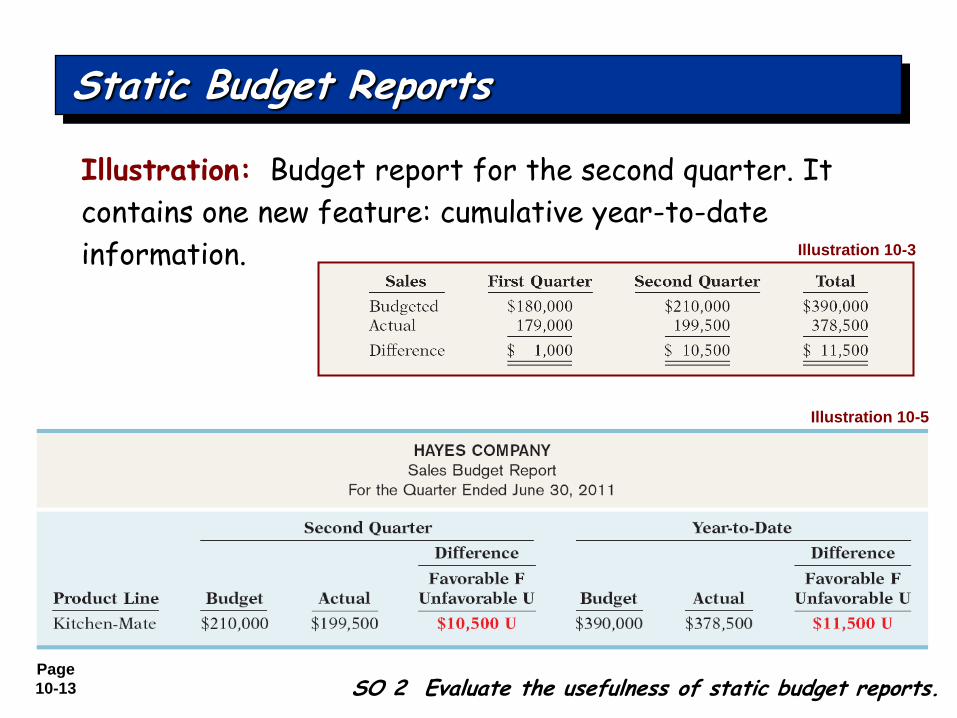
Illustration 10-5
SO 2 Evaluate the usefulness of static budget reports.
Static Budget Reports
Illustration: Budget report for the second quarter. It
contains one new feature: cumulative year-to-date
information. Illustration 10-3
Page
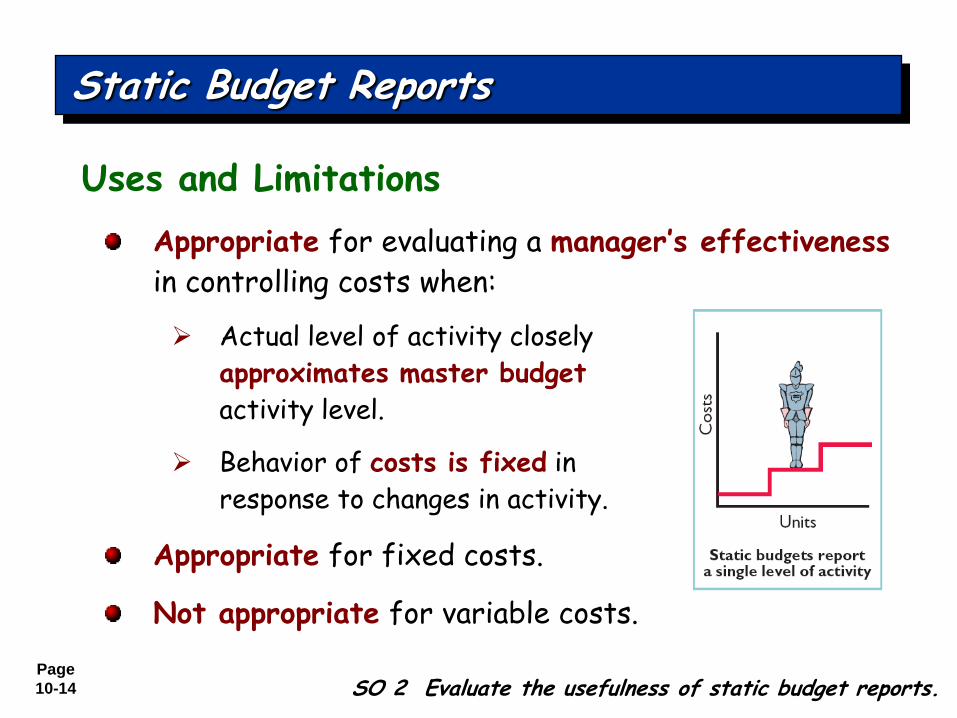
10-14
Appropriate for evaluating a manager’s effectiveness
in controlling costs when:
Actual level of activity closely
approximates master budget
activity level.
Behavior of costs is fixed in
response to changes in activity.
Appropriate for fixed costs.
Not appropriate for variable costs.
Uses and Limitations
SO 2 Evaluate the usefulness of static budget reports.
Static Budget Reports
Page
10-15
A static budget is useful in controlling costs when cost behavior is:
a. Mixed.
b. Fixed.
c. Variable.
d. Linear.
Review Question
SO 2 Evaluate the usefulness of static budget reports.
Static Budget Reports
a. Mixed.
b. Fixed.
c. Variable.
d. Linear.
Page
10-16
SO 3 Explain the development of flexible budgets and the usefulness of flexible budget reports.
Flexible Budgets
Budgetary process more useful if it is adaptable
to changes in operating conditions.
Projects budget data for various levels of
activity.
Essentially, a series of static budgets at different
activity levels.
Can be prepared for each type of budget in the
master budget.
Page
10-17 SO 3
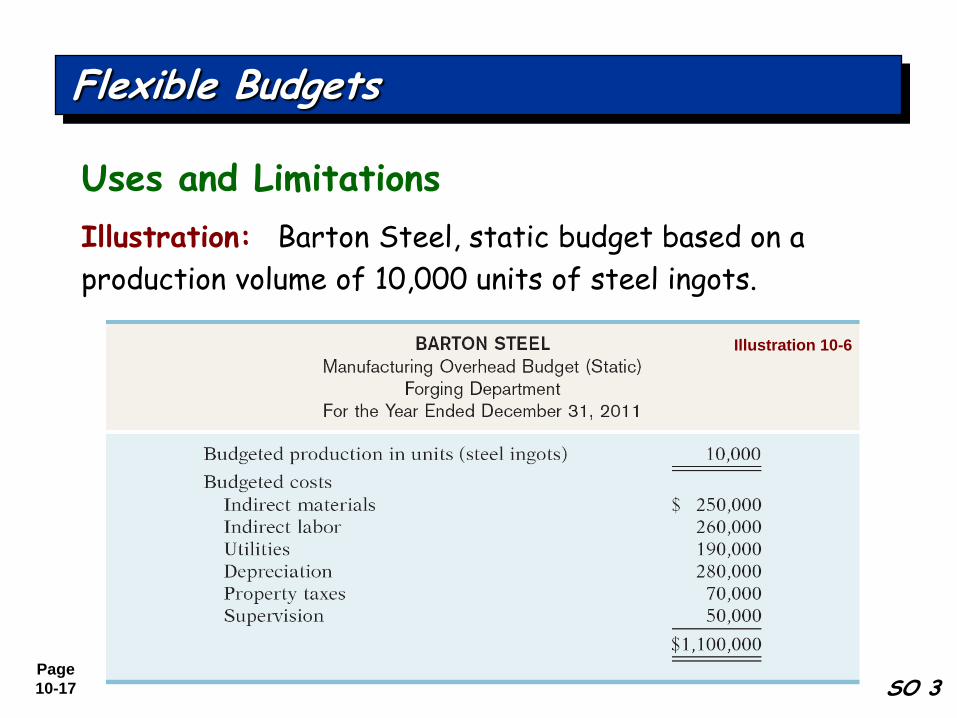
Flexible Budgets
Illustration: Barton Steel, static budget based on a
production volume of 10,000 units of steel ingots.
Uses and Limitations
Illustration 10-6
Page
10-18 SO 3
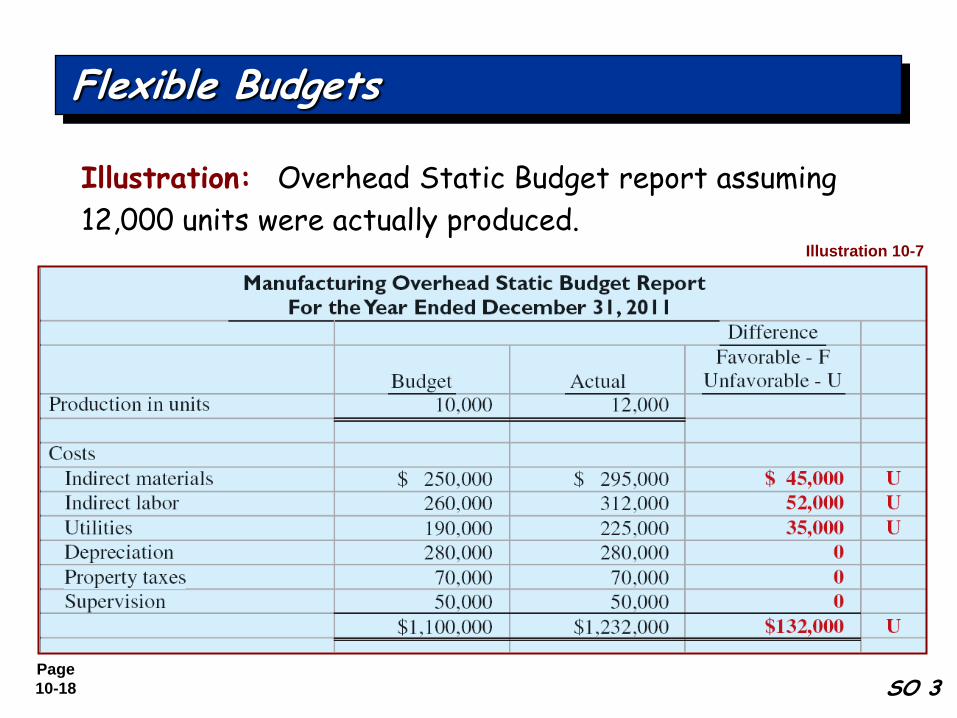
Flexible Budgets
Illustration: Overhead Static Budget report assuming
12,000 units were actually produced.Illustration 10-7
Page
10-19 SO 3
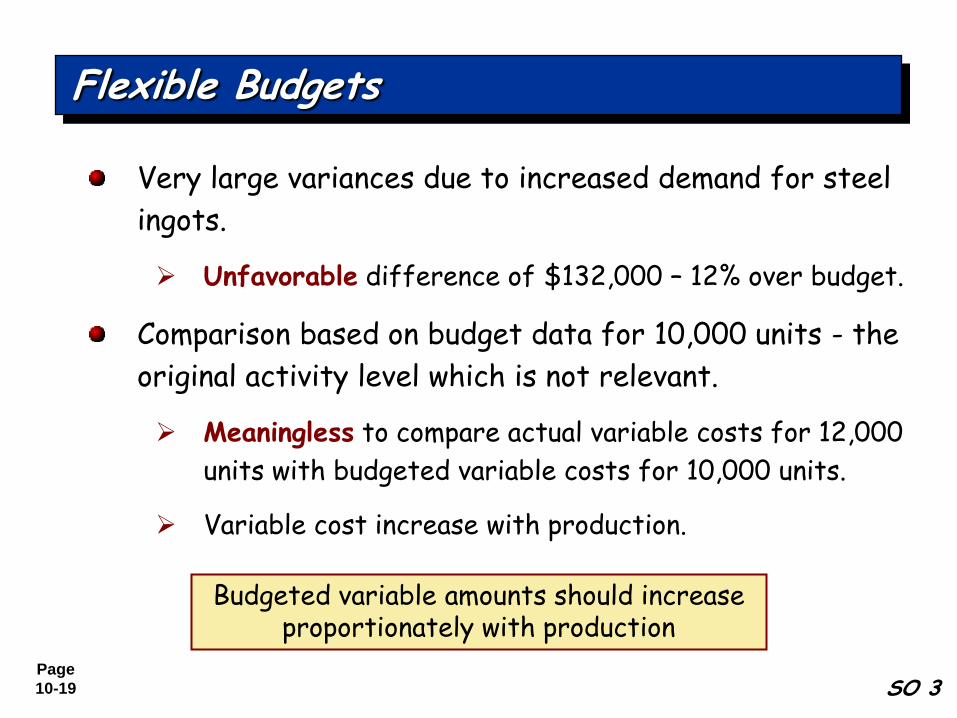
Flexible Budgets
Very large variances due to increased demand for steel
ingots.
Unfavorable difference of $132,000 – 12% over budget.
Comparison based on budget data for 10,000 units - the
original activity level which is not relevant.
Meaningless to compare actual variable costs for 12,000
units with budgeted variable costs for 10,000 units.
Variable cost increase with production.
Budgeted variable amounts should increase proportionately with production
Page
10-20
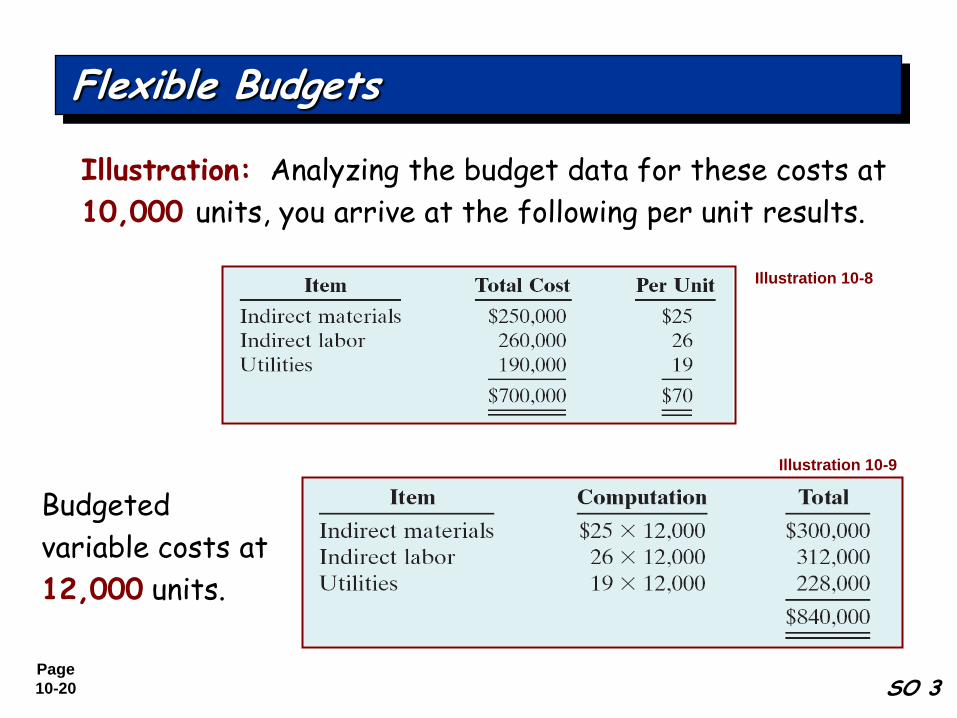
Illustration: Analyzing the budget data for these costs at
10,000 units, you arrive at the following per unit results.
Illustration 10-8
Illustration 10-9
SO 3
Flexible Budgets
Budgeted
variable costs at
12,000 units.
Page
10-21
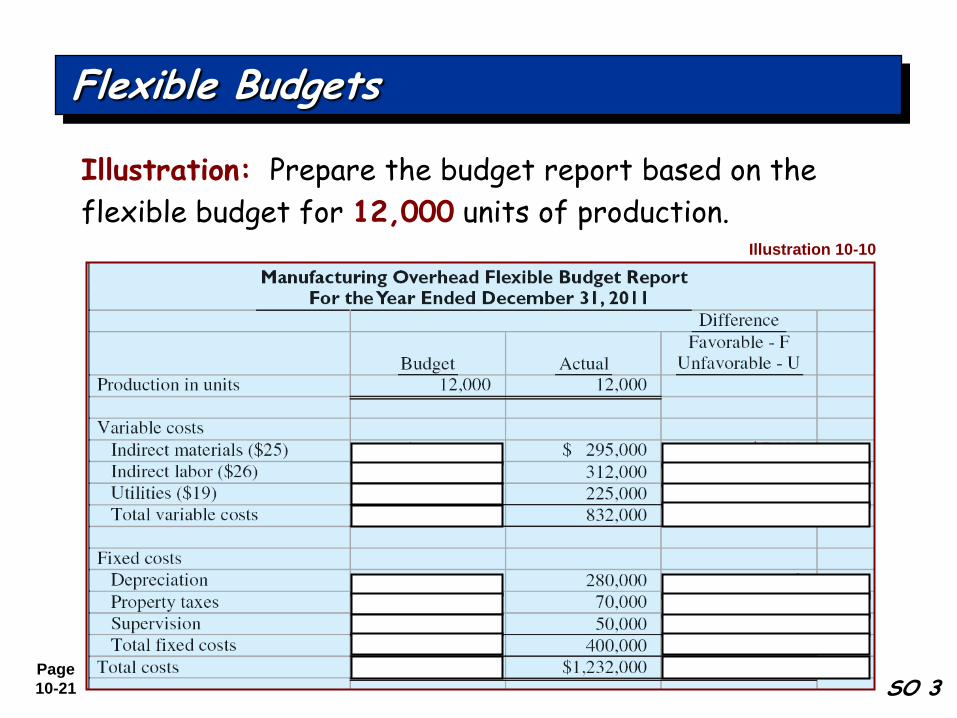
Illustration: Prepare the budget report based on the
flexible budget for 12,000 units of production.Illustration 10-10
SO 3
Flexible Budgets
Page
10-22
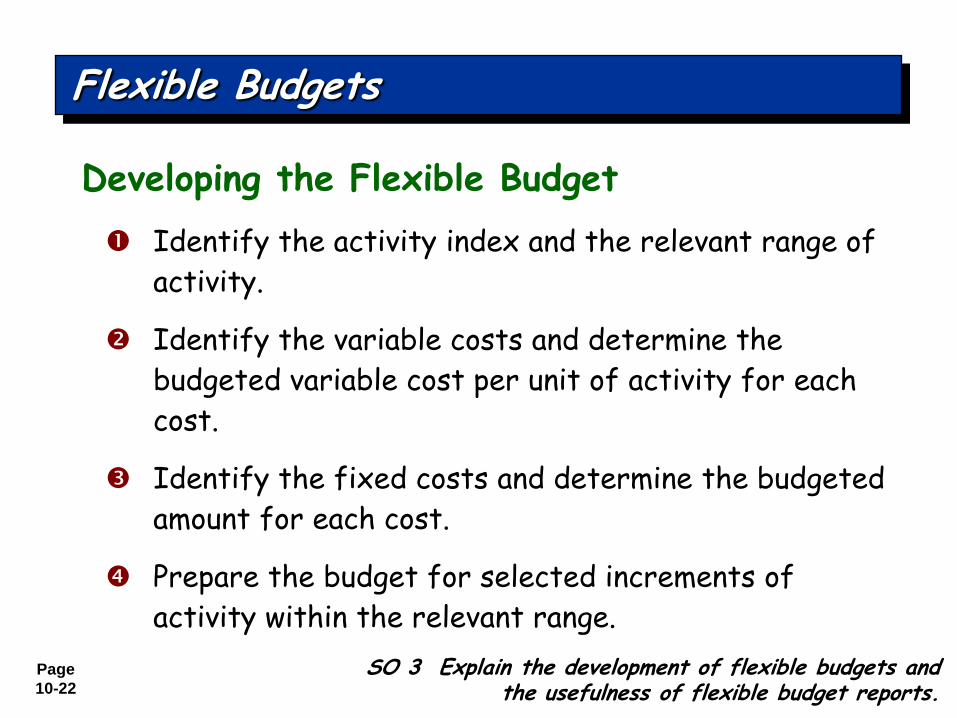
Identify the activity index and the relevant range of
activity.
Identify the variable costs and determine the
budgeted variable cost per unit of activity for each
cost.
Identify the fixed costs and determine the budgeted
amount for each cost.
Prepare the budget for selected increments of
activity within the relevant range.
Developing the Flexible Budget
Flexible Budgets
SO 3 Explain the development of flexible budgets and the usefulness of flexible budget reports.
Page
10-23
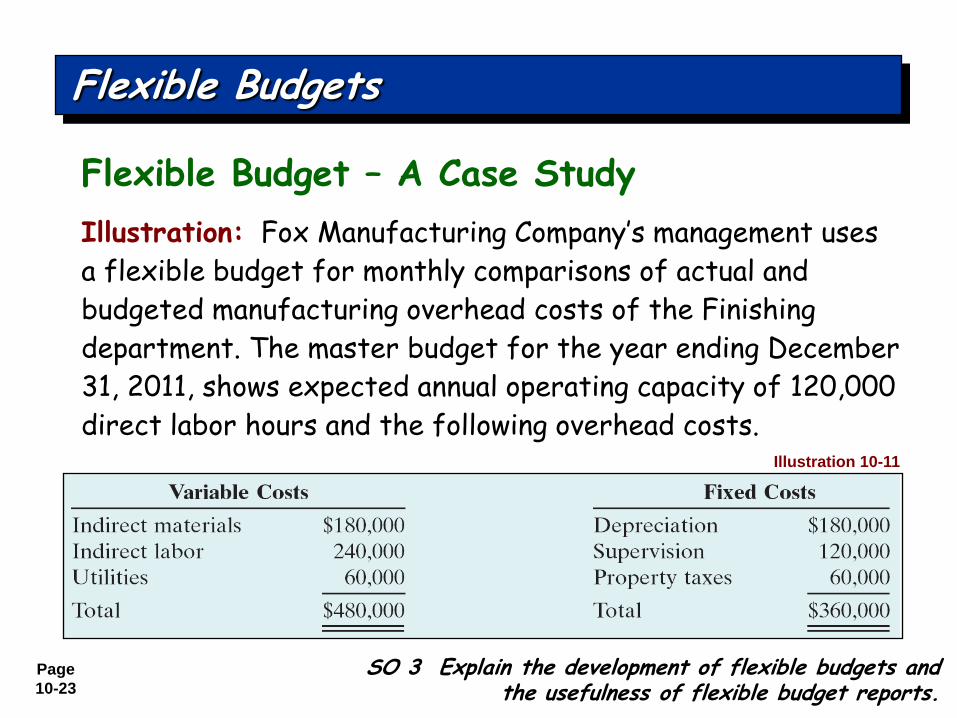
Illustration: Fox Manufacturing Company’s management uses
a flexible budget for monthly comparisons of actual and
budgeted manufacturing overhead costs of the Finishing
department. The master budget for the year ending December
31, 2011, shows expected annual operating capacity of 120,000
direct labor hours and the following overhead costs.
Flexible Budget – A Case Study
Flexible Budgets
SO 3 Explain the development of flexible budgets and the usefulness of flexible budget reports.
Illustration 10-11
Page
10-24
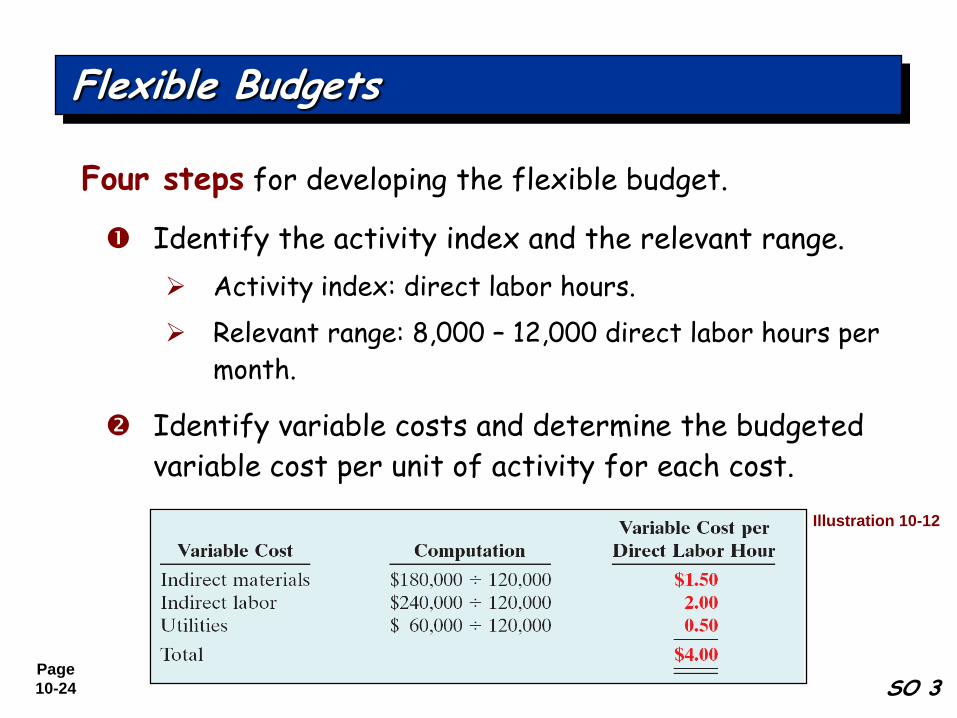
Four steps for developing the flexible budget.
Identify the activity index and the relevant range.
Activity index: direct labor hours.
Relevant range: 8,000 – 12,000 direct labor hours per
month.
Identify variable costs and determine the budgeted
variable cost per unit of activity for each cost.
Flexible Budgets
Illustration 10-12
SO 3
Page
10-25
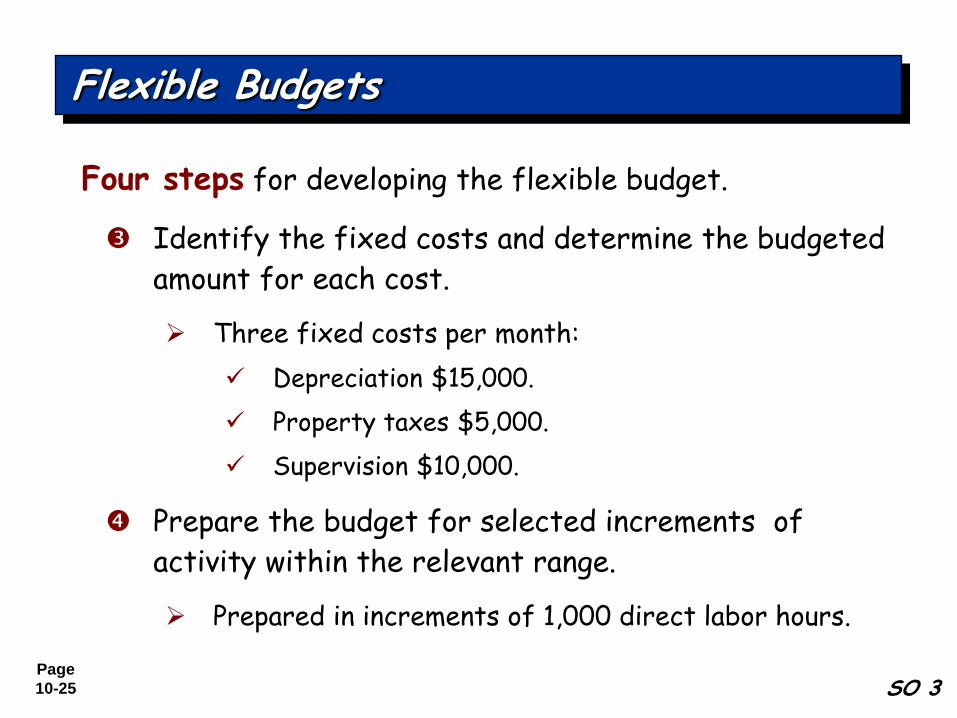
Four steps for developing the flexible budget.
Identify the fixed costs and determine the budgeted
amount for each cost.
Three fixed costs per month:
Depreciation $15,000.
Property taxes $5,000.
Supervision $10,000.
Prepare the budget for selected increments of
activity within the relevant range.
Prepared in increments of 1,000 direct labor hours.
Flexible Budgets
SO 3
Page
10-26
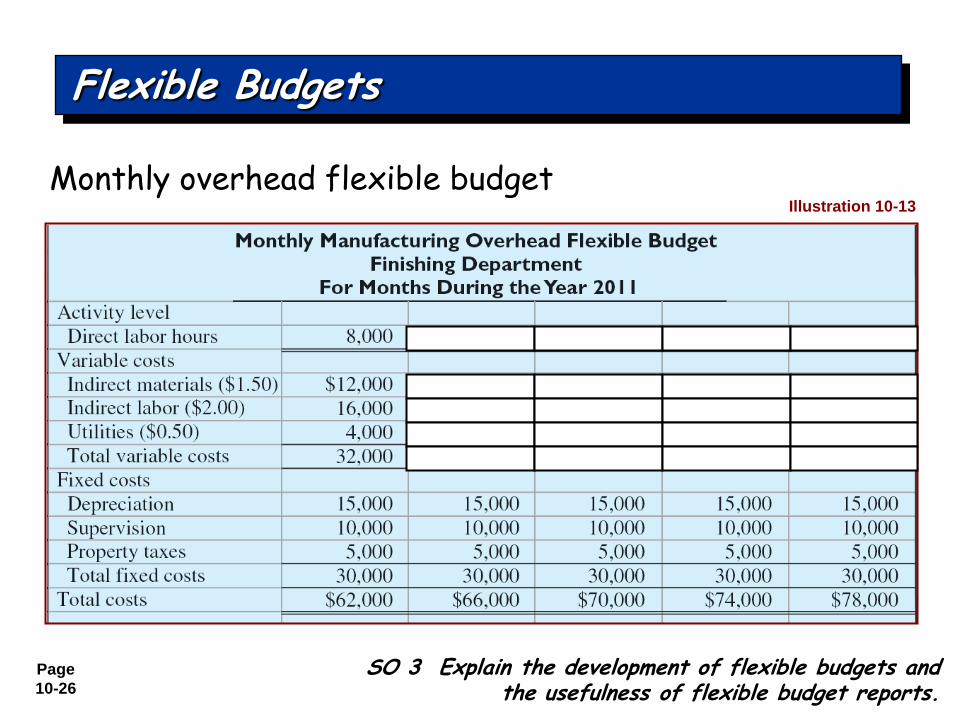
Monthly overhead flexible budget
Flexible Budgets
Illustration 10-13
SO 3 Explain the development of flexible budgets and the usefulness of flexible budget reports.
Page
10-27
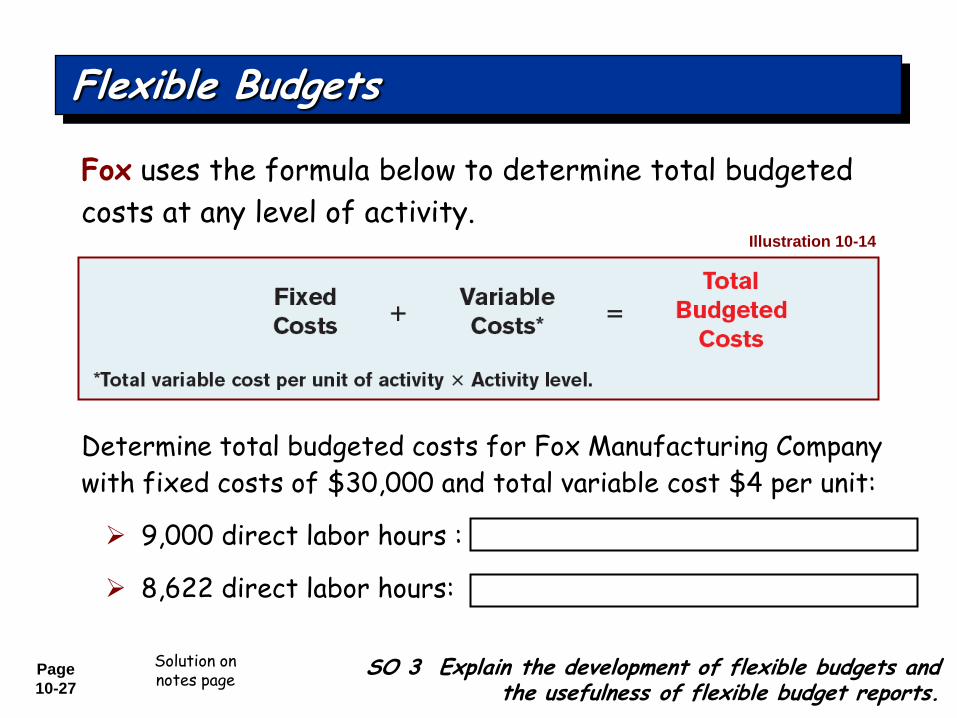
Determine total budgeted costs for Fox Manufacturing Company
with fixed costs of $30,000 and total variable cost $4 per unit:
9,000 direct labor hours : $30,000 + ($4 x 9,000) = $66,000
8,622 direct labor hours: $30,000 + ($4 x 8,622) = $64,488
Fox uses the formula below to determine total budgeted
costs at any level of activity.
Flexible Budgets
Illustration 10-14
SO 3 Explain the development of flexible budgets and the usefulness of flexible budget reports.
Solution on notes page
Page
10-28
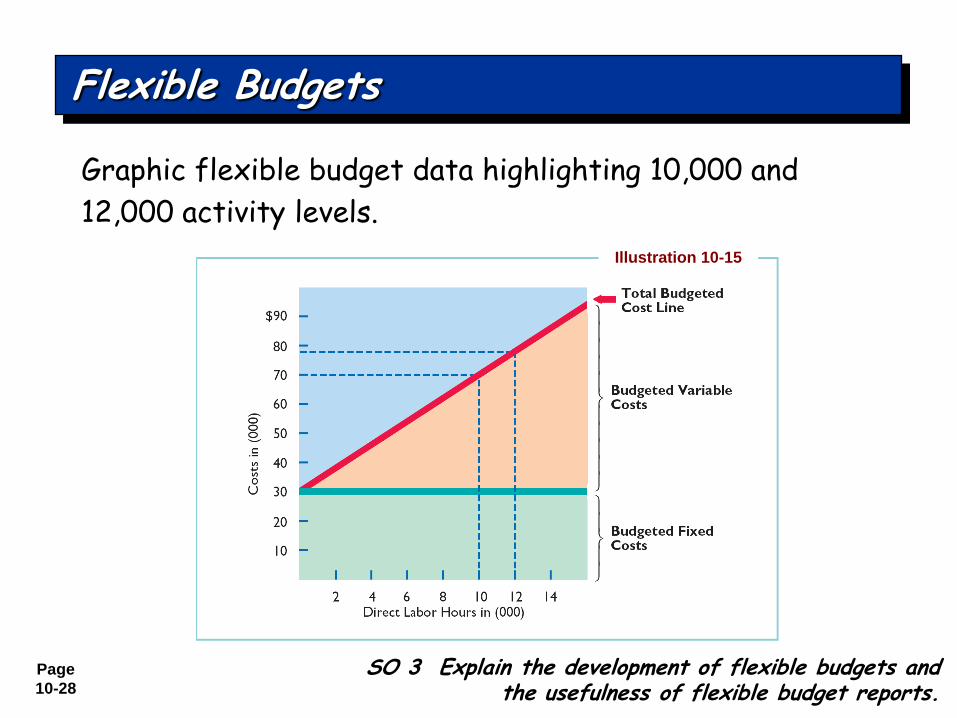
Graphic flexible budget data highlighting 10,000 and
12,000 activity levels.
Illustration 10-15
Flexible Budgets
SO 3 Explain the development of flexible budgets and the usefulness of flexible budget reports.
Page
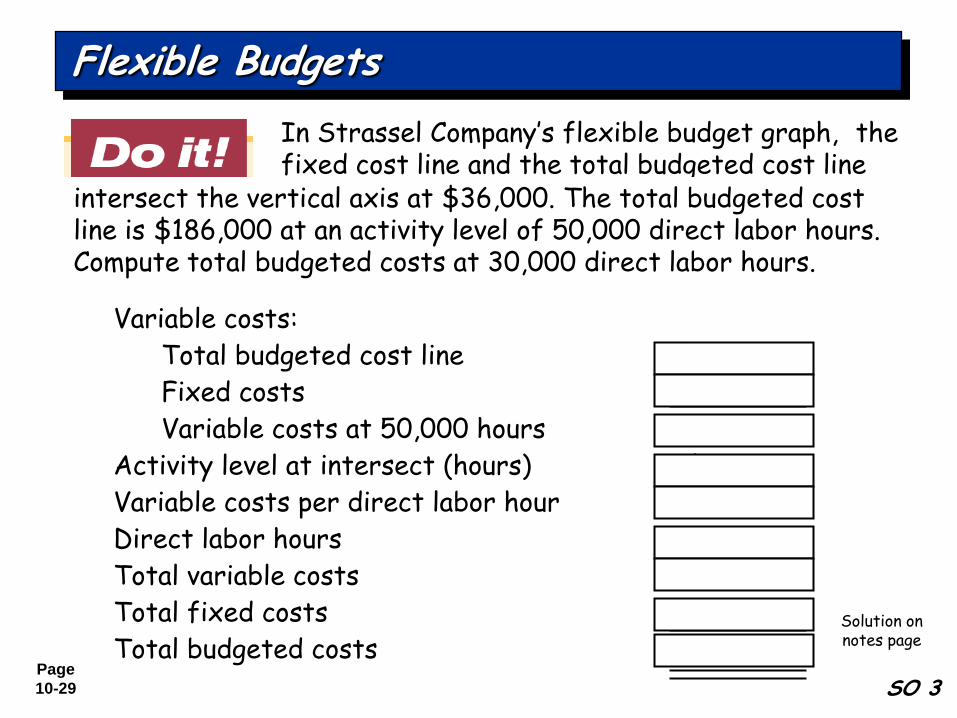
10-29
Variable costs:
Total budgeted cost line $ 186,000
Fixed costs - 36,000
Variable costs at 50,000 hours 150,000
Activity level at intersect (hours) / 50,000
Variable costs per direct labor hour $ 3
Direct labor hours x 30,000
Total variable costs 90,000
Total fixed costs + 36,000
Total budgeted costs $ 126,000
Flexible Budgets
SO 3
In Strassel Company’s flexible budget graph, the fixed cost line and the total budgeted cost line
Solution on notes page
intersect the vertical axis at $36,000. The total budgeted cost line is $186,000 at an activity level of 50,000 direct labor hours. Compute total budgeted costs at 30,000 direct labor hours.
Page
10-30
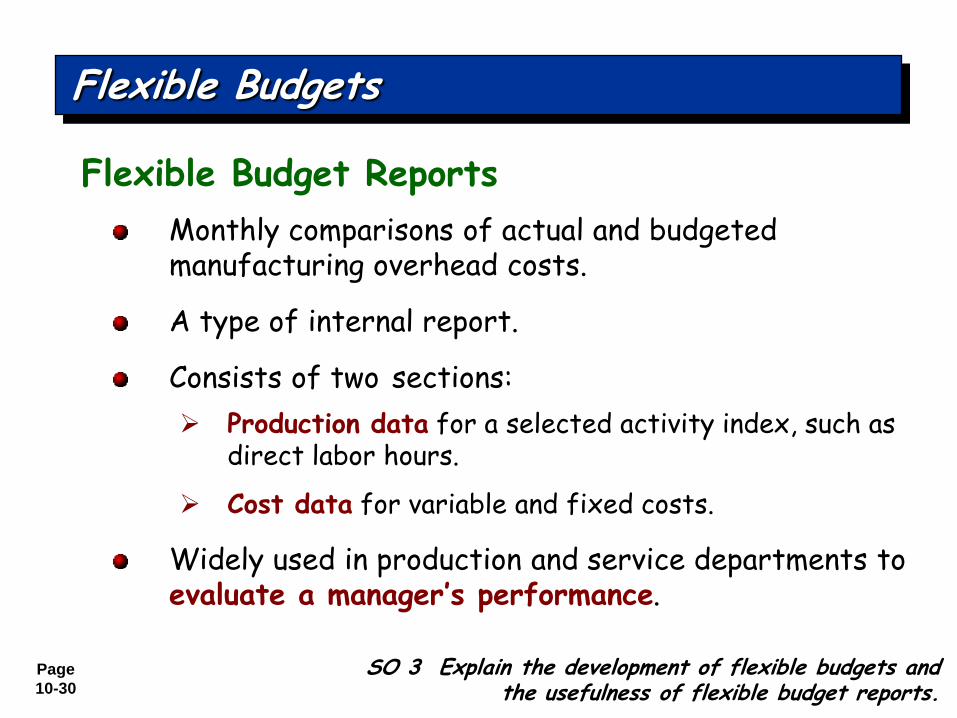
Monthly comparisons of actual and budgeted manufacturing overhead costs.
A type of internal report.
Consists of two sections:
Production data for a selected activity index, such as direct labor hours.
Cost data for variable and fixed costs.
Widely used in production and service departments to evaluate a manager’s performance.
Flexible Budgets
SO 3 Explain the development of flexible budgets and the usefulness of flexible budget reports.
Flexible Budget Reports
Page
10-31
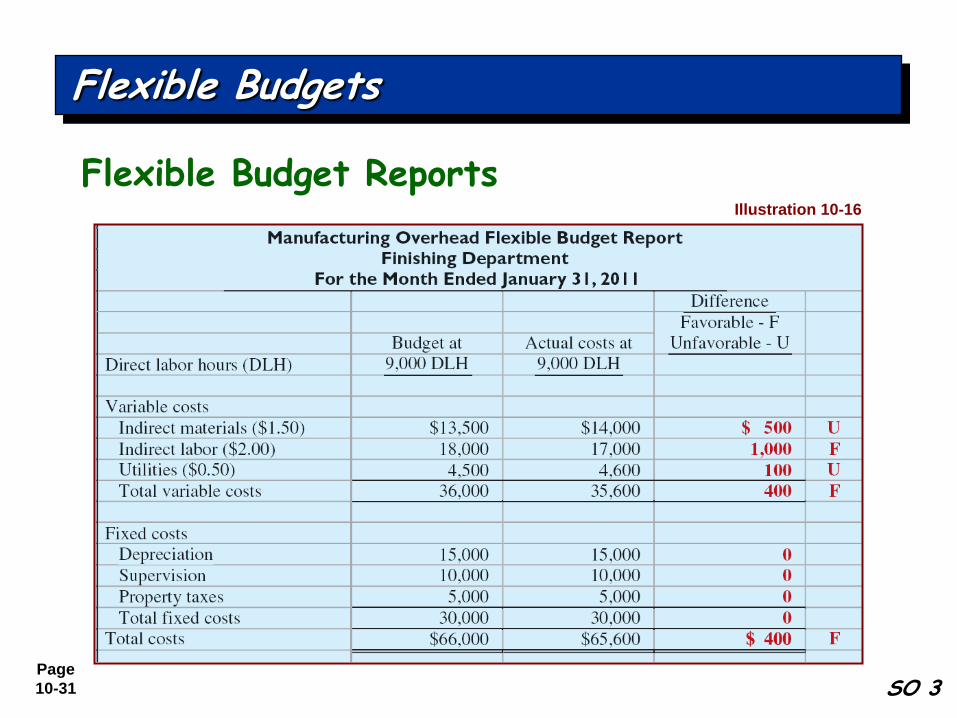
Flexible Budgets
Illustration 10-16
Flexible Budget Reports
SO 3

Page
10-32
Page
10-33
Management’s review of budget report focused on
differences between actual and planned results.
Able to focus on problem areas.
Investigate only material and controllable exceptions.
Express materiality as a percentage difference from
budget - either over or under budget.
Controllability relates to items controllable by
manager.
Flexible Budgets
SO 3 Explain the development of flexible budgets and the usefulness of flexible budget reports.
Management by Exception
Page
10-34
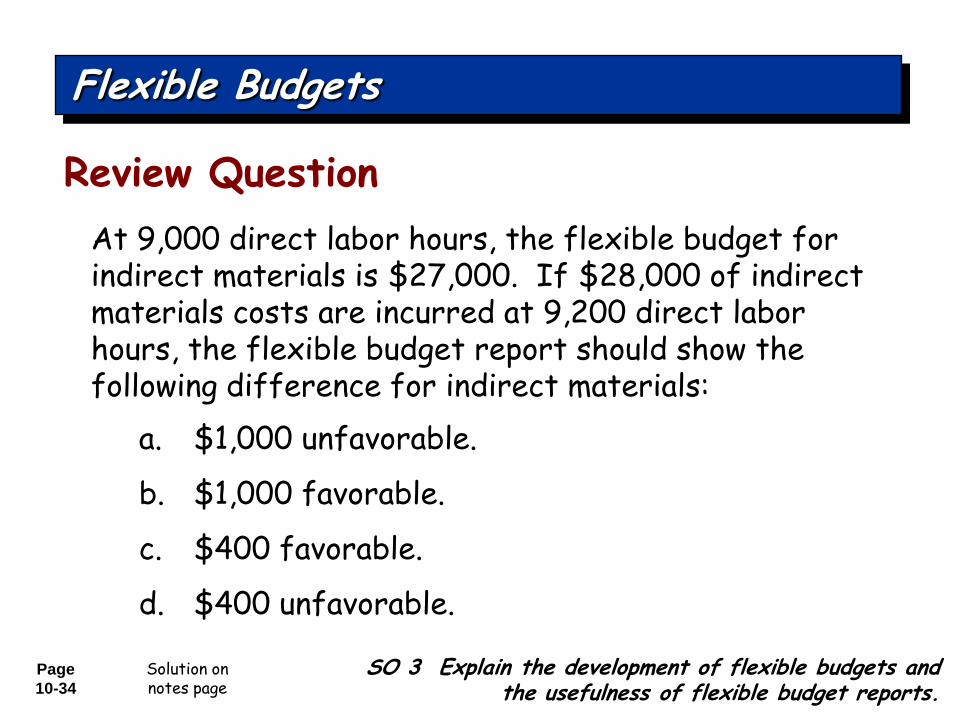
a. $1,000 unfavorable.
b. $1,000 favorable.
c. $400 favorable.
d. $400 unfavorable.
At 9,000 direct labor hours, the flexible budget for indirect materials is $27,000. If $28,000 of indirect materials costs are incurred at 9,200 direct labor hours, the flexible budget report should show the following difference for indirect materials:
Review Question
Flexible Budgets
SO 3 Explain the development of flexible budgets and the usefulness of flexible budget reports.
a. $1,000 unfavorable.
b. $1,000 favorable.
c. $400 favorable.
d. $400 unfavorable.
Solution on notes page
Page
10-35
Flexible Budgets
SO 3
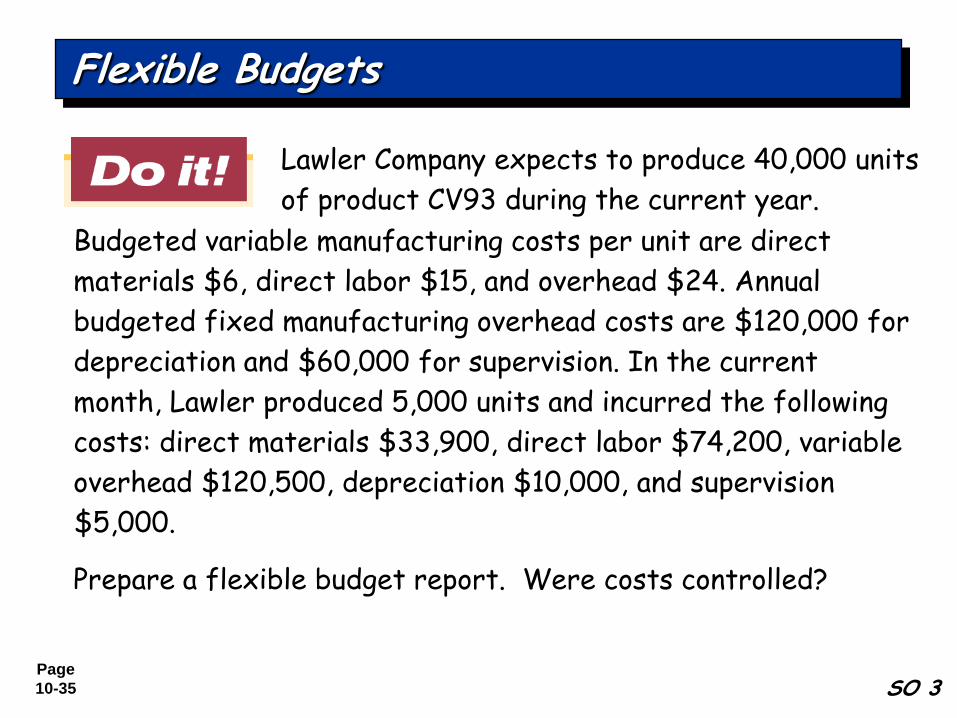
Lawler Company expects to produce 40,000 units
of product CV93 during the current year.
Budgeted variable manufacturing costs per unit are direct
materials $6, direct labor $15, and overhead $24. Annual
budgeted fixed manufacturing overhead costs are $120,000 for
depreciation and $60,000 for supervision. In the current
month, Lawler produced 5,000 units and incurred the following
costs: direct materials $33,900, direct labor $74,200, variable
overhead $120,500, depreciation $10,000, and supervision
$5,000.
Prepare a flexible budget report. Were costs controlled?
Page
10-36
Flexible Budgets
SO 3
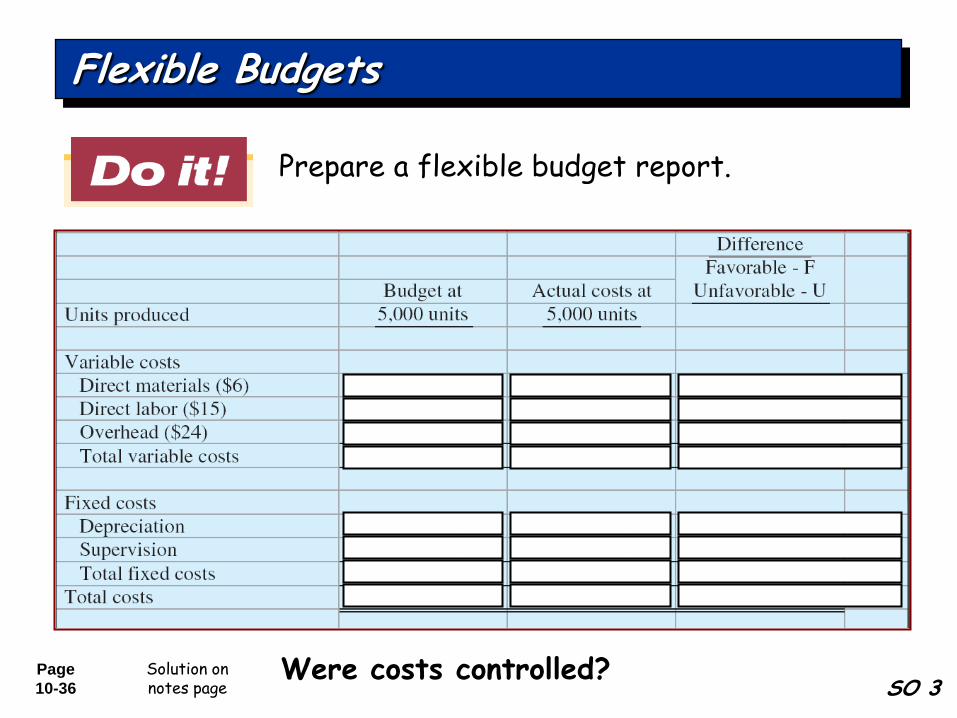
Prepare a flexible budget report.
Were costs controlled? Solution on notes page
Page
10-37
Flexible Budgets
SO 3
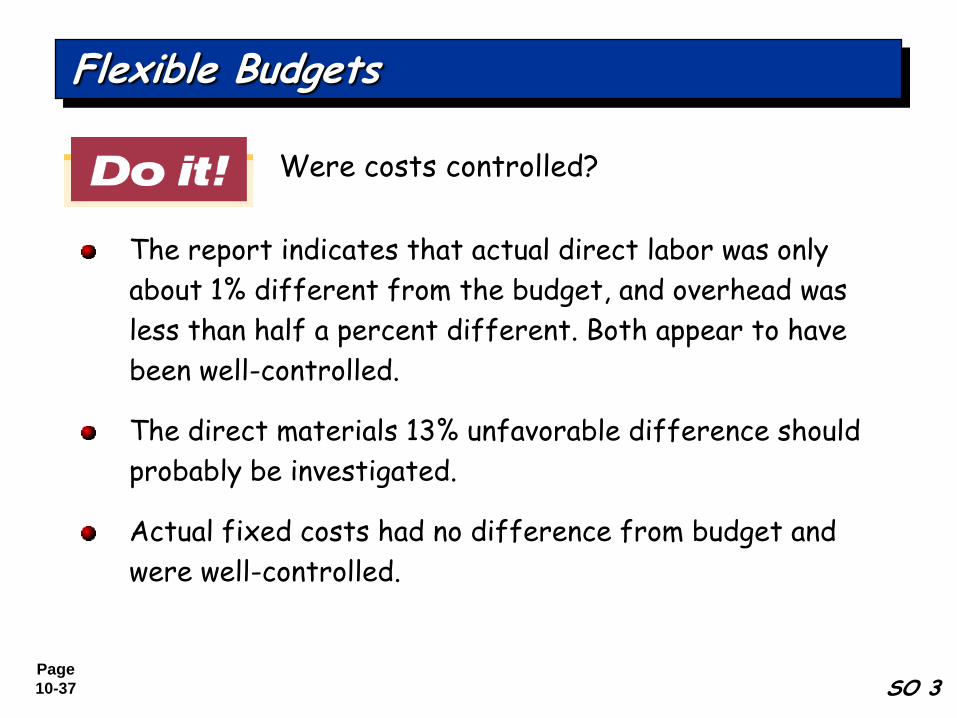
Were costs controlled?
The report indicates that actual direct labor was only
about 1% different from the budget, and overhead was
less than half a percent different. Both appear to have
been well-controlled.
The direct materials 13% unfavorable difference should
probably be investigated.
Actual fixed costs had no difference from budget and
were well-controlled.
Page
10-38
Accumulating and reporting costs on the basis of the
manager who has the authority to make the day-to-day
decisions about the items.
Conditions:
1. Costs and revenues can be directly associated with the
specific level of management responsibility.
2. Costs and revenues can be controlled by employees at the
level of responsibility with which they are associated.
3. Budget data can be developed for evaluating the manager’s
effectiveness in controlling the costs and revenues.
SO 4 Describe the concept of responsibility accounting.
The Concept of Responsibility Accounting
Page
10-39
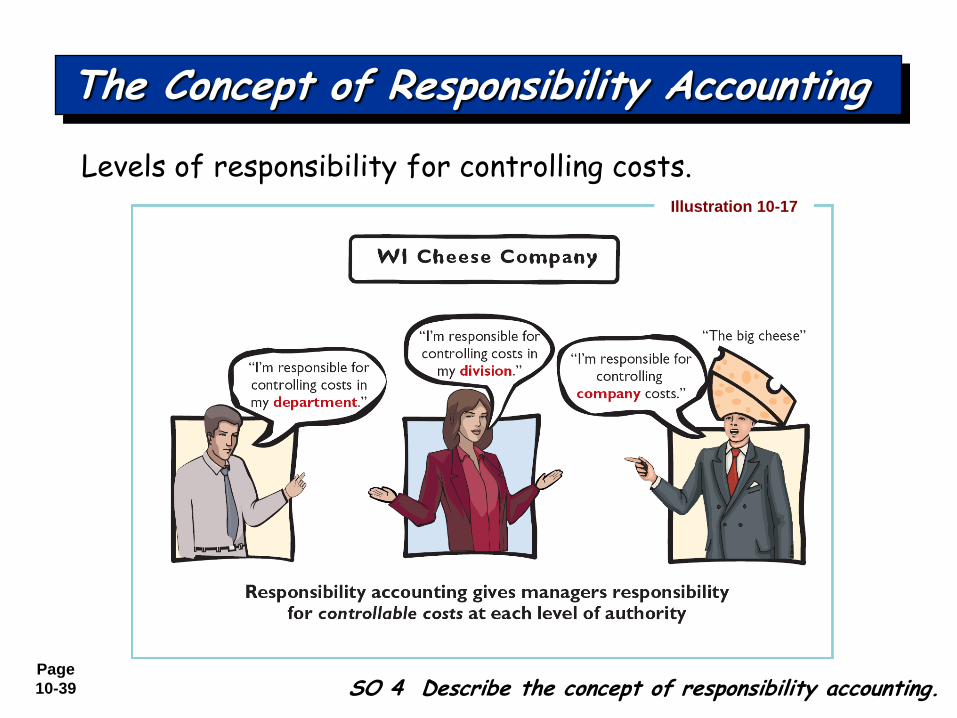
Levels of responsibility for controlling costs.Illustration 10-17
SO 4 Describe the concept of responsibility accounting.
The Concept of Responsibility Accounting
Page
10-40
Responsibility center - any individual who has control
and is accountable for activities.
May extend to any level of management.
Especially valuable in a decentralized company.
Control of operations delegated to many managers
throughout the organization.
Segment – area of responsibility for which reports are
prepared.
SO 4 Describe the concept of responsibility accounting.
The Concept of Responsibility Accounting
Page
10-41
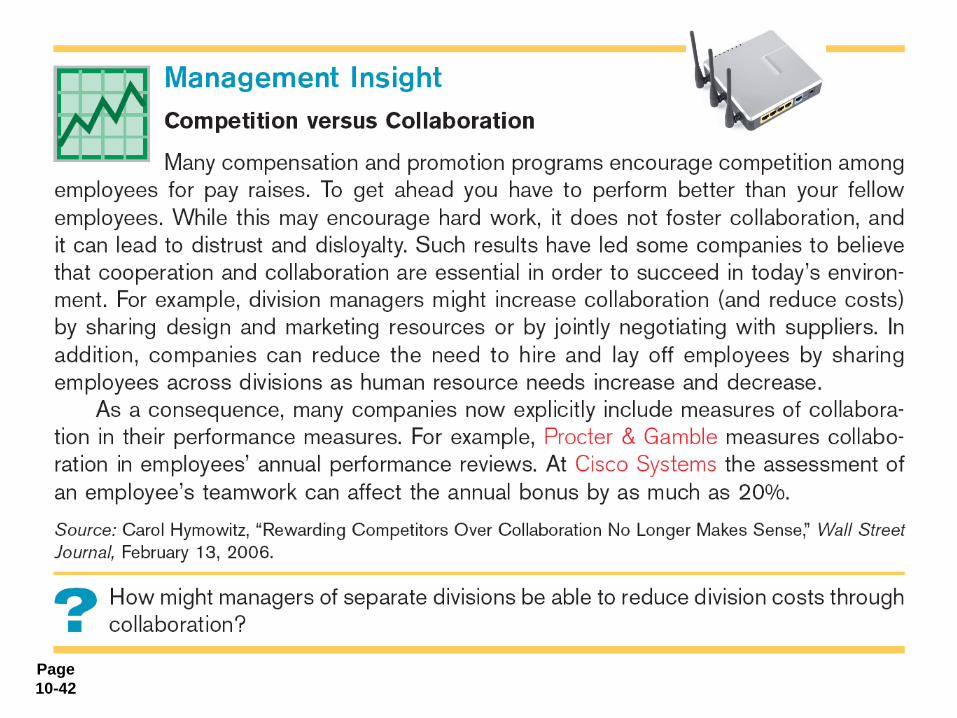
Two differences from budgeting in reporting costs and
revenues:
Distinguishes between controllable and noncontrollable
costs.
Emphasizes or includes only items controllable by the
individual manager in performance reports.
Applies to both profit and not-for-profit entities.
Profit entities: maximize net income.
Not-for-profit: minimize cost of providing services.
SO 4 Describe the concept of responsibility accounting.
The Concept of Responsibility Accounting
Page
10-42
Page
10-43
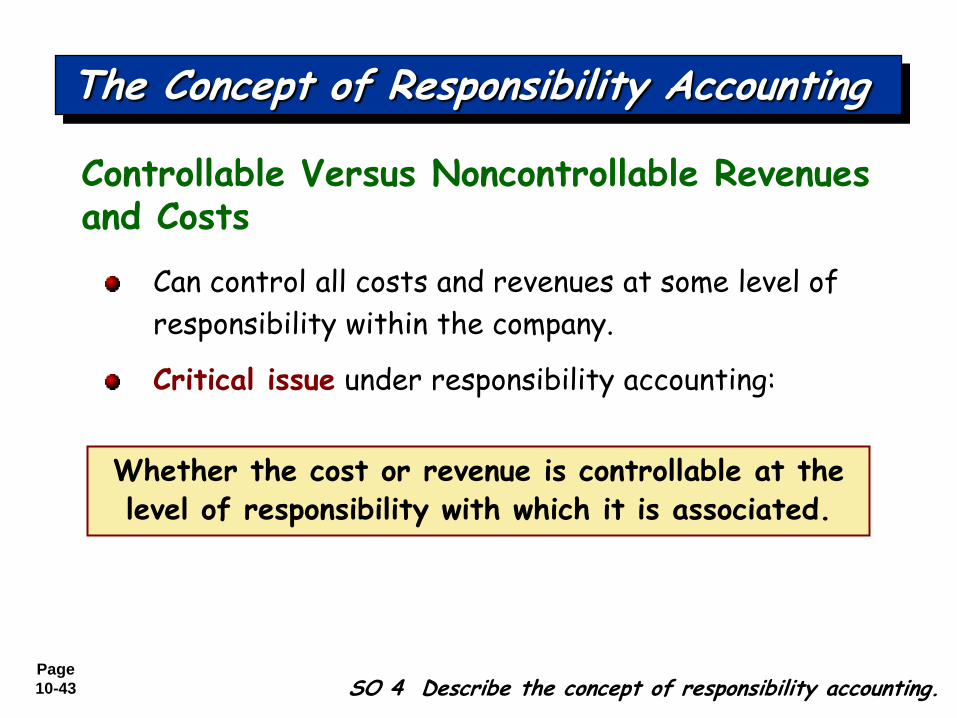
Can control all costs and revenues at some level of
responsibility within the company.
Critical issue under responsibility accounting:
SO 4 Describe the concept of responsibility accounting.
The Concept of Responsibility Accounting
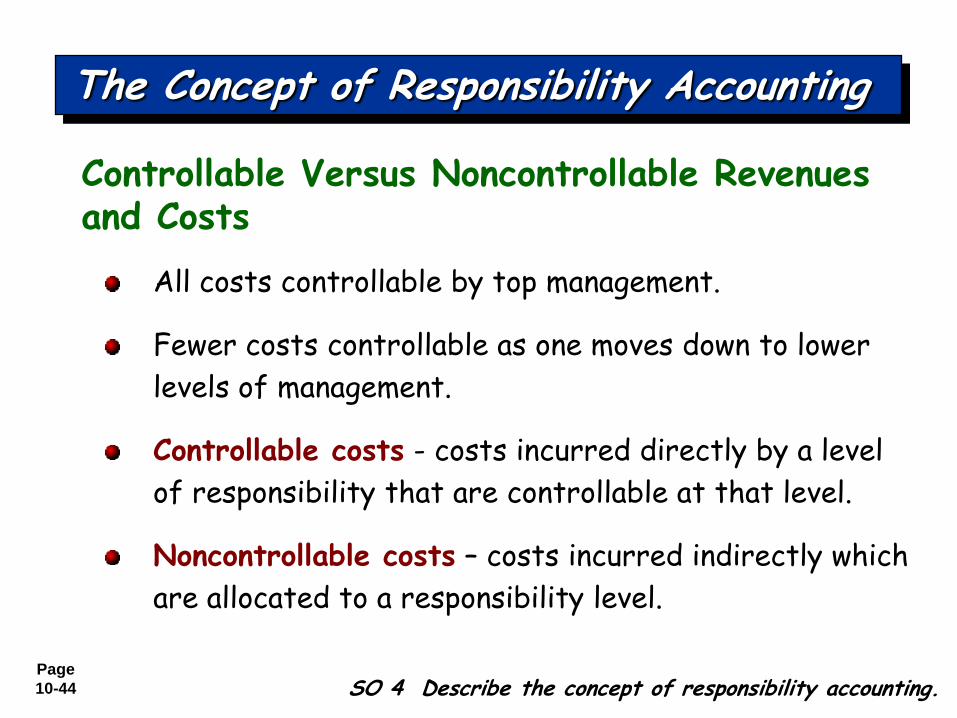
Controllable Versus Noncontrollable Revenues and Costs
Whether the cost or revenue is controllable at the level of responsibility with which it is associated.
Page
10-44
All costs controllable by top management.
Fewer costs controllable as one moves down to lower
levels of management.
Controllable costs - costs incurred directly by a level
of responsibility that are controllable at that level.
Noncontrollable costs – costs incurred indirectly which
are allocated to a responsibility level.
SO 4 Describe the concept of responsibility accounting.
The Concept of Responsibility Accounting
Controllable Versus Noncontrollable Revenues and Costs
Page
10-45
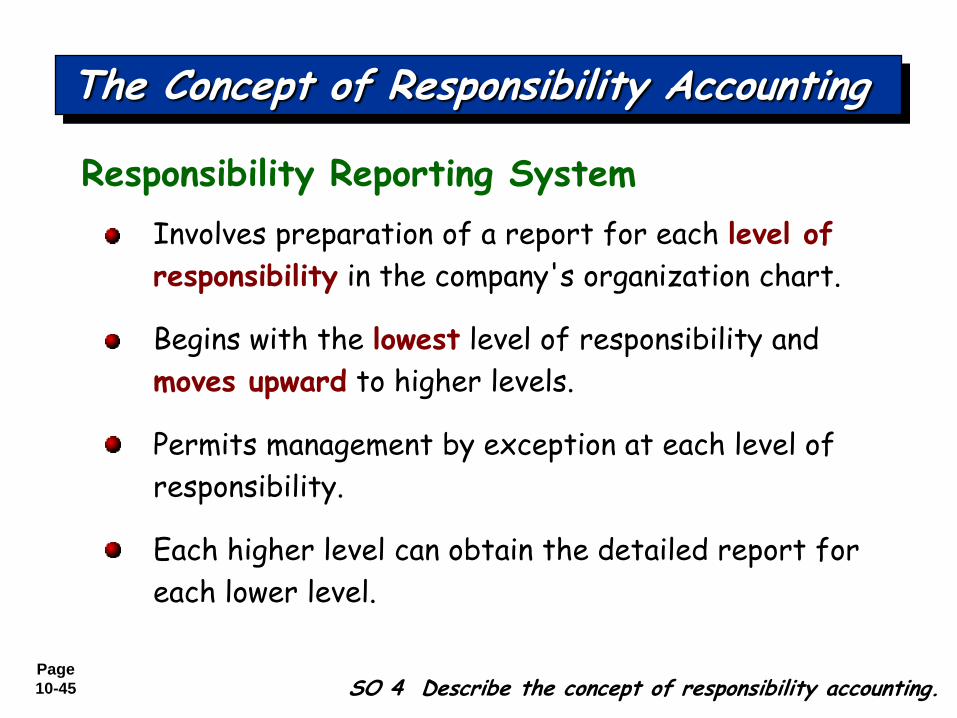
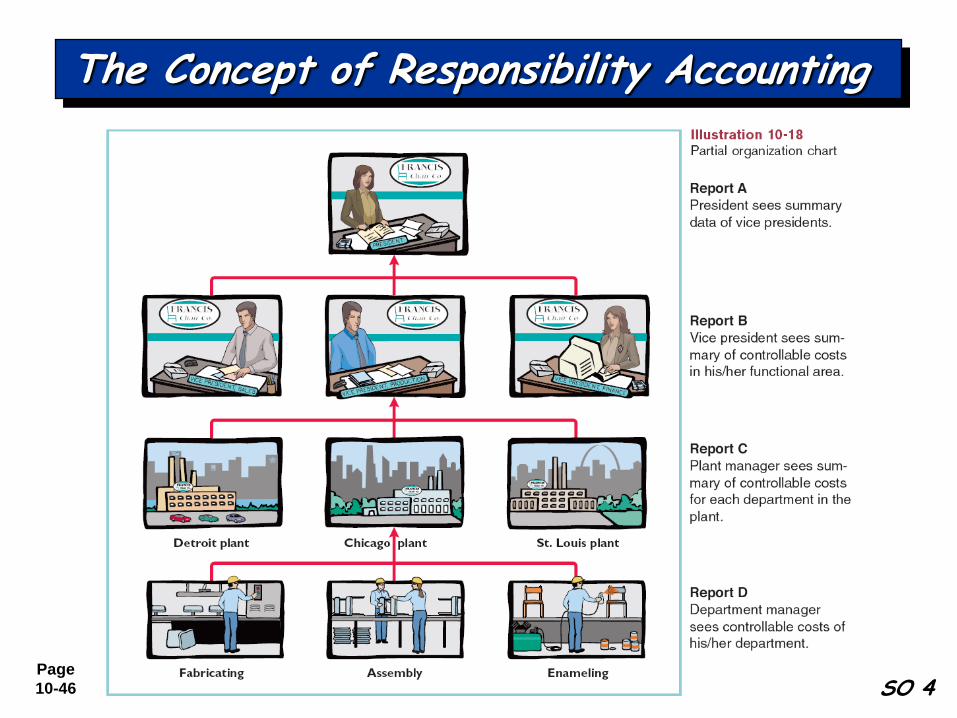
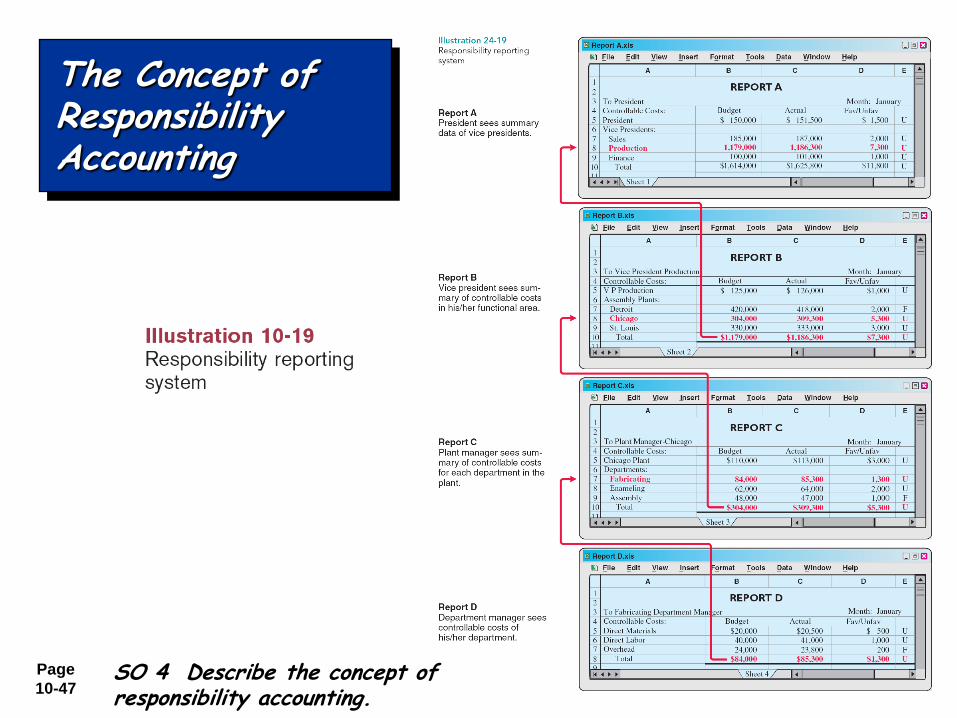
Involves preparation of a report for each level of
responsibility in the company's organization chart.
Begins with the lowest level of responsibility and
moves upward to higher levels.
Permits management by exception at each level of
responsibility.
Each higher level can obtain the detailed report for
each lower level.
SO 4 Describe the concept of responsibility accounting.
The Concept of Responsibility Accounting
Responsibility Reporting System
Page
10-46 SO 4
The Concept of Responsibility Accounting
Page
10-47SO 4 Describe the concept of responsibility accounting.
The Concept of Responsibility Accounting
Page
10-48
Also permits comparative evaluations.
Plant manager can rank each department manager’s
effectiveness in controlling manufacturing costs.
Comparative rankings provide incentive for a manager
to control costs.
SO 4 Describe the concept of responsibility accounting.
The Concept of Responsibility Accounting
Responsibility Reporting System
Page
10-49
Three basic types:
Cost centers
Profit centers
Investment centers
Type indicates degree of responsibility that
managers have for the performance of the center.
SO 4 Describe the concept of responsibility accounting.
Types of Responsibility Centers
Page
10-50
Cost Center
Incurs costs but does not directly generate
revenues.
Managers have authority to incur costs.
Managers evaluated on ability to control costs.
Usually a production department or a service
department.
SO 4 Describe the concept of responsibility accounting.
Types of Responsibility Centers
Page
10-51
Profit Center
Incurs costs and generates revenues.
Managers judged on profitability of center.
Examples include individual departments of a retail
store or branch bank offices.
SO 4 Describe the concept of responsibility accounting.
Types of Responsibility Centers
Page
10-52
Investment Center
Incurs costs, generates revenues, and has
investment funds available for use.
Manager evaluated on profitability of center and
rate of return earned on funds.
Often a subsidiary company or a product line.
Manager able to control or significantly influence
investment decisions such as plant expansion.
SO 4 Describe the concept of responsibility accounting.
Types of Responsibility Centers
Page
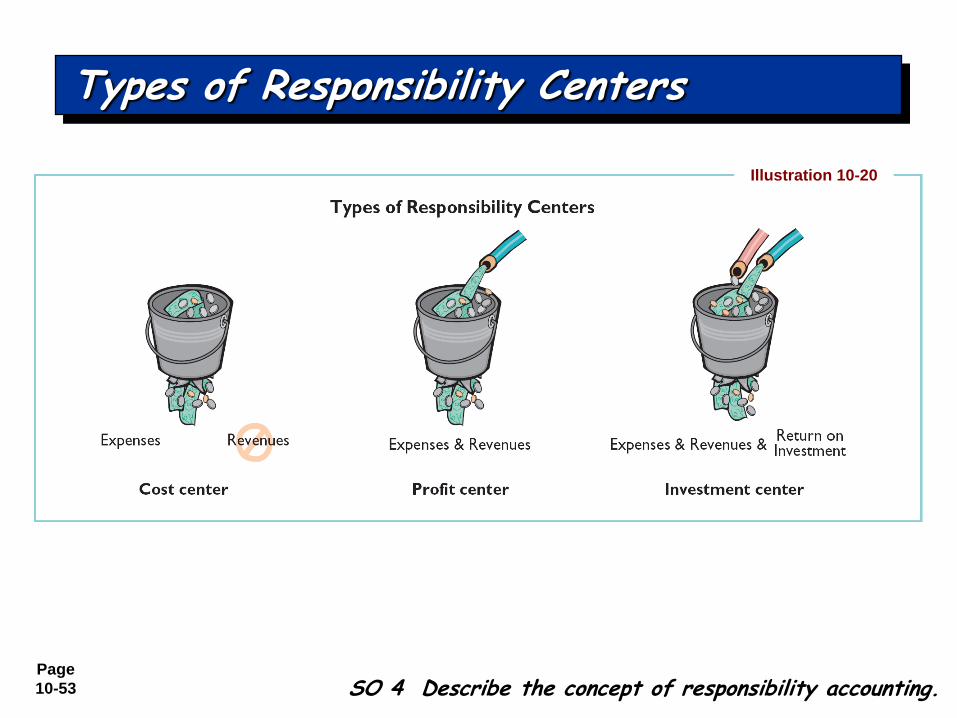
10-53
Illustration 10-20
SO 4 Describe the concept of responsibility accounting.
Types of Responsibility Centers
Page
10-54
Under responsibility accounting, the evaluation of a manager’s performance is based on matters that the manager:
a. Directly controls.
b. Directly and indirectly controls.
c. Indirectly controls.
d. Has shared responsibility for with another manager.
Review Question
SO 4 Describe the concept of responsibility accounting.
Types of Responsibility Centers
a. Directly controls.
b. Directly and indirectly controls.
c. Indirectly controls.
d. Has shared responsibility for with another manager.
Solution on notes page
Page
10-55
Based on a manager’s ability to meet budgeted goals
for controllable costs.
Results in responsibility reports which compare actual
controllable costs with flexible budget data.
Include only controllable costs in reports.
No distinction between variable and fixed costs.
SO 5 Indicate the features of responsibility reports for cost centers.
Types of Responsibility Centers
Responsibility Accounting for Cost Centers
Page
10-56
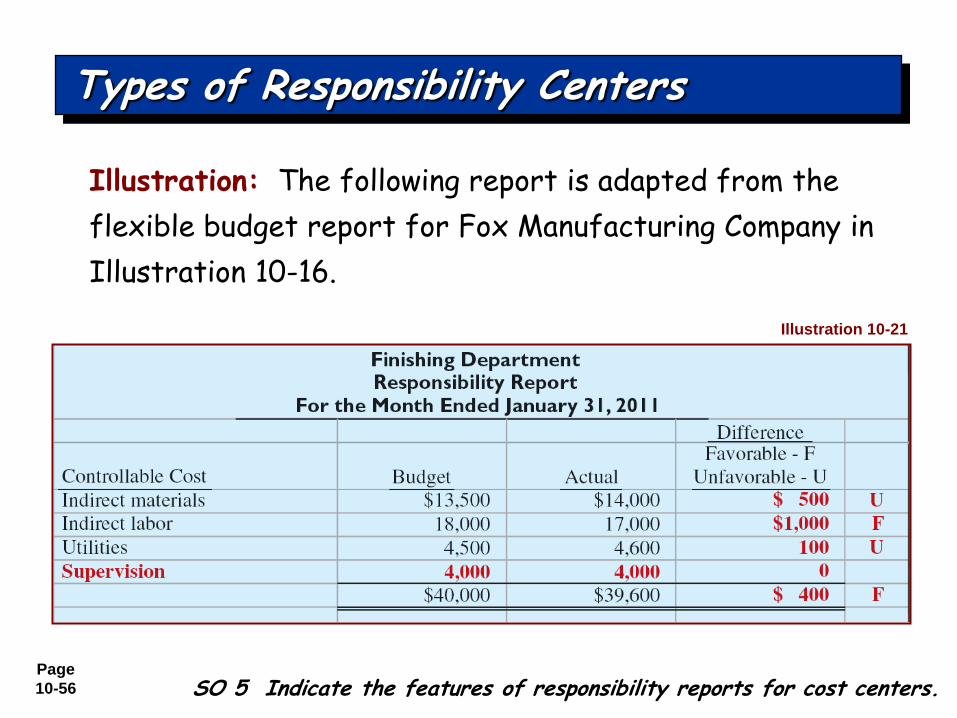
Illustration: The following report is adapted from the
flexible budget report for Fox Manufacturing Company in
Illustration 10-16.
SO 5 Indicate the features of responsibility reports for cost centers.
Types of Responsibility Centers
Illustration 10-21
Page
10-57
Illustration: The previous report assumes:
Finishing Department manager is able to control all
manufacturing overhead costs except depreciation,
property taxes, and his own monthly salary of
$6,000.
Remaining $4,000 ($10,000 - $6,000) of supervision
costs are assumed to apply to other supervisory
personnel within the Finishing Department, whose
salaries are controllable by the manager.
SO 5 Indicate the features of responsibility reports for cost centers.
Types of Responsibility Centers
Page
10-58
Based on detailed information about both controllable
revenues and controllable costs.
Manager controls operating revenues earned, such as
sales.
Manager controls all variable costs incurred by the
center because they vary with sales.
SO 6 Identify the content of responsibility reports for profit centers.
Responsibility Accounting for Profit Centers
Page
10-59
Direct fixed costs
Relate specifically to one responsibility center.
Incurred for the sole benefit of the center.
Called traceable costs since they can be traced
directly to one center.
Most controllable by the profit center manager.
SO 6 Identify the content of responsibility reports for profit centers.
Responsibility Accounting for Profit Centers
Direct and Indirect Fixed Costs
Page
10-60
Indirect fixed costs
Pertain to a company's overall operating activities.
Incurred for the benefit of more than one profit
center.
Called common costs since they apply to more than one
center.
Most are not controllable by the profit center
manager.
SO 6 Identify the content of responsibility reports for profit centers.
Responsibility Accounting for Profit Centers
Direct and Indirect Fixed Costs
Page
10-61
Budgeted and actual controllable revenues and costs.
Uses cost-volume-profit income statement format:
Deduct controllable fixed costs from the contribution
margin.
Controllable margin - excess of contribution margin
over controllable fixed costs.
Do not report noncontrollable fixed costs.
SO 6 Identify the content of responsibility reports for profit centers.
Responsibility Accounting for Profit Centers
Responsibility Report
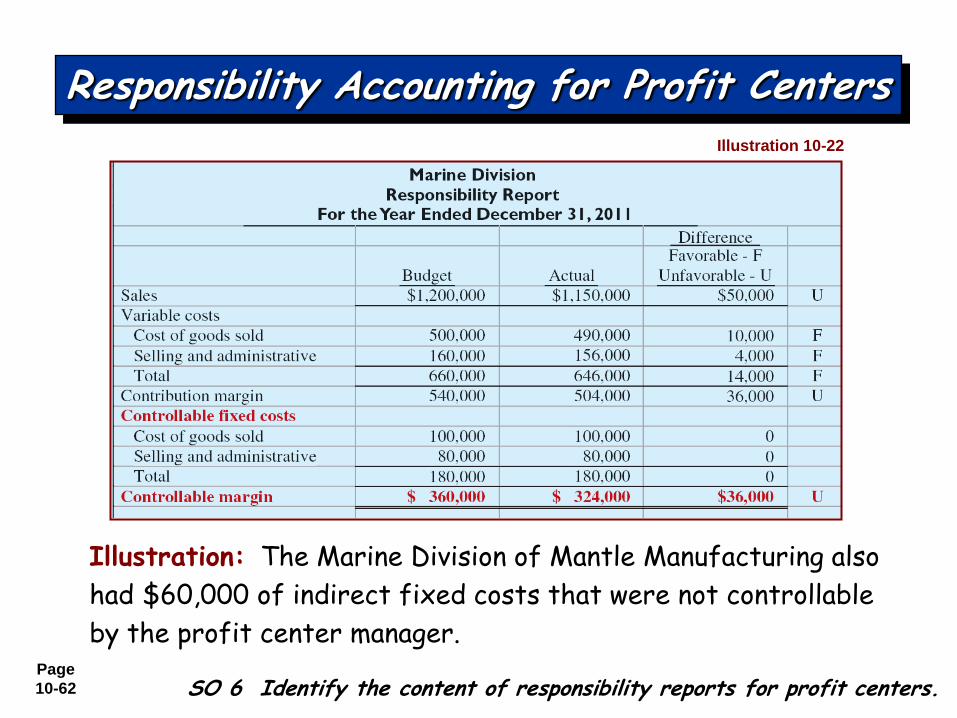
Page
10-62 SO 6 Identify the content of responsibility reports for profit centers.
Responsibility Accounting for Profit Centers
Illustration: The Marine Division of Mantle Manufacturing also
had $60,000 of indirect fixed costs that were not controllable
by the profit center manager.
Illustration 10-22
Page
10-63
In a responsibility report for a profit center,
controllable fixed costs are deducted from
contribution margin to show:
a. Profit center margin
b. Controllable margin
c. Net income
d. Income from operations
Review Question
SO 6 Identify the content of responsibility reports for profit centers.
Responsibility Accounting for Profit Centers
a. Profit center margin
b. Controllable margin
c. Net income
d. Income from operations
Solution on notes page
Page
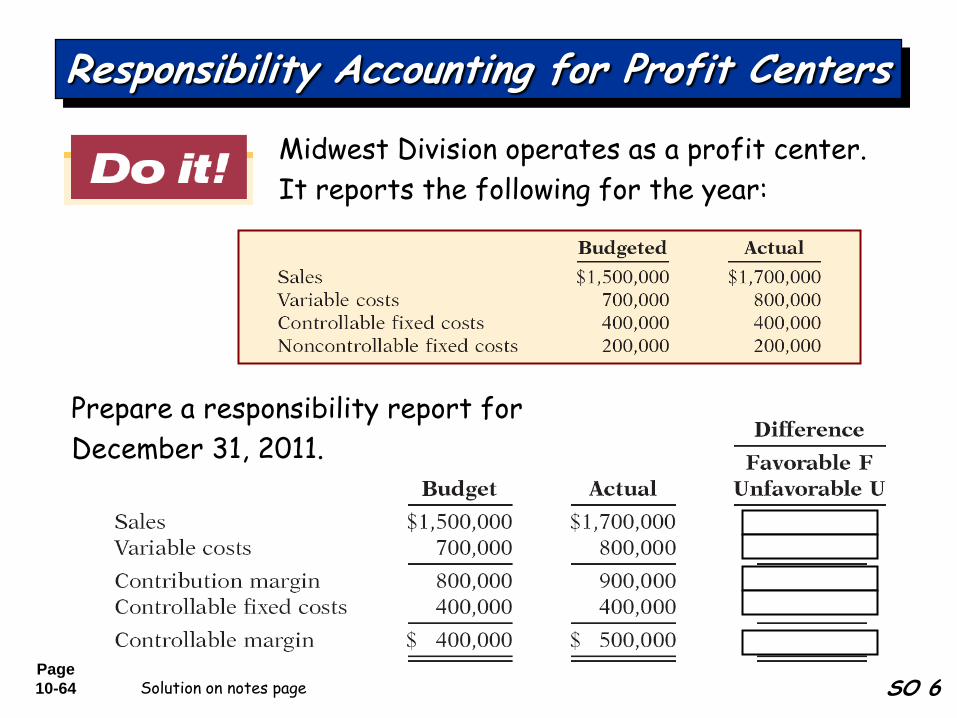
10-64
Midwest Division operates as a profit center.
It reports the following for the year:
SO 6
Responsibility Accounting for Profit Centers
Prepare a responsibility report for
December 31, 2011.
Solution on notes page
Page
10-65
Primary basis for evaluating the performance of a
manager of an investment center.
Shows the effectiveness of the manager in using the
assets at his/her disposal.
Useful performance measure.
Factors in ROI formula are controllable by manager.
Types of Responsibility Centers
Responsibility Accounting for Investment Centers
SO 7 Explain the basis and formula used in evaluating performance in investment centers.
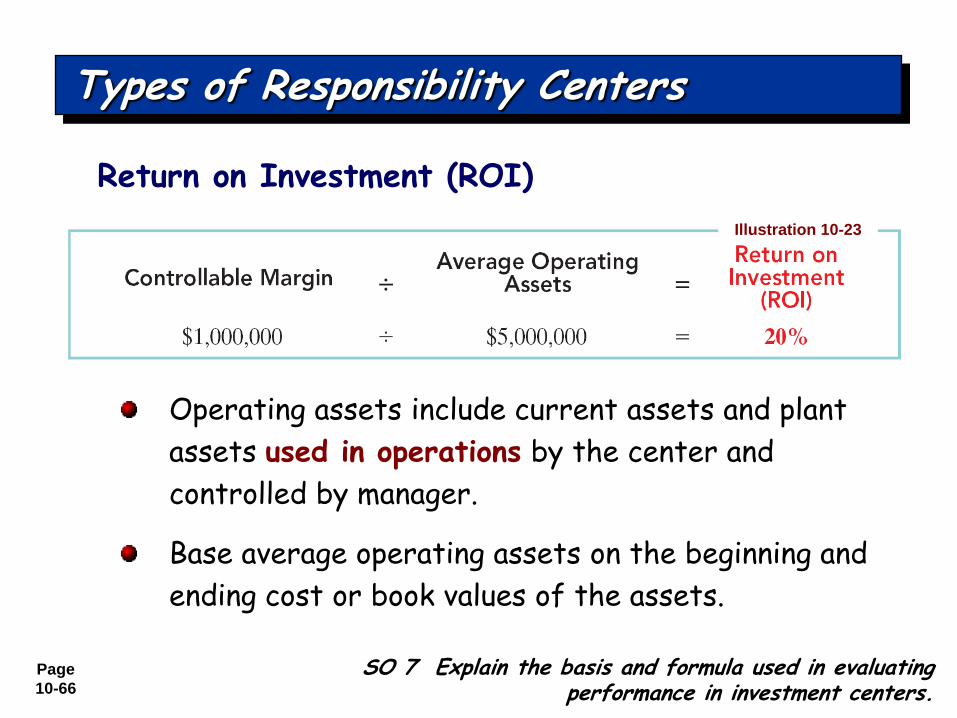
Return on Investment (ROI)
Page
10-66
Operating assets include current assets and plant
assets used in operations by the center and
controlled by manager.
Base average operating assets on the beginning and
ending cost or book values of the assets.
Types of Responsibility Centers
SO 7 Explain the basis and formula used in evaluating performance in investment centers.
Return on Investment (ROI)
Illustration 10-23
Page
10-67
Scope of manager’s responsibility affects content.
Investment center is an independent entity for
operating purposes.
All fixed costs controllable by center manager.
Shows budgeted and actual ROI below controllable
margin.
Types of Responsibility Centers
SO 7 Explain the basis and formula used in evaluating performance in investment centers.
Responsibility Report
Page
10-68
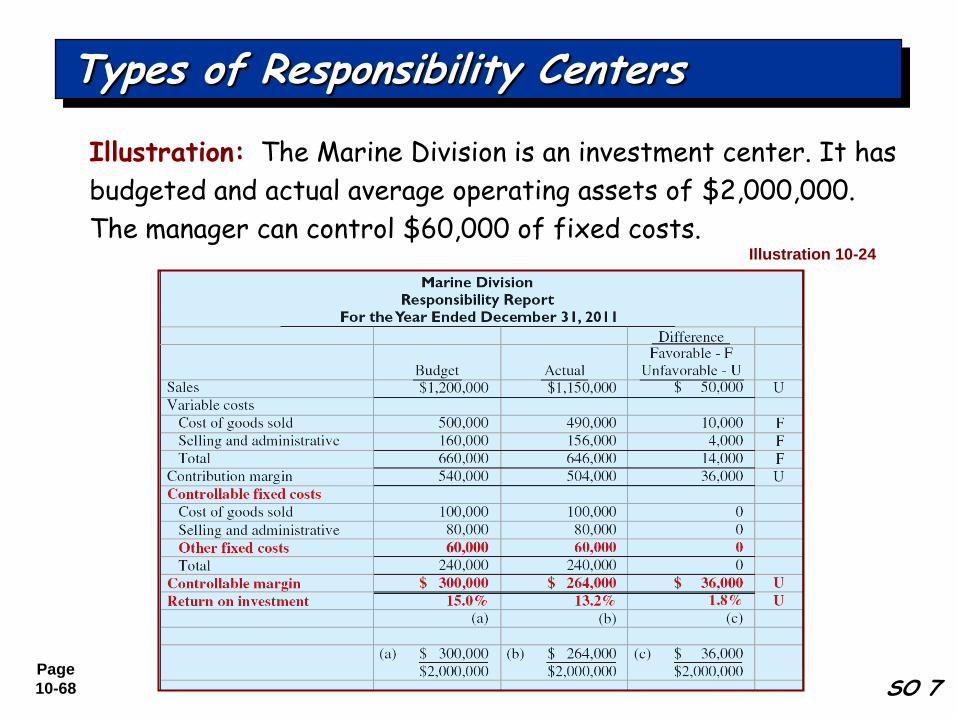
Illustration: The Marine Division is an investment center. It has
budgeted and actual average operating assets of $2,000,000.
The manager can control $60,000 of fixed costs.Illustration 10-24
Types of Responsibility Centers
SO 7
Page
10-69
Valuation of operating assets.
Acquisition cost, book value, appraised value, or market
value.
Each provides reliable basis for evaluating performance.
Margin (income) measure.
Controllable margin, income from operations, or net income.
Only controllable margin is a valid basis for evaluating
performance of investment center manager.
Types of Responsibility Centers
SO 7 Explain the basis and formula used in evaluating performance in investment centers.
Judgmental Factors in ROI
Page
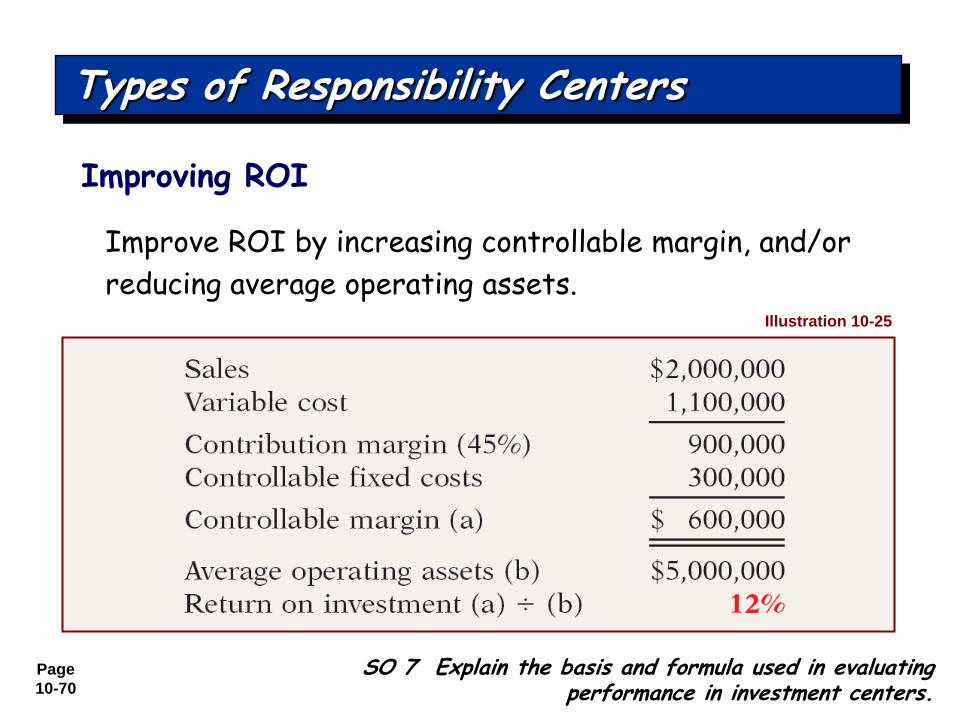
10-70
Improve ROI by increasing controllable margin, and/or
reducing average operating assets.
Types of Responsibility Centers
SO 7 Explain the basis and formula used in evaluating performance in investment centers.
Improving ROI
Illustration 10-25
Page
10-71
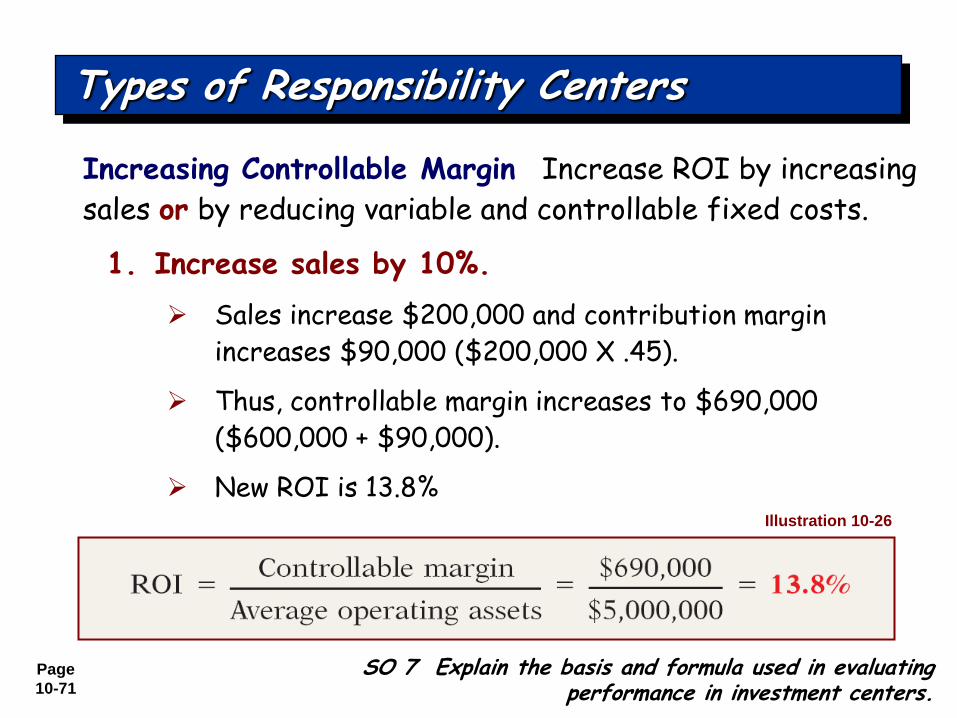
Increasing Controllable Margin Increase ROI by increasing
sales or by reducing variable and controllable fixed costs.
1. Increase sales by 10%.
Sales increase $200,000 and contribution margin
increases $90,000 ($200,000 X .45).
Thus, controllable margin increases to $690,000
($600,000 + $90,000).
New ROI is 13.8%Illustration 10-26
Types of Responsibility Centers
SO 7 Explain the basis and formula used in evaluating performance in investment centers.
Page
10-72
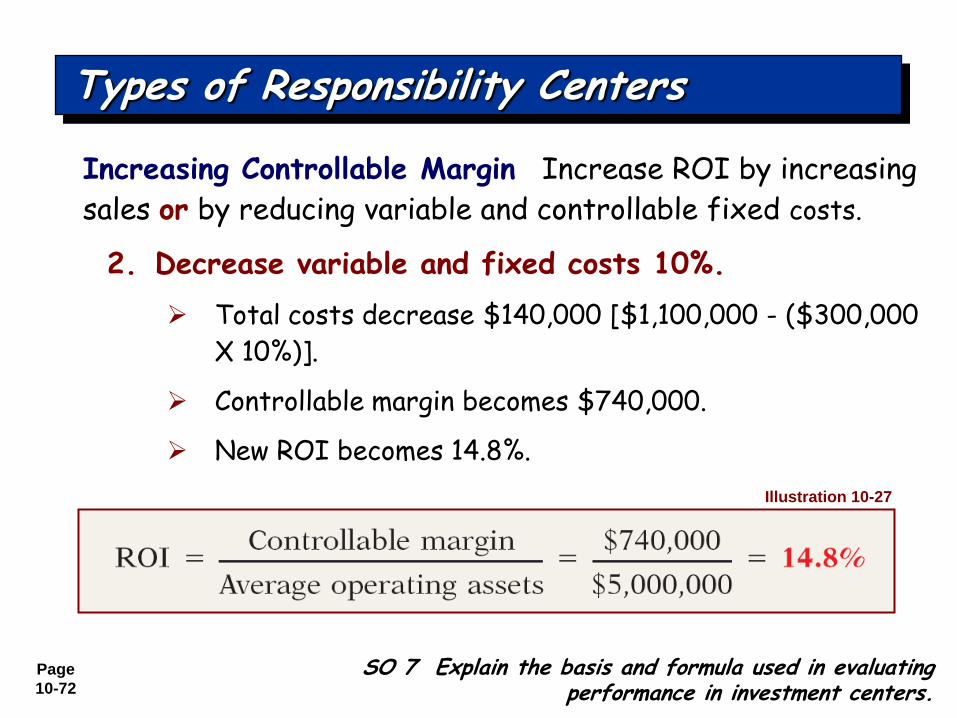
Increasing Controllable Margin Increase ROI by increasing
sales or by reducing variable and controllable fixed costs.
2. Decrease variable and fixed costs 10%.
Total costs decrease $140,000 [$1,100,000 - ($300,000
X 10%)].
Controllable margin becomes $740,000.
New ROI becomes 14.8%.
Illustration 10-27
Types of Responsibility Centers
SO 7 Explain the basis and formula used in evaluating performance in investment centers.
Page
10-73
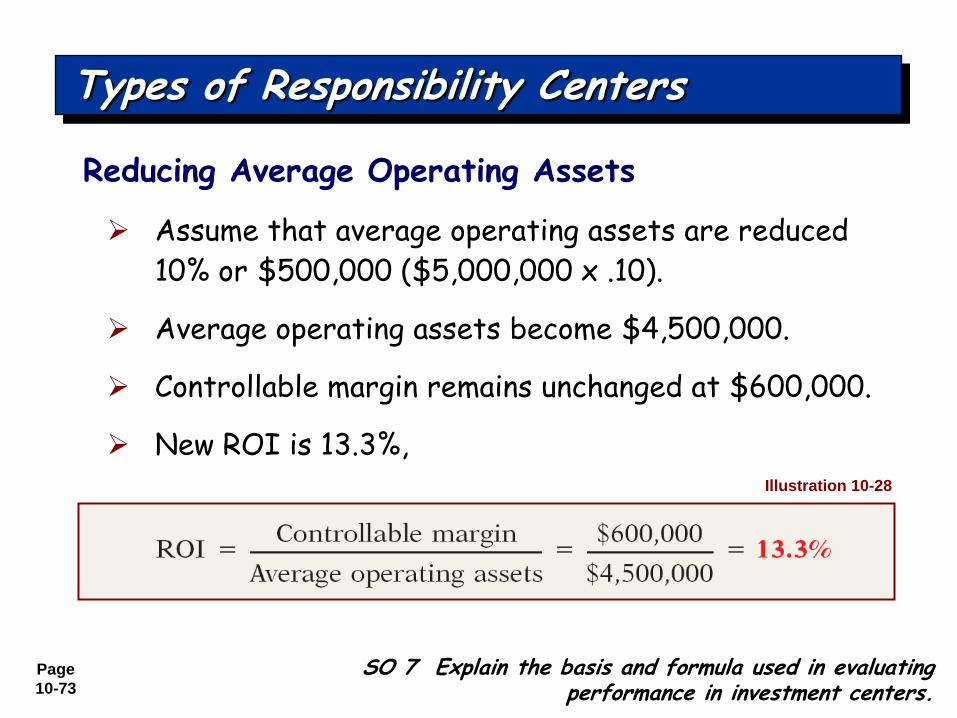
Reducing Average Operating Assets
Assume that average operating assets are reduced
10% or $500,000 ($5,000,000 x .10).
Average operating assets become $4,500,000.
Controllable margin remains unchanged at $600,000.
New ROI is 13.3%,Illustration 10-28
Types of Responsibility Centers
SO 7 Explain the basis and formula used in evaluating performance in investment centers.
Page
10-74
In the formula for return on investment (ROI), the factors for controllable margin and operating assets are, respectively:
a. Controllable margin percentage and total operating assets.
b. Controllable margin dollars and average operating assets.
c. Controllable margin dollars and total assets.
d. Controllable margin percentage and average operating assets.
Review Question
Types of Responsibility Centers
SO 7.
a. Controllable margin percentage and total operating assets.
b. Controllable margin dollars and average operating assets.
c. Controllable margin dollars and total assets.
d. Controllable margin percentage and average operating assets.
Solution on notes page
Page
10-75
Page
10-76
Management function that compares actual results
with budget goals.
Includes both behavioral and reporting principles.
Types of Responsibility Centers
Principles of Performance Evaluations
SO 7 Explain the basis and formula used in evaluating performance in investment centers.
Page
10-77
1. Managers of responsibility centers should have
direct input into the process of establishing budget
goals of their area of responsibility.
2. The evaluation of performance should be based
entirely on matters that are controllable by the
manager being evaluated.
Types of Responsibility Centers
Principles of Performance Evaluations
Behavioral Principles
SO 7 Explain the basis and formula used in evaluating performance in investment centers.
Page
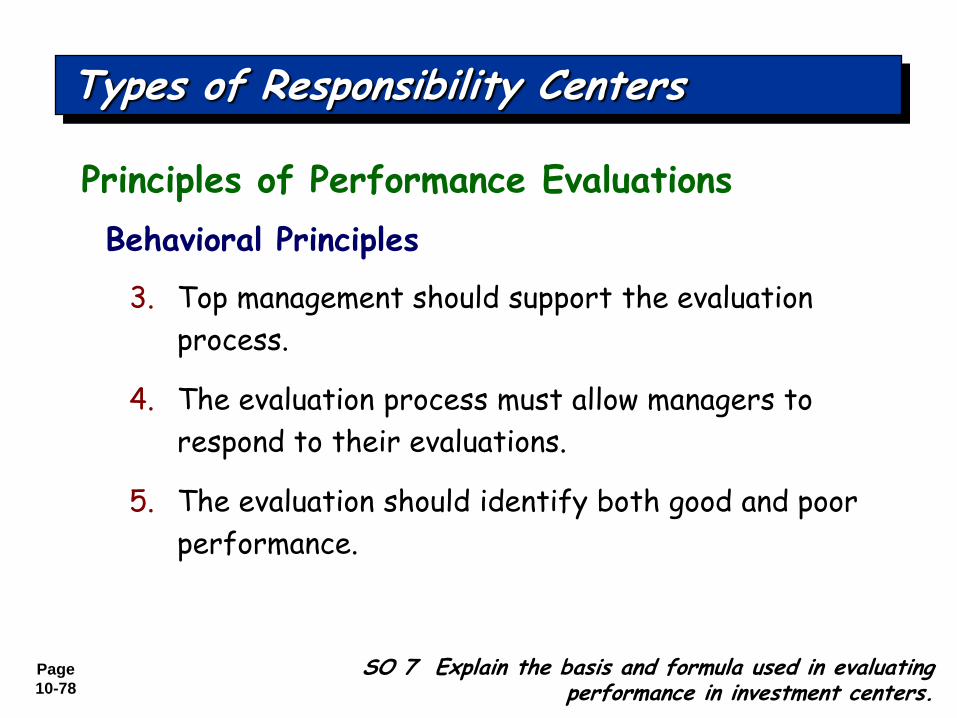
10-78
3. Top management should support the evaluation
process.
4. The evaluation process must allow managers to
respond to their evaluations.
5. The evaluation should identify both good and poor
performance.
Types of Responsibility Centers
Principles of Performance Evaluations
Behavioral Principles
SO 7 Explain the basis and formula used in evaluating performance in investment centers.
Page
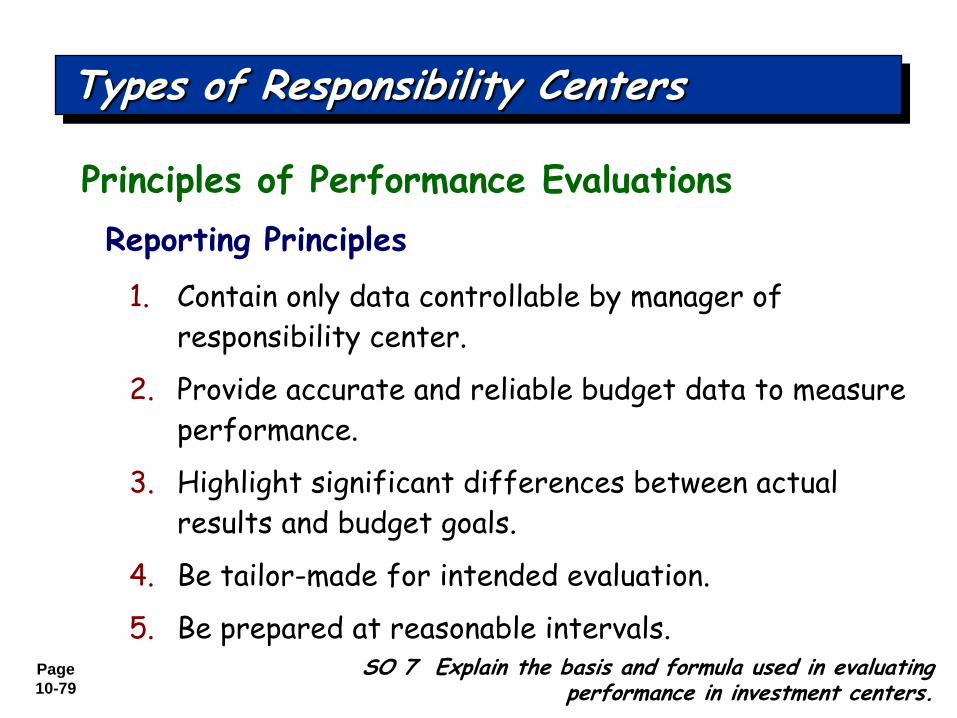
10-79
1. Contain only data controllable by manager of
responsibility center.
2. Provide accurate and reliable budget data to measure
performance.
3. Highlight significant differences between actual
results and budget goals.
4. Be tailor-made for intended evaluation.
5. Be prepared at reasonable intervals.
Types of Responsibility Centers
Principles of Performance Evaluations
Reporting Principles
SO 7 Explain the basis and formula used in evaluating performance in investment centers.
Page
10-80
Page
10-81
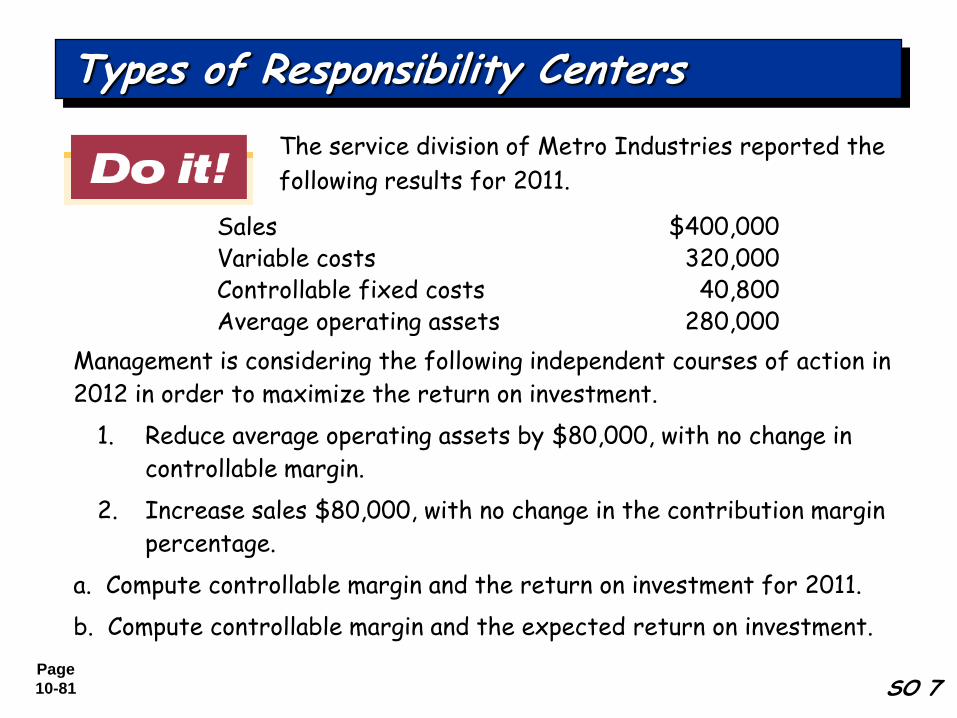
The service division of Metro Industries reported the
following results for 2011.
SO 7
Sales $400,000Variable costs 320,000Controllable fixed costs 40,800Average operating assets 280,000
Management is considering the following independent courses of action in
2012 in order to maximize the return on investment.
1. Reduce average operating assets by $80,000, with no change in
controllable margin.
2. Increase sales $80,000, with no change in the contribution margin
percentage.
a. Compute controllable margin and the return on investment for 2011.
b. Compute controllable margin and the expected return on investment.
Types of Responsibility Centers
Page
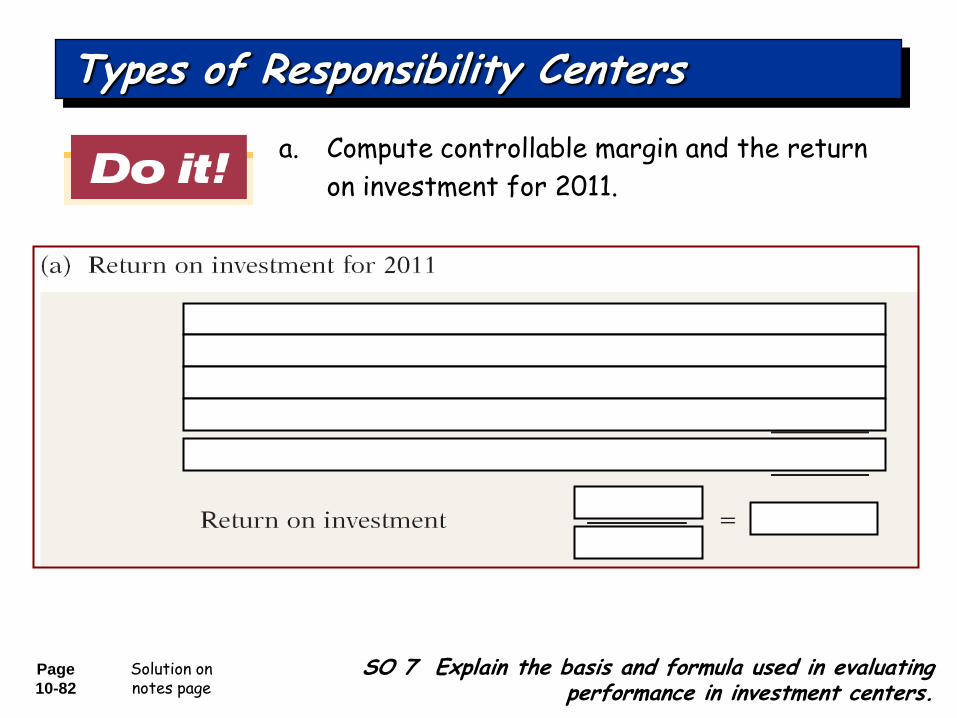
10-82
a. Compute controllable margin and the return
on investment for 2011.
Solution on notes page
Types of Responsibility Centers
SO 7 Explain the basis and formula used in evaluating performance in investment centers.
Page
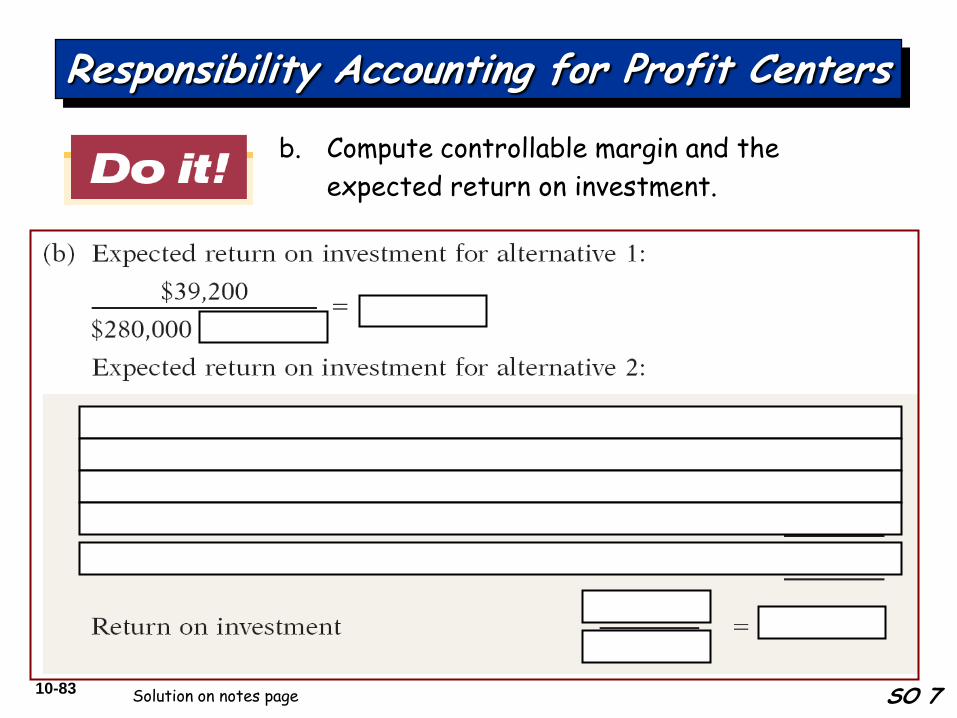
10-83
b. Compute controllable margin and the
expected return on investment.
SO 7
Responsibility Accounting for Profit Centers
Solution on notes page
Page
10-84
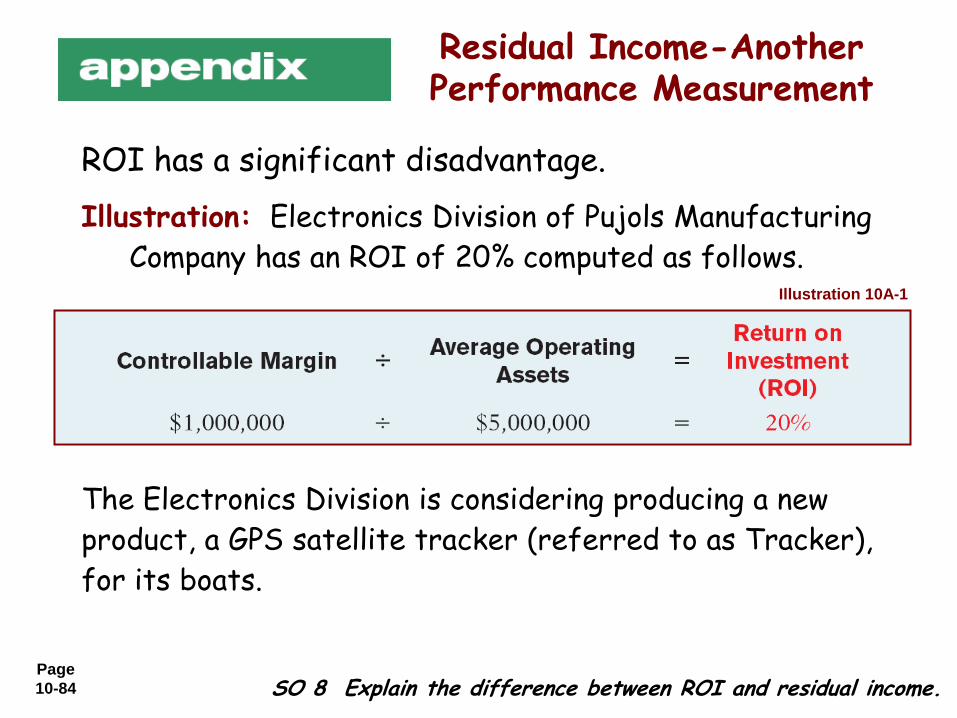
Illustration: Electronics Division of Pujols Manufacturing
Company has an ROI of 20% computed as follows.
Residual Income-Another Performance Measurement
ROI has a significant disadvantage.
SO 8 Explain the difference between ROI and residual income.
Illustration 10A-1
The Electronics Division is considering producing a new
product, a GPS satellite tracker (referred to as Tracker),
for its boats.
Page
10-85
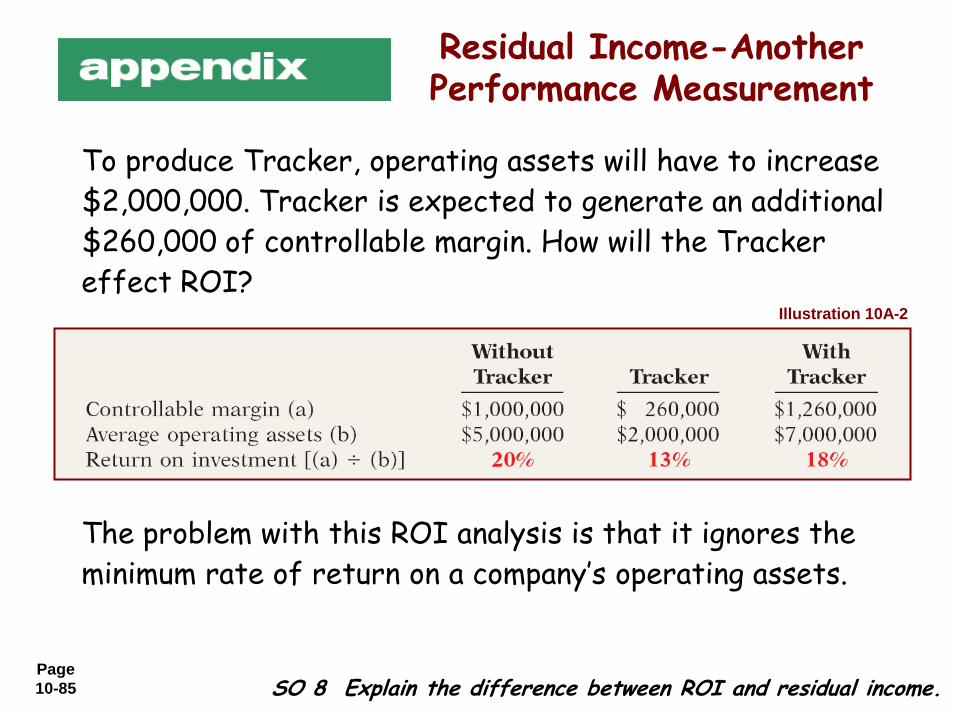
Residual Income-Another Performance Measurement
To produce Tracker, operating assets will have to increase
$2,000,000. Tracker is expected to generate an additional
$260,000 of controllable margin. How will the Tracker
effect ROI?
SO 8 Explain the difference between ROI and residual income.
Illustration 10A-2
The problem with this ROI analysis is that it ignores the
minimum rate of return on a company’s operating assets.
Page
10-86
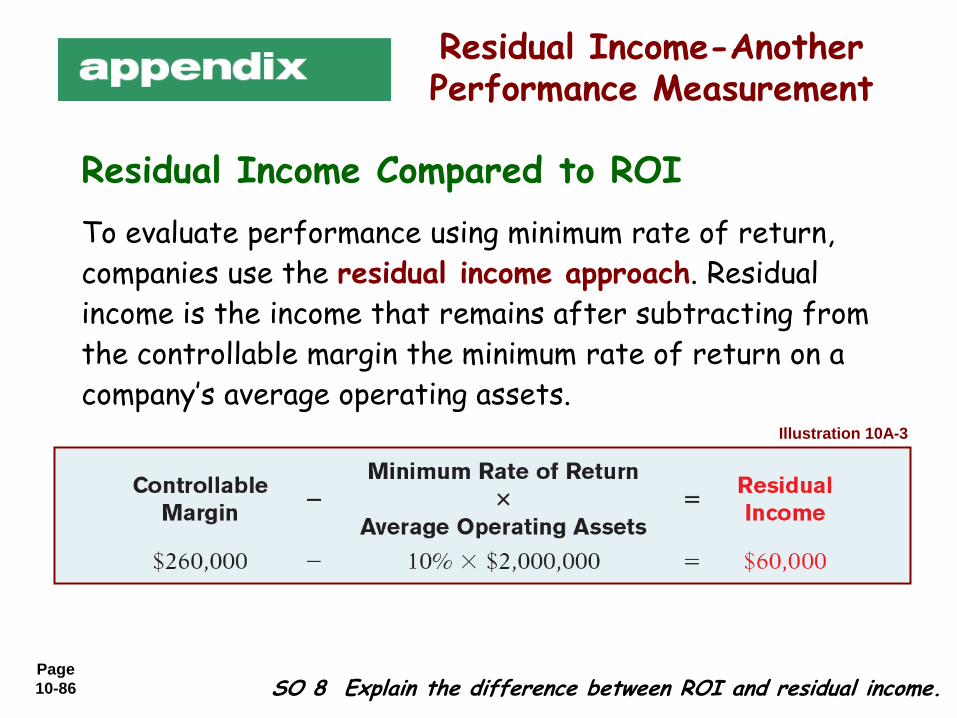
Residual Income-Another Performance Measurement
To evaluate performance using minimum rate of return,
companies use the residual income approach. Residual
income is the income that remains after subtracting from
the controllable margin the minimum rate of return on a
company’s average operating assets.
SO 8 Explain the difference between ROI and residual income.
Illustration 10A-3
Residual Income Compared to ROI
Page
10-87
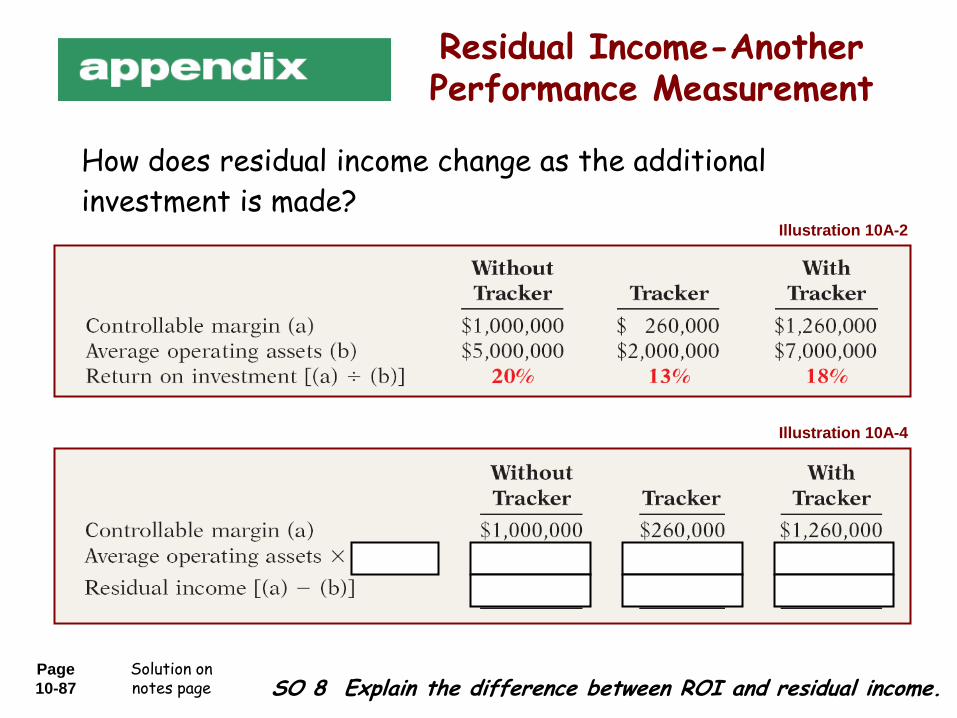
Residual Income-Another Performance Measurement
How does residual income change as the additional
investment is made?
SO 8 Explain the difference between ROI and residual income.
Illustration 10A-4
Illustration 10A-2
Solution on notes page
Page
10-88
Residual Income-Another Performance Measurement
The goal to maximize the total amount of residual income in
each division ignores the fact that one division might use
substantially fewer assets to attain the same level income.
SO 8 Explain the difference between ROI and residual income.
Residual Income Weakness
Page
10-89
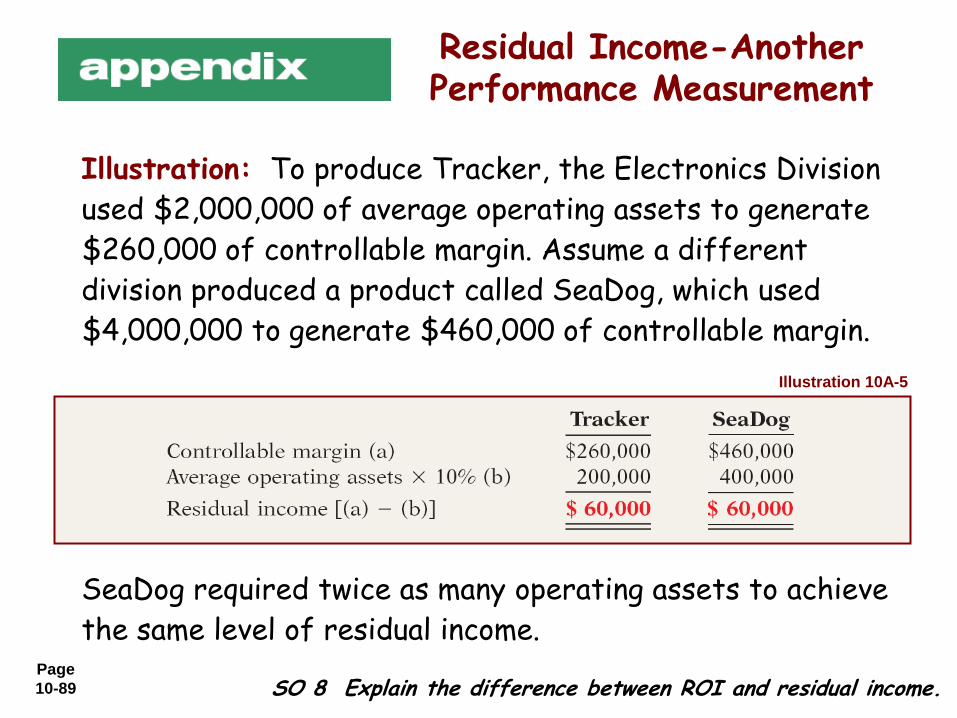
Illustration: To produce Tracker, the Electronics Division
used $2,000,000 of average operating assets to generate
$260,000 of controllable margin. Assume a different
division produced a product called SeaDog, which used
$4,000,000 to generate $460,000 of controllable margin.
Residual Income-Another Performance Measurement
SO 8 Explain the difference between ROI and residual income.
Illustration 10A-5
SeaDog required twice as many operating assets to achieve
the same level of residual income.
Page
10-90
Copyright © 2010 John Wiley & Sons, Inc. All rights reserved.
Reproduction or translation of this work beyond that permitted
in Section 117 of the 1976 United States Copyright Act without
the express written permission of the copyright owner is
unlawful. Request for further information should be addressed
to the Permissions Department, John Wiley & Sons, Inc. The
purchaser may make back-up copies for his/her own use only
and not for distribution or resale. The Publisher assumes no
responsibility for errors, omissions, or damages, caused by the
use of these programs or from the use of the information
contained herein.
Copyright