Accounting for Organizational Employment Impact August ...
88
Accounting for Organizational Employment Impact David Freiberg Katie Panella George Serafeim T. Robert Zochowski Working Paper 21-050
Transcript of Accounting for Organizational Employment Impact August ...

Accounting for Organizational Employment Impact David Freiberg Katie Panella George Serafeim T. Robert Zochowski
Working Paper 21-050

Working Paper 21-050
Copyright © 2020, 2021 by David Freiberg, Katie Panella, George Serafeim, and T. Robert Zochowski.
Working papers are in draft form. This working paper is distributed for purposes of comment and discussion only. It may not be reproduced without permission of the copyright holder. Copies of working papers are available from the author.
Funding for this research was provided in part by Harvard Business School. George Serafeim is a co-founder of both KKS Advisors and Richmond Global Services providing advisory and software solutions, which are using the authors’ methodology. He has equity stakes in both firms.
Accounting for Organizational Employment Impact David Freiberg Harvard Business School
Katie Panella Harvard Business School
George Serafeim Harvard Business School
T. Robert ZochowskiHarvard Business School

1
Accounting for Organizational Employment Impact
David Freiberg, Katie Panella, George Serafeim and T. Robert Zochowski*
Harvard Business School
Impact-Weighted Accounts Project Research Report
First version: 10-20-2020 This version: 08-02-2021
Abstract
Organizations create significant positive and negative impacts through their employment practices. This paper builds on the substantial body of research regarding job quality and impact measurement to present a framework for monetized analysis of employment impact. We identify and propose a framework for measuring the four most salient dimensions of impact for employees, including wage quality, career advancement, opportunity, and health and wellbeing, as well as two principle impacts, diversity and employment location, for the broader labor community. The framework and methodology for calculating employment impact-weighted accounting figures is applied to several large corporations, resulting in positive impacts that range between 25 and 257% of their EBITDA suggesting significant heterogeneity in employment practices across organizations. These results demonstrate the feasibility of calculating employment impact in monetary terms, and provide a foundation for future application across additional geographies and contexts.
David Freiberg is the program manager and a research associate at the Impact-Weighted Accounts Project at Harvard Business School. Katie Panella is a research associate at the Impact-Weighted Accounts Project at Harvard Business School. George Serafeim is the Charles M. Williams Professor of Business Administration at Harvard Business School and the faculty Chair of the Impact-Weighted Accounts Project at Harvard Business School. Robert Zochowski is the program director of the Impact-Weighted Accounts Project at the Harvard Business School. We are grateful to the Division of Faculty Research and Development at Harvard Business School for financial assistance. We would like to thank Michael Etzel, Daniel Fujiwara, Ben Lawton, Mike McCreless, Jeremy Nicholls, Spencer Powell, Olivia Prentiss, Camille Putois and the B4IG team, Caroline Rees, Amanda Rischbieth, Ethan Rouen, Katie Trinh, and Samuel Vionnet for many useful comments. We would like to thank Jennifer Chen and Joyce Zhou for their excellent research assistance. Corresponding author: Katie Panella, [email protected].

2
1. Introduction
Employment is fundamental to wellbeing (Tait, Padgett, and Baldwin, 1989; Bowling, 2010). This truth is
so deeply engrained across cultures and communities that labor market characteristics such as
unemployment rates, participation in informal and gig economies, and job loss from automation receive
enormous focus from policy-makers, within the media, and in conversations among friends and family.
Despite the fundamental importance of employment, the bulk of attention has been on the quantity of jobs
created, marginalizing the importance of the quality of these jobs. Indicatively, while the world saw a
reduction in global unemployment prior to the COVID-19 pandemic, indications of job quality
improvement lag behind (International Labor Organization, 2019).
Simultaneously, the increasing importance of environmental, social, and governance (ESG) issues,
and in particular the growing focus on the “S” in ESG, is accelerating demand for corporate strategies that
create financial value through better employment practices (Neilan, 2020; Kotsantonis and Serafeim, 2019).
Several organizations have established frameworks to improve employment practices and job quality (e.g.
Good Jobs Institute), to hold organizations accountable for their impact on employees (e.g. Guiding
Principles on Business and Human Rights) or to increase transparency regarding employment impact (e.g.
Global Reporting Initiative).
We build upon these efforts with a focus on providing clarity to the definition and measurement of
employment impact. First, we propose a unifying framework of employment impact, identifying four
fundamental dimensions of high importance to employee outcomes: wage quality, career advancement,
opportunity, and health and wellbeing. We additionally recognize organizational employment dimensions
that affect the broader labor community and identify two areas (diversity and location) that provide a non-
exhaustive illustration of this category of impact. Second, we provide methodologies for measuring each
one of the dimensions in monetary terms using outcome rather than input based metrics, allowing for
comparability and relevance within the decision-making context of business and investments. Impact
monetization establishes common and intuitive metrics that can be meaningfully aggregated, as well as
integrated within existing business analytic tools to facilitate simultaneous analysis of financial and social
performance (Serafeim, et al., 2019).
Third, we apply our framework and methodologies to a leading multinational corporation, Intel,
showing the feasibility of impact-weighted accounting measurements and their decision usefulness for
multiple stakeholders. We chose Intel because of the high-quality disclosures provided by the company on
the data needed according to our framework. Our analysis reveals a net positive US employment impact of
$3.75 billion for Intel, or 26% of its US-based revenue and 57% of US EBITDA. The total impact on US
employees is estimated at $5.7 billion while the impact on the labor community dimensions is ($1.9

3
billion).1 Moreover, it identifies which dimensions generate or detract the most from employment impact,
providing useful insights for business leaders that strive to make meaningful improvements to employment
practices. To assess the framework’s scalability, we calculate the total employment impact, excluding a few
categories we could not source data, for three other leading corporations: Apple, Costco, and Merck. This
analysis documents that employment impact varies significantly across firms reflecting the heterogeneity
of human resource strategies.
Overall, the main contributions of our work is threefold: provide a framework for employment
impact, design methodologies for calculating each dimension of employment impact and showcase their
feasibility by applying those methodologies to four significant corporations. We note that we do not view
our methodologies and analyses as final. Rather we view them through an evolutionary perspective: these
methodologies and analyses will keep evolving much like accounting measurements have been evolving
over centuries.
2. Employment Impact Framework
The impact of organizational employment practices is broad and multifaceted. Employment does not just
influence a worker’s life while they are at the workplace (i.e. through the safety of their physical
environment, or the opportunities for personal and professional growth), but it follows the worker home in
the form of wages, benefits, and transferable skills. Research indicates that perceived job quality is closely
linked to employees’ overall perceived quality of life, ranking even more important than total income or
physical health (Rothwell and Crabtree, 2019). The decisions made by organizations regarding who they
employ, the geographical footprint of their operations, and the quality of the jobs they provide have
fundamental importance to local labor markets, socioeconomic outcomes of workers and their families, and
macroeconomic health. This framework provides a foundation to measure the impact of employment on an
organization’s direct workforce, as well as an initial exploration of how firms impact the broader labor
community. Future analyses may include additional dimensions and stakeholders.
A thorough review of existing literature suggests four primary elements of job quality that impact
employees, as presented in Exhibit 1 below. Together, these dimensions evaluate the quality of
employment and its impact on employees’ lives.2 We further identify two of the most foundational impacts
1 To calculate US EBITDA, we assume that the ratio of global EBITDA to US EBITDA is equal to the ratio of global revenue to US revenue (20%). 2 An additional employee impact dimension, subjective wellbeing, is described in Appendix 1. Subjective wellbeing (sometimes referred to as employee engagement, satisfaction, or fulfillment) has a substantial impact on employees, however it is intrinsically connected to other key aspects of job quality and therefore is likely to double count the impacts monetized through the core IWA framework. It is presented as a Supplemental dimension of analysis that adds valuable insight, but should not be included in an organization’s bottom line employment impact. Analysis of

4
of organizational employment practices that influence the broader labor community. The analysis of this
category of impact is non-exhaustive. Exhibit 1 shows the relationship between employee and labor
community impact dimensions, as well as a third stakeholder group representing broader societal impacts
(that are not addressed as part of this analysis but may be included in future research).
Exhibit 1: Employment Impact Dimensions
Exhibit 2 shows the targeted stakeholder and a brief description of each impact dimension. As human
capital data management improves and innovates at the organization level, and disclosure regulations
evolve we may see additional impact dimensions included in the framework. Organizations with a highly
developed commitment to accounting for their social performance may conduct advanced analyses as part
of their impact-weighted accounting statements.
subjective wellbeing provides critical data regarding job quality and is recommended as a parallel analysis to the dimensions described in this paper.

5
Exhibit 2: Descriptions of Employment Impact
Stakeholder Impact Dimension Description E
mpl
oyee
Wage Quality Quality of wages provided, including living wage, marginal utility, and equity
Career Advancement Internal mobility resulting in increased earnings
Opportunity Employee demographics across job categories
Health and Wellbeing
Impact of organization on employee health and wellbeing (including injuries and incidents, workplace culture, workplace wellbeing programs, and access to healthcare, paid sick leave, and family friendly workplace benefits). An analysis of employee subjective wellbeing is recommended in parallel.
Lab
or
Com
mu
nit
y
Diversity Employee demographics as compared to local population
Location Relative impact of employment based on local employment levels
3. Methodology
The methodology to establish the employment impact-weighted accounting framework was grounded in
the design principles for impact-weighted accounting (Serafeim, et al., 2019). We established a source of
impact (the organization) and a targeted stakeholder (the employee and the broader labor community).
Specificity guided us towards clear and consistent metrics for measurement. Finally, monetization of each
dimension ensured that impact was expressed as currency that can be clearly compared and easily digested
by decision-makers in business. We further applied principles established by the IWAI Product Impact
Framework, which is grounded in consistency, first-order effects, incentive alignment, best-in-class
benchmarking, and conservatism (Serafeim and Trinh, 2020).3 The application of these principles is
described below.
Building on these principles, our methodology followed three steps: identification of the most
important factors influencing job quality, establishment of a best-in-class benchmark, and development of
3 The Product Impact Framework and the Employment Impact Framework use the same set of 5 foundational principles, however they have distinct targeted stakeholders and therefore require different dimensions of analysis. For example, a product has a first-order effect on the environment based on recyclability, which is not a relevant dimension for employment analysis. Similarly, employers have a first-order effect on employees through career advancement, which does not apply to a product or service.

6
the monetization pathway. Step One, identification of the employment-impact framework dimensions,
included an extensive literature review and selected expert interviews regarding labor outcomes, job quality,
and corporate human capital disclosure. Our decision process for inclusion asked the following questions:
Is the impact widely and consistently recognized and valued by employees across geographies, sectors, and
industries? The answer to this question led us to include the dimension of Wage Quality, while excluding
a more narrow analysis such as whether or not a company has an Employee Stock Ownership Plan (which
would only apply to publicly traded companies). Next, we asked: Is this a first-order effect? The answer
to this question distinguished between accounting for the impact on each employee’s own health through
access to a high-quality Health and Wellbeing (HWB) workplace intervention, while excluding the impact
on the health of their families or communities that could be influenced through the avoidance of second-
hand smoke if that same HWB program had an effective tobacco cessation component. While we do not
discount the importance of second-order effects, the causal mechanisms behind these are far less clear, and
are thus misaligned with our core design principles. Similarly, we excluded any measurement of impacts
on employees within a company’s supply chain.4 These guiding questions led us to identify impacts that
can be broadly applied (ensuring scale) and clearly attributed to organizations.
The next step after finalizing our framework dimensions was to identify a best-in-class benchmark.
During this process, we asked ourselves the following guiding questions: Is our benchmark aligned with
the best possible incentives? The answer to this question led us to apply the living as the best-in-class
benchmark for our wage quality dimension, rather than including a lower bar such as the local minimum
wage set by legislation.5 Similarly, we benchmark workforce demographics against local population
demographics, despite the more common practice among employers to use a subset of the population (such
as those with a 4-year college degree) to produce a more favorable figure for employee diversity. Incentive
alignment tests whether the framework is incentivizing behavior that drives positive social and
environmental impact, while rigorously applying a best-in-class benchmark prevents the framework from
reinforcing an unwanted average (Serafeim and Trinh, 2020).
Finally, we constructed and tested a monetization methodology for each dimension. There are
numerous benefits to impact monetization, including the use of a common language for decision-making
4 Although companies, especially large companies, can exhibit pressure on their suppliers that may ultimately change their suppliers own practices (Thorlakson, et al., 2018), the IWAI employment framework is designed for application to each company directly in order to ensure attribution and completeness. Therefore, if a company’s supplier pays its employees below a living wage, this negative impact will be captured in the impact-weighted accounting statement of the supplier. The same is true of all other dimensions in the IWAI employment framework. We are exploring a process to attribute a percentage of supplier impact based on the percentage of sales to the firm. 5 A credit is applied for wages paid above minimum wage, however we do not apply the entire wage as positive impact. Rather, the difference between the actual wage paid and the minimum wage is applied (solely to employees earning below a living wage). See the Wage Quality section below for additional detail on this methodology. This incremental step incentivizes progress towards a living wage.

7
and increased ability for comparison across organizations and types of impact (Fischer, 2020). To arrive at
a monetary value for each impact dimension, we analyzed literature to determine whether there was an
existing valuation for the impact dimension. For example, a study regarding the importance of health
insurance in the United States determined a range of $1,093 to $3,290 in health capital lost per year for
individuals without access to healthcare (Miller, et al., 2004). We apply these values, along with an
appropriate benchmark, to calculate impact for the sub-dimension of healthcare within the Health and
Wellbeing dimension. Dimensions that follow this methodology use a value transfer technique to arrive at
monetization figure. Other dimensions may not have an existing monetization factor, in which case we
constructed the methodology using conservative assumptions, most frequently using compensation costs
(demonstrated through missing or lost wages) to convert impacts to dollar values. The monetization
pathway for each dimension is explained in detail in Section 5.
4. Mapping
Once the dimensions of employment impact are identified, we map our hypothesized framework to existing
efforts to identify alignment and gaps. We find substantial alignment with many key stakeholders,
indicating the opportunity to build upon this growing body of work and the momentum regarding
strengthened impact measurement. Exhibit 3 below is illustrative of our mapping exercise, and is not meant
to be an exhaustive evaluation of existing efforts to demonstrate employment impact. The monetization
methodology applied to each dimension is rooted in the Impact Management Project principles of the five
dimensions of impact: What, Who, How Much, Contribution, and Risk. In alignment with the important
work of the Capitals Coalition, the IWAI employment framework is designed to provide actionable insights
to decision-makers regarding how firms impact the creation or destruction of human capital, using the
employee and broader labor community as our targeted stakeholders as discussed above.6
The employment impact framework is influenced by standard setters such as SASB, GRI, the
World Economic Forum Common Metrics project, the Good Jobs Institute, the GIIN IRIS+ framework,
and other leading organizations.7 Due to the industry-specific construction of SASB standards, we do not
include these metrics in Exhibit 3 below.
6 For more information on these foundational efforts, see www.impactmanagementproject.com and www.capitalscoalition.org. 7 It is worth noting the considerable synergies within existing efforts, as well as the continuously evolving field of impact measurement and corporate disclosure. The IWAI makes every effort to be exhaustive in our review of the current landscape, as well as cognizant of our goal to create a scalable and highly adoptable methodology for impact-weighted accounting. The IWAI will build upon existing metrics to produce a standardized methodology using the language of financial analysis that is familiar to corporate leaders and investors. Our goal is to provide insights that enable decision-making based on rigorous, standardized analysis.

8
Strict adherence to the design principles described in Section 3 led us to exclude many metrics that
may be familiar to the reader who is well-versed in ESG and impact management practices. For example,
remaining focused on the targeted stakeholder, the employee, means that we do not account for the impact
of employment on economic growth, which is a valuable measure of how organizations contribute to
society. The focus on first-order effects led us to exclude union representation as an outcome that stands on
its own, because while the right to free association is a critical lever for improving job quality, we
understand it as an input that influences the dimensions we have identified in our framework (e.g. unions
frequently having a strong influence on wage quality, employee benefits, and health and safety among other
important issues). Metrics based on policy or procedure (e.g. the existence of a health and safety committee,
or a human rights policy denouncing the use of child or forced labor) are also excluded, because they do
not measure employee-level impact.
The Mapping Exercise below demonstrates the ideological synergies between the IWAI framework
and a selected illustration of existing efforts. Critically, impact-weighted accounts are not meant to stand
alone as the only indication of a company’s social and environmental performance. Rather, just as financial
accounts show a picture of organizational health resulting from strong leadership and effective
organizational strategy (e.g. a competitive business model may be the underlying lever responsible for
significant revenue growth in a given year), impact-weighted accounts are designed to do the same.
Organizations must continue to adhere to the principles and practices that contribute to strong social and
environmental performance, such as maintaining a responsible and representative governance structure.
However, impact-weighted accounts are designed to capture the outcome of these responsible practices,
rather than encapsulate every business activity as an independent metric. For this reason, the mapping
exercise below shows alignment between key principles across organizations and standard setting bodies
that influenced the selection and development of IWAI’s impact dimensions.

9
Exhibit 3: Impact-Weighted Accounts Employment Framework Mapping Exercise
Stakeholder Impact Dimension
Sustainable Development Goals
WEF Common Metrics
Good Jobs Institute Global Reporting Initiative GIIN IRIS+ SASBExample from Manufacturing Industry
Wage QualitySDG 1: No povertySDG 2: Zero hunger
Expanded: living wageCore: gender pay equality
Basic Needs: Pay, Schedules
GRI 102.35 Remuneration policiesGRI 102.8: total number of employees by type, genderGRI 405-2: Ratio of salary and remuneration to women & men
Average Non-Salaried Wage (OI8791), Employees: Minimum Wage (OI5858), Temporary Employee Wages (OI4202)
'Gender Wage Equity (OI1855), Wage Equity (OI1582), Wage Premium (OI9767)
TC-ES-320a.2 Labor Conditions3.1 Labor provisions, including criteria focused on freely chosen employment, child labor avoidance, working hours, wage & benefits, humane treatment, non-discrimination, and freedom of association.
Career AdvancementSDG 5: Gender EqualitySDG 10: Reduced Inequalities
Core: training hours, training expenditure
Basic Needs: Career Path
'GRI 401-1: New employee hires and employee turnover
Gender Ratio of Promotions (PI9467), Women's Career Advancement Initiative (OD4232), Employees Promoted: Total (OI6995), Employees Promoted: Female (OI8646), 'Employee Involuntary Turnover Rate (OI3989), Employee Voluntary Turnover Rate (OI1638)
OpportunitySDG 10: Reduced Inequalities
Core: gender pay equality
Higher needs: personal growth
GRI 406: Non-discrimination
Full-time Employees: Female Managers (OI1571), Full-time Employees: Managers with Disabilities (OI8292), Full-time Employees: Minorities/Previously Excluded Managers (OI3140, Investment Committee Members: Female (OI8709)
Health and Wellbeing
SDG 3: Good health and wellbeingSDG 10: Reduced Inequalities
Core: indicent rate
Expanded: % of employees in best practice health programs
Basic Needs: Security and safety
Basic Needs: Benefits
GRI 403: Occupational Health and Safety
'GRI 406-1: Incidents of discrimination
Occupational Fatalities (OI6525), Occupational Injuries (OI3757)'Healthcare Benefits Participants (OI4061), Healthcare Benefits Premium Covered (OI1503)'Employment Benefits (OI2742) Flexible Work Arrangements (OI7983)
TC-ES-320a.1 Labor Conditions1.1 The entity shall disclose its total recordable incident rate (TRIR) for work-related injuries and illnesses.
3.2 Health and safety provisions, including criteria focused on occupational safety, emergency preparedness, occupational injury and illness, industrial hygiene, physically demanding work, and dormitory and canteen operations.
Subjective Wellbeing (Parallel Analysis)
SDG 8: Decent work and economic growth
Expanded: freedom of associationExpanded: discrimination and human rights grievances
Higher needs: meaningfulness, achievement
GRI 407: Freedom of Association
Employee Feedback System (OI3601),Worker Freedom of Association Policy (OI4364)
DiversitySDG 5: Gender EqualitySDG 10: Reduced Inequalities
Core: gender pay equality
Higher needs: belongingGRI 405-1: Diversity of (governance bodies and) employees
Full-time Employees: Female (OI6213), Full-time Employees: Minorities/Previously Excluded (OI8147)
Location
SDG 10: Reduced InequalitiesSDG 8: Decent work and economic growth
GRI 102-7.1.2.3.3: total number of employees by country or region
Permanent Employees: Low Income Areas (OI8266)
Em
ploy
ee
Lab
or C
omm
unit
y

10
5. Employment Impact-Weighted Accounting: Dimension Analysis
Having developed an employment impact measurement framework, we test the methodology on one
company. Testing the framework allows for identification of blind spots, a rigorous assessment of its
applicability, and the design of precise measurement techniques for each impact dimension. The difficulty
in conducting this case study rests on the lack of corporate disclosure on many of the data items we need
as part of our methodology. After searching for adequate disclosure across several companies we find one
company that provides meaningful transparency on many of the dimensions we seek to measure. This
organization is Intel, a technology company based in the United States that is classified as part of the
Semiconductor industry. The company’s US-based revenue in 2018 was over $14 billion, and it operated
with 52,618 employees in the United States. Intel’s stated purpose is to “create world-changing technology
that enriches the lives of every person on earth.”8
Intel is widely recognized by ratings agencies focused on sustainability and corporate
responsibility. The company also publicly discloses significant detail regarding their employment practices.
All employers in the United States are required to file an EEO-1 Report with the Equal Employment
Opportunity Commission (EEOC), including the EEO-1 Component 2 which provides employee pay
information broken down by race, sex, and ethnicity.9 In 2018 Intel was the only company in the Russell
1000 Index (representing over 90% of U.S. market capitalization in the equity market) to disclose their
wage data disaggregated by gender, race, and ethnicity.10
While there are other dimensions in which Intel data is not disclosed with similar granularity, the
employee demographic and wage data is a substantial foundation for the IWAI analysis, and thus drove our
team’s decision to use Intel as an illustration of the employment impact framework in action. Below, we
use Intel data to demonstrate how each dimension of the employment impact framework can be used for
meaningful analysis. We detail the calculations used to monetize outcomes in each of our dimensions,
including the best-in-class benchmarks that are applied throughout the framework. The employment impact
for Intel in 2018 is summarized in Table 1 below. The following sub-sections of this chapter detail the
rationale for inclusion of each dimension, the monetization methodology, and the application to Intel as a
case study.
8 For additional information on Intel, including their primary business units, financials, and company values, please visit www.intel.com. 9 Throughout this paper we use race and ethnicity terms as defined by the EEOC. For more information, see: https://www.eeoc.gov/employers/eeo-1-survey/eeo-1-instruction-booklet 10 Intel’s 2017 and 2018 EEO-1 Pay Data disclosure is available here: https://www.intel.com/content/dam/www/public/us/en/documents/corporate-information/2017-2018-eeo-1-pay-disclosure-report.pdf

11
Table 1: Intel Employment Impact 2018
Dimension Impact % Revenue % EBITDA % Salaries
Employee Impact
Wage Quality $ 6,377,358,856 44.59% 97.05% 87.20% Career Advancement $ (48,980,821) -0.34% -0.75% -0.67% Opportunity $ (415,218,670) -2.90% -6.32% -5.68% Health and Wellbeing $ (263,223,199) -1.84% -4.01% -3.60%
Subtotal $ 5,669,771,850 39.64% 86.28% 77.53% Labor Community Impact
Diversity $ (2,319,192,138) -16.21% -35.29% -31.71% Location $ 401,391,204 2.81% 6.11% 5.49% Subtotal $ (1,917,800,935) -13.41% -29.19% -26.22%
Total Impact $ 3,751,970,915 26.23% 57.10% 51.30%
Employee Impacts The following four dimensions (wage quality, career advancement, opportunity, and health and
wellbeing) demonstrate organizational impact on its current workforce.
A. Wage Quality
Contribution to Employment Impact
Wage quality is a global issue with deep implications for addressing poverty and inequality around the
world, while income is a widely accepted social determinant of health outcomes (Bravemen and Gottlieb,
2014; Vionnet and Haut, 2018). The principle of fair wages was established as a basic human right by the
United Nations and the International Labor Organization, and is enshrined by standard-setters such as the
United Nations Guiding Principles on Business and Human Rights (UNGPs), SASB, GRI, and the GIIN.
Estimates of the total number of people working below the living wage globally are difficult to ascertain
due to the highly varied nature of labor markets across geographies. In 2018, the World Bank estimated
that half of the global population was living on less than $5.50 per day, which is the poverty-level standard
in upper-middle income countries, meaning 3.4 billion people earned insufficient income to meet their basic
needs (World Bank, 2018). Substantial wage quality disparities exist both across geographical regions and
demographic groups (ILO, 2020). In 2019, the average living wage – the income needed for basic needs to
be met with financial independence – in the U.S. for a family of four (two children and two working adults)
was $16.54 per hour, or $68,808 annually,11 roughly $5,000 greater than the annual median household
income.12 The federal minimum wage in the US has been stagnant at $7.25 since 2009. In 2019, 1.6 million
11 MIT Living Wage Calculator is available at: https://livingwage.mit.edu/. 12 Federal Research Bank of St. Louis. Real Median Household Income in the United Stated. Available at: https://fred.stlouisfed.org/series/MEHOINUSA672N.

12
hourly workers were paid at or below the federal minimum wage.13 While the minimum wage varies greatly
across states and even within certain cities (up to $15/hour), a disparity remains between the living wage
and the legal minimum wage.
Wages are not only frequently below livable standards; growth is stagnant, and wage inequality has
grown substantially. Globally, workers in the top decile of labor income earned $7,475 per person per month
(PPP) in 2017, while those in the bottom decile earned $22 PPP (ILO, 2019). This gap is wider in poorer
countries, meaning the most vulnerable workers earning the lowest wages are also facing the highest levels
of inequality (ILO, 2019). In the US, minority groups are more likely to be paid poverty-level wages than
White employees, with Black workers being 1.5 times more likely and Hispanic workers being two times
as likely (Economic Policy Institute, 2018).
Despite the fundamental importance of earned income, only 54% of employees in the United States
were satisfied with their current wages in a 2019 study (Rothwell and Crabtree, 2019). High levels of wage
dissatisfaction are not surprising considering poor wage growth and rising inequality. In the United States,
productivity rose 96.7% from 1948 to 1973 and hourly compensation rose 91.3% in the same period.
However, from 1973 to 2014 productivity increased 72.4%, yet hourly compensation only rose by 9.2%
(Bivens and Mishel, 2015). Moreover, the effects of this decoupling were not evenly distributed across the
population. Between 1976 and 2006, real income for the bottom income quintile rose $900 (6.3%), while
real income rose $76,500 (79.9%) for the top quintile and $745,100 (232.0%) for the top 1% (Wisman,
2013). The income share held by the top 0.01% income share has reached 6%, surpassing the historic levels
reached just prior to the Great Depression (Saez, 2018).
In addition to the foundational importance of the living wage, organizations create varied impact
through the scale of their workforce. The intrinsic value of employment is corroborated through extensive
and varied fields of research, including the profound negative impact of unemployment on life satisfaction
(Blanchflower and Oswald, 2004; Clark and Oswald, 1994; Young, 2012). As wages increase, there exists
an inflection point at which the incremental impact received from every additional dollar paid in salary
begins to decrease. Research suggests the marginal utility of income decreases as income increases (Layard
et al., 2008; Jebb et al., 2018; Diener et al., 1993), and in some cases show no relationship (Easterlin, 2005)
particularly in the context of higher incomes (Frey and Stutzer, 2010). By providing a method of
differentiating the impact of $1,000,000 in net wages paid to ten employees and one employee, the marginal
impact of income rewards firms for employing a greater number of employees and provides a measure of
the intrinsic value of employment that appears to exist beyond the nominal wage paid.
13 U.S. Bureau of Labor Statistics. Characteristics of minimum wage workers, 2019. April 2020. Available at: https://www.bls.gov/opub/reports/minimum-wage/2019/home.htm.

13
Wage quality can be vastly different for employees within the same firm, and structural inequalities
are often reinforced by pay inequity. A wealth of data demonstrates that women earn lower wages than their
male colleagues performing equal work (Blau and Kahn, 2017), often due to lower initial starting salary
offers for identical positions (Moss-Racusin, et al., 2012). The unexplained gender pay gap is used by
economists to demonstrate the impact of discrimination on the pay differential between male and female
workers in research that controls for factors such as race, education, experience, union status, and region
(Blau and Kahn, 2017). This figure declined from 49% in 1980 to 38% in 2010 (Blau and Kahn, 2017).
Racial wage inequalities also exist, including within-occupation differences that are found to increase in
higher-earning occupations (Grodsky and Pager, 2001). In the United States, the unexplained variation in
the wage disparity between White and Black workers increased from 1979 – 2016 between both male and
female workers (Daly et al., 2017). Due to these persisting disparities, we include a measure of the
controlled wage gap by comparing the salaries of men and women at equivalent job levels.14
Currently, there is highly varied and vastly insufficient data regarding each of the three components
of the wage quality analysis. Firms frequently report the average salary paid at their organization, which
provides limited insight into whether there are portions of the workforce earning below the living wage.
Consumer and investor actions have recently led to an increase of disclosure of the CEO pay gap, which
provides a very limited view of potential wage inequality and incentive misalignment at firms (Rouen,
2020) but does not allow for the comprehensive analysis of wage impact that is possible through analysis
of the wage utility within a company. Finally, there is increased pressure to disclose pay equity statistics,
but the use of average salary figures and the lack of standardized metrics leads to low quality data with
limited value for application and comparison.
Monetization Methodology
The monetization method for wage quality impact uses a compensation cost approach to measure the quality
of wages paid by an organization. Benchmarking at the living wage incentives firms to pay salaries that are
at least equivalent to the living wage.15 The marginal impact of income incentivizes firms to focus on the
wages paid to mid- and low-level employees, the portion of the population that has been historically
disenfranchised from the gains of economic growth. Appendix 2 describes the marginal impact of income
14 As opposed to the controlled wage gap, the uncontrolled wage gap measures the difference in male and female salaries across all jobs. The opportunity dimension addresses this wage gap because an explanatory factor of this gap is that women are less likely to hold top management and high paying positions than men. 15 The living wage is determined from the MIT Living Wage Calculator, which provides detailed living wage data for all U.S. counties and metropolitan statistical areas. MIT Living Wage Calculator is available at: https://livingwage.mit.edu/.
14
function and its application to wage quality impact in detail. The principle of pay equity promotes equal
pay for equal work. Appendix 2 shows the wage equity calculations.
The following steps describe the wage quality monetization process:
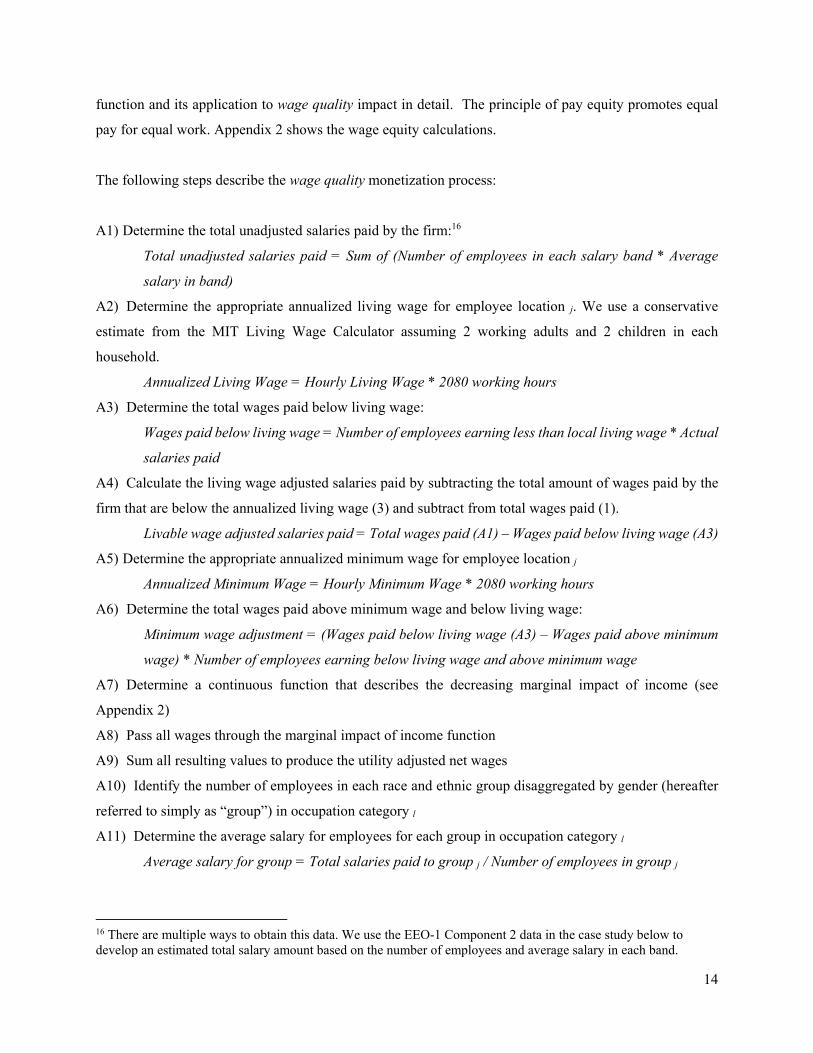
A1) Determine the total unadjusted salaries paid by the firm:16
Total unadjusted salaries paid = Sum of (Number of employees in each salary band * Average
salary in band)
A2) Determine the appropriate annualized living wage for employee location j. We use a conservative
estimate from the MIT Living Wage Calculator assuming 2 working adults and 2 children in each
household.
Annualized Living Wage = Hourly Living Wage * 2080 working hours
A3) Determine the total wages paid below living wage:
Wages paid below living wage = Number of employees earning less than local living wage * Actual
salaries paid
A4) Calculate the living wage adjusted salaries paid by subtracting the total amount of wages paid by the
firm that are below the annualized living wage (3) and subtract from total wages paid (1).
Livable wage adjusted salaries paid = Total wages paid (A1) – Wages paid below living wage (A3)
A5) Determine the appropriate annualized minimum wage for employee location j
Annualized Minimum Wage = Hourly Minimum Wage * 2080 working hours
A6) Determine the total wages paid above minimum wage and below living wage:
Minimum wage adjustment = (Wages paid below living wage (A3) – Wages paid above minimum
wage) * Number of employees earning below living wage and above minimum wage
A7) Determine a continuous function that describes the decreasing marginal impact of income (see
Appendix 2)
A8) Pass all wages through the marginal impact of income function
A9) Sum all resulting values to produce the utility adjusted net wages
A10) Identify the number of employees in each race and ethnic group disaggregated by gender (hereafter
referred to simply as “group”) in occupation category l
A11) Determine the average salary for employees for each group in occupation category l
Average salary for group = Total salaries paid to group j / Number of employees in group j
16 There are multiple ways to obtain this data. We use the EEO-1 Component 2 data in the case study below to develop an estimated total salary amount based on the number of employees and average salary in each band.

15
A12) For each occupation category l, calculate the difference between the average salary paid to White
male employees and minority group j employees, and multiply the resulting value by (8) to determine the
per-group wage gap:
Per-group wage gap = (Average salary paid to White males in occupation category l – Average
salary paid to group j in occupation category l ) * Number of employees in group j in occupation
category l
A13) Determine the total wage equity impact:
Total wage equity adjustment = Sum of per-group wage gaps (A10)
A14) Determine the equity adjusted salaries:
Equity adjusted salaries = Utility-adjusted wages paid (A7) – Wage equity impact (A11)
A13) Determine total wage quality impact:
Wage quality impact = Unadjusted salaries (A1) – Living Wage Adjustment (A3) + Minimum Wage
Adjustment (A6) – Marginal Utility Adjustment (A9) – Wage Equity Adjustment (A13)
Intel Case Study
Intel’s exemplary disclosure of wage data, as discussed previously, facilitates the analysis in this dimension.
We use the workforce demographic and pay disclosures found in Intel’s EEO-1 Component 2 Report to
showcase the wage impact monetization methodology. Intel’s 2018 EEO-1 Component 2 Report lists the
number of employees whose salaries are within set salary bands for each EEOC job category. We determine
the total number of employees within each salary band and then use the middle value of the wage bracket
to calculate the total estimated salaries paid by Intel.17 Total salaries are then adjusted by the living wage
and the marginal impact of income.
An average living wage of $39,880 is calculated for Intel. This value is the weighted average of the
living wages based on the geographic distribution of Intel’s employees. We apply the living wage for a
family of four (with two working adults) for each county in which Intel discloses the number of employees
(96% of domestic labor force disclosed) and create a weighted average based on the number of employees
in each county.18 All average salaries below this are subtracted using the Living Wage Adjustment. All
resulting non-zero average salaries are then adjusted per the marginal impact of income as described in
Appendix 2.
An average local minimum wage of $10.58 ($22,008 per year) is calculated for Intel. We apply a
minimum wage credit to wages paid below the living wage that are above the minimum wage threshold.
17 Intel does not provide information on the total wages paid in different geographies. 18 See the location dimension for a more detailed explanation of Intel’s employee geographic disclosures.

16
For example, consider an individual earning $12/hour (annualized to $24,960), in a location with a
minimum wage of $10/hour, and a living wage of $15/hour. The Living Wage Adjustment described above
debits the firm ($24,960) based on the total wage paid below living wage. The Minimum Wage Adjustment
credits the firm for the difference between the minimum wage ($10 per hour or $20,800 per year) and the
actual wage, creating a positive adjustment of $4,160 ($24,960 - $20,800). This step incentivizes
incremental progress towards the living wage threshold. Intel gains $7.9 million from wages paid above
minimum wage.
The EEO-1 Component 2 Report provides salary and job level data by race/ethnicity and gender
groups. We use these data to calculate the wage equity component of wage impact. Within occupation
categories, we calculate the average salary for each group. We then subtract the average salary for each
group from the average salary of White male employees. If the resulting value is non-negative (i.e. White
males on average have a higher salary), we multiply this value by the number of group employees in each
group within the respective occupation category to produce a monetized impact value. The sum of the
resulting products is the wage equity contribution to the wage impact dimension. Moreover, this is a
negative impact value as it is a penalty against the adjusted total salaries value. We find the total negative
impact of wage equity to be ($465 million). Asian women have the largest negative impact and account for
over 30% of the total impact. The next largest groups – White women followed by Asian men – both have
negative impacts less than half that of Asian women. Appendix 3 describes the negative impact from wage
equity by occupation category and minority group.
As previously defined, wage quality impact is a measure of the total wages paid by an organization
adjusted for a living wage benchmark, the marginal impact of income function, and wage equity within
each occupation category. In this example, Intel is rewarded the $7.3 billion in estimated total wages paid.
However, this value is reduced by ($43 million) due to average salaries paid below the living wage of
$39,880. A credit of $7.9 million is applied for sub-living wage salaries that are above minimum wage.
Wages are then scaled down by the marginal impact of income function, resulting in a debit of ($435
million). Finally, based on our calculations there is a disparity between the average wages of White male
employees and other employee groups, controlling for occupation categories. To compensate for this wage
gap, the adjusted total salaries is reduced by total equity impact of ($465 million). Therefore, the final wage
quality impact value is $6.37 billion, as summarized below in Table 2.
Table 2: Intel Wage Quality Impact
Wage Quality Impact
Total Unadjusted Salaries $7,313,439,500
Salaries Below Living Wage ($43,190,560)

17
Minimum Wage Credit $7,932,875
Marginal Utility Adjustment ($435,334,635)
Equity disparity ($465,488,325)
Wage Quality Impact $6,377,358,856
B. Career Advancement
Contribution to Employment Impact
Formal and informal learning opportunities in the workplace are considered a core element of job quality,
according to the OECD Job Quality Framework (Cazes et al, 2015). At the same time, the world is facing
widening skills gaps and an amplified need for new types of workforce development (OECD, 2019, OECD
Employment Outlook 2019: The future of work). Many companies offer training and skills development
opportunities to their employees, but their effectiveness is measured primarily by inputs (such as dollars
spent on training) rather than outcomes, such as worker promotions or increased earnings based on
professional development (Kotsantonis and Serafeim 2020).
Workers across all income levels agree on the importance and value of employer-provided career
opportunities (Rothwell and Crabtree, 2019). Career development is consistently valued highly by workers.
In a study of 43 factors affecting job satisfaction (including compensation, corporate culture, and job-
specific training), career advancement opportunities within their own organization were rated in the top 10
factors rated as “very important” (SHRM, 2016). While employees value professional development through
formal or informal training, opportunities for advancement within one’s own organization is rated higher
than job-specific training as well as general career development opportunities, indicating they are most
interested in growth that is recognized and rewarded by their own firm (SHRM, 2016).
Despite the clear importance of career advancement opportunities to workers, many employers are
falling short. In a 2019 study conducted in the United States, 74% of workers rated career advancement
opportunities as important but only 48% reported they were satisfied with their access to these opportunities
(Rothwell and Crabtree, 2019). Furthermore, there is significant disparity in access to career advancement
opportunities. Across OECD countries, 60% of high-skill workers participate in some form of training,
compared to only 20% of low-skill workers (OECD, 2020: OECD Employment Outlook 2019: The Future
of Work). Workers earning within the top 10% of wages were nearly two times more likely than those in
the bottom 20% of earnings to express satisfaction with career advancement opportunities (Rothwell and
Crabtree, 2019). Women and under-represented minorities are promoted at a slower rate, despite equivalent
qualifications (Silva, 2010). Women are also less likely than men to have mentors who act as sponsors that
advocate and fight for their mentees promotion to the next level (Ibarra et al., 2010).

18
The need for investment in skill development is amplified by the rapid changes underway in the
global economy. McKinsey Global Institute estimates that automation could displace 400 million workers
(or 15% of global FTEs) by 2030, with up to 800 million workers at risk if the adoption of automation is
accelerated. These workers will require re-skilling, and in some cases will need to change occupational
categories altogether, to avoid the risk of unemployment and/or underemployment (McKinsey, 2017). In
the United States, a recent study suggests up to 25% of jobs are at risk of automation (Muro, et al.,
2019).This trend is likely to exacerbate existing inequalities, with the risk of automation disproportionately
affecting low-wage, low-skilled workers (Kotsantonis and Serafeim, 2020). 19
In the US, skill needs are growing in traditionally low and middle-skills jobs (Holzer, 2015), with
the latter expected to increase as baby boomers transition into retirement (Kochan, 2012). Simultaneously,
employers report difficulty filling middle-skills positions while reported on-the-job training is in decline in
the US (Holzer, et al. 2015), and globally up to 40% of employers report challenges filling jobs due to job
shortages (Bakhshi, et al., 2017). Companies not only have the ability to address their own skills shortages
directly through on-the-job training and development opportunities (McKinsey, 2017), they are also best
positioned to fill middle-skills gaps by promoting career pathways rather than developing isolated skill-sets
(Kochan, et al., 2012). Firms also have an important role to play in enabling adult learning through
interaction with colleagues, promoting individual agency and decision-making, and fostering a culture of
learning and development (World Economic Forum, 2017).
The diversity of training and learning modalities that occur in the workplace make it critical to
measure not just inputs (such as dollars spent on formal training), but outcomes that influence employees
directly. A leading example is the common reporting metric of percentage of employees participating in
training. While this activity has been shown to have a strong influence on productivity (a measure of
primary concern to employers), it has a much weaker influence on wage growth (a measure that is arguably
of much higher concern to employees, rather than employers) (Konings and Vanormelingen, 2015 and
Dearden, et al., 2016). Successful career advancement initiatives result in increased lifetime earnings for
employees (Kochan, 2012), and can be applied in new contexts (World Economic Forum, 2017). Due to
the value placed on internal advancement opportunities by employees (SHRM 2016) and the importance of
demonstrating outcomes rather than simply inputs, our framework measures the increased earnings due to
internal mobility. The methodology is described below.
19 Of course, automation is not the only labor market shift with profound implications for workers. The aging population will increase the need for healthcare workers, the impact of the climate crisis and the shift to a greener economy will create employment demands, and the “marketization” of previously unpaid domestic work (such as childcare) are among some of the most prominent trends predicted to increase labor demand (Manyika et al, 2017). Some analyses predict that not only will occupational categories shift in the coming decade, but the type of skills in higher demand will be interpersonal and people-management skills that are more difficult to automate (Bakhshi, et al., 2017). This growth will require development of skills and knowledge to keep pace.

19
Monetization Methodology
The following steps describe the core process of measuring career advancement impact based on data
disclosed to the EEOC. Similar calculations are possible using employee data obtained from firm human
resource records. The monetization technique applied uses compensation costs in the form of foregone
wages.
B1)Identify the following company data:
a. Total number of employees (Yeart, Yeart-1,)
b. Turnover rate (Yeart, Yeart-1)
c. Total number of employees by occupational category (Yeart, Yeart-1)
d. Average salary by occupational category (Yeart)
e. New hires by occupational category
f. Positions filled by internal candidates
B2) Determine the Total Number of Positions filled in the year (by occupational category). If not available
from company records, it can be calculated as follows:
Replacement positions filled = Turnover rate in Yeart (B1.b) * Number of employees in Yeart-1
(B1.a)
New positions created and filled in Yeart = Change in total number of employees from Yeart-1 to
Yeart,
Total Positions Filled = Replacement positions filled + New positions filled
B3) Determine the number of positions filled from external hire (by occupational category).
B4) Determine the number of positions filled internally (by occupational category).
Number of positions filled internally = Total positions filled (B2) – Number of positions filled from external hire (B3)
B5) Determine the Internal Mobility Rate (by occupational category)
Internal Mobility Rate = Number of positions filled internally (B4) / Total Positions Filled (B2)
B6) Identify the average % salary increase with internal promotion at the company, or use publicly available
data as a proxy.20 In the example below, we use the average increase with promotion for the Manufacturing
Industry of 14.2% (Yildirmaz, et al., 2019).
20 While not all internal mobility results in salary increase, we use this figure to include the value of career advancement, knowledge, and skill development that occurs as employees are given new opportunities. This approach is consistent with the OECD Future of Work analysis which uses wages to proxy for skills development (OECD Employment Outlook, 2019). Companies can ensure value is accurately captured by using payroll and recruitment data regarding employee role changes.

20
B7) Identify the category-level internal mobility rate best-in-class benchmark. In this example, we use a
benchmark of 54% internal mobility (Bidwell, 2014). Benchmarks are likely to increase with higher-level
positions (Yildirmaz, et al., 2019).
B8) Determine the career advancement impact at the firm by calculating the difference between the
internal mobility benchmark and actual internal mobility rate and multiplying the difference by the average
salary increase due to promotion at the firm and the number of positions filled in each category. Add the
impact for each category to determine the total career advancement impact.
Career advancement impact = (Company internal mobility rate (B5) – Benchmark internal mobility
rate (B7)) * (Average salary (B1.d) * average salary % increase with promotion (68) * (Total
Positions Filled (B2))
Intel Case Study
In 2018, we calculate that Intel’s final career advancement impact is ($49 million). This calculation is
conducted at the aggregate company level, using the data as presented in Table 3 and described above.
Intel’s negative career advancement impact shows the missed human capital development opportunity
within the firm. Only 15% of positions filled by the company in 2018 were filled by internal candidates.
Critically, this analysis can and should be conducted at a disaggregated level with available data, showing
results within gender, race, and ethnic groups.

21
Table 3: Intel Career Advancement Impact
Company Data 2016 2017 2018 Notes/Assumptions
A Number of employees (total)
50,263 51,267 52,618 B Company growth 2% 3% C Undesired turnover (global) 3.9% 4.1% 4.8% Source: Intel CSR Report, 2018 D Turnover rate* 8.9% 9.1% 9.8% Intel hire and exit report, 2016 (8909). Assume same growth as (C) E Replacement positions 5,049 Employees 2017 * Turnover 2018 F New positions created 1,351 Employees 2018 - Employees 2017 G Total positions filled 6,400 E + F
H New employees hired (US)
5,183
5,287 5,426 Intel hire and exit report 2016 (5183). Assume same growth as (B) I Internal promotions/transfers 974 G - H J Internal mobility rate 15% I / G K Internal mobility vs. benchmark -39% Bidwell, 2014 rate of internal promotion (54%) L Surplus/Gap internal mobility (employees) (2,482) G * K M Average increase with promotion/transfer 14% Assume internal mobility is rewarded by salary increase N Average salary 138,991 O Career Advancement Impact ($48,980,821) L * M * N

22
C. Opportunity
Contribution to Employment Impact
Across the world, women and minorities are most often relegated to poor quality, low-wage work (Rothwell
and Crabtree, 2019; ILO, 2017). The United States formal labor force has become increasingly diverse over
the past decades as participation increased among women and racial and ethnic minority groups (Toossi,
2002; Burns et al, 2012). However, despite outnumbering Non-Hispanic or Latino White men by a margin
of three to one within the labor force,21 women and minorities are disproportionately under-represented
across occupational categories. In 2012, amongst all Fortune 500 companies, only 25 had non-White CEOs
and 25 had women CEOs.22 By 2019, the number of female Fortune 500 CEOs had only risen to 33.23
Despite improvements over the past decade (Deloitte, 2018), diversity across firm hierarchy is still lacking
as managerial and the highest paying positions are disproportionately held by White men (Tomaskovic-
Devery and Hoyt, 2019).24 Occupational segregation along gender lines is present in labor markets across
the world, and is the largest contributor to the wage gap between men and women (Cortes, 2018).
Bias begins at the point of recruitment and hiring, when occupational sorting funnels employees
into different roles at different rates, despite applicants having equal qualifications (Silva, 2010). The result
of this (often unconscious) bias is a disproportionate number of women and minorities in support, service,
non-technical, and non-management roles. These positions earn lower wages, and are more likely to be
hourly or part-time compared to positions in other occupational categories (and therefore may lack access
to benefits). Low wages have a “scarring effect” similar to unemployment; despite advancement, lower
starting wages inhibit these employees for the rest of their careers (Penner, 2008). In a 2001 study of labor
outcomes among Black and White men, 20% of the race gap in earnings was attributed to occupational
sorting of Black employees into lower-wage positions (when controlling for all other individual
characteristics) (Grodsky and Pager, 2001).
Occupational sorting and unconscious bias negatively impact employees across each of the other
employment dimensions discussed in this paper. The impact manifests by stifling salaries, limiting access
to non-wage benefits, slowing career advancement, disproportionately exposing low-wage and minority
21 United States Bureau of Labor Statistics. Labor force statistics from the current population survey. Available at: https://www.bls.gov/cps/demographics.htm. 22 Diversity, Inc. staff. 2012. Where’s the diversity in Fortune 500 CEOs? Available at: http://www.diversityinc.com/diversity-facts/wheres-the-diversity-in-fortune-500-ceos/ 23 Fortune. 2019. The Fortune 500 has more diversity than ever before. Available at: https://fortune.com/2019/05/16/fortune-500-female-ceos/ 24 Tomaskovic-Devery and Hoyt (2019) collect data from the Equal Employment Opportunity Commission (EEOC) and tabulate the percent of each EEOC occupation category held by gender and race/ethnicity. White workers (normally driven by men) are disproportionately represented in all occupation categories associated with higher wages and career advancement opportunities (e.g. “executives”, “managers”, “professionals”, etc.).

23
workers to health and safety risks, and contributing to decreased job satisfaction (Rothwell and Crabtree,
2019; Penner 2008). For female employees, some scholars argue that wage gaps are most substantially
attributed to occupational sorting (hiring women for some roles and not for others), rather than other forms
of discrimination (Penner 2008, Petersen and Morgan 1995; Fernandez and Weinberg, 1997).
Despite the requirement to file EEOC disclosures regarding gender, race, and ethnicity across
occupational categories, very few companies public share this information. Those who do share information
regarding opportunity at their firm often produce industry or firm-specific reports, for example
demonstrating the percentage of women and minorities in technical roles.25 A lack of standardization leaves
room for misleading data, and inhibits opportunities for comparison and improvement.
Monetization Methodology
Our monetization process is underpinned by the tenet that a company’s hierarchy should reflect the
demographics of the company as a whole. Compensation cost (in the form of lost wages) is used to calculate
impact. The impact calculation process first identifies two groups of employees – those in “high salary”
positions and those in “average salary” positions. Occupation categories with the highest average salary are
incrementally added to the “high salary” group until that group represents at least 10% of the total employee
population.26 All other employees are allocated to the “average salary” group. A weighted average salary
for the “high salary” and “average salary” groups is calculated. Additionally, the demographic composition
of each group is calculated. For each minority group, their percentage representation in the “high salary”
group is subtracted by their representation in the “average salary” group to determine a standard
“opportunity penalty” representing the wage differentials experienced by employees across the firm. This
value is multiplied by the number of employees in the “average salary” group (total employees multiplied
by 0.90) to determine the total opportunity gap across the firm.27
The opportunity dimension monetizes the impact of unequal access to employment within an
organization, using the “high salary” group to represent firm hierarchy. As such, a large (negative)
opportunity impact describes a firm where minority group employees predominantly hold lower salaried
positions. Many firms with a proactive approach to improving opportunity within their organizations
25 To illustrate differences in the approach to diversity reporting, see Facebook (https://diversity.fb.com/read-report/) and Citigroup (https://www.citigroup.com/citi/diversity/annualreport.htm). 26 10% is chosen as the threshold to ensure the “high salary” group is reflective of the highest paying positions in a company that are not exclusively in the executive and senior management categories. Future empirical research as more data become available will be used to reassess the 10% threshold to ensure it is reflective of a range of employment opportunities across the firm. 27 Companies may find they can artificially reduce their negative opportunity impact by increasing the percentage of company employees in the “high salary” group, thus decreasing the employees in the “average salary” group. To ensure the opportunity penalty is reflective of the organization as a whole, we hold 90% of total employees as a constant across firms. This cap prevents this potential source of bias and promotes comparability across companies.

24
conduct analyses of representation across industry or company-specific occupational categories (for
example, they may analyze the percentage of women in technical roles). This provides meaningful
information for recruitment, hiring, and internal mobility. The IWAI framework presents a standardized
approach to produce comparable figures across companies and industries, and is complementary to other
analyses.
The following steps describe the core process of measuring opportunity impact:
C1) Identify the number of total number of employees at each occupational categoryl
C2) Identify the number of employees in minority group j at occupational category l
C3) Determine the average salary for each occupational categoryl
C4) Determine the “high salary” group by incrementally adding the occupational categories with the
highest remaining average salary until the “high salary” group accounts for at least 10% of total
employees
C5) Allocate all occupational categories not in the “high salary” group to the “average salary” group
C6) Determine the percentage of employees in minority groupj for the “high salary” and “average salary”
group
C7) Determine the weighted average salary for the “high salary” and “average salary” groups
C8) Determine the opportunity impact for each minority groupj.28
Opportunity impact for minority group j = (% of minority groupj employees in “high salary” group
- % of minority groupj employees in “low salary” group) * (Total number of employees at firm *
90%) * (Average salary of “high salary” group – average salary of “low salary” group)
C9) Repeat steps (C1) through (C8) for all minority groups and sum resulting values to determine the total
opportunity impact
Opportunity impact = Sum of opportunity penalty (difference between “high salary” and “average
salary” groups) for all minority groups within the organization
Intel Case Study
We use Intel’s 2018 EEO-1 Component 2 Report data to calculate opportunity employment impact. Using
the above described methodology, we calculate opportunity impact for each sex-race/ethnicity group as
defined by the EEOC. The EEO-1 Component 2 Report provides seven occupational categories, as well as
28 There is no impact for a surplus or over-representation of employees in a given group, therefore if (% of minority groupj employees in “high salary” group - % of minority groupj employees in “low salary” group) is greater than zero, zero impact is applied to the account.

25
their corresponding average salary levels. The steps described in the methodology above are repeated for
each occupational category to determine the expected demographic representation.
In order to determine the occupational categories in the “high salary” group and “average salary”
group, the average salaries of each of the seven occupational categories described in Intel’s EEO-1 report
are calculated. The Executive/Senior Officials & Managers category has the highest average salary
($208,000), followed by Sales Workers ($193,613) and First/Mid Officials & Managers ($190,010). These
three occupational categories have the highest average salaries at Intel. Moreover, these occupational
categories account for 0.1%, 1.3%, and 13% of all Intel employees, respectively. Executive/Senior Officials
& Managers is first added to the “high salary” group, followed by Sales Workers. This brings the “high
salary” group to 1.4% of all employees. First/Officials & Managers is next added which brings the “high
salary” group to 14.4%. The “high salary” group now covers at least 10% of the total employees of the
company.29
The weighted average salary for the “high salary” group is $190,458 and $130,315 for the “average
salary” group. Therefore, the difference between these two values is used to monetize the representation
gap between the “high salary” group and “average salary” group for each minority group.
Table 4 describes the opportunity impact for each gender-race/ethnicity group calculated using this
methodology. All values represent negative impacts, as employees are negatively impacted by inequitable
job category representation. Overall, the total opportunity impact for Intel in 2018 is ($415 million).
Representation disparities between male and female employees are fairly even, resulting in a negative
impact of $220 million for men and $195 million for females. The largest individual negative impacts are
driven by Asian females ($174 million) and Asian men ($108 million). Notably, while Black men represent
only 3.4% of total employees at Intel, they bear 9% of the total opportunity impact (a negative impact of
$37 million out of the total $415 million). Asian men, on the other hand, face a very large opportunity
impact ($108 million, and 26% of the total impact) that is proportional to their overall representation in the
workforce (25.6% of total employees). Asian women are only 12.6% of total employees at Intel but carry
42% of the negative opportunity impact.
29 Occupational categories should be added to the “high salary” group until 10% of total employees are accounted for within the group. However, companies should balance adhering to this benchmark with maintaining the “high salary” group as an accurate representation of the highest paying salaries. For example, consider a company where the two highest average salary occupational categories of the firm produce a “high salary” group that is 9% of the total employees of the firm. The occupational category with the next highest average salary represents 30% of total firm employees and has a significantly lower average salary than the occupational categories already included in the “high salary” group, In order to ensure the “high salary” group remains an accurate reflection of the high paying salaries, the company in question should not include the next occupation category and continue with a “high salary” group that is only 9% of total employees.

26
Table 4: Intel Opportunity Impact
White Black NHPI Asian
American Indian
Two+ Hispanic/Latino
Male
Employees in “Average Salary" Positions (%) 33.9% 3.6% 0.2% 26.1% 0.6% 1.1% 7.3%
Employees in "High Salary" Positions (%) 44.4% 2.3% 0.2% 22.3% 0.5% 0.7% 5.2%
Net Male Impact $0 ($36,851,098) ($1,189,748) ($107,673,061) ($1,494,710) ($11,725,305) ($61,256,495)
Female
Employees in "Average Salary" Positions (%) 9.5% 1.2% 0.1% 13.7% 0.2% 0.4% 2.3%
Employees in "High Salary" Positions (%) 13.5% 1.0% 0.0% 7.5% 0.2% 0.3% 1.9%
Net Female Impact $0 ($4,945,982) ($961,589) ($173,922,540) ($1,126,495) ($3,319,750) ($10,751,899)
Total Male Impact ($220,190,416)
Total Female Impact ($195,028,254)
Total Opportunity Impact ($415,218,670)

27
D. Health and Wellbeing
Contribution to Employment Impact Every job influences employee health, whether through the physical effects of the workplace, the benefits
reaped through effective workplace health and wellbeing (HWB) programs (Goetzel, 2014), or the
psychological weight of an unsafe environment (OECD, 2019). Health and safety risks take different forms
in every occupation – frontline healthcare workers with insufficient personal protective equipment (PPE)
to safely care for patients with COVID-19, the long-term deleterious effects of toxic air quality, or instances
of gender-based harassment or violence.
There is growing momentum regarding the intrinsic connection between employment and health.
For example, use of the Health Enhancement Research Organization (HERO) Health and Wellbeing Best
Practice Scorecard has reached over 2,500 companies since the online tool launched in 2009. Results from
the HERO scorecard allow companies to benchmark their progress against their peers, track progress over
time, and contribute to academic research on the impact of corporate practices on employee health
(Rosenbaum, et al 2020).). The expanded understanding of the connection between work and wellbeing is
codified in the “Culture of Health” framework (COH), which argues that organizations impact health in
four ways: through environmental health, community health, consumer health, and employee health
(Quelch, 2016). At a global level, the OECD measures “job strain” as a risk factor for worker well-being
(defined as the combination of excessive demands combined with insufficient resources) (Cazes, et al
2015). Better standardization and quality of metrics is critical to avoid what many have termed “health-
washing” (promoting health without actually improving health), according to many experts working at the
intersection of business and health (Serafeim, Rischbieth, and Koh 2020).
Health and wellbeing matters deeply to employees. In a 2017 analysis of the OECD Better Life
Index, researchers found that Health Conditions had the largest impact on self-reported life satisfaction of
respondents when compared to other factors (Tsurumi and Managi, 2017). These findings support earlier
research in which health status requires the highest value to maintain life satisfaction, for example a 2008
study in which a decline in health from excellent to very poor is associated with a payment of GBP 480,000,
significantly higher than the valuation of other factors such an unemployment and marital status
(Powdthawee, 2008).
The most basic measurement of employee health is the incidence of illness and injury resulting
from work, often referred to as occupational safety and health and enforced through agencies such as the
ILO and state Departments of Labor. Due to the fundamental interconnectedness of employment and health,
as well as the barriers many marginalized workers face in voicing concerns in the workplace, formally
reported incidents likely reflect only a fraction of the impact of employment on health and safety.

28
Nevertheless, in 2019 the International Labor Organization (ILO) estimated that nearly 2.3 million workers
around the world suffered injuries or diseases that originated in the workplace, while approximately 500
million others survived occupational accidents and illnesses (ILO, 2020, The enormous burden of poor
working conditions). Workplace health and safety risks are disproportionately higher for low-income
workers and minorities, and women suffer greater work-related physical and mental health outcomes
(Seabury, et al., 2017; Campos-Serna, 2013). Although it is widely agreed that employers have a
responsibility to protect employees’ health and safety, many workers are forced to make decisions that
prioritize their economic livelihoods over their wellbeing.
Incidents of harassment (whether sexual, physical, or non-physical) are vastly underrepresented in
official statistics, with the United States EEOC reporting that less than 25% of cases are formally reported.30
While the #MeToo movement arguably contributed to a reduction in the most extreme forms of sexual
harassment, there was a subsequent increase in reports of more covert types of gender-based harassment
(Keplinger, et al., 2019). Beyond the #MeToo movement, experts argue that the declining tolerance of
obvert sexual and gender-based harassment is resulting in an increase in more subtle forms of
discrimination, as evidenced by high rates of incivility and bullying (Sabbath, et al., 2018). In the United
Kingdom, studies show as many as 3 out of 5 employees suffer mental health issues due to work or a work-
related factor (Business in the Community, 2018).
Many argue that companies are not only responsible for protecting employee safety but also have
a critical role to play in proactively managing and improving worker wellbeing through access to health
services, and lifestyle and chronic disease management (Quelch, et al., 2016; Coalition for Inclusive
Capitalism, 2019). Access to high quality healthcare is an essential part of employment quality with deep
implications for worker wellbeing.31 Lack of access to health insurance results in greater morbidity and
premature mortality, and an overall loss of valuable health capital (Miller, et al., 2014). However, access is
highly unequal. In the US, 78% of full-time workers say that their employer offers them health insurance,
30 EEOC, https://www.eeoc.gov/select-task-force-study-harassment-workplace.
31 The universe of employer-provided benefits may include health and retirement insurance, paid sick leave, family leave, dependent care, retirement saving and financial planning, and professional and career development (Rothwell and Crabtree, 2019). While each are important to employees, we focus on healthcare, paid sick leave, and family friendly benefits and suggest additional measurement of other areas in the future. It is worth noting that significant differences in workplace benefits exist across the globe (Willis Towers Watson, 2017). For example, Estonia, Bulgaria, Japan, and Lithuania mandate over a year’s worth of paid leave for new parents, whereas Australia, New Zealand, Switzerland, and Ireland require fewer than 10 weeks (Livingston and Thomas, 2019). With regards to sick leave, Australia, Germany, and Norway, among eight other countries, guarantee full pay for workers recovering from a five-day illness; on the other hand, the United States, Canada, and Japan have no national policy requiring employers to provide sick leave for workers (Heymann et al, 2009). The significant variation in provision of benefits highlights the importance of country specific benchmarks in assessing both the access and quality of benefits provided by companies.

29
only 34% of part-time workers say the same. Only 37% of workers in the bottom 20% income quintile had
access to employer health insurance, compared to 90% of those in the mid-to-top income group (Rothwell
and Crabtree, 2019).
Lifestyle and chronic disease management programs are regarded highly not only for providing
cost-savings to employers and improving business performance metrics (such as productivity), but for
directly improving employee health outcomes (Goetzel, 2014). Research shows that organizations that
improve their internal COH scores have significant positive influence on employee health outcomes,
including decreased risk for high body-mass index (BMI), high blood pressure, and improvements in
alcohol use and nutrition habits (Henke, et al., 2019). The 2018 National Compensation survey in the US
found that over 40% of private employers provide workplace wellbeing programs, however significant
disparities exist across wage-levels and industries (Acosta et al, 2018). Large organizations are more likely
to take action to improve lifestyle and chronic disease management (Acosta et al, 2018).
Employers further impact worker health through access to Paid Sick Leave. Evidence shows that
that a lack of paid sick leave is associated with an increase in delayed care costs and lost wages (National
Partnership, 2020). As with other important factors influencing employee health, 78% of full-time
workers have access to paid sick leave or vacation, but that number drops to 33% for part-time workers
(Pew Research Center, 2016). Disparities across wage levels also persist, with only 31% of individuals in
the lowest income group reporting access to paid sick leave, compared to 81% in the mid-to-highest income
group ( (Rothwell and Crabtree, 2019). Employees report that healthcare/medical benefits, paid time off,
and flexibility to balance life and work (for example, family friendly workplace practices) are considered
among the three most important benefits to workers in the US (SHRM, 2016).
Finally, research shows that access to family friendly benefits, including fair scheduling, backup
dependent care, and direct dependent care support, have a strong impact on labor force participation and
earnings (Schochet, 2019). The absence of adequate gender-neutral family leave policies and childcare
support contribute to both gender inequity and lost wages for caretakers (Schochet, 2019). Access to family
friendly workplace benefits also vary widely by wage level. Among workers in the top wage quartile in the
US, 21% have access to childcare support, compared to only 4% of workers in the lowest quartile (Bureau
of Labor Statistics, 2019). The gap for flexible workplace policies is wider, at 21% of the top quartile and
1% of the bottom quartile (Bureau of Labor Statistics, 2019).
The monetization pathways for each Health and Wellbeing sub-dimension is described below.
These sub-dimensions provide a meaningful starting point, and may be expanded upon and tailored for
organizational and geographical context as appropriate.
Monetization Methodology

30
The steps below describe the core process of measuring Health and Wellbeing impact across six sub-
dimensions:
1. Safety (Injury and Illness) 2. Culture (Harassment and Incivility) 3. Healthcare 4. Chronic Disease and Lifestyle Management 5. Paid Sick Leave 6. Family Friendly Workplace
While these analyses do not represent a comprehensive evaluation of how health and wellbeing is impacted
by employment, they provide a meaningful start. Each sub-dimension uses both compensation cost and
value transfer techniques for valuation.
Part One: Safety (Injury and Illness)
D1) Identify the annual incident rate. If available, disaggregate the incidents by injury (type) and illness.
If disaggregated data is not available, use an appropriate proxy.
D2) Convert the incident rate into the number of incidents in the study year. In this example, we use
the Occupational Health and Safety Administration Total Recordable Incident Rate (TRIR), which is
calculated by multiplying the number of recordable cases by 200,000 and then dividing the product by the
total labor hours in the company. We therefore multiply the incident rate by the total number of labor hours
(number of employees * hours worked per year), and divide by 200,000.
Number of incidents = (TRIR * Total Labor Hours) / 200,000
D3) Identify the direct (medical) and indirect (non-medical, for example lost earnings) cost of injury
and illness. For this study, we use figures derived from the U.S. based Survey of Occupational Injuries
and Illnesses and National Council on Compensation Insurance (Leigh, 2011). The average cost per injury
is $217,112, and the average cost per illness is $26,496.
Table 5: Cost of Workplace Incidents, Leigh 2011 (Non-Fatal)
Incident Category Injuries Disease Data Reference Total Incidents Analyzed 855,962 462,704 Table 1, Table 2 Direct and Indirect Costs
Medical $ 53,682 $ 6,851 Table 3 Lost earnings $ 102,166 $ 13,724 Table 3 Fringe benefits $ 27,279 $ 1,837 Table 3 Home production $ 33,985 $ 4,085 Table 3
Total Costs $ 217,112 $ 26,496 Sum

31
D4) Determine a best-in-class benchmark for recordable incidents. The IWAI uses the Good Jobs
Institute aspirational benchmark of zero, therefore all recorded incidents are monetized for impact (Good
Jobs Institute, 2020).
D5) Determine the total cost of injuries. Data regarding the percentage of incidents that are injuries is
available at the company level. In absence of that data, national or industry-level data can be used.
Total cost of injuries = (Number of incidents (D2) * % of incidents that are injuries) * Cost per
injury (D3)
D6) Determine the total cost of illnesses following the same process in (D5).
D7) Determine the total recordable incident impact:
Total recordable incident rate = Total cost of injuries (D5) + Total cost of illnesses (D6)
Part Two: Culture (Harassment and Incivility)
D8) Determine the number of employees experiencing non-physical sexual harassment.32 If this number
is not available, follow steps (D9) – (D11).
D9) Determine the number of female employees who experienced harassment based on best available
research. We find a figure of 24% based on a meta-analysis of workplace harassment in the United States
(Ilies et al, 2003). Multiply the rate by the total number of employees.
Total number of female employees experiencing harassment = Total number of female employees
* % experiencing harassment (24%)
D10) Determine the percentage of EEOC claims filed by male employees in the industry. This data is
available through the EEOC. In this study we access the data through the Center for American Progress,
which shows that 25% of claims in the Manufacturing industry were filed by male employees in 2018
(Center for American Progress, 2018). We therefore assume 75% of incidents are suffered by female
employees and 25% by male employees.
D11) Determine the total number of female and male employees experiencing non-physical sexual
harassment:
Total employees experiencing harassment = Number of male employees experiencing harassment
(D10) = ((D9)/75% *25%) + Number of female employees experiencing harassment (D9)
D12) Determine the total cost of harassment in the workplace using the monetization factor of 19,700
EUR (at current exchange rate) (True Price Foundation, 2020).
32 Note: if using officially filed reports of sexual harassment, the number represents less than 30% of true incidences. Add an additional 70% based on underreporting (EEOC Task Force). Researchers suggest as low as 1 in 10 incidents are reported (Shaw et al, 2018). This data can also be collected from anonymized employee surveys.

32
Impact of harassment = Number of employees experiencing harassment (D8) or (D11) * 19,700
EUR
D13) Determine the number of individuals experiencing incivility through direct employee surveys. If
this number is unavailable, use an evidence-based proxy. In the example below, we use 21% based on
research from 2018 (Sabbath, et al., 2018).
Number of employees experiencing incivility = Total number of employees * Incivility rate (e.g.
21%)
D14) Determine the total cost of incivility in the workplace, using the incremental mental health costs
associated with experiencing at least one type of incivility ($1,557) (Sabbath, et al., 2018).
Impact of incivility = Number of employees experiencing incivility (D13) * $1,557
D15) Determine the total health impact of workplace culture:
Total health impact of culture = Total cost of harassment (D12) + Total cost of incivility (D13)
Part Three: Monetization of Healthcare Impact
Health insurance impact is monetized by connecting health plan quality, proxied using consumer
satisfaction ratings, with health capital foregone per year. Health capital is the present value of utility
resulting from an individual’s lifetime supply of health and takes into consideration the value people have
for their health beyond their future earnings (Miller, et al., 2004). The monetization technique of value
transfer is used in application of the health capital data, which quantifies the individual, family, firm, and
external economic costs of un-insurance. While the Miller study is representative of the United States,
results should be interpreted in context of the time passed since publication, as well as the tiered approach
described below.
D16) Identify the following public data:
a. Total number of employees
b. Company health insurance plans and their consumer satisfaction ratings
D17) Determine the average consumer satisfaction of health insurance plans, using the consumer
satisfaction ratings. In our methodology, we use the publicly available NCQA consumer satisfaction
ratings, which range from 0 (worst) to 5 (best).
Average Consumer Satisfaction = (Plan 1 Rating + Plan 2 Rating + Plan 3 Rating…) / Number of
Plans

33
D18) Identify a benchmark for health capital foregone per year for the uninsured. We use data from Health
Affairs to apply a benchmark of $1,645 foregone per year for the uninsured (Miller, et al., 2004).
D19) Create a tiered system to match consumer satisfaction ratings to health capital foregone. We assume
a linear relationship between tiers and health capital foregone up until a consumer satisfaction rating of
3.56, the average rating for commercial health plans (JD Power, 2018). We associate any rating above the
average with zero health capital foregone. Our tiers are displayed in Table 6 below.
Table 6: Health Plan Rating Tiers
Rating Min Rating Max Health Capital Foregone
Tier 1 (Best) 3.57 5.00 $ -
Tier 2 1.79 3.56 $ 548
Tier 3 (Worst) 1.00 1.78 $ 1,097
Uninsured 0.00 0.00 $ 1,645
D20) Apply the tiered system to determine the health capital foregone per year per employee. For example,
an average consumer satisfaction rating of 2.5 it is in Tier 2, which corresponds to $548 of health capital
forgone per person per year
D21) Determine the total health capital foregone:
Total Health Capital Foregone= Health Capital Foregone Per Year per Employee (D20) * Number
of Employees
Part Four: Lifestyle and Chronic Disease Management
D18) Determine the total number of employees in the firm.
D19) Determine the percentage of employees participating in a health and wellbeing (HWB) program
that includes both lifestyle management and chronic disease management:
HWB program participation rate = Number of employees in HWB program / Total number of
employees at firm
D20) Identify the number of employees participating in HWB program:
HWB participants = (HWB participation rate (D19)* total employees in firm
D21) Determine the change in health outcomes from HWB program (in the example table below, we
analyze the change in patients with hypertension moving from uncontrolled to controlled status).

34
D22) Determine the number of employees at risk of targeted health outcome in the HWB program cohort
using health risk assessment (HRA) or biometric screening data from the HWB program. In our example,
we assume 20% of employees have hypertension based on most recent available CDC data (Fryar et al,
2017).
At risk employees in HWB program cohort = Risk factor (20%) * (HWB participants (D20))
D23) Determine the number of employees at risk of targeted health outcome in the HWB participation
surplus/gap using the same rate used in (D22):
At risk employees in HWB participant surplus/gap = Risk factor (20%) * HWB participants (D20)
D24) Find the cost or savings of the health outcome you are analyzing (e.g. uncontrolled hypertension).
We use data from Kockaya and Werthemier (2011) to identify a savings of $1206 per person per year due
to increased compliance associated with moving to controlled hypertension status from uncontrolled
hypertension status. We call this health outcome x.
D25) Determine the HWB health outcome quality impact:
HWB quality impact = (Actual change in health impact (D21)) * At risk employees in HWB
program cohort (D22) * Cost of health outcome x (D24)
D26) Repeat steps for other health outcomes of interest. Note that it is only possible to achieve zero or
positive impact in this sub-dimension. Sum each one to identify the total value gained through HWB
Lifestyle Management Intervention:
HWB Program Impact = (Cost of health outcome x quality impact (D25)) + (Cost of health outcome
y quality impact) +… + (Cost of health outcome z quality impact)
Part Five: Monetization of Paid Sick Leave Impact
Paid sick leave impact has two components for monetization: 1) the total value gained (lost) through wages
gained (lost) and 2) the average increase in delayed care costs due to inadequate access to paid sick days.
The valuation is based on compensation costs (including lost wages) and value transfer (healthcare costs
due to delayed medical care). The steps are as follows:
D27) Identify the following public data:
a. Total number of employees
b. Average Daily Salary
c. Number of Sick Days Provided
D28) Identify a benchmark for best-in-class number of paid sick leave days. We use data from the
National Institutes of Health to apply a benchmark of 10 days (DeRigne, 2018).

35
D29) Determine how many days of sick leave the company gives, in comparison to the best-in-class
benchmark:
Surplus (Shortage) Days of Paid Sick Leave =Company Policy Days of Sick Leave (D27.c) - Best-
in-Class Days of Sick Leave (D28)
D30) Determine the total value gained (lost) through wages saved(lost) due to paid sick leave:
Total value gained (lost) through Paid Sick Leave = Surplus (Shortage) of Paid Sick Leave (D29)
* Average Daily Salary (D27.b) * Number of Employees (D27.a)
D31) Identify the average percentage point increase of people reporting delayed care for self or family
members between workers with sick leave and workers without any sick leave. We use research from the
Institute of Women’s Policy Research, which states that 14.7% of people with paid sick days report
delayed medical care and 20.6% of people without paid sick days report delayed medical care (Miller, et
al., 2011). We obtain a benchmark of 20.6%-14.7% = 5.9 percentage points for the average increase in %
reporting delayed care due to lack of any sick leave benefit.
D32) Determine a best-in-class benchmark for the number of sick leave days provided. The Bureau of
Labor Statistics states that workers in private industry, on average, received 7 days of sick leave per year
at 1 year of service.33
D33) Create a tiered system to match days of sick leave provided and percentage point increase in
reporting delayed care. We assume a linear relationship between tiers and increase in reporting delayed
care. Any company that provides the average number of sick leave days (7) or more sees a 0-percentage
point increase in employees reporting delayed care. Our tiers are displayed below in Table 7.
Table 7: Increases in Delayed Care
Sick Days
Min Sick Days
Max Increase in Reporting Delayed Care
Tier 1 (Best) 7.0 - 0.00 percentage points
Tier 2 3.5 7.0 1.96 percentage points
Tier 3 (Worst) 0 3.5 3.93 percentage points
No Sick Days 0 0 5.90 percentage points
D34) Determine a benchmark for increased total costs due to delayed care. We use data from the
American Heart Association that identifies $6,628 as the total cost number due to delayed care for patients
experiencing heart failure (Thomas, et al., 2019). Although we recognize that this number most accurately
33 U.S. Bureau of Labor Statistics, 2019. Private industry workers with sick leave benefits received 8 days per year at 20 years of service. Available at: https://bls.gov

36
reflects the costs of delayed care for heart failure patients, we extrapolate the $6,628 to represent the
increased total costs due to delayed care, in general. Because this number only captures one health
condition, we believe this represents a conservative estimate of the impact of delayed care, as most patients
have comorbidities.
D35) Determine the average increase in costs due to delayed care:
Average Increase in Costs due to Delayed Care = Average Percentage Point Increase in People
Reporting Delayed Care (D33) * Increased Total Costs due to Delayed Care (D34)* Number of
Employees (D27.a)
D36) Determine the total value gained (lost) due Paid Sick Leave:
Total Value Gained (Lost) due to Paid Sick Leave = Total Wages Gained (Lost) due to Paid Sick
Leave (D30) + Total Costs due to Delayed Care (D35)
Part Six: Monetization of Family Friendly Workplace Impact
Family friendly workplace impact is monetized by determining (1) the total value gained (lost) through
unpaid parental leave, which we measure in terms of lost/surplus wages, (2) total value gained (lost) through
childcare support, and (3) total value gained (lost) through access to backup childcare. The valuation
technique includes compensation cost (lost wages) as well as market price (direct childcare costs for
children under 6).
D37) Identify the following public data:
a. Total number of female and male employees
b. Average weekly and hourly salary
c. Weeks of paid parental leave provided
d. Average amount of childcare support
e. Number of hours of backup dependent care provided
D38) Proxy for the number of female employees with children under the age of 6:
Number of Female Employees with Children under the Age of 6 = Number of Female Employees *
Percentage of Female Labor Force with Children under 6
D39) Proxy for the number of male employees with children under the age of 6:
Number of Male Employees with Children under the Age of 6 = Number of Male Employees *
Percentage of Male Labor Force with Children under 6
D40) Identify an appropriate paid parental leave benchmark. While research suggests 26 weeks is best
practice (Schulte, et al., 2017; SHRM, 2019), we use data from JUST Capital to apply a benchmark of 16
weeks that better matches current practice in the United States (George, Y., 2019).

37
D41) Determine how many weeks of paid family leave the company gives in comparison to the best-in-
class companies’ weeks of family leave. Do the following for both female and male employees, as some
companies have gender-specific policies (as well as policies that exclude adoptive parents and other types
of parental leave):
Surplus (Shortage) Weeks of Leave = Company Policy Weeks of Leave (D37.c) – Benchmark weeks
of paid parental leave (D40)
D42) Determine the wage replacement value for parental leave, which differs based on company
practice and local policy regulations. This framework uses the proposed wage replacement rate from the
Brookings Institute: 75% of the first $400 of weekly wages, plus 50% of all remaining weekly wages. It
is capped at maximum Social Security taxable earnings (Ruhm, 2017).
D43) Determine the total value gained (lost) due to parental leave. If the company provides more than
the best-in-class amount of leave, the positive impact can be thought of as the marginal income provided
from supplementary paid leave. For example, for female employees:
Total value gained (lost) from parental leave for Female Employees = Number of Female
Employees with Children under 6 (D38) * Surplus (Shortage) Weeks of Leave (D41) * Average
Weekly Wage Replacement (D42)
D44) Determine the average amount of family friendly benefits provided, if a direct monetary value is
not readily available from the company.34 For example, companies may choose to provide discounts on
tuition at childcare centers. The equation below monetizes the impact of a childcare tuition discount:
Average Amount of Childcare Support = Discount on Childcare Tuition * Average Weekly Cost of
Tuition per Week * Number of Weeks of Childcare
D45) Determine the total childcare support provided:
Total Value Gained from Childcare Support = Average Amount of Childcare Support * Number of
Total Employees with Children under 6
D46) Determine the number of backup childcare hours provided for working parents.
D47) Determine the value gained due to backup childcare hours provided:
Total Value Gained due to Backup Childcare = Total hours of backup childcare provided *
Average hourly wage * Number of employees with children under 6 (D38) + (D39)
D48) Determine the total value gained (lost) through family friendly workplace benefits for
qualified employees:
34 The impact of other types of family friendly workplace programs can also be monetized. This example uses a discount provided for childcare costs. Some companies provide on-site childcare options (which reduce commuting cost for caregivers and eliminate the need for backup childcare solutions), some offer flexible spending accounts for employees, and others have flexible work arrangements for caregivers.

38
Total value gained (lost) through family friendly benefits = Total wages gained (lost) through
parental leave (D42) + Total value gained through childcare support (D48)+ Total value gained
through backup childcare services (D47)
Intel Case Study
The total impact of Health and Wellbeing at Intel in 2018 was ($243 million), as presented below in Table
8. There are six sub-dimensions of health and wellbeing impact in the impact-weighted accounting
methodology, each expanded upon in more detail below. Each sub-dimension uses data directly from Intel
as available, and substitution of proxy data is noted as needed.
Table 8: Intel Total Health and Wellbeing Impact
Health and Wellbeing Impact Safety $ (71,182,672) Culture $ (122,551,660) Healthcare $ (28,852,203) Lifestyle and Chronic Disease $ 507,543 Paid Sick Leave $ - Family Friendly Workplace $ (21,308,522)
Total Impact $ (243,387,515)
Intel company information used for these analyses is provided in Appendix 4. The number of
employees, gender representation of employees, and average weekly salary data was provided by Intel. For
purposes of demonstration, we assume that all employees have equal access to programs, services, and
benefits. The weighted average cost of childcare was calculated using information about the number of Intel
employees per state, as delineated above in the Monetization of Family Friendly Workplace Impact section.
Consumer satisfaction with Healthcare Plans was estimated using NCQA consumer satisfaction ratings; the
NCQA does not cover all private insurers, and any insurance plans not included in the NCQA were omitted.
Intel does not publish public information on the number of sick days provided to employees, therefore data
from Glassdoor that was submitted by Intel’s employees was used to proxy for the company’s paid sick
leave policy.
Part One: Safety (Injury and Illness) Intel discloses its OSHA recordable incident rate in their annual Corporate Sustainability Report. In 2018,
Intel had an incident rate of .69. Table 13 below shows how the methodology described above is applied to
Intel’s data for 2018. The cost data applied includes both direct medical costs, as well as costs related to

39
lost earnings, and lost productivity at home (Leigh, 2011). While the medical costs may not be borne
directly by the employee (depending on the terms of their healthcare access), these costs are important to
include as they provide a proxy for other commonly used metrics to estimate the direct impact on
individuals health (e.g. quality adjusted life years or QALYs). OSHA reporting requirements cover all
employers with more than ten employees in the United States, which allows for comparability across
organizations. The European Agency for Safety and Health at Work and the International Labour
Organization are highly reputable sources of comparable data for other countries.
Intel does not report the breakdown of injuries and illnesses within their incident rate. We apply a
rate of 85% injuries and 15% illness based on 2018 data from the semiconductor industry (334413) obtained
through the Bureau of Labor Statistics. In addition to the OSHA TRIR rate, Intel also discloses selected
additional data that can be analyzed for management decision-making For example, they report that
cumulative trauma disorders (CTDs), which are typically related to ergonomics, were the most prevalent
type of injury reported in 2018. This information could be used to calculate a more specific cost of injury
for Intel, and would assist management in taking targeted action to improve workplace health. This level
of detail is exemplary, and is not typical among most companies. For the purpose of replicability, we use
the general incident rate below. Intel’s total safety impact is ($71 million), as demonstrated in Table 9
below.

40
Table 9: Intel Safety Impact
2018 Notes/Assumptions
A Total Recordable Incident Rate 0.69 OSHA Rate B Labor hours 109,445,440 C Number of Incidents 378 A * B / 200,000 D Number of Injuries 321 C * 85% E Cost per injury $ 217,112 F Total cost of non-fatal injuries $ 69,681,967 D * E G Cost per illness $ 26,496 H Number of illnesses 57 C * 15% I Total company cost of non-fatal illness $ 1,500,705 G * H J Value of non-fatal injury and illness $ 71,182,672 K Benchmark: incident rate** - Good Jobs Institute L Total Recordable Incident Rate Impact $ (71,182,672)
* Leigh, 2011 ** Good Jobs Institute
Part Two: Workplace Culture Impact
In our second sub-dimension of Health and Wellbeing, we drill down into the health-related outcomes of
workplace culture. Table 10 below shows the impact of sexual harassment and workplace incivility, both
issues of high importance for which improvement is hindered by under-reporting. Intel did not disclose
information regarding harassment or incivility in 2018, therefore we use the closest data available to impute
the potential health impact. Information gathered from an employee-level survey at Intel could be very
swiftly replaced in the analysis below.
The total Workplace Culture impact at Intel is ($122 million), driven primarily by non-physical
sexual harassment incidence. Values for both components are conservative, as they are used for
demonstration purposes and therefore represent only a portion of potential impacts. For example, the
harassment methodology does not include physical sexual harassment, physical harassment, or other forms
of physical or psychological impacts experienced at the workplace. The figure for incivility is also
conservative, as it excludes the impact of bullying (which would increase the percentage of effected
employees in Row I from 21% to 26%) (Sabbath, et al., 2018). In future analyses, disaggregated data for
incivility is critical, as evidence clearly shows that women and minorities face significantly higher risk of
being victims of this type of behavior in the workplace (Berdahl and Moore, 2006).

41
Table 10: Intel Workplace Culture Impact
Workplace Culture Impact Notes/Assumptions
A Female employees 14,162 B Female employees experiencing sexual harassment* 3,399 A * 24% C Male employees 38,456 D Male employees experiencing sexual harassment** 1,133 (B/75%)*25% E Total employees experiencing sexual harassment 4,532 F Cost per worker of non-physical sexual harassment (EUR) 19,700 True Price Monetization Factors G Cost per worker of non-physical sexual harassment (USD) $ 23,246 Statista exchange rate 1:1.18 H Cost of sexual harassment (non-physical) $ (105,347,153) G * E
I % employees experiencing at least 1 type of incivility
(exclusion, humiliation/ridicule/withholding information)** 21% Proxy data using conservative estimate ( +5% if bullying included)
J Mental health costs due to incivility $ 1,557 Incremental medical costs associated with one type of incivility or bullying (Sabbath 2018)
K Cost of workplace incivility $ (17,204,507) L Total $ (122,551,660) L + H
* Based on meta-analysis of females experiencing workplace harassment (Ilies et al, 2003). This figure can be replaced by actual numbers from employee surveys and EEOC claims, however it must be significantly adjusted upwards based on evidence of drastic underreporting (up to 70% of incidents are not reported). For more information see EEOC Task Force data:
https://www.eeoc.gov/select-task-force-study-harassment-workplace
** 25% of claims are filed by males in Manufacturing industry (Center for American Progress, 2018).

42
Part Three: Healthcare
Table 11 below presents the calculations for the impact of insufficient health insurance on employees,
resulting in a negative value of ($29 million) for FY 2018. Health Capital Foregone per Year is estimated
using the Health Plan Rating Tiers described in the methodology above. Intel’s healthcare provision is
below average quality, resulting in the negative value below.
Table 11: Intel Healthcare Impact
Calculations
Number of Employees 52,618
Consumer Satisfaction (CS) 2.32
Health Capital Foregone pppy $ 548
Total Value Lost $ (28,852,203)
Part Four: Lifestyle and Chronic Disease Impact
The lifestyle and chronic disease sub-dimension works in close partnership with the safety sub-dimension.
HWB programs have a strong emphasis on prevention, and is therefore a valuable leading indicator, while
the recordable incident rate is an important lagging indicator for organizations to manage. The impact from
Intel’s Health and Wellbeing (HWB) program is $507,543. A best-in-class health and wellbeing program
requires three elements: lifestyle management intervention, disease management intervention, and access
to care (Coalition for Inclusive Capitalism, 2019). The Intel CSR report disclosed that 12,165 US-based
employees were enrolled in the Intel Vitality program, which includes programming related to mindset,
nutrition, movement, and wellness. These activities are categorized as Lifestyle Management. Intel’s onsite
Health for Life Centers and employer-provided healthcare provide access to care. Intel also published a
white paper in 2018 highlighting its Connected Care program, including outcomes related to disease
management. We therefore conclude that Intel addressed all three components of an effective health and
wellbeing program as defined above.
Table 12 below analyzes the impact achieved through Intel’s chronic disease management program,
as measured through change in health risk. There are nine health risks in the standard Health Risk
Assessment, and each one can be monetized for impact. For the purposes of demonstration, our model uses
only one metric – hypertension – as an example of the potential impact of an effective employee wellbeing
program. It is therefore a very conservative estimate. Workplace HWB program participation rates vary
widely depending on many factors, including leadership support and use of financial incentives. Intel’s
participation rate is 20%.

43
Due to limited availability of data, there are a number of notable assumptions in the illustration
below. Intel does not provide information regarding improvements (or lack of improvements) in health risk
due to the Intel Vitality workplace wellbeing program. We therefore use data from Intel’s Connected Care
program as an indication of the company’s performance regarding employee health (see Row E). The
percentage of employees with hypertension is derived from national (CDC) data. However, a
comprehensive workplace wellbeing program includes biometric/HRA data and will therefore have
accurate workforce-level information rather than proxy figures for risk levels within the workforce.
Companies will also have the opportunity to include all nine standard Health Risk Assessment areas,
therefore the positive value created may be much greater than that presented below. Positive value will
also increase as employee participation increases.

44
Table 12: Lifestyle and Chronic Disease Impact
Lifestyle and Chronic Disease Management Notes/Assumptions A Employees 52,618 B Employee participation in HWB program* 12,165 C Estimated % of employees with hypertension * 20% CDC, average of 18-39 and 40-59 age groups
D Participating employees with hypertension 2,476 E % HBP moving from controlled to uncontrolled 17% Data from Intel's Connected Care program F Patients with improved compliance 420.85 G Cost savings from hypertension compliance pppy** $ 1,206 Cost savings adjusted to 2018 value H Value of improved compliance $ 507,543 Health outcome quality measure I Total Company Impact of HWB Intervention $ 507,543 H * I
*There are 9 health risks in the standard Health Risk Assessment which measure effects of Lifestyle Management interventions. Each one can be monetized for impact. This model analyzes hypertension due to its strong empirical impact on other health outcomes.
** Kockaya and Wertheimer, 2011.
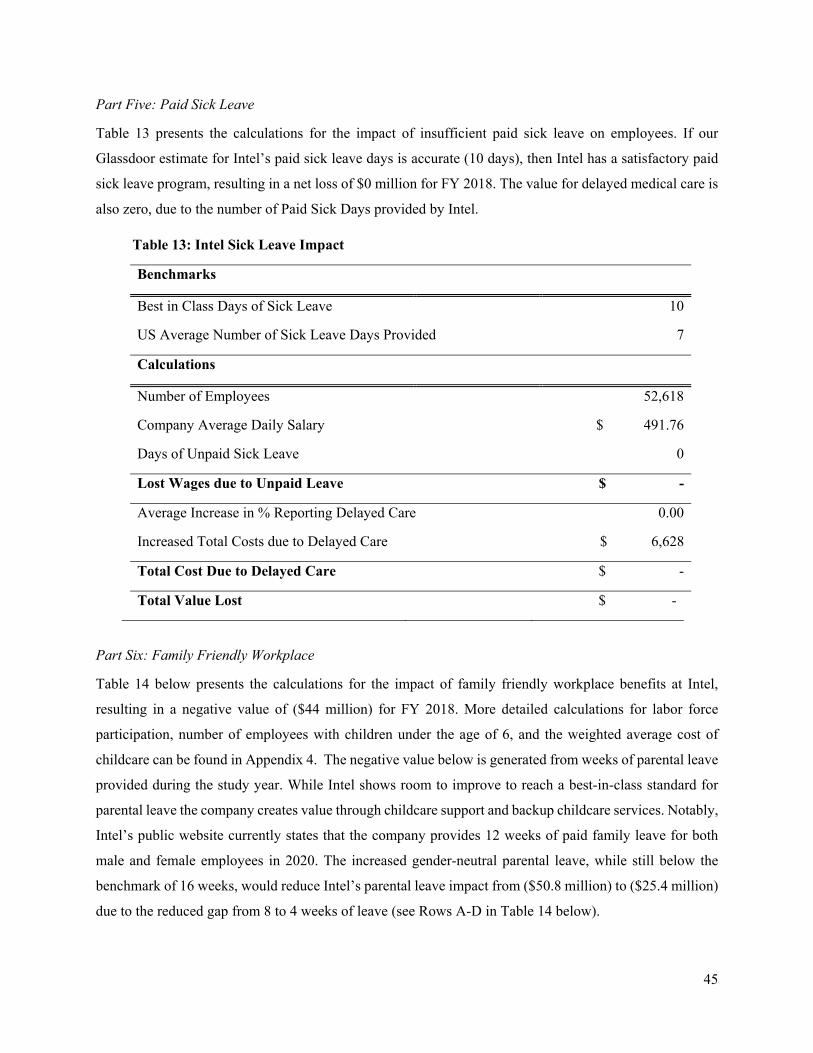
45
Part Five: Paid Sick Leave
Table 13 presents the calculations for the impact of insufficient paid sick leave on employees. If our
Glassdoor estimate for Intel’s paid sick leave days is accurate (10 days), then Intel has a satisfactory paid
sick leave program, resulting in a net loss of $0 million for FY 2018. The value for delayed medical care is
also zero, due to the number of Paid Sick Days provided by Intel.
Table 13: Intel Sick Leave Impact
Benchmarks
Best in Class Days of Sick Leave
10
US Average Number of Sick Leave Days Provided 7
Calculations
Number of Employees
52,618
Company Average Daily Salary
$ 491.76
Days of Unpaid Sick Leave
0
Lost Wages due to Unpaid Leave $ -
Average Increase in % Reporting Delayed Care 0.00
Increased Total Costs due to Delayed Care $ 6,628
Total Cost Due to Delayed Care $ -
Total Value Lost $ -
Part Six: Family Friendly Workplace
Table 14 below presents the calculations for the impact of family friendly workplace benefits at Intel,
resulting in a negative value of ($44 million) for FY 2018. More detailed calculations for labor force
participation, number of employees with children under the age of 6, and the weighted average cost of
childcare can be found in Appendix 4. The negative value below is generated from weeks of parental leave
provided during the study year. While Intel shows room to improve to reach a best-in-class standard for
parental leave the company creates value through childcare support and backup childcare services. Notably,
Intel’s public website currently states that the company provides 12 weeks of paid family leave for both
male and female employees in 2020. The increased gender-neutral parental leave, while still below the
benchmark of 16 weeks, would reduce Intel’s parental leave impact from ($50.8 million) to ($25.4 million)
due to the reduced gap from 8 to 4 weeks of leave (see Rows A-D in Table 14 below).

46
Table 14: Intel Family Friendly Workplace Impact
Family Friendly Workplace Factors Male Female Total Notes/Assumptions A # of Employees w/ Children Under 6 2,953 1,656 4,610 Appendix 4 B Surplus/Gap Parental Leave Provided (8) (8) Benchmark - Actual C Eligible wage replacement* $ 1,379 $ 1,379
D Value gained/lost from Parental Leave $ (32,591,325) $ (18,279,218) $ (50,870,544) A * B * C E # of Employees w/ Children Under 6 2,953 1,656 4,610 F Average Amount of Childcare Support $ 1,495 $ 1,495 $ 1,495 Appendix 4
G Total Value Gained through Childcare Support $ 4,415,938 $ 2,476,730 $ 6,892,668 E * F
H # of Employees w/ Children Under 6 2,953 1,656 4,610 Appendix 4 I Hours of Backup Childcare Provided 10 10 10 Intel, 2015 J Company Average Hourly Salary $ 61 $ 61 $ 61 Appendix 4
K Total Value Gained through Backup Childcare $ 14,523,617 $ 8,145,737 $ 22,669,354 M * N * O
L Value gained(lost) from parental leave $ (50,870,544) D M Value gained from childcare support $ 6,892,668 G N Value gained from backup childcare $ 22,669,354 K O Total Value Gained (Lost) through Family Friendly Workplace $ (21,308,522) L + M + N
*See Methodology Step D42

47
Labor Community Impacts
Organizations have positive and negative impacts through their employment practices on the broader labor
community. Below, we explore two important areas of impact: diversity and location. These examples are
not exhaustive, and there is significant opportunity for additional analysis. For example, a future area of
focus may include the impact attributed to organizations based on their suppliers’ employment impact. We
envision a process by which companies (such as Intel) will be allocated a percentage of their suppliers’
impact-weighted accounting value based on the overall share of the supplier’s revenues derived from the
company in question. For a very simple example, imagine a company that created $2 billion in employment
impact. If 20% of that company’s sales were to Intel, then Intel could carry 20% of the total employment
impact of that supplier on its own calculation ($400 million). Attribution of supply chain impacts is in
alignment with standards such as GRI 202-1 (risk of child and forced labor), WEF Common Metrics (Nature
Loss and Fresh Water Availability), and the United Nations Guiding Principles on Business and Human
Rights. It is therefore an important area for future impact-weighted accounting measurement
The labor community impact dimensions calculated below, diversity and location, have a total
impact of ($1.9 billion) when applied to Intel. The importance of each dimension to measurement of
employment impact, the methodology for monetization, and the application to Intel to demonstrate
feasibility is explained in more detail in the following sub-sections.
E. Diversity
Contribution to Employment Impact
Barriers to employment are a fundamental driver of socioeconomic inequality. Disparities in labor force
outcomes across gender, ethnic, and racial groups can be largely attributed to systematic bias (Charles, et
al., 2018; Perea, 2011; Yemane and Fernández-Reino, 2019). Progress towards equal employment access
is highly varied geographically, and has been faster for some groups than others. There are deep remaining
inequalities in access to employment in the US and globally. White men in the US have the highest access
to work (BLS, 2020, Table A-2. Employment status of the civilian population by race, sex, and age),35
while Black men and women are nearly twice as likely to be unemployed as White men or women.36 The
35 United States Bureau of Labor Statistics. Employment Projects. Available at: https://www.bls.gov/lau/ptable14full2019.htm 36 United States Bureau of Labor Statistics. Table A-2 Employment Status. Available at: https://www.bls.gov/news.release/empsit.t02.htm.

48
monumental job losses in 2020 during the COVID-19 pandemic have been disproportionately suffered by
women and minorities, who continue to bear a larger burden of unemployment.37
Structural inequalities contribute to barriers to entry in the labor market. For example, between
2007 and 2016, 70% of new jobs were listed as requiring a 4-year college degree (BLS, 2017),38 however
over 60% of the workforce over the age of 25 does not have a college degree (Opportunity@Work and
Accenture, 2020), and college enrollment varies significantly by race/ethnicity (NCES, 2017).39 In addition
to hiring bias, women face the additional challenge of conforming to working schedules that for the most
part are often infeasible for individuals caring for children or other dependents (who are disproportionately
female) (NWLC, 2019). Lack of family friendly workplace practices (analyzed in the Health and Wellbeing
dimension) and the oversized share of domestic responsibilities contributes negatively to female labor force
participation (Schochet, 2019; BLS, 2017; Glynn, 2018).
It is critical to note the extreme heterogeneity of female and minority representation across
industries, sectors, and job types. For example, in the US women make up a disproportionate number of the
voluntary part-time workforce (with childcare and family/personal obligations cited as a primary reason for
part-time status), and have much greater representation in the healthcare industry than in technology and
manufacturing (BLS, 2017; BLS, 2019, Quality of life benefits: Access, private industry workers; Penner
2008; Cortes 2018). Black and Latino workers are more likely to work part-time schedules, with minority
women most likely to be in low-paying service work (Economic Policy Institute, 2020; Cajner et al., 2017;
Cohen and Casselman, 2020). White men have greater access to high paying jobs, an advantage that is
strengthened in states with larger minority workforces (Tomaskovic-Devery and Hoyt, 2019).
Women and minorities face substantial bias and discrimination in recruitment and hiring, as
evidenced by extensive research (Zschrint and Ruedin, 2016). Correspondence tests, in which two identical
applicants apply to the same position with one differentiating characteristic (gender, race, ethnicity) show
discrimination exists across geographies and sectors (Zschrint and Ruedin, 2016; Rich 2014). A meta-
analysis conducted in 2016 found that minority group applicants had 49% lower odds of receiving a job
interview when compared to equally qualified candidates (Zschrint and Ruedin, 2016). Gender-based bias
in correspondence analyses is also significant, although there is variation across industries (Baert, 2018).
As with other human capital disclosures, diversity metrics are highly varied across organizations
and contexts. Pressure from investors, regulators, and consumers lead to isolated and idiosyncratic
37 Georgetown University Center on Education and the Workforce. https://cew.georgetown.edu/cew-reports/jobtracker/#jobs-tracking 38 United States Bureau of Labor Statistics. https://www.bls.gov/opub/ted/2017/occupations-typically-requiring-high-school-for-entry-lost-1-3-million-jobs-may-2007-16.htm 39 In 2016, the percentage of 18-24 year olds enrolled in college in the US by race/ethnicity was as follows: Total 41%, White 42%, Black 36%, Hispanic 39%, Asian 58%, Pacific Islander 36%, American Indian/Alaska Native 19%, and Two or more races 42%. NCES: https://nces.ed.gov/programs/raceindicators/indicator_REA.asp

49
availability of data. For example, protests in the United States and across the world in 2020 regarding anti-
Black racism and police brutality has invigorated calls for greater, more uniform disclosure on hiring,
retention, and compensation of minorities (Mahoney and Bixby, 2020; George, 2020). A swell of activism
surrounding the #MeToo movement has arguably contributed to improved data regarding gender within
organizations (Billings, et al.,2019). While more companies are beginning to disclose basic diversity figures
such as “percent women (minorities) employed” and “percent women (minorities) in management,” only
3% of Fortune 500 companies shared complete employee demographic data in 2017.
We highlight the issue of firm diversity because unequal access to employment contributes to
significant disparities in labor force outcomes (Cajner et al., 2017). The monetization methodology is
described below.
Monetization Methodology
Our methodology for monetizing diversity impact posits that the gender and racial/ethnic demographics of
a firm should reflect the demographics of the local population, using the most recent, specific data available
(e.g. in the United States, we use the demographics at the county level). The monetization methodology
identifies the number of women and minorities that should be employed at the firm for equal parity between
workforce demographics and population demographics. The number of additional employees for each
underrepresented demographic group is multiplied by a wage penalty, producing a monetary value that
reflects the negative diversity impact for the respective underrepresented group. The following steps
describe the core process of calculating diversity impact.
E1) Determine the total number of employees at the firm.
E2) Identify the number of employees in minority group j.
E3) Determine the ‘expected’ proportion of employees in minority group j by examining local demographic
data (e.g. if 15% of the local population is Asian women, the expected proportion of this group in the
firm is also 15%).
E4) Determine the expected number of employees at the firm for minority group j:
Expected employees in group j = Total employees at firm (E1) * Local demographic benchmark
(E3)
E5) Determine the missing employees at the firm in minority group j required for parity:40
Missing employees in group j = Expected employees in group j (E4) – Number of actual employees
in group j (E2)
40 If this number is positive, there is no under-representation of this group, and the impact is zero (0).

50
E6) Determine the monetized diversity impact for minority group j:
Monetized diversity impact for group j: Missing employees in group j (E6) * Weighted average of
the “average salary” group (C7)41
E7) Repeat steps E2 through E6 for each group.
E8) Sum the values produced in step (E7) for each minority group to determine the total monetized diversity
impact:
Diversity impact = Sum of monetized diversity impact for employees in each demographic group
Intel Case Study
Diversity impact addresses the representation of minority groups within an organization. We use Intel’s
EEO-1 Component 2 Report to demonstrate the application of the diversity impact monetization
methodology. The Report provides the number of employees in each occupation category by gender and
race/ethnicity. Therefore, minority groupj is a gender-race/ethnicity group (e.g. Asian women or Black
men). Steps (2) and (3) are calculated with this definition of minority groupj.
We find a ($2.32 billion) diversity impact for Intel, with nearly $2 billion derived from lack of
female representation (see Table 15 below). The group with the largest associated negative impact is White
women. White women make up 10.1% of Intel’s current workforce, but are 27.3% of the local populations,
resulting in a ($1.2 billion) negative impact. Hispanic or Latino women have the second largest impact at
($542 million), followed by Hispanic or Latino men at ($236 million).
An important finding is that Asian men and Asian women have no negative diversity impact, as
both groups are overrepresented at Intel. For example, Asian men account for 25.6% of Intel’s employees
but are only 7.0% of the local demographics. While Asian men and women have no negative diversity
impact, they have the largest and second largest opportunity impacts. Conversely, White women have the
largest diversity impact, but no opportunity impact. These two cases highlight the collaborative nature of
the opportunity and diversity dimensions. Diversity impact captures overall representation of demographic
groups across an organization. Opportunity impact captures the representation of demographic groups
within an organization’s hierarchy, conditional on the overall representation found in the diversity
dimension. For example, organizations that have very little diversity (or little diversity for a specific
demographic group) and, as such, have large, negative diversity impact are likely to have small opportunity
impacts. If there are no diverse employees in the organization to elevate to higher positions, there can be
no negative opportunity impact. The opposite scenario is also true. Only organizations with strong diversity
practices (small diversity impact) are more likely to have large opportunity impacts.
41 A description for the calculation of the “average salary” group is provided in the opportunity impact dimension.

51
Table 15: Intel Diversity Impact
White Black NHPI Asian
American Indian
Two+ Hispanic/Latino
Male
Current Employees 18,621 1,775 102 13,446 294 532 3,686
Current Employees (%) 35.4% 3.4% 0.2% 25.6% 0.6% 1.0% 7.0%
Local Demographics 26.6% 2.4% 0.3% 7.0% 0.9% 2.1% 10.4%
Missing Employees N/A N/A 36 N/A 200 552 1,812
Net Male Impact $0 $0 ($4,722,095) $0 ($26,073,412) ($71,983,428) ($236,175,094)
Female
Current Employees 5,290 612 36 6,722 101 205 18,621
Current Employees (%) 10.1% 1.2% 0.1% 12.8% 0.2% 0.4% 2.3%
Local Demographics 27.3% 2.3% 0.3% 7.4% 1.0% 2.1% 10.2%
Missing Employees 9,053 578 101 N/A 404 894 4,166
Net Female Impact ($1,179,754,002) ($75,261,033) ($13,150,553) $0 ($52,647,343) ($116,506,776) ($542,918,403)
Total Male Impact ($338,954,029)
Total Female Impact ($1,980,238,109)
Total Diversity Impact ($2,319,192,138)

52
F. Location
Contribution to Employment Impact
Access to work is inequitable across geographies, as evidenced by dramatically varying levels of
unemployment both between countries and across rural and urban divides (ILO, 2020, World employment
and social outlook: Trends 2020). Extensive labor market research shows myriad geographical disparities
in access to work and particularly access to decent, quality work (ILO, 2020, World employment and social
outlook: Trends 2020). Unemployment rates are rising among low-income countries compared to lower-
middle income and upper-middle income groupings (ILO, 2020, World employment and social outlook:
Trends 2020), with serious consequences for workers.42 The share of labor income varies greatly (and is
significantly hindered by data availability outside of formal labor markets), however, the importance of
employment opportunities to individual health and prosperity is universally accepted (Gomis, 2019; Gibb,
et al., 2014). For previously employed individuals, instances of unemployment stigmatizes reemployment
attempts, creating a future barrier to work similar to those faced by people with a criminal record (Pager,
2008) or mothers re-entering the workforce (Correll et al., 2007). Eventually reemployment is often at a
lower pay (Gangl, 2006; Fuller 2008) and recovers only two-thirds the initial harm from job loss (Young,
2012). Moreover, life satisfaction declines sharply during unemployment and remains low until new
employment is found (Blanchflower and Oswald, 2004; Clark and Oswald, 1994) and little can be done to
ameliorate the stress of unemployment (Young, 2012).
In the United States, jobs in rural area have historically been production and manufacturing
focused, making them more vulnerable to business cycles, foreign competition, and technological
displacements (McGranahan, 1988), and resulting in a higher likelihood of permanent job loss (Glasmeier
and Salant, 2006). Following the 2008 Financial Crisis, metropolitan areas recovered to pre-crisis levels of
job growth by 2013, while rural areas were harder hit and have yet to fully rebuild.43 Employment in rural
areas is more likely to be dominated by large, singular employers, leaving communities at high risk of
skyrocketing unemployment if those companies close their doors.44
Job creation is a highly tracked indicator for firms, investors, development institutions, and many
other stakeholders.45 However, it is uncommon to measure the incremental impact of employment
42 While unemployment rates are highly varied across the world, it is also necessary to note the fundamentally distinct nature of labor markets across different geographies that make these data important to analyze critically. For example, unemployment rates do not account for critical differences in participation in other areas of work such as the informal economy or unpaid caregiving and domestic labor. 43 Analysis by Steven Beda using Integrate Public Microdata Series. Data available at: https://usa.ipums.org/usa/ 44 Adamy, J. and Overberg, P. One Nation, Divisible: Rural America is the New ‘Inner City’. Wall Street Journal. May 26, 2017. Available at: https://www.wsj.com/articles/rural-america-is-the-new-inner-city-1495817008. 45 See examples from the Global Reporting Initiative, the Global Impact Investing Network, the World Economic Forum Common Metrics, among others.

53
opportunities within the local economic context. The location dimension incentivizes firms to create
employment opportunities where they are most needed. In geographical areas with low unemployment, the
availability of jobs for those seeking jobs should be high.46 In areas where unemployment is high, job
availability is less, and thus the jobs that are available are of greater impact. Alternatively, when
unemployment is low but employment opportunities are consolidated with a small number of employers,
employment alternatives are limited and thus existing employment opportunities are of greater impact.
Critically, the analysis works in close concert with the other 7 dimensions of employment impact
to ensure that firms are creating high quality (and not simply low cost) jobs in any area in which they
operate.
Monetization Methodology
The monetization methodology for location impact measures a firm’s contribution to local employment
opportunities. If the firm provides optionality by bringing new jobs to an area of high unemployment and
makes a significant contribution to the existing job market, then the location impact of the firm increases.
Optionality is measured by the local unemployment rate and contribution is measured by a firm’s input to
the local unemployment rate (i.e. the expected initial increase in the local unemployment rate if the company
were to shutter operations). Location impact is monetized by utilizing the additional income beyond
unemployment benefits, an employee would on average receive from being employed by the firm.
The following steps describe the core monetization methodology for location impact:
F1) Identify the number of employees at firm location l
F2) Identify total employed individuals from local unemployment statistics for firm location l
F3) Identify total unemployed individuals from local unemployment statistics for firm location l
F4) Identify maximum yearly unemployment benefits for firm location l47
F5) Identify average salary of firm employees
F6) Determine the incremental wages received due to employment:
Incremental wages received = Average salary of firm employees (G5) – Maximum yearly
unemployment benefits (F4)
46 This assumes unemployment is not artificially being decreased through discouraged job searchers leaving the labor force. Additionally, unemployment could be high and job availability be high if the skills/education of the population do not match the required skills/education of the jobs available. 47 Our methodology uses unemployment benefits as a counterfactual for income earned through employment at the organization we are studying, but does not make any assumption regarding the potential real employment status of individuals in absence of the organization’s operational status in its current location(s).
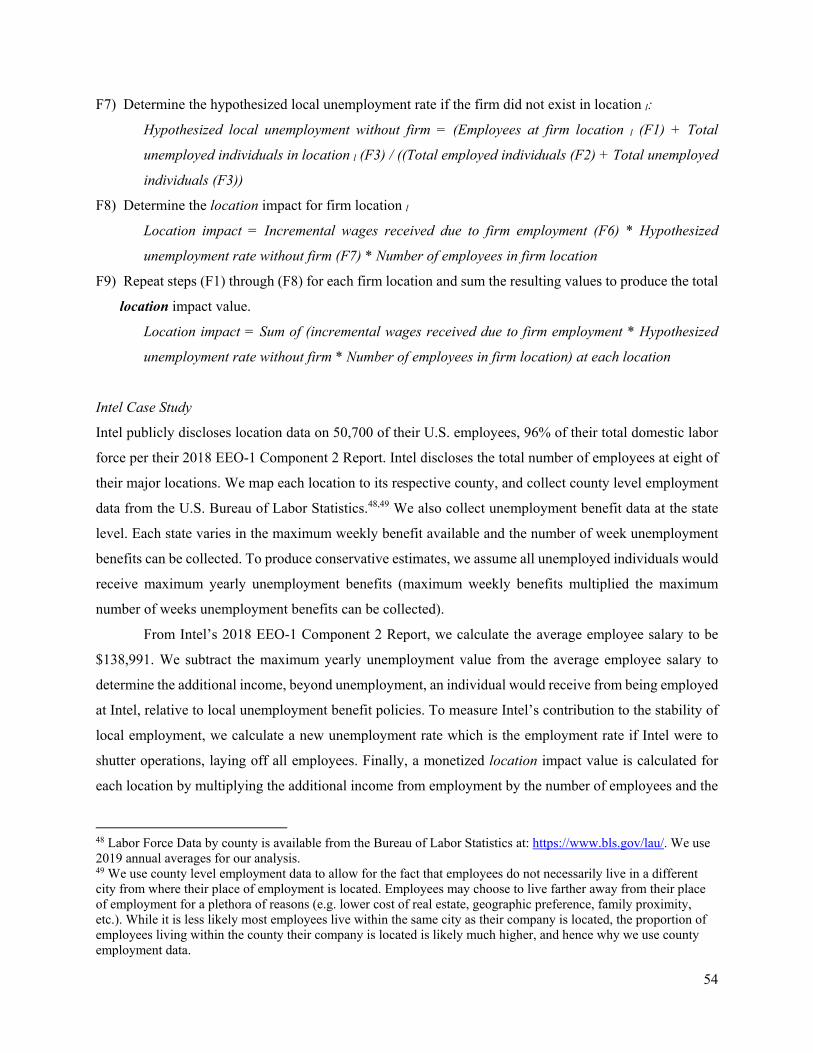
54
F7) Determine the hypothesized local unemployment rate if the firm did not exist in location l:
Hypothesized local unemployment without firm = (Employees at firm location l (F1) + Total
unemployed individuals in location l (F3) / ((Total employed individuals (F2) + Total unemployed
individuals (F3))
F8) Determine the location impact for firm location l
Location impact = Incremental wages received due to firm employment (F6) * Hypothesized
unemployment rate without firm (F7) * Number of employees in firm location
F9) Repeat steps (F1) through (F8) for each firm location and sum the resulting values to produce the total
location impact value.
Location impact = Sum of (incremental wages received due to firm employment * Hypothesized
unemployment rate without firm * Number of employees in firm location) at each location
Intel Case Study
Intel publicly discloses location data on 50,700 of their U.S. employees, 96% of their total domestic labor
force per their 2018 EEO-1 Component 2 Report. Intel discloses the total number of employees at eight of
their major locations. We map each location to its respective county, and collect county level employment
data from the U.S. Bureau of Labor Statistics.48,49 We also collect unemployment benefit data at the state
level. Each state varies in the maximum weekly benefit available and the number of week unemployment
benefits can be collected. To produce conservative estimates, we assume all unemployed individuals would
receive maximum yearly unemployment benefits (maximum weekly benefits multiplied the maximum
number of weeks unemployment benefits can be collected).
From Intel’s 2018 EEO-1 Component 2 Report, we calculate the average employee salary to be
$138,991. We subtract the maximum yearly unemployment value from the average employee salary to
determine the additional income, beyond unemployment, an individual would receive from being employed
at Intel, relative to local unemployment benefit policies. To measure Intel’s contribution to the stability of
local employment, we calculate a new unemployment rate which is the employment rate if Intel were to
shutter operations, laying off all employees. Finally, a monetized location impact value is calculated for
each location by multiplying the additional income from employment by the number of employees and the
48 Labor Force Data by county is available from the Bureau of Labor Statistics at: https://www.bls.gov/lau/. We use 2019 annual averages for our analysis. 49 We use county level employment data to allow for the fact that employees do not necessarily live in a different city from where their place of employment is located. Employees may choose to live farther away from their place of employment for a plethora of reasons (e.g. lower cost of real estate, geographic preference, family proximity, etc.). While it is less likely most employees live within the same city as their company is located, the proportion of employees living within the county their company is located is likely much higher, and hence why we use county employment data.

55
new unemployment rate. Table 16 lists location impact values for each Intel location and describes the
input data for calculate impact values.
We calculate a total location impact of $401 million. Much of the total location impact is driven
by the Hillsboro, Oregon location. While this location employs the most Intel employees (21,000), it is also
the location with the largest relative contribution to local employment. The reported county unemployment
rate for Hillsboro is 3.1%. However, if we were to remove the employment opportunities Intel provides to
the local job market, the local unemployment rate would jump to 9.5%. In general Intel operates in locations
with low unemployment rates and where it is not a major contributor to local employment. After Hillsboro,
Rio Rancho, New Mexico is the location in which Intel provides the largest relative contribution to local
unemployment. While Intel only employs 1,200 employees in Rio Rancho, if those 1,200 lost their jobs
local unemployment would jump from 4.8% to 6.6%.

56
Table 16: Intel Location Impact
Location County Employed (County)
Unemployed (County)
Unemployment Rate (County)
Maximum Weekly
Unemployment Benefits (State)
Maximum Weeks of Benefits (State)
Maximum Yearly
Unemployment Income
Additional Income
from Employment
New Unemployment
Rate
Intel Employees
Impact
Austin, Texas Travis 722,054 19,047 2.6% $521 26 $13,546 $125,445 2.8% 1,700 $5,970,090
Chandler, Arizona Maricopa 2,217,656 92,847 4.0% $240 20 $4,800 $134,191 4.5% 12,000 $73,072,638
Folsom, California Sacramento 686,298 26,096 3.7% $450 26 $11,700 $127,291 4.5% 6,000 $34,409,655
Fort Collins, Colorado Larimer 201,624 4,859 2.4% $597 26 $15,522 $123,469 2.6% 600 $1,958,568
Hillsboro, Oregon Washington 315,008 9,998 3.1% $648 26 $16,848 $122,143 9.5% 21,000 $244,641,945
Rio Rancho, New Mexico Sandoval 63,268 3,207 4.8% $542 26 $14,092 $124,899 6.6% 1,200 $9,936,322
Santa Clara, California Santa Clara 1,027,527 26,196 2.5% $450 26 $11,700 $127,291 3.1% 6,500 $25,673,196
San Jose, California Santa Clara 1,027,527 26,196 2.5% $450 26 $11,700 $127,291 2.6% 1,700 $5,728,789
Total Impact $401,391,204

57
G. Total Employment Impact
Intel Corporation created a total positive impact of $3.75 billion through employment in 2018, including
$5.7 billion targeting employees, and ($1.9 billion) targeting the broader labor community. This is a
significant amount, representing 26% percent of US revenue, 57% of US EBITDA and 51% of total
estimated salaries paid in the United States. This substantial value was previously not measured or disclosed
by Intel, and signals to peers, investors, and broader stakeholders that there is sizable social impact through
positive employment practices. The analysis also illuminates potential to create additional value for
employees through improved performance in many employment dimensions, which are demonstrated
below in monetary values that can be reflected in accounting statements for the first time. The total
employment impact for Intel is presented in Table 17.
Table 17: Intel Total Employment Impact (United States)
Dimension Impact % Revenue % EBITDA % Salaries
Employee Impact
Wage Quality $ 6,377,358,856 44.59% 97.05% 87.20% Career Advancement $ (48,980,821) -0.34% -0.75% -0.67% Opportunity $ (415,218,670) -2.90% -6.32% -5.68% Health and Wellbeing $ (263,223,199) -1.84% -4.01% -3.60%
Subtotal $ 5,669,771,850 39.64% 86.28% 77.53% Labor Community Impact
Diversity $ (2,319,192,138) -16.21% -35.29% -31.71% Location $ 401,391,204 2.81% 6.11% 5.49% Subtotal $ (1,917,800,935) -13.41% -29.19% -26.22%
Total Impact $ 3,751,970,915 26.23% 57.10% 51.30%
As described in Section 2 above, one of the sub-dimensions included above is monetized using
imputed data: workplace culture (within the health and wellbeing dimension). The total employment impact
for Intel in 2018 excluding this sub-dimension is $3.9 billion (a reduction in negative impact of $122
million).
In order for the figures Table 17 to be most actionable and relevant to investors, managers,
employees, and customers, they must be integrated within Intel’s financial statements, and become part of
the language of managerial and investment decision-making.
6. Accounting Treatment of Employment Impact
A few key points arise from the company case study and subsequent discussion regarding accounting for
employment impact. First, the starting point of the methodology is crediting companies with the amount of
wages they have paid to employees above living wage (adjusting for the marginal utility of income and

58
equity). From that starting point, most dimensions have a debit effect reducing the positive employment
impact. Exceptions include location that credits companies for employing individuals in areas with limited
employment opportunities and health and wellbeing, which rewards companies for superior performance
on those dimensions. Therefore, theoretically a company’s maximum employment impact would be the
total wages paid plus any positive location impact for companies with employees in high unemployment
areas and any additional credits for health and wellbeing. A company’s minimum employment impact could
be negative. This would be the case for a company that pays only a limited number of employees very high
wages, many employees below living wage, offers bad benefits, exhibits little career advancement among
employees, demonstrates unequal access to job opportunities among demographic groups, and has poor
health and wellbeing outcomes.
Accounting for organizational impact on employees presents new challenges and opportunities that
go beyond the process of monetization described in depth in Section 5. Current accounting practices
consider employees primarily as a cost-driver. The bulk of expenses are evident in a firm’s Selling, General,
& Administrative (SG&A) expenditures within the income statement, with the highest cost driver by far
consisting of salaries and wages. Many companies also incur significant payroll expenses in Research and
Development as well, while other activities such as employee training are also accounted for exclusively
as costs. This approach to accounting for human capital is limited, and is disconnected from the adage
touting employees as a company’s greatest asset (Rouen, 2019). Further, when recognized within financial
statements exclusively as an expense, employees are left vulnerable to under-investment, or even to
elimination by managers seeking to improve the appearance of their bottom line.
We propose a recording of employment impact within the income statement and balance sheet of
an organization. Careful attention is needed to determine the timing and classification of both income
statement and balance sheet employment impacts. The income statement (here used to include the Statement
of Other Comprehensive Income) will include same year effects of employment impact, recorded as either
a positive amount for positive impacts or a negative amount for negative impacts. Each year, employment
impact from the income statement will be carried over to the balance sheet and recognized as a form of
equity (recorded as “accumulated other comprehensive income”). A corresponding entry would be either
on the asset recognizing a human capital asset or a liability recognizing negative effects on employees.
These balance sheet impacts would be carried over and amortized over time. The amortization schedule
could be a function of employee turnover or based on how the impacts might manifest over time.
An illustration of the integration of employment impact is possible in the health and wellbeing
dimension. Firms currently recognize expenditures related to employee health and wellbeing (HWB)
programs within the income statement as a line item within SG&A, which results in reduced operating
income. The IWAI employment framework, on the other hand, calculates a monetized value for health

59
outcomes based on employee access to high quality HWB services, through the healthcare and lifestyle and
chronic disease sub-dimensions. A company that pays more for a high quality HWB program may incur a
larger expense within their income statement than a competitor who pays less for a lower-quality program.
Under current accounting standards, with all else equal, the former company would report lower earnings
than the latter. However, the IWAI employment impact framework presents a monetized value for improved
employee health outcomes, which would be recognized as a positive impact in the income statement.
Likewise, a company with poor participation and/or low quality HWB programming would demonstrate
negative impact in this employment impact dimension, resulting in an expense recorded on the income
statement. There is a clear connection between HWB and employee health outcomes (see Section 5D
above), as well as between health outcomes and job satisfaction, turnover, and productivity (Bakotic, 2016;
Gubler, et al., 2018; Halkos, 2010; Platis and Bousinakis, 2015; Singh and Loncar, 2010). Properly and
comprehensively accounting for HWB as more than a recurring cost, either through an adjustment to
income or a as a balance sheet entry, has significant potential to more accurately analyze both business and
employee outcomes while incentivizing businesses to improve employee well-being.
Consider the example of salaries, as illustrated through the Intel case study. The accounting
treatment of wage quality is demonstrated in Table 18 below through a mock snapshot of Intel’s 2018
income statement. Currently, salaries are recorded solely as an operating expense. There are various options
for an accounting treatment that realigns management incentives and creates transparency employee
treatment. One potential solution is an adjustment to Other Comprehensive Income by including the
unadjusted salary value as a positive impact adjustment, and the quality-based adjustments for living wage,
marginal utility, and wage equity as a negative impact adjustment. The final impact on income is the value
of wage quality impact as demonstrated in Table 2 (Section 5).
Table 18: Example Accounting Treatment for Wage Quality Impact, Intel
Income Statement 2018 Notes
Revenue
Total Unadjusted Salaries $7,313,439,500
Operating Expenses
Salaries Below Living Wage ($43,190,560) Negative impact adjustment
Minimum Wage Credit $7,932,875 Positive impact adjustment
Marginal Utility Adjustment ($435,334,635) Negative impact adjustment
Equity disparity ($465,488,325) Negative impact adjustment Wage Quality Impact-Weighted Increase in Income $6,377,358,856 Wage Quality Impact

60
7. Application and Scale Up
Employment impact-weighted accounting statements are a powerful tool for managers, investors, and
consumers. As with financial statements, the ability to compare outcomes between firms and across
industries is of utmost importance. In Table 19 we present findings for three additional US-headquartered
firms: Apple, Costco, and Merck. We choose these three firms because they represent a wide cross section
of sectors (technology, consumer staples, and healthcare) and because they also provide relatively good
disclosure on employment practices. The variation across firms begins to tell an interesting story. For
example, note the significant value lost through poor diversity and opportunity across companies. This
represents the reality that racial minorities and women are still underrepresented in the workforce and
especially among higher paying jobs. Merck emerges ahead of the other companies on those dimensions,
due primarily to more female representation in the workforce. However, low representation of racial and
ethnic minorities at the firm result in a diversity penalty of 15% of total salaries paid. Despite the company’s
leadership in public disclosure regarding diversity and inclusion, Intel has the highest diversity penalty as
a percentage of total salaries (32%), with Apple following at (25%) and Costco with the lowest penalty of
(8%). We see greater similarity regarding opportunity impact (the representation of minority groups at
different levels within the organization), with Intel at 5.7% of total salaries, Merck at 5.6%, Costco at 5.2%,
and Merck at 3.9%. Costco’s wage quality impact is reflective of its reputation as an employer with better
pay practices relative to the industry.
Other notable differences emerge from this cross-company analysis. At Merck, the total employee
focused impact of ($2.2 billion) results in a per-employee figure of $93,251 (see Table 20 on the following
pages). Excluding the value of wage quality impact results in a negative impact of ($7,990) per employee
(approximately 9% of total value created). At Apple, on the other hand, a per person employment impact
of $115,236 is reduced to ($3,275) in non-wage impact (only 3% of total impact) when only opportunity,
career advancement, and health and wellbeing are monetized. These figures provide insight regarding
opportunities for firms to improve job quality for employees and consequently create additional social
value.

61
Table 19: Employment Impact-Weighted Accounts: Intel, Merck, Apple, Costco 201850
INTEL MERCK APPLE COSTCO
Number of Employees 52,618 23,426 89,072 162,861
Revenue $ 14,303,000,000 $ 18,212,000,000 $ 98,061,000,000 $ 102,286,000,000
EBITDA $ 6,571,097,189 $ 5,885,506,597 $ 32,138,473,262 $ 3,865,000,000
Total Salaries Paid $ 7,313,439,500 $ 2,412,642,901 $ 10,659,008,099 $ 11,570,732,081
Employee Impact
Wage Quality (ex wage equity) $ 6,842,847,180 $ 2,371,674,146 $ 10,556,059,837 $ 11,139,537,386
Career Advancement $ (48,980,821) $ (27,045,746) $ 103,542,779 $ 11,261,483
Opportunity $ (415,218,670) $ (134,145,314) $ (416,006,634) $ (599,777,780)
Health +Wellbeing (partial FFW practices) $ (21,308,522) $ (25,992,473) $ 20,738,712 $ (57,653,431)
Subtotal $ 6,357,339,167 $ 2,184,490,613 $ 10,264,334,694 $ 10,493,367,658
Labor Community Impact
Diversity $ (2,319,192,138) $ (351,452,127) $ (2,709,616,423) $ (940,026,964)
Location $ 401,391,204 $ 105,763,520 $ 348,062,104 $ 390,159,336
Subtotal $ (1,917,800,935) $ (245,688,607) $ (2,361,554,319) $ (549,867,629)
Total Impact $ 4,439,538,232 $ 1,938,802,006 $ 7,902,780,375 $ 9,943,500,029
50 Notes:
1. Figures for Intel in Table 19 differ from those presented earlier in the paper, due to sub-dimensions that were omitted for the sake of comparability across companies (e.g. data on Wage Equity was unavailable for Apple, Costco, and Merck and therefore not included in the analysis above).
2. To calculate US EBITDA for Apple and Merck, we assume the same % of total EBITDA as US revenue/Total revenue. 3. Wage Quality does not include the Equity sub-dimension. 4. Apple and Costco disclosed limited data regarding turnover rates and new hires. Additional detail on methodology used for these calculations is
available upon request. 5. Health and Wellbeing includes one out of six sub-dimensions (Family Friendly Workplace practices), and does not include childcare or backup care. 6. Location analysis is based on data for 87% of Apple employees, 87% of Merck employees and 96% of Intel employees. Locations for Costco employees
are calculated based on company office and store data. 7. Due to poor data availability, location analyses for Apple and Costco were conducted at the State (rather than County) level. This may impact the values
for Location, Wage Quality (living wage), and Health and Wellbeing impact. 8. Salary data for Merck, Apple, and Costco is from publicly available crowdsourced data. The approximate percentage of employees represented in the
salary data is 34% for Merck, 70% for Apple, and 8.5% for Costco.

62
Table 20: Wage and Non-Wage Impacts of Employment: Intel, Merck, Apple, Costco
INTEL MERCK APPLE COSTCO Total Employees 52,618 23,426 89,072 162,861 Total Employee Impact $6,357,339,167 $2,184,490,613 $10,264,334,694 $10,493,367,658 Impact per Employee $120,821 $93,251 $115,236 $64,431 Wage Quality Impact $6,842,847,180 $2,371,674,146 $10,556,059,837 $11,139,537,386 Non-Wage Impact -$485,508,013 -$187,183,533 -$291,725,143 -$646,169,728 Non-Wage Impact per Employee -$9,227 -$7,990 -$3,275 -$3,968 Non-Wage as % of Employee Impact -7.6% -8.6% -2.8% -6.2%

63
8. Discussion
Like financial accounting, the impact-weighted accounting methodology provides a framework for
standardizing previously disparate measures of impact (Serafeim, Zochowski and Downing 2019). The
development and adoption of GAAP created a common language for financial analysis and disclosure, and
allowed managers, investors, regulators, and the public to make decisions based on consistent and
transparent information. Today, those same stakeholders need now make decisions based on a growing set
of material environmental, social, and governance (ESG) related information (Freiberg, Rogers, and
Serafeim 2019). There is clear appetite for data, but the information reaching concerned stakeholders often
adds complexity rather than clarity.
Impact-weighted accounts that capture employment impact are a critical tool to answer this call for
credible, standardized insight into firm practices and performance. Our methodology and analysis of Intel,
Apple, Costco, and Merck demonstrates the feasibility of measuring firm employment impact. Moreover,
our analysis was produced using publicly available data, allowing for comparability and scalability. As
such, we can produce employment impact-weighted accounts for a range of companies using this
methodology.
As the practice of impact-weighted accounting expands to other geographies, there will be
necessary adjustments both to the methodology, and to the interpretation of the impact statements. For
example, a company currently using IWA in Sweden is omitting the analysis of race-based opportunity and
diversity impact due to legislation prohibiting collection of this data. Geographies in which benefits, such
as health care, are typically provided by the government rather than private firms will see different results
in that impact dimension as well. We predict these geographical differences will provide valuable insights
to a range of audiences, including investors, managers, and policy-makers.
Although the current framework’s use of publicly available data provides some limitations in terms
of scope and specificity (e.g. the use of salary bands rather than individual employee salaries, and reliance
on voluntary disclosure), we expect increasing stakeholder pressure will result in improved disclosures of
company employment-related information and therefore a significant advantage from designing a
methodology based on the use of this data. Dimensions included in the case study that use imputed data,
such as the health and wellbeing sub-dimension measuring the impact of workplace culture, are important
to embed in the impact-weighted accounting methodology to drive investor and market-level demand for
increased transparency into organizational performance.
We furthermore predict companies will begin to develop impact-weighted accounting statements
using the methodology presented in this paper, as well as the IWAI environmental and product impact
methodologies (Freiberg, Park, Serafeim and Zochowski 2020; Serafeim and Trinh, 2020). Just like with
financial statements, we expect that companies will include their own commentary (or Notes) to present

64
additional detail regarding their measures. These Notes will provide valuable explanations to dimensions
that may differ between IWAI’s analysis and a company’s internal analysis. For example, Intel conducts an
analysis of their diversity and inclusion practices by measuring organizational demographics compared to
the national “skilled labor” population.51 Intel, therefore, reports full representation based on their use of a
significantly different denominator, and provides an example of a divergence from the IWAI diversity
impact methodology which measures organizational representation compared to local demographics. While
Intel’s analysis demonstrates progress towards diversity, the methodology inherently highlights existing
inequalities that exist in access to education and opportunity that are required to be included in the skilled
labor pool. We expect additional examples of divergence between the IWAI methodology and company-
specific reporting practices will be illuminated as we move towards the proliferation of impact-weighted
accounting. These Notes will provide valuable discussion to encourage greater standardization,
comparability, and rigor in measuring employee outcomes. It is also important to note that valuation is one
of many tools used to evaluate impact, and may be corroborated with other sources; this is similar to the
process of due diligence in financial markets in which an educated buyer will use multiple sources to
supplement a firm’s financial statements.
Future research will expand application of the impact-weighted accounting methodology across
additional sectors, as well as non-US geographies. In partnership with companies and investors, this
analysis will further prove feasibility, and allow for valuable comparisons between firms and industries. A
deeper dataset will allow us to explore potential relationships between the employment impact dimensions
presented in this paper. For example, we will examine relationships between dimensions such as family
friendly workplace benefits (health and wellbeing) and female representation (opportunity and diversity),
and preventative health and wellbeing (lifestyle and chronic disease management) programming and a
firm’s injury and illness rate (safety). We will also prioritize inclusion of part-time, contract, and outsourced
employees in future analyses, recognizing that workers without full time employment are at greater risk for
negative impacts. Finally, we will draw from publicly available data to produce insights on how firms are
creating value through employment, using the framework and methodology presented in this paper. Over
time, the use of impact-weighted accounting for environmental, product, and employment impact will
demonstrate the feasibility and necessity of standard Generally Accepted Impact Principles. Much like
Generally Accepted Accounting Principles (GAAP), they will evolve, while providing a stable foundation
for transparency and communication for a broad range of stakeholders.
51 Intel does not specify how the “skilled labor” population is defined. Intel’s Diversity Newsroom report: https://newsroom.intel.com/news/intel-achieves-goal-full-us-workforce-representation-notes-just-beginning/?wapkw=full%20representation#gs.8zr12z

65
Appendix 1: Subjective Wellbeing Impact This analysis is recommended as a parallel component of employment impact-weighted accounting. The
rationale and methodology is provided below, as well as an illustration using Intel’s crowdsourced
employee satisfaction data. Despite the importance of measuring employee wellbeing, it is presented as
supplemental due to the fundamentally interconnected nature of subjective well-being and the previously
described employment impact dimensions (e.g. employee fulfillment is very likely to be impacted by their
opportunities for career advancement, the quality of wages received, and other components of the
employment impact framework). In the absence of causal inference data to determine the relationship
between previously described employment impact dimensions and employee subjective wellbeing, the
valuation described below should be interpreted in parallel to the previous dimensions.
Contribution to Employment Impact
A long stream of research illuminates the relationship between happiness at work and subjective well-being
(SWB). SWB includes a wide range of terms and potential measures, including life satisfaction, purpose,
and happiness (Fujiwara, et al., 2015). Critically, SWB analysis is based on self-reported responses from
employees, giving workers a direct voice into job quality assessment.52
The foundational relationship between work and life is embodied in the “spillover hypothesis”,
which argues for a positive relationship between job satisfaction and life satisfaction with causality running
both ways (Tait, et al., 1989; Bowling, et al., 2010). Notably, competing hypotheses of the relationship
between job satisfaction and life satisfaction – namely segmentation, which argues that there is no
association between the two, and compensation, which argues that high satisfaction in either life or job can
“make up” for the other domain – have been largely disproven (Unanue, et al., 2017). The most common
hypotheses in employee wellbeing literature draw a “bottom up” causal inference from job satisfaction to
life satisfaction (rather than top-down from life satisfaction to job satisfaction, or bidirectional) (Unanue,
et al., 2017). There is ongoing research into each of these causal hypotheses, however there is significant
evidence to support the spillover effect and therefore establish a deep interdependence between life and job
satisfaction.
There have been significant efforts to study and address the specific factors of employment that
influence subjective wellbeing. The 2019 Great Jobs Study finds that 79% of workers who self-report they
are in good quality jobs report high life satisfaction, while only 32% of workers in bad jobs report high life
satisfaction (Rothwell and Crabtree, 2019). Further, a 2016 meta-analysis showed significant association
52 For more information regarding the importance of stakeholder voice, refer to resources from 60 Decibels and the Global Impact Investing Network: https://www.60decibels.com/work and https://iris.thegiin.org/document/iris-for-incorporating-stakeholder-voice/
66
between the satisfaction of psychological needs, job satisfaction, and higher subjective wellbeing (Van den
Broeck, et al., 2016). A 2017 study adds support to the influence of “needs satisfaction”, which measures
the extent to which individuals’ basic psychological needs such as autonomy, competence, and relatedness53
are met through their work (Unanue, et al., 2017). Many researchers strive to identify additional factors
influencing job satisfaction and subjective wellbeing. For example, one study that analyzed data from the
UK’s Annual Population Survey found that creative occupations are statistically associated with higher
levels of life satisfaction, worthwhileness, and happiness when compared to non-creative occupations
(Fujiwara, et al., 2015). Additional research shows a significant influence of “non-financial” job
characteristics on life satisfaction, including workplace trust and the quality of workplace social capital
(Helliwell and Huang, 2005).
The relationship between job satisfaction and life satisfaction of deep importance because of the
multifaceted implications of SWB. SWB has physiological effects, demonstrated by a depth of research
proving the connection between happiness and health outcomes (Adler, 2017). SWB positively predicts
health and longevity, including in longitudinal analysis, and when controlling for socioeconomic status,
baseline health factors, and multiple other variables (Diener and Chan, 2011). Similarly, workplace factors
associated with low job satisfaction, such as low levels of autonomy, have been associated with increased
health risk such as coronary heart disease (Kuper and Marmot, 2003). In addition to the physiological
importance of SWB, people place high importance on their happiness. A 2015 study of 13,000 individuals
in the United States and United Kingdom found that life scenarios that maximized levels of happiness were
rated above those with high rating levels for income, knowledge, career success, and family relationships
(Adler, et al., 2015).
There has been important progress to note regarding the measurement of SWB. The OECD
published Guidelines to Measuring Subjective Wellbeing (OECD, 2013) and also includes Life Satisfaction
in its widely used Wellbeing Index.54 The Impact Institute recommends including the Wellness Effects of
Employment in company’s Integrated Profit and Loss (IP&L) statements as a measure of human capital,
due to the potential positive impacts of work on self-esteem, autonomy, and social relations (Reinier de
Aldehart Toorop and Kuiper, J., 2019). Additional tools for analysis are emerging, such as The Workforce
Purpose Index, which is based on research connecting meaningful relationships, a feeling of having an
impact, and opportunities for growth to self-reported employee fulfillment (Imperative, 2019). Some
companies are leading the way, such as ABN AMRO, a Dutch bank that calculated and published an annual
53 The basic psychological needs for autonomy, competence, and relatedness are referred to as self-determination theory (SDT) and are the foundation of a large body of research. To explore the relationship between SDT and work, see Van de Broeck et al, 2016. 54 For more information on the OECD Wellbeing Index, see: http://www.oecdbetterlifeindex.org/topics/life-satisfaction/

67
wellbeing impact value of EUR 250 million in 2019 using the IP&L methodology (ABN AMRO, 2020).
These are important developments in signaling to employers and investors that worker wellbeing is deeply
valuable.
Despite advances in measurements practices, employment-related SWB remains poor. Only 33%
of workers surveyed in the Workforce Purpose Index reported they were fulfilled in 2015 (Imperative,
2019). Similar evidence from the 2019 Great Jobs Survey in the United States finds that only 40% of
workers are in good quality jobs (defined as having high satisfaction rates across the ten job characteristics
that workers rank as most important) (Rothwell and Crabtree, 2019). Further, the frequently-referenced
concept of employee engagement tends to focus heavily on benefits to organizations (such as increased
productivity or decreased turnover) rather than employee wellbeing (Robertson and Cooper, 2010).
However, there is extensive research linking wellbeing to business outcomes, which suggests a mutual
incentive between firms and employees in shifting focus to broader SWB measurement and management
(Robertson and Cooper, 2010).
Monetization Methodology
The relationship between job satisfaction and life satisfaction has a substantial evidence base, as discussed
above. Using this data, we employ the Life Satisfaction Approach (LSA) to valuation of non-market goods
to monetize employee subjective wellbeing (Fujiwara and Campbell, 2011). The LSA can also be described
as SWB valuation, which has been used to derive monetary values based on income equivalent figures for
a range of goods and is distinct from willingness to pay and willingness to accept methodologies (Dolan
and Fujiwara, 2016).
The basic steps to identify the Subjective Wellbeing Impact of employment are as follows:
G1) Identify the employee job satisfaction rate and normalize to a 0-10 scale. You can use data from an
employee fulfillment or engagement study as well.
G2) Calculate the surplus or gap in employee satisfaction at your company compared to the best-in-class
benchmark. For this analysis, we use 92% based on Glassdoor’s Best Places to Work data.55
Satisfaction rate performance = Company satisfaction rate – Benchmark Satisfaction Rate
G3) Determine the surplus/gap in life satisfaction due to job satisfaction. We use the factor of 0.66
(Bowling, et al., 2010).56
55 Glassdoor Best Places to Work data from 2020 reports a satisfaction rate of 4.6 out of 5 for the top employee-rated places to work. We convert 4.6/5 to a 0 – 10 scale to be comparable to other survey data. 56 See Bowling, et al., 2010 Table 4: Job satisfaction Time 2 regressed on SWB Time 1, scaled to 0 - 10 point scale.

68
Life satisfaction gap/surplus = Satisfaction rate performance (G2) * 0.6
G4) Calculate the value gained or lost from the life satisfaction surplus/gap to determine the subjective
wellbeing impact of employment at the firm. We use a monetization factor of $8,828 per one point
increase in life satisfaction (Huang et al, 2018).57 We assume even distribution across all employees.
Subjective wellbeing impact = Life satisfaction surplus/gap (G3) * Value of increased life
satisfaction per point ($8,828)* Total number of employees
Intel Case Study
Intel did not publish an employee satisfaction rate publicly, therefore our team uses data from Glassdoor
that was submitted by Intel’s employees. We note that this uses imputed data as the source for analysis.
While directly sourced data would be preferable, we find support in academic literature for the use of crowd-
sourced information such as Glassdoor (Landers, et al., 2019). We find a satisfaction rate of 4.3 out of 5 for
Intel employees, which we normalize to 7.9 on a 0-10 scale. Table 21 below presents the calculation for
subjective wellbeing impact, resulting in a negative value of ($169 million) for FY 2018. In Table 22, we
present subjective wellbeing impact for 25 additional companies using the same methodology.
Table 21: Intel Subjective Wellbeing Impact
Subjective Wellbeing 2018
A Number of employees 52,618 B Employee job satisfaction 7.88 C Best-in-class job satisfaction 8.43 D Satisfaction surplus/gap (0.55) E Impact of job satisfaction on life satisfaction 0.66 F Surplus/gap life satisfaction from job satisfaction -0.363 G Value of 1 point increase in life satisfaction $8,825 H Value gained/lost from surplus/gap in life satisfaction ($3,203) I Total Subjective Wellbeing impact $ (168,560,448)
57 A one-off income loss of $10,000 AUD lowers life satisfaction by 0.8 units (p. 134, see also Table 2). We assume even distribution to calculate a value of $12,500 AUD per 1 unit of life satisfaction, and convert to USD at 1 AUD to .706 USD per study year rates (2018).

69
Table 22: Subjective Wellbeing Impact 2018
Company Employees Employee Satisfaction
Surplus/Gap from Best-in-Class
Job impact on life Total Impact
Impact per Employee
Nvidia 6,033 8.6 0.18 0.12 $ 6,442,188 $ 1,068 Facebook 19,679 8.4 - 0.00 $ - $ - Salesforce 21,148 8.1 (0.37) -0.24 $ (45,164,726) $ (2,136) Boston Scientific 15,371 8.1 (0.37) -0.24 $ (32,827,076) $ (2,136) Intuit 5,911 7.9 (0.55) -0.36 $ (18,935,741) $ (3,203) Adobe 10,600 7.9 (0.55) -0.36 $ (33,956,835) $ (3,203) Intel 52,618 7.9 (0.55) -0.36 $ (168,560,448) $ (3,203) Cisco 37,209 7.7 (0.73) -0.48 $ (158,930,802) $ (4,271) Apple 89,072 7.7 (0.73) -0.48 $ (380,453,234) $ (4,271) Splunk 3,149 7.5 (0.92) -0.61 $ (16,812,905) $ (5,339) Costco 163,681 7.5 (0.92) -0.61 $ (873,913,319) $ (5,339) Merck 23,426 7.3 (1.10) -0.73 $ (150,089,211) $ (6,407) Costco 162,861 7.3 (1.10) -0.73 $ (1,043,442,284) $ (6,407) Citrix 4,008 7.2 (1.28) -0.85 $ (29,958,898) $ (7,475) Accenture 51,856 7.2 (1.28) -0.85 $ (387,611,932) $ (7,475) Juniper 4,192 7.2 (1.28) -0.85 $ (31,334,257) $ (7,475) Servicenow 21,148 7.2 (1.28) -0.85 $ (158,076,542) $ (7,475) Hewlett Packard Enterprise 16,354 7.0 (1.47) -0.97 $ (139,705,680) $ (8,543) Lyft 2,338 7.0 (1.47) -0.97 $ (19,972,599) $ (8,543) Bank of America 169,708 7.0 (1.47) -0.97 $ (1,449,747,561) $ (8,543) Ebay 7,055 6.8 (1.65) -1.09 $ (67,801,548) $ (9,610) PaloAlto 3,643 6.2 (2.20) -1.45 $ (46,681,038) $ (12,814) Chipotle 73,643 6.2 (2.20) -1.45 $ (943,654,038) $ (12,814) BNY Mellon 27,561 5.9 (2.57) -1.69 $ (412,024,548) $ (14,950) MDU 12,836 5.9 (2.57) -1.69 $ (191,892,424) $ (14,950) *2019 data Additional companies at best in class benchmark ($0 impact): HubSpot, Lululemon, Google, In-N-Out Burger, Boston Consulting Group, Bain & Company, Facebook

70
Appendix 2: Wage Quality
Marginal Impact of Income Function
Drawing on research that suggests the marginal utility of income decreases as income increases (Layard et al., 2008; Jebb et al., 2018; Diener et al., 1993) and previous efforts to create a marginal utility function for income (Vionnet and Haut, 2018), we design a function to convert raw salaries into impact values at a marginally decreasing rate. The function is underpinned by two key principles: first, the functional form of the marginal rate, which should show accelerating reduction of the marginal utility of an additional dollar of wages for higher level of wages and, second, identification of an inflection point at which a raw wage should begin to reflect decreasing marginal returns. While we strive to design a functional form and identify an inflection point based on a broadly applicable methodology that is aligned with research on the marginal utility of income, more research is needed to empirically test the nature of the income-impact relationship. Such research could guide applications of the measurement of wage quality.
Functional Form58
We design a function such that the marginal rate takes a negative exponential functional form. Therefore, the curve that describes the adjusted salaries is a natural logarithm. Exhibit A1 provides a visual representation of each function. The inclusion of the marginal impact of income function to our framework provides a method for distinguishing between a firm that pays 10 employees each $10,000,000 in salaries and a firm that pays 1,000 employees each $100,000 in salaries (both pay $100,000,000 in total salaries). The use of a negative exponential function to describe the marginal rate allows for a conservative approach to adjusting salaries above, but close to, the designated inflection point (discussed below). We use an elasticity measure of 1.26 to calculate the marginal utility of income, based on Layard et al’s analysis of six surveys across multiple geographies, in which no systematic differences were found based on sex, age, education, or marital status (Layard et al, 2008). Exhibit A1, Marginal Rate, begins at $120,000 and shows the marginal rate declines to .4 when the raw salary reaches $250,000. This translates into a salary of $250,000 being adjusted down by approximately $50,000, as shown in Table 23. Continuing the declining marginal utility function, a raw salary of $1,000,000 is reduced to a positive impact of $315,127 at a marginal rate of .07.
Inflection Point
Jebb et al. (2018) identify the income satiation level for life evaluation is $105,000 on average for North America. We use this value as the inflection point at which the marginal impact of incomes begins decreasing. However, just as the living wage varies across geographies, this average level of income satiation likely varies across geographies. According to the MIT living wage calculator, the average living wage in the US for a family of four (two children, two working adults) is $34,403. We calculate the average living wage for Intel employees to be $39,880, approximately 16% above the national average. To incorporate a contextual measure of location into the inflection point, we increase the average income satiation by 16%, moving from $105,000 to approximately $121,714. Based on the regional income satiation values in the Jebb et al analysis, as well as the availability of living wage estimates in other geographies, we can replicate this location-based adjustment in future analyses. Table 23 describes marginal rate and approximate adjusted salary for intervals of $10,000.
58 The authors recognize Ben Lawton, of KKS Advisors, for his significant contribution designing and testing the functional form of the marginal utility of income methodology.
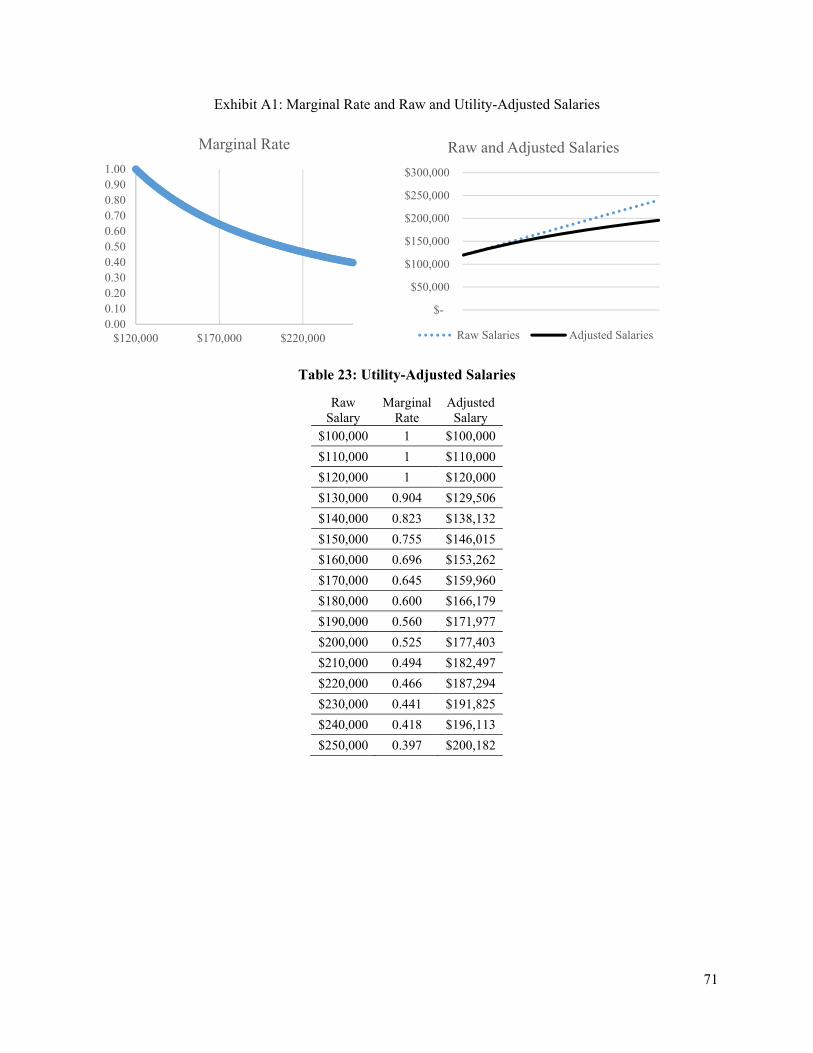
71
Exhibit A1: Marginal Rate and Raw and Utility-Adjusted Salaries
Table 23: Utility-Adjusted Salaries
Raw Salary
Marginal Rate
Adjusted Salary
$100,000 1 $100,000
$110,000 1 $110,000
$120,000 1 $120,000
$130,000 0.904 $129,506
$140,000 0.823 $138,132
$150,000 0.755 $146,015
$160,000 0.696 $153,262
$170,000 0.645 $159,960
$180,000 0.600 $166,179
$190,000 0.560 $171,977
$200,000 0.525 $177,403
$210,000 0.494 $182,497
$220,000 0.466 $187,294
$230,000 0.441 $191,825
$240,000 0.418 $196,113
$250,000 0.397 $200,182
0.000.100.200.300.400.500.600.700.800.901.00
$120,000 $170,000 $220,000
Marginal Rate
$-
$50,000
$100,000
$150,000
$200,000
$250,000
$300,000
Raw and Adjusted Salaries
Raw Salaries Adjusted Salaries

72
Table 24: Intel Living Wage and Marginal Impact of Income Impact
Minimum Salary
Maximum Salary
Employees Average Salary Total Salaries Living Wage?
Living Wage Adjusted Salaries
Minimum Wage?
MW Adjusted Total Salaries
Utility Adjusted Average Salary
Utility Adjusted Total Salaries
- $19,239 637 $19,239 $12,255,243 N $0 N $19,239 $12,255,243 $19,240 $24,439 237 $21,840 $5,175,962 N $0 N $21,840 $5,175,962 $24,440 $30,679 338 $27,560 $9,315,111 N $0 Y $1,876,407 $27,560 $9,315,111 $30,680 $38,999 472 $34,840 $16,444,244 N $0 Y $6,056,468 $34,840 $16,444,244 $39,000 $49,919 713 $44,460 $31,699,624 Y $31,699,624 Y $31,699,624 $44,460 $31,699,624 $49,920 $62,919 1587 $56,420 $89,537,747 Y $89,537,747 Y $89,537,747 $56,420 $89,537,747
$62,920 $80,079 3921 $71,500 $280,349,540 Y $280,349,540 Y $280,349,540 $71,500 $280,349,540 $80,080 $101,919 7441 $91,000 $677,127,280 Y $677,127,280 Y $677,127,280 $91,000 $677,127,280
$101,920 $128,959 8999 $115,440 $1,038,840,061 Y $1,038,840,061 Y $1,038,840,061 $115,440 $1,038,840,061 $128,960 $163,799 8973 $146,380 $1,313,463,254 Y $1,313,463,254 Y $1,313,463,254 $143,643 $1,288,912,429 $163,800 $207,999 7926 $185,900 $1,473,439,437 Y $1,473,439,437 Y $1,473,439,437 $170,527 $1,351,595,744 $208,000 - 11374 $208,000 $2,365,792,000 Y $2,365,792,000 Y $2,365,792,000 $182,596 $2,076,851,883
Total $7,313,439,500 $7,270,248,940 $7,278,181,815 $6,878,104,865
Adjustments: ($43,190,560) $7,932,875 (435,334,635)

73
Appendix 3: Wage Equity Example
Table 25: Intel Wage Equity Impact
White Black NHPI Asian
American Indian
Two+ Hispanic or Latino
Male
Executive/Senior Officials & Managers
$0 $0 $0 $0 $0 $0 $0
First/Mid Officials & Managers
$0 $1,874,742 $225,851 $0 $0 $647,789 $3,442,295
Professionals $0 $34,881,200 $1,162,250 $67,243,936 $1,966,915 $8,436,916 $38,169,650
Technicians $0 $3,151,998 $238,149 $2,512,800 $1,157,358 $1,509,898 $2,589,139
Sales Workers $0 $163,361 $0 $0 $0 $23,225 $0
Administrative Support $0 $73,798 $0 $0 $0 $8,312 $40,267
Craft Workers $0 $217,249 $66,761 $37,611 $4,710 $138,886 $0
Net Male Impact $0 $40,362,347 $1,693,010 $69,794,348 $3,128,983 $10,765,025 $44,241,350
Female
Executive/Senior Officials & Managers
$0 $0 $0 $0 $0 $0 $0
First/Mid Officials & Managers
$5,969,813 $1,017,174 $0 $3,027,323 $246,619 $659,508 $1,672,349
Professionals $60,581,959 $14,426,171 $390,212 $145,501,128 $1,634,883 $4,370,542 $38,169,650
Technicians $6,544,841 $1,749,296 $439,536 $2,528,137 $350,593 $1,415,130 $2,589,139
Sales Workers $492,408 $96,945 $0 $319,526 $0 $0 $0
Administrative Support $0 $441,090 $0 $0 $0 $248,427 $40,267
Craft Workers $433,333 $14,701 $0 $0 $58,641 $73,922 $0
Net Female Impact $74,022,353 $17,745,377 $829,748 $151,376,114 $2,290,735 $6,767,529 $42,471,405
Total Equity Impact $465,488,325

74
Appendix 4: Health and Wellbeing Dimension Calculations
Table 26: Intel Company Information Used in Health and Wellbeing Analysis
Company Information
Number of Employees (total)
52,618
# of Female Employees
14,162
# of Male Employees
38,456
Company Average Weekly Salary
$ 2,459
Company Average Hourly Salary
$ 61
Childcare
Weighted Average Local Cost of Childcare
$ 9,968
Weeks of Paid Family Leave for Men (Working Mother)
8
Weeks of Paid Family Leave for Women (Working Mother)
8
Healthcare
Consumer Satisfaction with Healthcare Plans 2.32 Sick Leave
Company Provided Paid Sick Leave Days
10
Table 27: Labor Force Participation Rates Calculations
Labor Force Participation Notes/Assumptions/Sources
Male Labor Force Participation Rate 69%
Statista
# of Men in US
151,800,000
Census
# of Men in Labor Force
104,893,800
# of Fathers w/ Kids Under 18 in US 26,600,000
Census
LFPR for Fathers w/ Kids Under 18 93.40%
Bureau of Labor Statistics
# of Fathers in Labor Force 24,844,400
% of MLF with Children Under 18 23.7%
Female Labor Force Participation Rate 57.30%
The Fed

75
# of Women in US
157,000,000
Census
# of Women in Labor Force 89,961,000
# of Mothers w/ Kids Under 18 in US 43,500,000
InfoPlease
LFPR for Mothers w/ Kids Under 18 74.60%
Department of Labor
# of Mothers in Labor Force 32,451,000
% of FLF with Children under 18 36.1%
Table 28. Intel Number of Employees w/ Children Under 6 Calculations
Number of Employees w/ Children Under 6
Total Kids Under Age of 18 (mil) 73.4 KidsCount
Total kids Under Age of 6 (mil) 23.8 ChildStats
% of Minors Under Age 6 32.43%
% of FLF with Children Under 18 36.1% Table 27
% of FLF with Children Under 6 (Implied) 11.7%
# of Female Intel Employees w/ Children Under 6 1,657
% of MLF with Children Under 18 23.7% Table 27
% of MLF with Children Under 6 (Implied) 7.7%
# of Male Intel Employees w/ Children Under 6 2,953
Table 29: Intel Average Amount of Childcare Support
Average Amount of Childcare Support*
Discount/Tuition Support Provided 15%
Local cost of childcare (see Table 30) $9,968
Average Amount of Childcare Support $1,495
*For employees with children under age 6

76
Table 30: Intel Weighted Average Cost of Childcare Calculation
Location (City) Location (State) Employees % Employees Cost of Childcare
Austin Texas 1,700 3.4% $ 7,062
Chandler Arizona 12,000 23.7% $ 8,547
Folsom California 6,000 11.8% $ 11,475
Fort Collins Colorado 600 1.2% $ 12,390
Hillsboro Oregon 21,000 41.4% $ 10,061
Rio Rancho New Mexico 1,200 2.4% $ 7,609
Santa Clara California 6,500 12.8% $ 11,475
San Jose California 1,700 3.4% $ 11,475
Total 50,700 100.0%
Weighted Average Cost of Childcare $ 9,968
Note: Total employees is 52,618, however location information was available at time of analysis for 50,700
Source: Economic Policy Institute, 2019. Childcare Costs in the United States. Cost data from 2017-2019.

77
References ABN AMRO Bank, 2020. ABN AMRO Bank 2019 Impact Report. ABN AMRO Bank.
Acosta, R.A. and Wiatrowski, W.J., 2018. National Compensation Survey: Employee Benefits in the United States, March 2018. Bureau of Labor Statistics, US Department of Labor, March.
Adler, A., 2017. Happiness: Transforming the Development Landscape, Chapter 6: A Scientific Review of the Remarkable Benefits of Happiness for Successful and Healthy Living. Psychological Wellbeing.
Adler, M. D., P. Dolan, and G. Kavetsos. 2015. Would You Choose to Be Happy? Tradeoffs between Happiness and the Other Dimensions of Life in a Large Population Survey. CEP Discussion Paper No. 1366.
Baert, S., 2018. Hiring discrimination: an overview of (almost) all correspondence experiments since 2005. In Audit studies: Behind the scenes with theory, method, and nuance (pp. 63-77). Springer, Cham.
Bakhshi, H., Downing, J., Osborne, M. and Schneider, P., 2017. The Future of Skills: Employment in 2030. London: Pearson and Nesta.
Bakotić, D., 2016. Relationship between job satisfaction and organisational performance. Economic research-Ekonomska istraživanja, 29(1), pp.118-130
Berdahl, J.L. and Moore, C., 2006. Workplace harassment: double jeopardy for minority women. Journal of applied psychology, 91(2), p.426.
Bidwell, M. and Keller, J.R., 2014. Within or without? How firms combine internal and external labor markets to fill jobs. Academy of Management Journal, 57(4), pp.1035-1055.
Billings, M.B., Klein, A. and Shi, C.Y., 2019. Investors’ Response to the# MeToo Movement: Does Corporate Culture Matter? Social Science Research Network 3466326.
Bivens, J. and Mishel, L., 2015. Understanding the historic divergence between productivity and a typical worker’s pay: Why it matters and why it’s real. Economic Policy Institute.
Blanchflower, D.G. and Oswald, A.J., 2004. Well-being over time in Britain and the USA. Journal of public economics, 88(7-8), pp.1359-1386.
Blau, F.D. and Kahn, L.M., 2017. The gender wage gap: Extent, trends, and explanations. Journal of Economic Literature, 55(3), pp.789-865.
Bowling, N., Eschleman, K., Wang, Q., 2010. A meta-analytic examination of the relationship between job satisfaction and subjective well-being. Journal of Occupational and Organizational Psychology.
Braveman, P. and Gottlieb, L., 2014. The social determinants of health: it's time to consider the causes of the causes. Public health reports, 129(1_suppl2), pp.19-31. Bureau of Labor Statistics (BLS), 2017. Who Chooses Part Time Work and Why. Bureau of Labor Statistics. Bureau of Labor Statistics (BLS), 2019. Characteristics of minimum wage workers, 2019. Bureau of Labor Statistics.

78
Bureau of Labor Statistics (BLS), 2019. Employed persons by detailed industry, sex, race, and Hispanic or Latino ethnicity. Bureau of Labor Statistics. Bureau of Labor Statistics (BLS), 2019. Quality of life benefits: Access, private industry workers, March 2019. Bureau of Labor Statistics. Bureau of Labor Statistics (BLS), 2020. Table A-2. Employment status of the civilian population by race, sex, and age. Bureau of Labor Statistics. Burns, C., Barton, K. and Kerby, S., 2012. The state of diversity in today’s workforce: As our nation becomes more diverse so too does our workforce. Center for American Progress. Business in the Community, 2018. Mental Health at Work Report 2018: Seizing the Momentum. The Prince’s Responsible Business Network. Cajner, T., Radler, T., Ratner, D. and Vidangos, I., 2017. Racial gaps in labor market outcomes in the last four decades and over the business cycle. Finance and Economics Discussion Series 2017-071. Washington: Board of Governors of the Federal Reserve System. Campos-Serna, J., Ronda-Pérez, E., Artazcoz, L., Moen, B.E. and Benavides, F.G., 2013. Gender inequalities in occupational health related to the unequal distribution of working and employment conditions: a systematic review. International journal for equity in health, 12(1), pp.1-18. Cazes, S., Hijzen, A. and Saint-Martin, A., 2015. Measuring and assessing job quality: the OECD Job Quality Framework. OECD Social, Employment and Migration Working Papers No. 174. Charles, K.K., Guryan, J. and Pan, J., 2018. The effects of sexism on American women: The role of norms vs. discrimination (No. w24904). National Bureau of Economic Research. Clark, A.E. and Oswald, A.J., 1994. Unhappiness and unemployment. The Economic Journal, 104(424), pp.648-659. Center for American Progress, 2018. Women Disproportionately Report Sexual Harassment in Male-Dominated Industries. Center for American Progress. Coalition for Inclusive Capitalism, 2019. Embankment Project for Inclusive Capitalism (EPIC). Coalition for Inclusive Capitalism. Cohen, P., Casselman, B., 2020. Minority Workers Who Lagged in a Boom Are Hit Hard in a Bust. New York Times. https://www.nytimes.com/2020/06/06/business/economy/jobs-report-minorities.html Correll, S.J., Benard, S. and Paik, I., 2007. Getting a job: Is there a motherhood penalty?. American journal of sociology, 112(5), pp.1297-1338. Cortes, P. and Pan, J., 2018. Occupation and gender. The Oxford handbook of women and the economy, pp.425-452.

79
Daly, M., Hobijn, B. and Pedtke, J.H., 2017. Disappointing facts about the black-white wage gap. FRBSF Economic Letter, 26, pp.1-5. Dearden, L., Reed, H., Van Reenen, J., 2016. The impact of training on productivity and wages: evidence from British panel data. Centre for Economic Performance, London School of Economics. Deloitte, 2018. Missing Pieces Report: The 2018 Board Diversity Census of Women and Minorities on Fortune 500 Boards. Deloitte. DeRigne, L., et al. 2018. How Many Paid Sick Days Are Enough? National Institutes of Health. Diener, E., Chan., M., 2011. Happy people live longer: subjective wellbeing contributes to health and longevity. Applied Psychology: Health and Well-being. doi:10.1111/j.1758-0854.2010.01045.x Diener, E., Sandvik, E., Seidlitz, L. and Diener, M., 1993. The relationship between income and subjective well-being: Relative or absolute? Social indicators research, 28(3), pp.195-223. Dolan, P., and Fujiwara, D., 2016. Happiness-based Policy Analysis. The Oxford Handbook of Well-being and Public Policy. Economic Policy Institute, 2018. Workers of color are far more likely to be paid poverty-level wages than white workers. Economic Policy Institute. Economic Policy Institute, 2019. Child Care Costs in the United States. Economic Policy Institute. Easterlin, R.A., 2005. Diminishing marginal utility of income? Caveat emptor. Social Indicators Research, 70(3), pp.243-255. Fernandez, R.M. and Weinberg, N., 1997. Sifting and sorting: Personal contacts and hiring in a retail bank. American Sociological Review, pp.883-902. Fischer, G., 2020. Monetizing Impact. Y Analytics. Freiberg, D., Park, DG., Serafeim, G., and Zochowski, T, 2019. Corporate Environmental Impact: Measurement, Data, and Information. Harvard Business School Working Paper 20-098. Freiberg, D., Rogers, J. and Serafeim, G., 2019. Pathways to materiality: How sustainability issues become financially material to corporations and their investors. Harvard Business School Accounting & Management Unit Working Paper, (20-056). Frey, B.S. and Stutzer, A., 2010. Happiness and economics: How the economy and institutions affect human well-being. Princeton University Press. Frey, W.H., 2018. Diversity explosion: How new racial demographics are remaking America. Brookings Institution Press.

80
Fryar, C.D., Ostchega, Y., Hales, C.M., Zhang, G. and Kruszon-Moran, D., 2017. Hypertension prevalence and control among adults: United States, 2015-2016 Fujiwara, D., Campbell, R., 2011. Valuation techniques for social cost-benefit analysis: stated preference, revealed preference, and subjective well-being approaches. The National Archives, London, UK. Fujiwara, D., Dolan, P. and Lawton, R., 2015. Creative occupations and subjective wellbeing. Nesta: London, UK. Fuller, S., 2008. Job mobility and wage trajectories for men and women in the United States. American Sociological Review, 73(1), pp.158-183. Gangl, M., 2006. Scar effects of unemployment: An assessment of institutional complementarities. American Sociological Review, 71(6), pp.986-1013. George, Y., 2019. The 14 Companies Taking the Lead on Parental Leave. JUST Capital. George, Y., 2020. Corporate America: Speaking up on systemic racism is only the first step. Now Let’s Act. Forbes. Gibb, K., Osland, L. and Pryce, G., 2014. Describing inequalities in access to employment and the associated geography of wellbeing. Urban Studies, 51(3), pp.596-613. Glasmeier, A. and Salant, P., 2006. Low-Skill Workers in Rural America Face Permanent Job Loss. The Carsey School of Public Policy at the Scholars' Repository. Glynn, S., 2018. An Unequal Division of Labor: How Equitable Workplace Policies Would benefit Working Mothers. Center for American Progress. Goetzel, R., et al., 2014. Do Workplace Health Promotion (Wellness) Programs Work? American College of Occupational and Environmental Medicine. Gomis, R., 2019. The global labour income share and distribution. ILO Department of Statistics, Methodological description. Geneva, ILO. Good Jobs Institute, 2020. Good Jobs Scorecard and Good Jobs Diagnostic. Good Jobs Institute. https://goodjobsinstitute.org/good-jobs-scorecard-2/ Grodsky, E. and Pager, D., 2001. The structure of disadvantage: Individual and occupational determinants of the black-white wage gap. American Sociological Review, pp.542-567. Gubler, T., Larkin, I. and Pierce, L., 2018. Doing well by making well: The impact of corporate wellness programs on employee productivity. Management Science, 64(11), pp.4967-4987.
Halkos, G. and Bousinakis, D., 2010. The effect of stress and satisfaction on productivity. International Journal of Productivity and Performance Management.

81
Helliwell, J., and Huang, H., 2005. How’s the Job? Well-Being and Social Capital in the Workplace. National Bureau of Economic Research Working Paper No. 11759. Henke, R., Head, M., Bent., K. Goetzel, R., Roemer., E, McCleary, K., 2019. Improvements in an organization’s culture of health reduces workers’ health risk profile and health care utilization. Journal of Occupational and Environmental Medicine. Heymann, J., et al. 2009. Contagion Nation: A Comparison of Paid Sick Day Policies in 22 Countries. Center for Economic and Policy Research. Holzer, H., 2015. Job market polarization and U.S. worker skills: A tale of two middles. Brookings Institution. Huang, L., Frijters, P., Dalziel, K. and Clarke, P., 2018. Life satisfaction, QALYs, and the monetary value of health. Social Science & Medicine, 211, pp.131-136. Ibarra, H., Carter, N.M. and Silva, C., 2010. Why men still get more promotions than women. Harvard Business Review, 88(9), pp.80-85. Ilies, R., Hauserman, N., Schwochau, S. and Stibal, J., 2003. Reported incidence rates of work‐related sexual harassment in the United States: Using meta‐analysis to explain reported rate disparities. Personnel Psychology, 56(3), pp.607-631. Imperative, 2019. 2019 Workforce Purpose Index: Pathways to Fulfillment at Work. Imperative. Intel, 2015. Child Care Benefits FAQs: Tuition Savings and Backup Care Programs. Intel Corporation and Knowledge Universe Education LLC. International Labor Organization (ILO), 2017. Decent Work and the 2030 Agenda for Sustainable Development. International Labor Organization. International Labor Organization (ILO), 2019. World Employment and Social Outlook: Trends 2019. International Labor Organization. International Labour Organization (ILO), 2020. World Statistics on Work-related Fatalities and Injuries. International Labour Organization. International Labour Organization (ILO), 2020. World Employment and Social Outlook: Trends 2020. International Labour Organization. International Labour Organization (ILO), 2020. The enormous burden of poor working conditions. International Labour Organization. JD Power, 2018. Health Plan Customer Satisfaction Stabilizes in Midst of Massive Industry Shifts. J.D. Power Finds.

82
Jebb, A.T., Tay, L., Diener, E. and Oishi, S., 2018. Happiness, income satiation and turning points around the world. Nature Human Behaviour, 2(1), pp.33-38. Keplinger, K., Johnson, S.K., Kirk, J.F. and Barnes, L.Y., 2019. Women at work: Changes in sexual harassment between September 2016 and September 2018. PloS one, 14(7), p.e0218313. Kochan, T., Finegold, D., Osterman, P., 2012. Who Can Fix the ‘Middle-Skills’ Gap. Harvard Business Review. Koçkaya, G. and Wertheimer, A., 2011. Can we reduce the cost of illness with more compliant patients? An estimation of the effect of 100% compliance with hypertension treatment. Journal of pharmacy practice, 24(3), pp.345-350. Konings, J. and Vanormelingen, S., 2015. The impact of training on productivity and wages: firm-level evidence. The Review of Economics and Statistics. Kotsantonis, S. and Serafeim, G., 2019. Four things no one will tell you about ESG data. Journal of Applied Corporate Finance, 31(2), pp.50-58. Kotsantonis, S., Serafeim, G., 2020. Human Capital and the Future of Work: implications for investors and ESG integration. Journal of Financial Transformation. Kuper, H. and Marmot, M., 2003. Study of coronary heart disease within the Whitehall II Job strain, job demands, decision latitude, and risk. Journal of Epidemiology and Community Health, Vol. 57, pp. 147-53. Landers, Richard N, Brusso, Robert C., and Auer, Elena M., 2019. Crowdsourcing Job Satisfaction Data: Examining the Construct Validity of Glassdoor.com Ratings. Personnel Assessment and Decisions: Vol. 5: Iss. 3, Article 6. Layard, R., Mayraz, G. and Nickell, S., 2008. The marginal utility of income. Journal of Public Economics, 92(8-9), pp.1846-1857. Leigh, J.P., 2011. Economic burden of occupational injury and illness in the United States. The Milbank Quarterly, 89(4), pp.728-772. Livingston, G. and Thomas, D., 2019. Among 41 countries, only U.S. lacks paid parental leave. Pew Research Center. Mahoney, C., Bixby, S., 2020. Chart of the week: Companies that embrace full disclosure on workforce diversity outperform their peers. JUST Capital. Manyika, J., Lund, S., Chui, M., Bughin, J., Woetzel, J., Batra, P., Ko, R. and Sanghvi, S., 2017. Jobs lost, jobs gained: What the future of work will mean for jobs, skills, and wages. McKinsey Global Institute, pp.1-160.

83
McGranahan, D.A., 1988. Rural workers at a disadvantage in job opportunities. Rural Development Perspectives, 4(3), pp.7-12. McKinsey&Company, 2017. Jobs lost, jobs gained: workforce transitions in a time of automation. McKinsey Global Institute. Miller, K., Williams, C., and Yi, Y., 2011. Paid Sick Days and Health: Cost Savings from Reduced Emergency Department Visits. Institute for Women’s Policy Research. Miller, W., Vigdor, E.R., and Manning, W.G., 2004. Covering the Uninsured: What Is It Worth? Health Affairs. Moss-Racusin, C.A., Dovidio, J.F., Brescoll, V.L., Graham, M.J. and Handelsman, J., 2012. Science faculty’s subtle gender biases favor male students. Proceedings of the national academy of sciences, 109(41), pp.16474-16479. Muro, Mark, Maxim, Robert, and Whiton, Jacob., 2019. Automation and Artificial Intelligence: How machines are affecting people and places. Brookings Institute. National Center for Education Statistics, 2019. Indicator 19: College Participation Rates. National Center for Education Statistics. National Partnership, 2020. Latest Resources: Paid Sick Days and Coronavirus. National Partnership. National Women’s Law Center (NWLC), 2019.The Schedules that Work Act: Giving Workers the Tools they Need to Succeed. National Women’s Law Center. Neilan, J., Reilly, P., Fitzpatrick, G., 2020. Time to Rethink the S in ESG. Harvard Law School Forum on Corporate Governance. OECD, 2019. Measuring and Assessing Job Quality: The OECD Job Quality Framework. OECD Publishing. OECD, 2020. OECD Employment Outlook 2019: The Future of Work. OECD Publishing. OECD, 2020. OECD Better Life Index. OECD Publishing. OECD, 2013. OECD guidelines on measuring subjective well-being. OECD Publishing. Opportunity@Work and Accenture, 2020. Reach for the STARs: The Potential of America’s Hidden Talent Pool. Opportunity@Work and Accenture. Pager, D., 2008. Marked: Race, crime, and finding work in an era of mass incarceration. University of Chicago Press. Penner, A.M., 2008. Race and gender differences in wages: The role of occupational sorting at the point of hire. The Sociological Quarterly, 49(3), pp.597-614.

84
Perea, J.F., 2011. The echoes of slavery: Recognizing the racist origins of the agricultural and domestic worker exclusion from the National Labor Relations Act. Ohio St. LJ, 72, p.95. Petersen, T. and Morgan, L.A., 1995. Separate and unequal: Occupation-establishment sex segregation and the gender wage gap. American Journal of Sociology, 101(2), pp.329-365. Pew Research Center, 2016. How Americans view their jobs. Pew Research Center. Powdthavee, N., 2008. Putting a price tag on friends, relatives, and neighbours: Using surveys of life satisfaction to value social relationships. The Journal of Socio-Economics, 37(4), pp.1459-1480. Quelch, J., A., and E., C. Boudreau, 2016. Building a Culture of Health: A New Imperative for Business. SpringerBriefs in Public Health, Springer. Reinier de Aldehart Toorop, Kuiper, J., 2019. Framework for Impact Statements. Impact Institute. Rich, Judith. 2014. What Do Field Experiments of Discrimination in Markets Tell Us? A Meta Analysis of Studies Conducted since 2000. Discussion Paper Series. Bonn: IZA. Robertson, I., Cooper, C., 2010. Full engagement: the integration of employee engagement and psychological well-being. Leadership & Organization Development Journal. Rosenbaum, E., Grossmeier, J., Imboden, M. and Noeldner, S., 2020. The HERO Health and Well-Being Best Practices Scorecard in Collaboration With Mercer (HERO Scorecard). Rothwell, J., Crabtree, S., 2019. Not Just a Job: New Evidence on the Quality of Work in the United States.” Lumina Foundation, Bill & Melinda Gates Foundation, Omidyar Network and Gallup. Rouen, E., 2019. The Problem with Accounting for Employees as Costs Instead of Assets. Harvard Business Review. Rouen, E., 2020. Rethinking Measurement of Pay Disparity and Its Relation to Firm Performance. Accounting Review 95, no. 1 (January 2020): 343–378. Ruhm, C.J., 2017. A national paid parental leave policy for the United States. Driving Growth through Women’s Economic Participation, 107. Brookings Institute. Sabbath, E. L., Williams, J., Boden, L. I., Tempesti, T., Wagner, G. R., Hopcia, K., Hashimoto, D., & Sorensen, G., 2018. Mental Health Expenditures: Association With Workplace Incivility and Bullying Among Hospital Patient Care Workers. Journal of occupational and environmental medicine, 60(8), 737–742. Saez, E., 2018. Striking it richer: The evolution of top incomes in the United States. In Inequality in the 21st Century (pp. 39-42). Routledge. Schochet, L., 2019. The Child Care Crisis Is Keeping Women Out of the Workforce. Center for American Progress.

85
Schulte, B., Durana, A., Stout, B. and Moyer, J., 2017. Paid Family Leave: How Much Time Is Enough. New America Foundation. Seabury, S. A., Terp, S., & Boden, L. I., 2017. Racial And Ethnic Differences In The Frequency Of Workplace Injuries And Prevalence Of Work-Related Disability. Health affairs (Project Hope), 36(2), 266–273. Serafeim, G., Zochowski, R., and Downing, J., 2019. Impact Weighted Financial Accounts: The Missing Piece for an Impact Economy. Harvard Business School. Serafeim, G., Rischbieth, A.M. and Koh, H.K., 2020. Sustainability, Business, and Health. JAMA. Serafeim, G., Trinh, K., 2019. A Framework for Product Impact-Weighted Accounts. Harvard Business School Working Paper 20-076. Shaw, E., Hegewisch, A. and Hess, C., 2018. Sexual harassment and assault at work: Understanding the costs. Institute for Women’s Policy Research Publication, IWPR B, 376. Silva, C., 2010. Pipeline’s Broken Promise. Catalyst. Singh, P. and Loncar, N., 2010. Pay satisfaction, job satisfaction and turnover intent. Relations industrielles/industrial relations, 65(3), pp.470-490.
Society for Human Resource Management (SHRM), 2016. Employee Job Satisfaction and Engagement Report: revitalizing a changing workforce. Society for Human Resource Management. Society for Human Resource Management (SHRM), 2019. How much paid family leave is too much? Society for Human Resource Management. Tait, M., Padgett, M. Y., & Baldwin, T. T, 1989. Job and life satisfaction: A reevaluation of the strength of the relationship and gender effects as a function of the date of the study. Journal of Applied Psychology, 74(3), 502–507. Thomas, A., et al. 2019. Foregone and Delayed Medical Care is Associated with Increased Health Care Costs and Utilization Among Heart Failure Patients in the United States. American Heart Association Journals. Thorlakson, T., de Zegher, J.F. and Lambin, E.F., 2018. Companies’ contribution to sustainability through global supply chains. Proceedings of the National Academy of Sciences, 115(9), pp.2072-2077. Tomaskovic-Devery, D., and Hoyt, E., 2019. Race, states, and the mixed fate of white men. University of Massachusetts Amherst Center for Employment Equity. Toossi, M., 2002. A century of change: The US labor force, 1950-2050. Monthly Lab. Rev., 125, p.15. True Price Foundation, 2020. Monetization Factors for True Pricing. True Price Foundation.

86
Tsurumi, T., Managi, S., 2017. Monetary valuations of life conditions in a consistent framework: the Life Satisfaction Approach. Journal of Happiness Studies. Unanue W, Gómez ME, Cortez D, Oyanedel JC and Mendiburo-Seguel A (2017) Revisiting the Link between Job Satisfaction and Life Satisfaction: The Role of Basic Psychological Needs. Frontiers in Psychology. U.S. Bureau of Labor Statistics, 2019. Labor Force Statistics from the Current Population Survey. U.S. Bureau of Labor Statistics. Van de Broeck, A., Ferris, D. L., Chang, C., 2016. A review of self-determination theory’s basic psychological needs at work. Journal of Management. Vionnet, S., Haut, S., 2018. Measuring and Valuing the Social Impact of Wages – the living wages global dataset and the health utility of income. Valuing Nature and Novartis, Working Paper. Weichselbaumer, D. and Winter‐Ebmer, R., 2005. A meta‐analysis of the international gender wage gap. Journal of Economic Surveys, 19(3), pp.479-511. Willis Towers Watson, 2017. Employee benefits around the world: common themes, new opportunities and challenges. Willis Towers Watson. Willis Towers Watson, 2019. 2018 General Industry Salary Budget Survey – U.S. Willis Towers Watson. Wisman, J.D., 2013. Wage stagnation, rising inequality and the financial crisis of 2008. Cambridge Journal of Economics, 37(4), pp.921-945. World Bank, 2018. Piecing Together the Poverty Puzzle. World Bank Group. World Economic Forum, 2017. Accelerating workforce reskilling for the fourth industrial revolution: An agenda for leaders to shape the future of education, gender and work. World Economic Forum. Working Mothers, 2019. By the numbers: 100 Best Companies 2019. Workingmother.com. Yemane, R. and Fernández-Reino, M., 2019. Latinos in the United States and in Spain: the impact of ethnic group stereotypes on labour market outcomes. Journal of Ethnic and Migration Studies, pp.1-21. Yildirmaz, A., Ryan, C. and Nezaj, J., 2019. State of the workforce report: Pay, promotions and retention. The ADP Research Institute. Young, C., 2012. Losing a job: The nonpecuniary cost of unemployment in the United States. Social Forces, 91(2), pp.609-634. Zschirnt, E. and Ruedin, D., 2016. Ethnic discrimination in hiring decisions: a meta-analysis of correspondence tests 1990–2015. Journal of Ethnic and Migration Studies, 42(7), pp.1115-1134.