
Accounting for Ethnicity in Recreation Demand: A … · Accounting for Ethnicity in Recreation...
15
Journal of Leisure Research Copyright 1998 1998, Vol. 30, No. 1, pp. 64-78 National Recreation and Park Association Accounting for Ethnicity in Recreation Demand: A Flexible Count Data Approach J. M. Bowker and V. R. Leeworthy We examine ethnicity and individual trip taking behavior associated with nat- ural resource based recreation in the Florida Keys. We estimate trip demand using the travel cost method. We then extend this model with a varying param- eter adaptation to test the congruency of demand and economic value across white and Hispanic user subgroups. Our findings indicate significant differ- ences in price response leading to divergent per-trip consumer surplus and price elasticity between these two groups. These differences raise important distribution and equity concerns with respect to the possible future use of pric- ing policies like user fees. KEYWORDS: Ethnicity, travel cost, price response, consumer surplus, count-data, eq- uity, user fees Introduction Studies focusing on minority preferences and behavior have been an important component of recreation research since the 1960's. Social scien- tists have examined and developed a number of theories attempting to ex- plain observed differences in recreation behavior, especially for outdoor ac- tivities, among various ethnic or racial subgroups in the US population. Ethnicity and marginality have emerged as the two major competing theories (Washburne, 1978). Ethnicity theory maintains that lower levels of participation in outdoor recreation by minorities are primarily explained by distinct subcultural values about leisure. The marginality perspective attri- butes minority differences in recreation behavior to social structural barriers such as lack of discretionary funds, lack of transportation, and inadequate information about facilities. These two predominant theories have given rise to a number of offshoots such as opportunity theory, compensation theory, and class polarization (Floyd, Shinew, McGuire, & Noe, 1995). The prepon- derance of work has focused on identifying and testing for differences in black and white recreation preferences and participation although some studies have included or focused on Hispanics (Carr & Williams, 1993; Floyd and Gramann, 1993). A current review of the theoretical and empirical ad- J. M. Bowker is a Research Social Scientist with the USDA Forest Service, Southern Research Station, Outdoor Recreation and Wilderness Research Unit, Athens, GA 30602-2044. V. R. Lee- worthy is an Economist with the National Oceanic and Atmospheric Administration, Strategic Environmental Assessments Division, Silver Spring, Maryland. The views expressed by the au- thors are not intended to represent the views of their respective agencies. Contact Author: J. M. Bowker, USDA Forest Service, Southern Research Station, Outdoor Rec- reation and Wilderness Research, 320 Green Street, Athens, GA 30602-2044. PH: 706-546-2451 EM: [email protected] 64
Transcript of Accounting for Ethnicity in Recreation Demand: A … · Accounting for Ethnicity in Recreation...
Journal of Leisure Research Copyright 19981998, Vol. 30, No. 1, pp. 64-78 National Recreation and Park Association
Accounting for Ethnicity in Recreation Demand:A Flexible Count Data Approach
J. M. Bowker and V. R. Leeworthy
We examine ethnicity and individual trip taking behavior associated with nat-ural resource based recreation in the Florida Keys. We estimate trip demandusing the travel cost method. We then extend this model with a varying param-eter adaptation to test the congruency of demand and economic value acrosswhite and Hispanic user subgroups. Our findings indicate significant differ-ences in price response leading to divergent per-trip consumer surplus andprice elasticity between these two groups. These differences raise importantdistribution and equity concerns with respect to the possible future use of pric-ing policies like user fees.
KEYWORDS: Ethnicity, travel cost, price response, consumer surplus, count-data, eq-uity, user fees
Introduction
Studies focusing on minority preferences and behavior have been animportant component of recreation research since the 1960's. Social scien-tists have examined and developed a number of theories attempting to ex-plain observed differences in recreation behavior, especially for outdoor ac-tivities, among various ethnic or racial subgroups in the US population.
Ethnicity and marginality have emerged as the two major competingtheories (Washburne, 1978). Ethnicity theory maintains that lower levels ofparticipation in outdoor recreation by minorities are primarily explained bydistinct subcultural values about leisure. The marginality perspective attri-butes minority differences in recreation behavior to social structural barrierssuch as lack of discretionary funds, lack of transportation, and inadequateinformation about facilities. These two predominant theories have given riseto a number of offshoots such as opportunity theory, compensation theory,and class polarization (Floyd, Shinew, McGuire, & Noe, 1995). The prepon-derance of work has focused on identifying and testing for differences inblack and white recreation preferences and participation although somestudies have included or focused on Hispanics (Carr & Williams, 1993; Floydand Gramann, 1993). A current review of the theoretical and empirical ad-
J. M. Bowker is a Research Social Scientist with the USDA Forest Service, Southern ResearchStation, Outdoor Recreation and Wilderness Research Unit, Athens, GA 30602-2044. V. R. Lee-worthy is an Economist with the National Oceanic and Atmospheric Administration, StrategicEnvironmental Assessments Division, Silver Spring, Maryland. The views expressed by the au-thors are not intended to represent the views of their respective agencies.Contact Author: J. M. Bowker, USDA Forest Service, Southern Research Station, Outdoor Rec-reation and Wilderness Research, 320 Green Street, Athens, GA 30602-2044. PH: 706-546-2451EM: [email protected]
64

BOWKER AND LEEWORTHY 65
vances in this body of literature can be found in Johnson, Bowker, English,and Worthen (1997).
To date, recreation and natural resource economists have done relativelylittle to explore and assimilate proven class and cultural differences intodemand models explaining trip-taking behavior. This would appear to be apotentially important omission when one considers that these demand mod-els are generally accepted for estimating nonmarket use value and price re-sponse in water resources and forest recreation related studies (US WaterResources Council, 1983; Bergstrom & Cordell, 1991). Moreover, importanteconomic policy measures such as consumer's surplus (used in benefit-costand damage assessment) and price elasticity (used to examine user fees),derived from these demand models, are fundamental inputs for both publicand private land management planning decisions.
Hof and Kaiser (1983) allowed for race in their study of long-term na-tional outdoor recreation participation in thirteen popular activities. Racewas found to be a significant factor in ten of the activities. In these activitieswhites were found more likely to participate than nonwhites. Bowker, Eng-lish, and Cordell (1997) obtained similar results for both participation andconsumption (primary purpose trips and activity days) across twenty-two ac-tivities modeled in each of four major regions of the continental U.S. How-ever, neither of these studies included price in their empirical specifications.Therefore, information about economic value and price responsivenessbased on race or ethnicity cannot be recovered.
Peterson and Arnold (1987) assessed the economic benefits of mountainrunning at Pike's Peak using a travel cost demand model. In their aggregatemodel, based on demographics for participants' counties of origin, theyfound that percent Hispanic had a negative and statistically significant effecton travel demand. However, their model included the percent Hispanic vari-able as a demand shifter and thus price response differences between whitesand Hispanics were not assessed.
In a study examining the net economic value of twelve types of outdoorrecreation activities across nine Forest Service regions, McCollum, Peterson,Arnold, Markstrom, and Hellerstein (1990) found that race was a significantexplanatory factor in over one-third of their regional aggregate travel costmodels. Using counties as the unit of observation, they found that wherestatistically significant, the percentage of whites in the county usually led toincreased demand for the recreation activity. However, they did find that thepercentage of whites had a negative effect on demand for big game huntingin the Northwest and for general recreation in the Northeast.
Bayless, Bergstrom, Messonier, and Cordell (1994) included race in theirdemand analysis of designated wildlife viewing sites. However, the race vari-able in their model was insignificant. Unlike the studies by McCollum et al.(1990) and Peterson and Arnold (1987), the model was based on individualobservations rather than county aggregates. However, like McCollum et al.(1990) and Peterson and Arnold (1987), the variable accounting for racewas included as a demand shifter so that potential differences in price re-

66 ETHNICITY IN RECREATION DEMAND
sponse (demand curve slope) between whites and nonwhites were not ex-amined.
Assuming demand differences based on race potentially exist based onthe findings of the sociological and economics studies above, identifyingthese differences in recreation demand models could provide useful eco-nomic information for public policy in at least two ways. First, by accountingfor omitted ethnicity variables, specification bias in empirical models couldbe avoided and the quality of estimated demand parameters and derivationsthereof such as elasticities and surpluses would be improved. Second, andperhaps more importantly, a quantitative account of differences in demand,based on ethnicity, allows for a richer distributional assessment of resourceand recreation policies. For example, implementation of user fees at a sitecould result in a disproportionate decrease in participation for one ethnicgroup over another if the groups respond differently to price. The issues ofequity and distribution of benefits associated with pricing policy have pre-viously been raised regarding local and nonlocal use of recreation sites(Walsh, Peterson, & McKean, 1990). However, no studies of which we areaware, have focused explicitly on ethnicity-based differences in recreationdemand and the potential consequences.
In this paper, we use data from a recent survey of recreation visitors tothe Florida Keys to explore some of the above issues. First, we use a currentlypopular regression model based on discrete counts of trips to estimate atravel cost demand model for visitors partaking in natural resource basedrecreation. We employ a variation of this model that allows us to statisticallytest whether reported ethnicity affects price response and valuation for His-panic and white ethnic subgroups.1 Given that our findings reject the hy-pothesis of homogeneous demand across these two groups, we explore themagnitude of the differences in consumer's surplus and price elasticity anddiscuss some of the implications of this disparity for public policy decisions.
Methods
The travel cost method (TCM) is one of the most popular means ofnonmarket valuation used over the past 30 years. The theoretical basis forTCM derives from the basic economic notion of utility maximization subjectto budget and time constraints. The method is predicated on a number ofassumptions, foremost of which is that individuals perceive and respond tochanges in the travel-related component of the cost of a visit to a recreationsite in the same way as they would respond to a change in admission price(Freeman, 1993). In its various forms (see Fletcher, Adamowicz, & Graham-Tomasi, 1990; Smith, 1989; or Ward & Loomis, 1986) TCM has generallybeen preferred to estimate economic values derived from site use over othernonmarket methods because of its behavioral base.
'Blacks were insufficiently represented in the sample (<2%) to test for differences from His-panics and whites.

BOWKER AND LEEWORTHY 67
However, TCM is not without limitations. The most obvious of which isits limitation to use value. Moreover, as Randall (1994) points out, it is stillan indirect or inferential means for quantifying values. As such, in spite ofits direct link to actual behavior, some "art" as well as a number of assump-tions and researcher judgements are required to get from reported trips torelevant policy measures like price elasticity of demand and consumer sur-plus. Also, from an ex ante policy analysis perspective, TCM is somewhat lim-ited in its capacity to provide information on multiple management alter-natives, particularly for proposed changes. This limitation arises becausesampling is generally necessary under each alternative. To mitigate this lim-itation, the hedonic travel cost method was developed (Brown & Mendel-sohn, 1984). More recently, hybrid forms of TCM based on travel costs andintended behavior or attitudinal response to changes in costs or site char-acteristics, have been employed (see Ribaudo & Epp, 1984; Teasley, Bergs-trom, & Cordell, 1994; Layman, Boyce, & Criddle, 1996). Due to their hy-pothetical nature however, these hybrids suffer from many of the samecriticisms as contingent valuation.
The most frequently used TCM empirical approaches are the zonal ap-proach and the individual approach. The zonal model (ZTCM) was the firstto be developed and is still widely used (English & Bowker, 1996; Hellerstein,1991; Richards, King, & Brown, 1990; Walsh et al. 1990; Peterson & Arnold,1987). It is based on establishing a relationship between per capita partici-pation rates at a site from various geographic origin zones and the costsincurred in travel from the origin zone to the given site. The individual travelcost model (ITCM) is conceptually similar to the zonal model, however, thetravel cost/trip relationship is based solely on individual observations. Ex-amples of ITCM applications in recreation include Adamowicz, Fletcher, andGraham-Tomasi (1989); Creel and Loomis, (1990); Englin and Shonkwiler(1995); and Bowker, English, and Donovan (1996).
Currently, ITCM seems preferred over ZTCM for reasons such as: (a)statistical efficiency, (b) theoretical consistency in modeling individual be-havior, (c) avoiding arbitrary zone definitions, and (d) increasing heteroge-neity among populations within zones. In addition, statistical methods arenow available for better dealing with the integer nature of individual tripdemand and and the lack of observations reporting zero trips which is anartifact of on-site sampling (Creel 8c Loomis, 1990; Yen & Adamowicz, 1993).
Data and Empirical Methods
Data for this study were obtained as part of a larger project designed todetermine the economic impacts and values of natural resource based tour-ism in the Florida Keys. Two separate sample designs were used. One was astratified random sample based on mode of access (auto, air, cruise ship)through the use of exit interviews. This sample was also stratified, withinmode of access, across different days of the week and times of the day forthe auto and air modes. Cruise ships were on fixed schedules and an attempt

68 ETHNICITY IN RECREATION DEMAND
was made to obtain a representative sample of the three size classes of shipsvisiting Key West. This on-site sample, with a response rate of 85 percent,was used for estimating the number of person-trips and person-days for theentire visitor population by region and season (June-November 1995 andDecember-May 1996). Activity participation was estimated for 68 activities.Mail-back follow-ups obtained information on trip spending and importancesatisfaction ratings for 25 natural resource attributes, facilities, and services.Response rate for the mailback was 38 percent. This sample also providedinformation to derive estimated per mile travel expenses.
The second sample design called "CUSTOMER," was implemented on-site using face-to-face survey procedures at over 200 sites throughout theKeys. Sites included hotels, campgrounds, marinas, boat ramps, beaches,parks, museums, historic sites, boat rental operations, concessions, and diveshops. A delphi approach using local community experts was used in choos-ing sites across the four regions of the Keys which would yield a represen-tative sample. Individuals 16 and older were randomly selected for exit in-terviews. For recreation groups, only one person was selected based on the"birthday rule" by which the person in the group having the most recentbirthday was interviewed. Response rate for this on-site sample was 98 per-cent.
Information gathered from CUSTOMER included information on par-ticipation in 68 activities as well as intensity of use (days and hours) over 39of these activities. Additionally, demographic information was obtained forup to eight members in each group along with detailed information on tripitinerary, multiple travel modes, days spent at alternate sites, lost income,trip motivation, annual time in the Keys, previous visit experience, currenttrip length, and whether the Keys was the primary destination of the currenttrip. For a more detailed description of sample methods see Leeworthy(1996).
For purposes of this analysis we use the summer season subsample of1,781 observations obtained in July and August of 1995. This subsample con-sisted of those that participated in natural resource-based activities includingwildlife and nature study on land and various water activities in natural set-tings. During the summer season, natural resource-based visitation ac-counted for 80 percent of the total person-trips to the Keys.2
Our on-site sampling format leaves the researcher with a sample that iszero-truncated because only participants are sampled and endogenouslystratified because the probability of being chosen in an on-site sample is notindependent of the frequency of usage (Shaw, 1988). Peterson, Dwyer, andDarragh (1983) recognized such problems when they developed an urban
2Our intent here is to focus on demand for the setting as opposed to the demand for any givenactivity as nearly all participants were involved in multiple activity trips. Hence, the results cannotbe directly applied to answering on-site management questions dealing with competing or con-flicting use by different activities. A good extension of the concept of this paper would be toexamine for ethnicity differences among specific recreation activities.
BOWKER AND LEEWORTHY 69
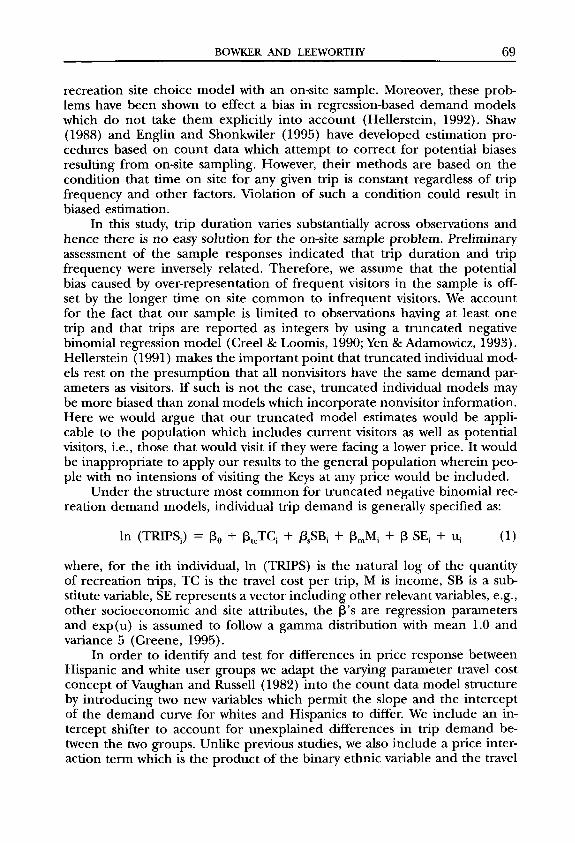
recreation site choice model with an on-site sample. Moreover, these prob-lems have been shown to effect a bias in regression-based demand modelswhich do not take them explicitly into account (Hellerstein, 1992). Shaw(1988) and Englin and Shonkwiler (1995) have developed estimation pro-cedures based on count data which attempt to correct for potential biasesresulting from on-site sampling. However, their methods are based on thecondition that time on site for any given trip is constant regardless of tripfrequency and other factors. Violation of such a condition could result inbiased estimation.
In this study, trip duration varies substantially across observations andhence there is no easy solution for the on-site sample problem. Preliminaryassessment of the sample responses indicated that trip duration and tripfrequency were inversely related. Therefore, we assume that the potentialbias caused by over-representation of frequent visitors in the sample is off-set by the longer time on site common to infrequent visitors. We accountfor the fact that our sample is limited to observations having at least onetrip and that trips are reported as integers by using a truncated negativebinomial regression model (Creel & Loomis, 1990; Yen & Adamowicz, 1993).Hellerstein (1991) makes the important point that truncated individual mod-els rest on the presumption that all nonvisitors have the same demand par-ameters as visitors. If such is not the case, truncated individual models maybe more biased than zonal models which incorporate nonvisitor information.Here we would argue that our truncated model estimates would be appli-cable to the population which includes current visitors as well as potentialvisitors, i.e., those that would visit if they were facing a lower price. It wouldbe inappropriate to apply our results to the general population wherein peo-ple with no intensions of visiting the Keys at any price would be included.
Under the structure most common for truncated negative binomial rec-reation demand models, individual trip demand is generally specified as:
In (TRIPS.,) = p0 + PtcTQ + ftSB-, + PmMi + p SE; + u; (1)
where, for the ith individual, In (TRIPS) is the natural log of the quantityof recreation trips, TC is the travel cost per trip, M is income, SB is a sub-stitute variable, SE represents a vector including other relevant variables, e.g.,other socioeconomic and site attributes, the |3's are regression parametersand exp(u) is assumed to follow a gamma distribution with mean 1.0 andvariance 5 (Greene, 1995).
In order to identify and test for differences in price response betweenHispanic and white user groups we adapt the varying parameter travel costconcept of Vaughan and Russell (1982) into the count data model structureby introducing two new variables which permit the slope and the interceptof the demand curve for whites and Hispanics to differ. We include an in-tercept shifter to account for unexplained differences in trip demand be-tween the two groups. Unlike previous studies, we also include a price inter-action term which is the product of the binary ethnic variable and the travel
70 ETHNICITY IN RECREATION DEMAND
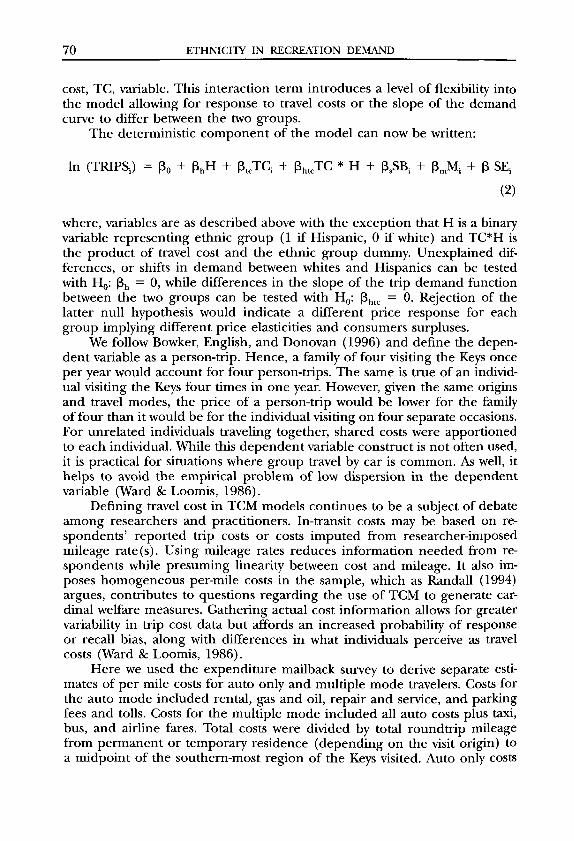
cost, TC, variable. This interaction term introduces a level of flexibility intothe model allowing for response to travel costs or the slope of the demandcurve to differ between the two groups.
The deterministic component of the model can now be written:
In (TRIPS-,) = p0 + PhH + PKTQ + phtcTC * H + (3SSB; + PmMi + 0 S^
(2)
where, variables are as described above with the exception that H is a binaryvariable representing ethnic group (1 if Hispanic, 0 if white) and TC*H isthe product of travel cost and the ethnic group dummy. Unexplained dif-ferences, or shifts in demand between whites and Hispanics can be testedwith Ho: 3h = 0, while differences in the slope of the trip demand functionbetween the two groups can be tested with Ho: phtc = 0. Rejection of thelatter null hypothesis would indicate a different price response for eachgroup implying different price elasticities and consumers surpluses.
We follow Bowker, English, and Donovan (1996) and define the depen-dent variable as a person-trip. Hence, a family of four visiting the Keys onceper year would account for four person-trips. The same is true of an individ-ual visiting the Keys four times in one year. However, given the same originsand travel modes, the price of a person-trip would be lower for the familyof four than it would be for the individual visiting on four separate occasions.For unrelated individuals traveling together, shared costs were apportionedto each individual. While this dependent variable construct is not often used,it is practical for situations where group travel by car is common. As well, ithelps to avoid the empirical problem of low dispersion in the dependentvariable (Ward & Loomis, 1986).
Defining travel cost in TCM models continues to be a subject of debateamong researchers and practitioners. In-transit costs may be based on re-spondents' reported trip costs or costs imputed from researcher-imposedmileage rate(s). Using mileage rates reduces information needed from re-spondents while presuming linearity between cost and mileage. It also im-poses homogeneous per-mile costs in the sample, which as Randall (1994)argues, contributes to questions regarding the use of TCM to generate car-dinal welfare measures. Gathering actual cost information allows for greatervariability in trip cost data but affords an increased probability of responseor recall bias, along with differences in what individuals perceive as travelcosts (Ward & Loomis, 1986).
Here we used the expenditure mailback survey to derive separate esti-mates of per mile costs for auto only and multiple mode travelers. Costs forthe auto mode included rental, gas and oil, repair and service, and parkingfees and tolls. Costs for the multiple mode included all auto costs plus taxi,bus, and airline fares. Total costs were divided by total roundtrip mileagefrom permanent or temporary residence (depending on the visit origin) toa midpoint of the southern-most region of the Keys visited. Auto only costs

BOWKER AND LEEWORTHY 7 1
were estimated to be $0.14 per mile while multiple mode costs were $0.30per mile. Person-trip costs then become mode costs for a given visit adjustedfor the number in the group sharing expenses. In the case of a multipledestination trip where the Keys was not the primary purpose, only the round-trip mileage from the temporary residence to the Keys was included in thetravel costs. For example, someone traveling to Disneyworld from Boston andthen taking a side excursion to the Keys would only have the mileage costsfrom Orlando to the Keys included. While we feel this approach is appro-priate, our interpretation of the literature is that this remains a debatableresearcher judgement. Less than 10 percent of the sample fell into this cat-egory, hence while our approach is ad hoc, it is unlikely that the results areseriously affected.
The inclusion of time costs, both in-transit and on-site is also subject toconsiderable debate. Theoretically, Freeman (1993) demonstrates that bothkinds of time costs should be included. However, he points out a number ofproblems which continue to plague applied researchers. One is the inabilityof a large portion of the sample to easily substitute between working in-creased hours at their normal (or overtime) wage rate and leisure time.Another is the possibility of utility or disutility resulting from work, travel,or on-site time, hence rendering the full wage rate a potentially poor mea-sure of the shadow cost of time. He also points out that while most surveyselicit a pretax income measure, a more realistic wage rate would be derivedfrom after tax income. McConnell (1992) states that judgements about timeand the cost of time have been dominated by theoretical considerationsrather than empirical results. Interestingly, 85 percent of those surveyed re-ported that they lost no opportunity to earn income during their visit(s) tothe Keys. Hence, we chose to avoid the common but arbitrary practice offactoring a percentage of the household wage rate into mileage costs optinginstead for a binary variable to indicate the group indicating that they gaveup the chance to earn income by making the trip(s).
Other variables in the model which are based on typical recreation de-mand studies include, age and age squared, years of experience visiting theKeys, substitute availability, length of trip, and whether the current trip is aday trip. The latter variable is useful to distinguish whether local demand isdiffers from extended stays in an autonomous way. A complete listing ofmodel variables and abbreviations is reported in Table 1.
Results
The truncated negative binomial model represented in equation 2 wasestimated and is reported in Table 2. Regression coefficients follow expec-tations supported by economic theory. For example, the coefficient on thetravel cost variable, TC2PPTH, is negative and highly significant indicatinga downward sloping demand curve. The coefficient on the income variable,INC, is positive indicating increased income would shift out the demandcurve although it is insignificant. The insignificance of this variable is not

72 ETHNICITY IN RECREATION DEMAND
TABLE 1Independent Variable Definitions
TC2PPTH—Travel cost per person-trip in, hundreds of dollars, based on round-trip distanceand estimated mileage cost of $0.14 for auto only mode and $0.30 for multiple mode.
HISPANIC—Binary variable representing ethnicity (1 = Hispanic, 0 = non-Hispanic).HISPINT—Hispanic travel cost interaction (HISPANIC *TC2PPTH).INC—Household income.YRKEYS—Number of years experience visiting Florida Keys.AGEH—age in hundreds of years.AGESQH—age squared in hundreds of years.DSUB1—Binary substitute variable (1 = would travel to alternative site, 0 = no alternative
site).DTRIP—Number of days for current trip.DTIME—Binary variable for time (1 = income forgone by taking trip, 0 = no income
forgone).DDAY—Current trip is single day trip.
uncommon in recreation demand models. A couple of possible reasonscould be that people of similar incomes choose similar recreation pursuitsor that income is somewhat collinear with other explanatory variables re-sulting in an inflated variance for the estimated income coefficient. Experi-ence, YRKEYS, has a positive and significant influence on trips. This phe-nomenon is fairly typical in recreation demand, indicating familiarity andattachment to place. The substitution variable, DSUB1, has a negative and
TABLE 2Full Model Maximum Likelihood Parameter Estimates (Dep. var. — annual person-
trips) for Natural Resource Based Recreation During the Summer Season in theFlorida Keys (n = 1546)
Variable
ConstantTC2PPTHHISPINTINCHISPANICYRKEYSAGEHAGESQHDSUB1DTRIPDTIMEDDAYa
Coefficient
2.7906-0.12855-0.69624
0.29543E-021.07630.36516E-01
-0.671490.66822E-01
-0.43989-0.50363E-01
0.56180E-01-0.13369
3.1208
Standard Error
0.160370.88174E-020.28283E-010.10735E-010.80750E-010.30853E-020.77453E-010.11050E-010.120860.35294E-020.144270.70219E-010.33705
z = b/s.e.
17.400-14.580-24.617
0.27513.32911.835
-8.6706.047
-3.640-14.270
0.389-1.904
9.259
P[|Z|>z]
0.000000.000000.000000.783150.000000.000000.000000.000000.000270.000000.696980.056930.00000
Mean of X
2.4540.9487E-016.0290.1397
11.053.940
16.910.20964.8640.8344E-010.9056E-01

BOWKER AND LEEWORTHY 73
significant impact on trip demand indicating that those having readily avail-able substitute sites or activities would take fewer trips than their counter-parts given other factors are constant.
The coefficients on the age variables, AGEH and AGESQH, have op-posite signs and are both significant. This suggests a curvilinear relationshipbetween trip demand and age. Interestingly, this quadratic relationship iscommon to many recreation demand studies, however, the relationship usu-ally is concave downward indicating trips diminish with age. We speculatethat the nature and cost of the Keys trip may preclude participation some-what for younger recreationists although this merits further investigation.The trip length variable, DTRIP, has a negative and significant impact ontrips which seems intuitive in that people taking longer trips would tend totake fewer of them. The DDAY dummy variable is negative and not quitesignificant at the 5-percent level. The negative sign on this coefficient sug-gests that other factors equal, that day-trippers, more than likely locals, takefewer trips. This could be due to the nature and location of the site or itmight be an artifact of how we designed the dependent variable. A peculiarityof this variable is that so few people take one-day trips, roughly 9 percent.The variable indicating that work time and leisure time were easily substi-tuted, DTIME, had a positive sign on its estimated regression coefficient butwas insignificant. Only 8 percent of our estimation sample reported that theycould easily substitute an income earning opportunity for the leisure timethey attributed to their trip(s). This finding suggests that the usual practiceof including a portion of the household wage in travel costs may be inap-propriate.
As the main purpose of this paper is to explore ethnic differences innatural resource-based recreation demand in the Keys, the coefficients onthe Hispanic binary variable, HISPANIC, and the travel cost interaction vari-able, HISPINT, are of the most interest. Both regression coefficients are sta-tistically significant at the 1-percent level providing very strong evidence toreject the previously stated hypotheses of demand congruency betweenwhites and Hispanics, Ho: (3h = 0 and Ho: Phtc = 0. The positive coefficienton the HISPANIC variable suggests that, controlling for all other factors,recreationists of Hispanic ethnic background take more trips to the Keysthan nonhispanics. Perhaps more interesting is the sign and significance ofthe travel cost interaction variable for Hispanics, HISPINT, suggesting a verydifferent price response for Hispanics than whites. The magnitude of thisdifference can be best understood in terms of the two important policy mea-sures derived from the demand model, consumer surplus and price elasticityof demand.
Price elasticity of demand (Ep) is a unitless measure of demand responseto price changes. It is defined as the percentage change in quantity dividedby the percentage change in price. The higher the price elasticity (in abso-lute value) the more responsive demand is to changes in price. For the semi-log specification used in our estimated travel cost demand model, price elas-ticity may be generally calculated as, Ep = Ptc* TCOST, where |3tc is the

74 ETHNICITY IN RECREATION DEMAND
estimated slope of the demand curve and TCOST is the price or travel cost.However, given that we rejected the hypothesis that Hispanics and whiteshave identical demand curves, the estimated model allows for calculatingdifferent price elasticities for each group. For whites, price elasticity is cal-culated as Epw = (3tc* TCOST, while for Hispanics, the price elasticity wouldbe calculated as Eph = ((3tc + (3tch) * TCOST. While price elasticity can becalculated at any price, we use the Hispanic group average travel cost toderive Eph = —.9378. Using the group average travel cost for whites, weobtain Epw = —.6555.
The price elasticity difference suggests that Hispanics are more sensitiveto price changes and that increased travel costs, resulting from entities suchas increased entry or access fees could have dramatic, if not uneven, effectson the current ethnic distribution of recreation visitors to the Keys. Such adifference should at least be carefully considered qualitatively for future pol-icy actions in the area. For example, it is currently estimated that during thesummer season whites account for 871,955 person-trips while Hispanics ac-count for 81,000. Using our estimates of price elasticity and the respectivegroup average travel costs, a price increase of 10 dollars per person-tripwould effect an 8.26 percent drop in Hispanic person-trips and a 1.28 per-cent drop for whites. The difference arises from the difference in the slopeof the two demand curves and the fact that a 10 dollar increase in price isa larger percentage of Hispanics' average cost than it is for whites. In abso-lute terms, an increase by 10 dollars per person-trip translates to a decreaseof 6,688 Hispanic person-trips and 11,202 white person-trips. Interestingly,Hispanics would account for 37 percent of the 17,890 decrease in person-trips although they account for only 8.5 percent of the current number ofperson-trips in total.
Consumer surplus per trip, representing net economic value and a pri-mary input in cost-benefit analysis, is also different for the two groups. Usingour empirical model, consumer surplus per person-trip is calculated as thenegative inverse of the slope of the demand curve. Thus, consumer surplusfor whites is CSW = -1 /P t c = $757, while for Hispanics, CSh = - l /((3 t c +Ptch) = $121. This difference is significant at the 5 percent level based onvariances calculated via the delta method (Yen & Adamowicz, 1993). Some-what alarmingly, such a result suggests that a policy inducing a relative in-crease in white visitation could be judged as more "efficient" from an eco-nomic perspective. Although our methods differ, our results are similar inspirit to Walsh et al.'s (1990) findings pertaining to local and nonlocal usersat Pike's Peak and the Boundary Waters.
Discussion
There is little available literature in recreation economics with which todirectly compare our results. Few studies have been done regarding recrea-tion demand in the Florida Keys. Moreover, virtually no economic studies toour knowledge have explored price response and consumer surplus differ-
BOWKER AND LEEWORTHY 75
ences in recreation demand conditioned by ethnic group. Our findings dem-onstrate that indeed there can be significant differences in the structure ofdemand across ethnic subgroups and that the differences appear nontrivial.As well, our findings seem to corroborate previous literature in recreationand leisure science which indicates that ethnic differences in recreation be-havior exist. At the very least, our results suggest that researchers involvedin recreation demand should strongly consider including ethnic slope andintercept variables or other means of differentiating demand models by eth-nicity to better identify potential differences which could be important inmaking management decisions.
While it is clear that more research is necessary and that we are subjectto the usual case-study caveats, our findings appear to have important policy/management implications for the area. The Florida Keys land base lies en-tirely within the jurisdiction of Monroe County, which is currently in theprocess of implementing restrictive growth management regulations. In ad-dition, all the waters surrounding the Florida Keys were designated a Na-tional Marine Sanctuary (FKNMS) by Congress in 1990 and a multi-agency,multi-jurisdictional management plan was approved by the Florida Governorand Cabinet in early 1997. These events represent the first major effort inintegrated coastal management in the U.S.
From June 1995 to May 1996, an estimated 2.5 million visitors spentover 13.3 million person-days in the Florida Keys. Visitors spent over $1.67billion in South Florida, which had a total impact of $2.94 billion in outputand sales, $1.69 billion in income, and almost 28,000 full-time equivalentjobs (English, Kreisel, Leeworthy, and Wiley, 1996). About $1.2 billion of the$1.67 billion spent in South Florida was spent in Monroe County accountingfor 60 percent of output and sales and 46 percent of income and employ-ment. Under the new policy/management conditions, the future of this areamost likely will be characterized by increasing demand in the face of re-stricted supply. Prices will reflect this relative scarcity. In addition, to achievemany of the policy/management objectives of the FKMNS management plan,businesses, households, and government will be required to make greaterinvestment in environmental protection. Businesses will likely respond byshifting their marketing efforts towards groups willing and able to pay forthese investments. This will further push price upwards.
Given the Hispanic population's sensitivity to prices (relatively moreelastic demand function) and their relatively lower consumer surpluses, wewould expect that without some policy/management intervention, the His-panic population will increasingly be priced-out of the market. Even eco-nomic efficiency guidelines may fail to address this issue because, as we haveshown, the Hispanic population has relatively lower consumer surplus valuesand these would be inputs into efficiency-based benefit-cost analyses.
The issue of Hispanics being priced-out of the market is an issue offairness, equity, and/or the distribution of benefits and costs. Clearly suchissues are and will continue to be important in future recreation manage-ment and environmental planning for the Florida Keys. Moreover, like the
76 ETHNICITY IN RECREATION DEMAND
findings of Walsh et al. (1990) regarding pricing policy and the distributionalimpacts on local and nonlocal users, the findings of this study are very likelyapplicable on a much broader scale, especially to nationally famous sites heldin public trust. In the future, as user fees and related market-based methodsof public land management are implemented, recreation researchers shouldmake an increased effort to identify and quantify the distributional effectsof these policies from both income and ethnic perspectives. Such informa-tion can and should be used by policy makers and managers to assure moreequitable access and a diverse public.
Acknowledgement
We acknowledge C. Y. Johnson, P. Wiley, an associate editor, and twoanonymous reviewers for their valuable input.
References
Adamowicz, W. L., Fletcher, J. J., & Graham-Tomasi, T. (1989). Functional Form and the Statis-tical Properties of Welfare Measures. American Journal of Agricultural Economics, 71, 414-421.
Bayless, D. S., Bergstrom, J. C, Messonnier, M. L., & Cordell, H. K. (1994). Assessing the Demandfor Designated Wildlife Viewing Sites. Journal of Hospitality and Leisure Marketing, 2, 75-93.
Bergstrom, J. B., & Cordell, H. K. (1991). An Analysis of the Demand for and Value of OutdoorRecreation in the United States. Journal of Leisure Research, 23, 67-86.
Bowker, J. M., English, D. B. K., & Cordell, H. K. (1998). Outdoor Recreation Participation andConsumption: Projections 2000 to 2050. In, Outdoor Recreation in American Life: A NationalAssessment of Demand and Supply Trends. H.K. Cordell, Editor. Sagamore Publishing, Cham-paign, IL.
Bowker, J. M., English, D. B. K., & Donovan, J. A. (1996). Toward a Value for Guided Raftingon Southern Rivers. Journal of Agricultural and Applied Economics, 28, 423-432.
Brown, G. Jr., & Mendelsohn, R. (1984). The Hedonic Travel Cost Method. Review of Economicsand Statistics, 66, 427A33.
Carr, D. S., & Williams, D. R. (1993). Understanding the Role of Ethnicity in Outdoor RecreationExperiences. Journal of Leisure Research, 25, 22-38.
Cordell, H. K., Bergstrom, J. C, Hartmann, L. A., & English, D. B. K. (1990). An Analysis of theOutdoor Recreation and Wilderness Situation in the United States, 1989-2040: A TechnicalDocument Supporting the 1989 USDA Forest Service RPA Assessment. USDA Forest Service,Rocky Mountain Forest and Range Experiment Station, General Technical Report RM-189, FortCollins, CO.
Cordell, H. K., Teasley, J., & Super, G. (1997). Outdoor Recreation in the United States: Results fromthe National Survey on Recreation and the Environment: Rocky Mountain Region. USDA ForestService, Athens, GA, April. 152.
Creel, M. D., & Loomis, J. B. Theoretical and Empirical Advantages of Truncated Count DataEstimators for Analysis of Deer Hunting in California. (1990). American Journal of AgriculturalEconomics, 72, 434-441.
Englin, J., & Shonkwiler, J. S. (1995). Estimating Social Welfare Using Count Data Models: AnApplication to Long-Run Recreation Demand Under Conditions of Endogenous Stratifica-tion and Truncation. Review of Economics and Statistics, 77, 104-112.

BOWKER AND LEEWORTHY 77
English, D. B. K., & Bowker, J. M. (1996). Sensitivity of Whitewater Rafting Consumer's Surplusto Pecuniary Travel Cost Specifications. Journal of Environmental Management, 47, 79-91.
English, D. B. K., Kreisel, W., Leewothy, V. R., & Wiley, P. (1996). Economic Contribution ofRecreating Visitors to the Florida Keys/Key West. Strategic Environmental Assessments Di-vision, Office of Ocean Resources Conservation and Assessment, National Ocean Service,National Oceanic and Atmospheric Administration. Silver Spring, MD. November. 22p.
Fletcher, J. J., Adamowicz, W. L., & Graham-Tomasi, T. (1990). The Travel Cost Model of Rec-reation Demand: Theoretical and Empirical Issues. Leisure Sciences, 12, 119-147.
Floyd, M. F., & Gramann, J. H. (1993). Effects of Acculturation and Structural Assimilation inResource-based Recreation: the Case of Mexican-Americans. Journal of Leisure Research, 25,6-21.
Floyd, M. F., Shinew, K. J., McGuire, F. A., & Noe, F. P. (1994). Race, Class, and Leisure ActivityPreferences: Marginality and Ethnicity Revisited. Journal of Leisure Research, 26, 158-173.
Freeman, A. M. (1993). The Measurement of Environmental and Ressource Values: Theory and Methods.Resources for the Future, Washington, D.C.
Greene, W. H. (1995). LIMDEP Version 7.0 User's Manual. Econometric Software, Inc., Bellport,N.Y.
Hellerstein, D. (1991). Using Count Data Models in Travel Cost Analysis with Aggregate Data.American Journal of Agricultural Economics, 73, 660-666.
Hellerstein, D. (1992). The Treatment of Nonparticipants in Travel Cost Analysis and OtherDemand Models. Water Resources Research, 28, 1999-2004.
Hof, J. G., & Kaiser, H. F. (1983). Long-term Outdoor Recreation Participation Projections forPublic Land Management Agencies. Journal of Leisure Research, 15, 1-14.
Johnson, C. J., Bowker, J. M., English, D. B. K., & Worthen, D. (1997). Theoretical Perspectivesof Ethnicity and Outdoor Recreation: A Review and Synthesis of African-American andEuropean-American Participation. USDA Forest Service, Southern Research Station, GeneralTechnical Report SRS-11. May.
Leeworthy, V. R. (1996). Technical Appendix: Sampling Methodologies and Estimation MethodsApplied to the Florida Keys/Key West Visitors Surveys. Strategic Environmental AssessmentsDivision, Office of Ocean Resources Conservation and Assessment, National Ocean Service,National Oceanic and Atmospheric Administration. Silver Spring, MD. December. 170p.
McCollum, D. W., Peterson, G. L., Arnold, J. R., Markstrom, D. C, & Hellerstein, D. M. (1990).The Net Economic Value of Recreation on the National Forests: Twelve Types of PrimaryActivity Trips Across Nine Forest Service Regions. USDA Forest Service, Rocky MountainForest and Range Experiment Station, Research Paper RM-289. February.
McConnell, K. E. (1992). Model Building and Judgment: Implications for Benefit Transfers WithTravel Cost Models. Water Resources Research, 28, 695-700.
Peterson, G. L., & Arnold, J. R. (1987). The Economic Benefits of Mountain Running the Pike'sPeak Marathon. Journal of Leisure Research, 19, 84-100.
Peterson, G. L., Dwyer, J. F., & Darragh, A. J. (1983). A behavioral Urban Recreation Site ChoiceModel. Leisure Sciences, 6, 61-81.
Randall, A. (1994). A Difficulty with the Travel Cost Method. Land Economics, 70, 88-96.Ribaudo, M. O., & Epp, D. J. (1984). The Importance of Sample Discrimination in Using the
Travel Cost Method to Estimate the Benefits of Improved Water Quality. Land Economics,60, 397-403.
Richards, M. T, King, D. H., Daniel, T. C, & Brown, T. C. (1990). The Lack of ExpectedRelationship between Travel Cost and Contingent Valuation Estimator of Forest RecreationValue. Leisure Science, 12, 303-319.

78 ETHNICITY IN RECREATION DEMAND
Smith, V. K. (1989). Taking Stock of Progress with Travel Cost Recreation Demand Methods:Theory and Implementation. Marine Resource Economics, 6, 279-310.
Teasley, J., Bergstrom, J. C, & Cordell, H. K. (1994). Estimating Revenue Capture PotentialAssociated with Public Area Recreation. Journal of Agricultural and Resource Economics, 19, 89-101.
U.S. Water Resources Council. (1983). Economic and Environmental Principles and Guidelines forWater and Related Land Resources Implementation Studies. U.S. Government Printing Office,Washington, DC.
Vaughan, W. J., & Russell, C. S. (1982). Valuing a Fishing Day: An Application of a SystematicVarying Parameter Model. Land Economics, 58, 450-463.
Walsh, R. G., Johnson, D. M., & McKean.J. R. (1992). Benefit Transfer of Outdoor RecreationDemand Studies, 1968-1988. Water Resources Research, 28, 707-713.
Walsh, R. G., Peterson, G. L., & McKean, J. R. (1989). Distribution and Efficiency Effects ofAlternative Recreation Funding Methods. Journal of Leisure Research, 21, 327-347.
Ward, F. A., & Loomis, J. B. (1986). The Travel Cost Demand Model as an Environmental PolicyAssessment Tool: A Review of Literature. Western Journal of Agricultural Economics, 11, 164-178.
Washburne, R. F. (1978). Black Under-participation in Wildland Recreation: Alternative Expla-nations. Leisure Sciences, 1, 175-189.
Yen, S. T., & Adamowicz, W. L. (1993). Statistical Properties of Welfare Measures from Count-data Models of Recreation Demand. Review of Agricultural Economics, 15, 203-215.