Accounting for Biomass Carbon Stock Change Due to Wildfire ... · Accounting for Biomass Carbon...
17
Accounting for Biomass Carbon Stock Change Due to Wildfire in Temperate Forest Landscapes in Australia Heather Keith 1 *, David B. Lindenmayer 1 , Brendan G. Mackey 2 , David Blair 1 , Lauren Carter 1 , Lachlan McBurney 1 , Sachiko Okada 1 , Tomoko Konishi-Nagano 3 1 The Fenner School of Environment and Society, Australian National University, Building 48, Canberra, ACT, Australia, 2 Griffith Climate Change Response Program, Griffith University, Queensland, Australia, 3 Fujitsu Laboratories Ltd., Kawasaki, Japan Abstract Carbon stock change due to forest management and disturbance must be accounted for in UNFCCC national inventory reports and for signatories to the Kyoto Protocol. Impacts of disturbance on greenhouse gas (GHG) inventories are important for many countries with large forest estates prone to wildfires. Our objective was to measure changes in carbon stocks due to short-term combustion and to simulate longer-term carbon stock dynamics resulting from redistribution among biomass components following wildfire. We studied the impacts of a wildfire in 2009 that burnt temperate forest of tall, wet eucalypts in south-eastern Australia. Biomass combusted ranged from 40 to 58 tC ha 21 , which represented 6–7% and 9–14% in low- and high-severity fire, respectively, of the pre-fire total biomass carbon stock. Pre-fire total stock ranged from 400 to 1040 tC ha 21 depending on forest age and disturbance history. An estimated 3.9 TgC was emitted from the 2009 fire within the forest region, representing 8.5% of total biomass carbon stock across the landscape. Carbon losses from combustion were large over hours to days during the wildfire, but from an ecosystem dynamics perspective, the proportion of total carbon stock combusted was relatively small. Furthermore, more than half the stock losses from combustion were derived from biomass components with short lifetimes. Most biomass remained on-site, although redistributed from living to dead components. Decomposition of these components and new regeneration constituted the greatest changes in carbon stocks over ensuing decades. A critical issue for carbon accounting policy arises because the timeframes of ecological processes of carbon stock change are longer than the periods for reporting GHG inventories for national emissions reductions targets. Carbon accounts should be comprehensive of all stock changes, but reporting against targets should be based on human-induced changes in carbon stocks to incentivise mitigation activities. Citation: Keith H, Lindenmayer DB, Mackey BG, Blair D, Carter L, et al. (2014) Accounting for Biomass Carbon Stock Change Due to Wildfire in Temperate Forest Landscapes in Australia. PLoS ONE 9(9): e107126. doi:10.1371/journal.pone.0107126 Editor: Benjamin Poulter, Montana State University, United States of America Received March 26, 2014; Accepted August 9, 2014; Published September 10, 2014 Copyright: ß 2014 Keith et al. This is an open-access article distributed under the terms of the Creative Commons Attribution License, which permits unrestricted use, distribution, and reproduction in any medium, provided the original author and source are credited. Data Availability: The authors confirm that all data underlying the findings are fully available without restriction. All relevant data are within the paper and its Supporting Information files. Funding: The funder provided support in the form of salaries for the authors [HK, SO], but did not have any additional role in the study design, data collection and analysis, decision to publish, or preparation of the manuscript. The specific roles of these authors are articulated in the ‘author contributions’ section. The author affiliated with the funding organization contributed to the conceptual framework of the study. Competing Interests: The authors declare that one of the authors [TKN] is affiliated with one of the funding organizations of this research study, Fujitsu Laboratories Ltd. This affiliation does not alter the authors’ adherence to PLOS ONE policies on sharing data and materials. * Email: [email protected] Introduction Stabilising the carbon stock in the atmosphere to prevent dangerous anthropogenic interference with the climate system is the objective of the United Nations Framework Convention on Climate Change (UNFCCC) [1]. Forest ecosystems naturally exchange carbon dioxide (CO 2 ) with the atmosphere, but losses of carbon stocks from forests due to land management activities is a significant source of greenhouse gas (GHG) emissions [2]. Losses of carbon as emissions of CO 2 from forest ecosystems to the atmosphere occur due to biological decomposition processes, natural disturbance events like fire, as well as human activities. Removals of CO 2 from the atmosphere to forest ecosystem carbon stocks occur by the uptake of carbon in growing vegetation. Under the UNFCCC and Kyoto Protocol, each country constructs GHG inventories and reports on their net annual emissions, that is, flows of CO 2 and other GHGs, due to specific activities and sectors including Land Use, Land Use Change and Forestry. Flow-based inventories in the land sector, however, obscure important differences between ecosystems types and between the impacts of human activities and natural disturbances. A more comprehensive, stock-based approach to accounting can address these problems and provide information that complements flow-based accounts (Ajani et al. 2013). The flow-based accounts are currently used for national reporting against emission reduction targets over short time periods, such as annual or 5 to 8 year commitment periods, as determined by political negotia- tions. However, this short time period exposes nations to high variability in emissions due to natural disturbance events, especially wildfires, which are outside human control, yet create large GHG fluctuations. The resulting variability in national net emissions due to natural disturbance can be much greater than the changes due to land use impacts, thus confounding attempts to provide incentives for reducing emissions in the land sector through improved forest management. PLOS ONE | www.plosone.org 1 September 2014 | Volume 9 | Issue 9 | e107126
Transcript of Accounting for Biomass Carbon Stock Change Due to Wildfire ... · Accounting for Biomass Carbon...

Accounting for Biomass Carbon Stock Change Due toWildfire in Temperate Forest Landscapes in AustraliaHeather Keith1*, David B. Lindenmayer1, Brendan G. Mackey2, David Blair1, Lauren Carter1,
Lachlan McBurney1, Sachiko Okada1, Tomoko Konishi-Nagano3
1 The Fenner School of Environment and Society, Australian National University, Building 48, Canberra, ACT, Australia, 2Griffith Climate Change Response Program,
Griffith University, Queensland, Australia, 3 Fujitsu Laboratories Ltd., Kawasaki, Japan
Abstract
Carbon stock change due to forest management and disturbance must be accounted for in UNFCCC national inventoryreports and for signatories to the Kyoto Protocol. Impacts of disturbance on greenhouse gas (GHG) inventories areimportant for many countries with large forest estates prone to wildfires. Our objective was to measure changes in carbonstocks due to short-term combustion and to simulate longer-term carbon stock dynamics resulting from redistributionamong biomass components following wildfire. We studied the impacts of a wildfire in 2009 that burnt temperate forest oftall, wet eucalypts in south-eastern Australia. Biomass combusted ranged from 40 to 58 tC ha21, which represented 6–7%and 9–14% in low- and high-severity fire, respectively, of the pre-fire total biomass carbon stock. Pre-fire total stock rangedfrom 400 to 1040 tC ha21 depending on forest age and disturbance history. An estimated 3.9 TgC was emitted from the2009 fire within the forest region, representing 8.5% of total biomass carbon stock across the landscape. Carbon losses fromcombustion were large over hours to days during the wildfire, but from an ecosystem dynamics perspective, the proportionof total carbon stock combusted was relatively small. Furthermore, more than half the stock losses from combustion werederived from biomass components with short lifetimes. Most biomass remained on-site, although redistributed from livingto dead components. Decomposition of these components and new regeneration constituted the greatest changes incarbon stocks over ensuing decades. A critical issue for carbon accounting policy arises because the timeframes ofecological processes of carbon stock change are longer than the periods for reporting GHG inventories for nationalemissions reductions targets. Carbon accounts should be comprehensive of all stock changes, but reporting against targetsshould be based on human-induced changes in carbon stocks to incentivise mitigation activities.
Citation: Keith H, Lindenmayer DB, Mackey BG, Blair D, Carter L, et al. (2014) Accounting for Biomass Carbon Stock Change Due to Wildfire in Temperate ForestLandscapes in Australia. PLoS ONE 9(9): e107126. doi:10.1371/journal.pone.0107126
Editor: Benjamin Poulter, Montana State University, United States of America
Received March 26, 2014; Accepted August 9, 2014; Published September 10, 2014
Copyright: � 2014 Keith et al. This is an open-access article distributed under the terms of the Creative Commons Attribution License, which permitsunrestricted use, distribution, and reproduction in any medium, provided the original author and source are credited.
Data Availability: The authors confirm that all data underlying the findings are fully available without restriction. All relevant data are within the paper and itsSupporting Information files.
Funding: The funder provided support in the form of salaries for the authors [HK, SO], but did not have any additional role in the study design, data collectionand analysis, decision to publish, or preparation of the manuscript. The specific roles of these authors are articulated in the ‘author contributions’ section. Theauthor affiliated with the funding organization contributed to the conceptual framework of the study.
Competing Interests: The authors declare that one of the authors [TKN] is affiliated with one of the funding organizations of this research study, FujitsuLaboratories Ltd. This affiliation does not alter the authors’ adherence to PLOS ONE policies on sharing data and materials.
* Email: [email protected]
Introduction
Stabilising the carbon stock in the atmosphere to prevent
dangerous anthropogenic interference with the climate system is
the objective of the United Nations Framework Convention on
Climate Change (UNFCCC) [1]. Forest ecosystems naturally
exchange carbon dioxide (CO2) with the atmosphere, but losses of
carbon stocks from forests due to land management activities is a
significant source of greenhouse gas (GHG) emissions [2]. Losses
of carbon as emissions of CO2 from forest ecosystems to the
atmosphere occur due to biological decomposition processes,
natural disturbance events like fire, as well as human activities.
Removals of CO2 from the atmosphere to forest ecosystem carbon
stocks occur by the uptake of carbon in growing vegetation.
Under the UNFCCC and Kyoto Protocol, each country
constructs GHG inventories and reports on their net annual
emissions, that is, flows of CO2 and other GHGs, due to specific
activities and sectors including Land Use, Land Use Change and
Forestry. Flow-based inventories in the land sector, however,
obscure important differences between ecosystems types and
between the impacts of human activities and natural disturbances.
A more comprehensive, stock-based approach to accounting can
address these problems and provide information that complements
flow-based accounts (Ajani et al. 2013). The flow-based accounts
are currently used for national reporting against emission
reduction targets over short time periods, such as annual or 5 to
8 year commitment periods, as determined by political negotia-
tions. However, this short time period exposes nations to high
variability in emissions due to natural disturbance events,
especially wildfires, which are outside human control, yet create
large GHG fluctuations. The resulting variability in national net
emissions due to natural disturbance can be much greater than the
changes due to land use impacts, thus confounding attempts to
provide incentives for reducing emissions in the land sector
through improved forest management.
PLOS ONE | www.plosone.org 1 September 2014 | Volume 9 | Issue 9 | e107126

Losses of carbon due to wildfire are a significant component of
global annual GHG balances and so it is important that they are
included in national inventories. Seasonal losses of carbon from
wildfires are detected as high concentrations of trace gases in the
troposphere [3,4]. Estimates of gross losses of carbon from forest
fires globally range from 2.0–2.5 Pg C yr21 [5,6] to 3.8–4.3 Pg C
yr21 [7] as annual averages. As a comparison of the magnitude of
this flux, the global net losses are 1.1 PgC yr21 from land-use
change and 7.9 PgC yr21 from fossil fuel emissions [8]. For nations
with large areas of forest that are subject to periodic wildfires, such
as Australia, Canada, USA, Russia and South Africa [9,10,11], the
treatment of wildfires in carbon accounting for forest management
is an important consideration. The rules and methodologies are
complex, often controversial, and raise many issues in interna-
tional accounting systems.
Carbon stock changes due to wildfires occur at different
temporal scales that should be included in comprehensive stock-
based accounts. Large losses occur over periods of hours to days or
weeks due to combustion and are highly variable each year due to
occurrence of fire. Uptake through forest regrowth and losses
through decomposition of dead biomass occur over decades to
centuries. These changes in carbon stocks are balanced in
comprehensive accounts, and in the accumulated concentration
of CO2 in the atmosphere, when assessed over a sufficiently long
time period, assuming the fire regime is stationary. The following
information is required to enable inclusion of wildfire disturbance
in comprehensive stock-based national carbon accounts: carbon
stock loss due to combustion, redistribution of carbon stocks
between living and dead biomass components; subsequent rates of
decomposition; and carbon uptake by regenerating vegetation.
These estimates of carbon stock change need to be calculated on a
landscape-wide basis and integrated over appropriate time periods
[12] with data from a range of forest types. However, method-
ologies for measuring carbon stock change due to wildfire are
problematic for a number of reasons, including: (i) wildfires
typically extend over large areas, within which fire severity varies
spatially; (ii) initial carbon stocks vary across the landscape in
response to differences in forest type, age, disturbance history and
environmental factors; (iii) biomass components are combusted
with differing efficiencies; (iv) fire occurrence is stochastic [13,14];
and (v) the dynamics of carbon stocks occur over long time periods
in response to wildfire.
Of these methodological issues, the parameter with the greatest
uncertainty is the amount of carbon combusted, calculated as
either an amount or a proportion of the fuel load or total stock,
and then upscaled from individual components to sites and
landscapes [5,15]. Combustion efficiency varies due to character-
istics of individual fuel materials, such as logs of varying size, wood
density, state of decay and moisture content [16], and character-
istics of the fire, such as intensity and residence time, which
determine the oxidation conditions of flaming or smouldering
combustion [7,17,18]. At the landscape scale, the proportion
combusted depends on the areas burnt within the fire boundary,
including small scale heterogeneity in fire occurrence and severity.
The high degree of uncertainty created by the limited existing data
is demonstrated when aggregated spatially in regional and global
inventories. For example, estimates of carbon stock losses from
wildfires in Australia derived from global analyses differ by up to
six-fold [6,19,20,21,22].
The objectives of this study were to investigate the magnitude
and timeframe of carbon stock changes due to wildfire and to
evaluate the results in terms of implications for national carbon
accounts.
(i) We assessed the magnitude of carbon stock losses due to
combustion in a wildfire in terms of the amount and
proportion of the total forest ecosystem carbon stock. We
then considered the significance of these carbon losses
compared with potential impacts from human activities.
(ii) We considered the impact of fire on the ecosystem carbon
stock in terms of the timeframe of stock changes. The mean
residence times of carbon stocks change in response to
redistribution of carbon among biomass components post-
fire and their subsequent relative rates of losses and gains.
We investigated the dynamics of carbon stock change within
the current disturbance regime and not predicted future
regimes or climate.
(iii) We evaluated our results about the magnitude and time-
frame of carbon stock changes in terms of their significance
for the rules and methodologies governing national carbon
accounting for forest management. Now is an important
time to contribute quantitative information to the develop-
ment of accounting guidelines for post-2020 agreements
which include forest management and disturbance events
under the Durban Platform for Enhanced Action [23].
To address these issues about accounting for carbon stock
changes due to wildfire, we examined changes in carbon stocks in
a temperate eucalypt forest in south-east Australia that was
subjected to a wildfire in 2009. We selected a temperate forest
because they contain high carbon stocks and contribute 34% to
the global forest carbon sink; a proportion that has been increasing
over the last two decades [24]. Changes in carbon stocks due to
combustion during the fire were assessed empirically and we also
investigated the long-term dynamics of biomass carbon pools post-
fire using a simulation model, both at the site level and up-scaled
across the landscape.
Methods
Description of study regionAccess to field sites was granted by Parks Victoria and the
Department of Environment and Primary Industries Victoria. Our
study region (2,326 km2) was the tall, wet sclerophyll montane ash
forests (Eucalyptus regnans, E. delegatensis and E. nitens) in the
Central Highlands of Victoria (Figure 1). These temperate forests
are among the most carbon-dense in the world and protection of
these carbon stocks offers the potential for mitigation [25]. These
forests are subject to a disturbance regime of infrequent, high
intensity wildfires [26,27].
Wildfire disturbance regimeThe known historical fire frequency has been one in the 1700s,
three in the 1800s, nine in the 1900s, and three in the 2000s
[27,28], and their spatial extent was mapped across the study
region (Figure 1). Occurrence of these fires does not necessarily
mean that each conflagration occurred at the same locations or at
the same intensity. The mean interval for fires that kill ash trees at
a site has been estimated to be 75 to 150 years [29,30]. However,
an estimate that approximately half the trees survive within the
boundary of a wildfire [30] means that only every second fire in
any one location is of sufficient intensity to kill ash trees. Hence,
the mean interval of all fires is estimated to be 37 to 75 years. A
maximum fire interval of 350–400 years was estimated based on
maximum age of the montane eucalypt species [31].
Unlike most eucalypt species, E. regnans and E. delegatensis areobligate seeders and usually killed if their canopies are predom-
inantly scorched by fire [32,33,34]. However, wildfires are highly
Carbon Accounting of Wildfires
PLOS ONE | www.plosone.org 2 September 2014 | Volume 9 | Issue 9 | e107126

variable in extent and severity, which is reflected in current stand
age structures of a mosaic of even-aged and multi-aged forests
[26,35,36]. Even-aged stands result from widespread mortality and
regeneration following high-severity wildfire. Multi-aged stands
result from partial tree death and subsequent regeneration
alongside surviving trees [29,37,38]. Hence, the variability of
historical fires is important for determining current stand
structures. For example, our entire study area is within the
boundary of the 1939 fire. However, evidence that individual trees
and forest stands survived is seen by the current age structure of
patches of old-growth forest where many living trees have fire scars
from the 1939 fire event [39].
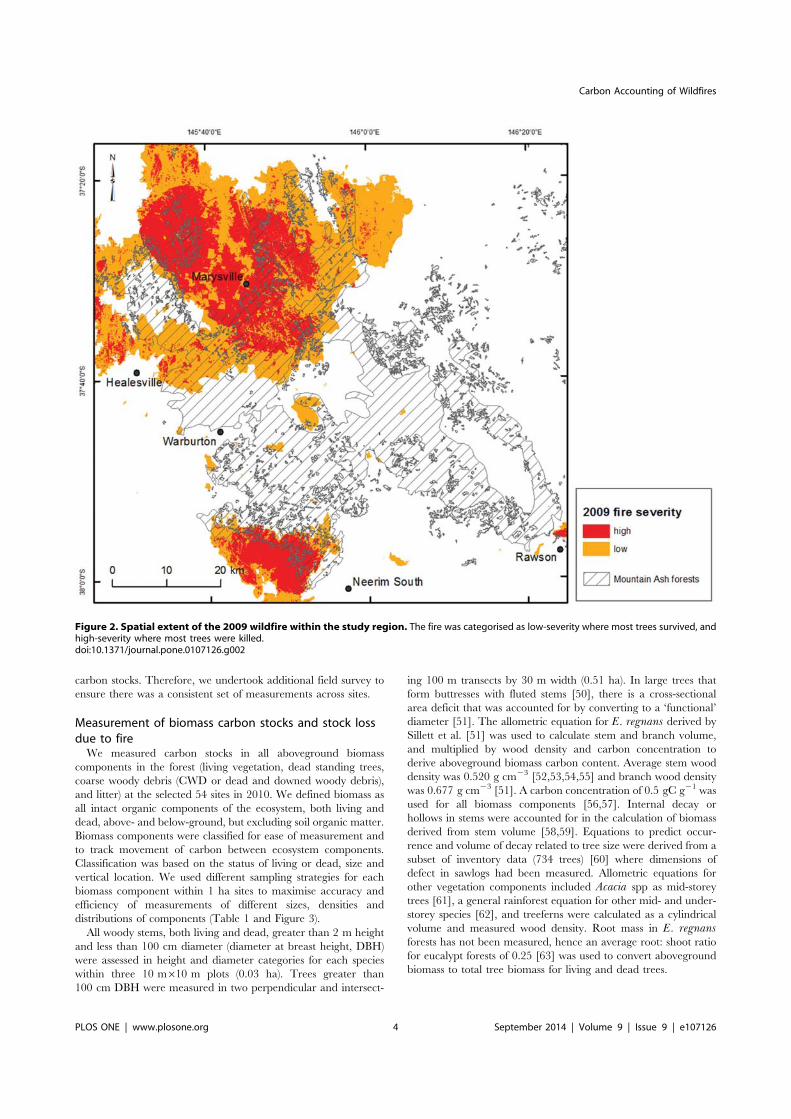
A wildfire started on 7th February 2009 that burnt over 450,000
ha in Victoria under extreme hot, dry weather conditions (46.4 uCin the nearby city of Melbourne), with winds up to 100 km hr21
[40,41]. Within our study region of montane ash forest, 485 km2
burnt at low-severity and 283 km2 burnt at high-severity
(Figure 2). Fire severity was mapped by the Victorian Department
of Environment and Primary Industries using air photo interpre-
tation and categorised by degree of crown scorch and subsequent
tree survival or mortality.
Field sitesWe selected 54 sites within the montane ash forest region of the
Central Highlands of Victoria (Figure 1) from an existing network
of 170 long-term ecological monitoring sites [27] to provide sites
with a range of conditions of forest age and severity of the 2009
wildfire. The site categories of forest age were 1983 and 1939
regrowth after wildfire followed by salvage logging or clearcut
logging, and old growth. Salvage logging was common practice
after wildfire to remove the timber resource [42,43,44,45].
Selection of these regrowth sites provided reasonably even-aged
stands of similar structure, although some residual older trees
occur [46]. Old growth forest consisted of dominant trees greater
than 120 years old but mostly 250 years old that had regenerated
following a fire in approximately 1750 [39]. The site categories of
severity of the 2009 wildfire were unburnt, low-severity and high-
severity burns. Our distinction between low- and high-severity fire
was based on site observations of full scorch of the canopy and
mortality of E. regnans and E. delegatensis trees. The three forestage and three fire severity categories produced a matrix of nine
categories, each with six replicate sites.
While the 54 sites covered a range of forest stand structures and
disturbance histories, the assumption that the sites had comparable
pre-fire biomass carbon stocks, disturbance history, and local
biophysical conditions did not necessarily hold. Their carbon
stocks likely varied because of the natural heterogeneity of the
landscape and the fact that fires are less likely to burn in wet,
highly productive mature and old growth forest areas [47,48,49].
Furthermore, the monitoring protocols used prior to the 2009 fire
at the sites were aimed at biodiversity assessments, and did not
include all the measurements required to quantify ecosystem
Figure 1. Location of the study region in the Central Highlands of Victoria, Australia. Location of field sites is marked, including long-termecological monitoring sites (n = 54) where carbon stocks in biomass components were measured, and inventory sites (n = 876) where carbon stockswere estimated and used for upscaling. The spatial extent of wildfires shown represents the outer boundary of the burnt area.doi:10.1371/journal.pone.0107126.g001
Carbon Accounting of Wildfires
PLOS ONE | www.plosone.org 3 September 2014 | Volume 9 | Issue 9 | e107126
carbon stocks. Therefore, we undertook additional field survey to
ensure there was a consistent set of measurements across sites.
Measurement of biomass carbon stocks and stock lossdue to fireWe measured carbon stocks in all aboveground biomass
components in the forest (living vegetation, dead standing trees,
coarse woody debris (CWD or dead and downed woody debris),
and litter) at the selected 54 sites in 2010. We defined biomass as
all intact organic components of the ecosystem, both living and
dead, above- and below-ground, but excluding soil organic matter.
Biomass components were classified for ease of measurement and
to track movement of carbon between ecosystem components.
Classification was based on the status of living or dead, size and
vertical location. We used different sampling strategies for each
biomass component within 1 ha sites to maximise accuracy and
efficiency of measurements of different sizes, densities and
distributions of components (Table 1 and Figure 3).
All woody stems, both living and dead, greater than 2 m height
and less than 100 cm diameter (diameter at breast height, DBH)
were assessed in height and diameter categories for each species
within three 10 m610 m plots (0.03 ha). Trees greater than
100 cm DBH were measured in two perpendicular and intersect-
ing 100 m transects by 30 m width (0.51 ha). In large trees that
form buttresses with fluted stems [50], there is a cross-sectional
area deficit that was accounted for by converting to a ‘functional’
diameter [51]. The allometric equation for E. regnans derived by
Sillett et al. [51] was used to calculate stem and branch volume,
and multiplied by wood density and carbon concentration to
derive aboveground biomass carbon content. Average stem wood
density was 0.520 g cm23 [52,53,54,55] and branch wood density
was 0.677 g cm23 [51]. A carbon concentration of 0.5 gC g21 was
used for all biomass components [56,57]. Internal decay or
hollows in stems were accounted for in the calculation of biomass
derived from stem volume [58,59]. Equations to predict occur-
rence and volume of decay related to tree size were derived from a
subset of inventory data (734 trees) [60] where dimensions of
defect in sawlogs had been measured. Allometric equations for
other vegetation components included Acacia spp as mid-storey
trees [61], a general rainforest equation for other mid- and under-
storey species [62], and treeferns were calculated as a cylindrical
volume and measured wood density. Root mass in E. regnansforests has not been measured, hence an average root: shoot ratio
for eucalypt forests of 0.25 [63] was used to convert aboveground
biomass to total tree biomass for living and dead trees.
Figure 2. Spatial extent of the 2009 wildfire within the study region. The fire was categorised as low-severity where most trees survived, andhigh-severity where most trees were killed.doi:10.1371/journal.pone.0107126.g002
Carbon Accounting of Wildfires
PLOS ONE | www.plosone.org 4 September 2014 | Volume 9 | Issue 9 | e107126

Coarse woody debris consisted of all woody material $25 mm
diameter on the ground, and was measured using the line intersect
method [64,65]. Logs less than 60 cm diameter were measured
along 6610 m transects within the site and logs greater than
60 cm diameter were measured along 26100 m perpendicular
transects. Each piece of CWD was assessed for hollows and degree
of decay in three categories. Bulk density was measured for each
category of decay to determine biomass. The litter layer consisted
of organic material less than 25 mm diameter including leaves,
twigs, insect detritus, animal scats, and comminuted material that
was recognisable as organic material. Litter depth was measured at
15 points per site on a compressed litter pack to standardise the
quantity of loose material. Depth was converted to biomass using a
relationship derived from 30 quadrats sampled for dry weight of
litter. Our results for carbon stocks refer to the total biomass of
living and dead, above- and below-ground components.
We estimated biomass carbon stock loss by combustion in the
2009 wildfire from the following lines of evidence: (i) field
observations and photographs taken immediately after the fire
(within 2 months) [66], (ii) measurements of some components of
the forest that were measured pre-fire compared with post-fire,
and (iii) measurements of biomass components post-fire taken at
burnt and unburnt sites. Biomass components combusted in the
fire were measured specifically; including, hollow trees, decorti-
cating and rough bark, canopy, shrub biomass, CWD and litter
(Table 2 and Figure 4).
Hollow trees, both living and dead, are highly susceptible to
combustion because fire is funnelled through the pipe [67]. Data
for individual tree heights and diameters from 2005 and 2011 [67]
were compared to assess the change pre- and post-2009 fire. The
difference in carbon stock between years represented a combina-
tion of natural mortality, decay and collapse of trees plus
combustion at the burnt sites. Carbon stock loss was calculated
as a proportion of the initial stock and the difference between
burnt and unburnt used to distinguish the effect of natural decay
and combustion.
Biomass of decorticating or ribbon bark hanging from the upper
stem and branches was related to tree DBH by a non-destructive
sampling method using estimated standard units [68]. All
decorticating bark was combusted in the fire. Biomass of rough
or fibrous bark on the lower stem was estimated from measure-
ments of bark thickness and bulk density related to tree DBH.
Combustion of rough bark was determined from the difference
between burnt and unburnt sites. Both decorticating and rough
bark mass were calculated for all the inventory trees at the 54 sites.
Canopy leaf biomass was estimated to be approximately 7 tC
ha21, derived from annual litterfall of 4.7 tC ha21 yr21 in ash
forests [69,70] and longevity in the canopy of about 18 months
[50,71]. Twig (diameter ,4 mm) biomass is a similar amount to
the leaves [72]. The proportion of the canopy combusted was
estimated from photographs after the fire of the leaves remaining
in the canopy and the scorched leaves that had fallen to the
ground.
Figure 3. Design of 1 ha experimental sites. Sites of100 m6100 m included central and perpendicular transects (dashedlines), 10 m610 m plots (hatched), 10 m transects (black lines), andarea sampled for large trees 2630 m6100 m=0.51 ha) (grey shadedarea). Different biomass components were sampled in different parts ofthe site.doi:10.1371/journal.pone.0107126.g003
Table 1. Methods for measuring carbon stocks in biomass components within 1 ha sites post-fire at burnt and unburnt sites.
Biomass component Sampling strategy Measurement
Trees (living and dead) eucalypt and rainforest species
,100 cm diameter Three 10 m610 m plots (0.03 ha) Estimated height and diameter in size categories
.100 cm diameter Two perpendicular intersecting 100 m630 mtransects (0.51 ha)
Measured DBH and height.
Mid- and Under-storey (living and dead) non-eucalypt species
,20 m height Three 10 m610 m plots (0.03 ha) Estimated height and diameter in size categories
Coarse woody debris
,60 cm diameter Line intersect method along 6610 m transects Log diameter, decay class, hollows, charcoal and bulkdensity [64,65]
.60 cm diameter 26100 m transects
Litter layer
,2.5 cm diameter 15 points along transects per site. 30 quadrats randomlylocated at sites to cover range in litter depths
Measured litter depth.
Measured litter dry mass.
doi:10.1371/journal.pone.0107126.t001
Carbon Accounting of Wildfires
PLOS ONE | www.plosone.org 5 September 2014 | Volume 9 | Issue 9 | e107126

Combustion of shrub biomass in woody stems, branches and
twigs was assessed using measurements of: (i) minimum sizes of tips
remaining on stems after the fire, (ii) the proportion of biomass lost
from a shrub when different tip sizes were removed, and (iii) the
amount of biomass in each stem diameter size class of shrubs from
the inventory data. A range of species and sizes of understorey
shrubs was sampled.
Combustion of CWD was determined on each piece along the
measurement transects by the proportion of the piece charred, or
by the number of lines of charcoal remaining on the ground. The
initial carbon stock of the logs that were completely converted to
charcoal was assumed to be represented by the mean size of logs at
the site. CWD was too variable between burnt and unburnt sites
within stand age categories to allow a comparison to be indicative
of the amount combusted as the mean of a category. The
proportion of the litter layer combusted was estimated from
photographs of quadrats taken soon after the fire in low- and high-
severity burnt areas and compared with litter biomass in unburnt
sites.
Spatial estimation of carbon stocksSpatial up-scaling of the site data to the landscape level followed
the statistical modelling approach of Keith et al. [73]. Calibration
data for the model used the pre-2009 carbon stocks from the 54
sites described above, as well as an additional 876 sites with
inventory data [60]. The statistical model regressed site carbon
stocks against the following explanatory variables at a 250 m grid
resolution: climate variables of precipitation, water availability
index, temperature (minimum, mean, maximum) and radiation;
topographic variables of topographic position, elevation, aspect
and slope; substrate variables of soil parent material, lithology and
soil organic carbon content; gross primary productivity (GPP,
derived from remote sensing); forest type; forest management area;
and disturbance history. Methods used to derive spatial estimates
of the environmental and GPP variables are documented in
Mackey et al. and Berry et al. [26,74,75]. Disturbance history
included wildfires and logging under different silvicultural systems,
both of which have complex effects on forest age structure. The
statistical regression model was used to generate spatial estimates
of carbon stocks across the study region.
Impacts of the wildfire on ecosystem carbon stocks were
quantified by determining first, the loss in carbon stock of each
biomass component combusted, and second, the redistribution of
carbon among biomass components within the ecosystem. Spatial
estimation of the carbon stock post-2009 fire was based on
measured reductions in the stock according to the fire severity
category in the burnt areas and forest age.
Modelling change in carbon stocksChanges in carbon stocks were simulated for each forest age
category after high-severity fire at the average historical return
time of 112 years. Initial conditions for the model used site data of
the current carbon stock in each age category and the proportion
of the stock combusted. After the fire, carbon stocks were
redistributed among living and dead components according to
the proportions measured in each age category. For the second fire
cycle, the initial condition of total biomass at the time of the fire
was the stock simulated for year 112, and the proportions of the
stock combusted and redistributed were taken as the average of the
site data from the 1939 regrowth and old growth forests. Changes
in carbon stocks over time were simulated using functions to
describe the processes of regeneration, mortality, collapse of dead
trees, and decomposition of CWD derived from existing data and
observations for montane ash forest (Table 3).
The rate of regeneration was based on carbon stocks at sites
with different times since stand-replacing disturbance, derived
from the current study and inventory data [60]. Mortality due to
self-thinning of the regeneration was estimated from changes in
stem density with age, based on data from the literature [76,77].
Mortality of living trees that survived the fire was based on
measured rates of mortality over 28 years [67] and the average
longevity of E. regnans of at least 250 years [78], but up to 500
years [79]. The rate of collapse of dead standing trees was
described by a logistic function, with a slow initial rate that
Table 2. Methods for measuring changes in carbon stocks of biomass components after wildfire, within 1 ha sites.
Biomasscomponent Sampling time Sampling strategy Measurement Proportion of biomass combusted
Low-severity fire High-severity fire
Hollow trees Measured in 2005and 2011
All trees in 1 ha Measured DBH and height. 0.12 to 0.29 0.16 to 0.56
Decorticating bark Post-fire, burntand unburnt sites
Representative sizerange of trees.
Measured relationship between treeDBH and bark mass.
1.0 1.0
Rough bark Post-fire, burntand unburnt sites
Representative sizerange of trees.
Measured relationship between treeDBH and bark thickness plus bulk density.
0.3 (for trees.200 cm)
0.6 (for trees.200 cm)
Canopy leaves Post-fire, burntand unburnt sites
Observations and photos Estimated biomass from litterfall and leaflongevity
0.5 1.0 (mostly)
Canopy twigs Post-fire, burntand unburnt sites
Observations and photos Relationship between leaf and twig mass. 0.5 1.0 (mostly)
Shrubs Post-fire,burnt sites
Representative range ofshrub sizes and species.
Minimum size of tips remaining onstems after fire. Calculated biomass ineach stem diameter class in plots.
0.25 to 0.5 (frombranch diameter,5 cm)
0.3 to 0.75 (frombranch diameter,5 cm)
Coarse woodydebris
Post-fireburnt sites
Line intersect transects Proportions of logs charred. Linesof charcoal remaining post-fire.
Highly variabledependent onlog size
Highly variabledependent onlog size
Litter Photos soonafter the fire
Average from all low- andhigh-severity burnt sites.
Proportion of litter layer combusted. 1.0 1.0
doi:10.1371/journal.pone.0107126.t002
Carbon Accounting of Wildfires
PLOS ONE | www.plosone.org 6 September 2014 | Volume 9 | Issue 9 | e107126

increased to a maximum and then a slow final rate when few trees
remain. This pattern was based on observations and evidence that
dead trees remain standing for approximately 10 to 75 years
[66,80]. The biomass in dead trees was then transferred to the
CWD pool. The rate of decomposition of CWD and dead root
biomass used in the model was 0.07 yr21, which had been derived
from empirical data for E. regnans [55]. This rate was
intermediate among published rate constants [80,81,82], and
produced amounts of CWD that were consistent with observed
amounts in montane ash forest.
Results
Current carbon stockBiomass density varied substantially among sites within the
montane ash forest due to the disturbance history and subsequent
age distribution of the forest. Biomass density (mean 6standard
error, n = 6 sites) in unburnt stands was 405633 tC ha21 in 1983
regrowth, 603674 tC ha21 in 1939 regrowth, and 1039644 tC
ha21 in old growth sites. The structure of these forest stands is
illustrated in terms of the distribution of their carbon stock by tree
sizes (Figure 5). These tree sizes demonstrate that the regrowth
stands were not necessarily even-aged and included some larger
residual trees which contained high, but variable, levels of
biomass.
CWD biomass was highly variable among sites in the age/fire
categories, ranging from 15 to 186 tC ha21, with a mean of 67 tC
ha21. There was no significant difference in CWD biomass
between forest age categories, reflecting the varied disturbance
history of these forests where CWD remained after logging and
wildfire, and its biomass was not related to the age of the stands.
Litter biomass in the unburnt sites ranged from 6 tC ha21 in the
1983 regrowth to 9 tC ha21 in mature and old growth stands. This
litter biomass corresponded to average site depth of litter when
compressed of 2 cm and 3 cm, respectively, with the majority of
measured points less than 5 cm and only a few points with 5–
10 cm depth.
Biomass components combustedIn areas burnt by low-severity fire, most of the over-storey trees
survived as well as variable proportions of mid- and under-storey
vegetation with green, scorched or combusted leaves. In areas
burnt by high-severity fire, most of the leaves, twigs and
decorticating bark in all canopy strata were combusted, although
scorched leaves remained in patches. Some montane ash forests
included a few E. nitens trees that regenerated by epicormic
growth. Woody stems of most shrubs and mid-storey trees
remained, but some were entirely combusted. The average branch
size combusted from shrubs was 4 mm (maximum 19 mm) in low-
severity fire, and 8 mm (maximum 42 mm) in high-severity fire.
Figure 4. Schematic of carbon stocks in the forest ecosystem and stock changes resulting from fire.doi:10.1371/journal.pone.0107126.g004
Carbon Accounting of Wildfires
PLOS ONE | www.plosone.org 7 September 2014 | Volume 9 | Issue 9 | e107126

The carbon stock losses from each biomass component and the
proportion of the total biomass combusted differed with age class
of the forest (Table 4). The distribution of readily combusted
components within the ecosystem influenced the proportion of the
stock emitted during the fire. Much of the observed change due to
fire was combustion of shrubs in the understorey. However, this
represented a small proportion of the total biomass in the
ecosystem. Combustion of 7.8–16.2 tC ha21 in the small branches
on shrubs of all stem diameter categories in the understorey
(Table 4) represented 1.6–4% of the total living biomass (above-
and below-ground) in low-severity fire, and 1.9–6.7% in high-
severity fire (range from young regrowth to old growth stands).
Some CWD was combusted during the fire, but both the
absolute amount and proportion of initial biomass were highly
variable spatially. Higher amounts of CWD were combusted in the
1983 and 1939 regrowth stands (range 1.37–2.41 tC ha21) than in
the old growth stands (0.16–0.43 tC ha21) (Table 4). Large
amounts of CWD occur in these regrowth stands due to self-
thinning and residual material from previous logging and fire
events. The high rates of combustion in regrowth stands occur
Table 3. Input data and equations to predict biomass carbon stock (B in tC ha21) as functions of time (t) since disturbance in themodel of change in carbon stocks after a high-severity wildfire in old growth montane ash forest.
Process Function Data Source
Regeneration( = gain in carbon)
Bregen (t) = 12006(1–exp (20.00456t))0.7 Inventory data from 99 sites 46,60
Log10(SDt) = 1.28+3.1660.913t +1.960.99t
Log10 (SDt) = 11.61–1.624 log10 (t)(average from the two functions used)
Double exponential function fitted tochronosequence site data for E.regnans.Function derived from site data
76,77
Mortality of regeneration( = input to dead trees)
Bdead(t) = [(SD(t –1) – SD(t))/SD(t)]6Bregen(t) Empirically derived from stem density changes Current
Branch fall ( = input to CWD) Bbranch(t) = Bregen (t)60.005 Rate constant derived empirically toproduce CWD biomass in therange observed (3–255 tC ha21).
96
Mortality of surviving trees( = input to dead trees)
Bdead(t) = 135 exp (20.0156t) Rate of mortality estimated from site data. 67
Collapse of dead trees( = input to CWD)
BCWD_in(t) = 687/(1+ exp(0.16t 25) Logistic function derived to fit observations thatdead trees remain standing for 10 to 75 years.
66
Decomposition of CWD( = loss of carbon)
BCWD_loss(t) = 124 exp (20.076t) Rate constant. Modelled range in CWD consistent withsite data (mean of 51 tC ha21 and max. of 255 tC ha21)
55,96 Current
doi:10.1371/journal.pone.0107126.t003
Figure 5. Distribution of carbon stocks in trees according to their size. Carbon stock is shown as the proportion in stem size classes of DHBand trees with hollows, averaged for the sites in each age/fire category (n = 6 sites per category).doi:10.1371/journal.pone.0107126.g005
Carbon Accounting of Wildfires
PLOS ONE | www.plosone.org 8 September 2014 | Volume 9 | Issue 9 | e107126

because large proportions of the CWD are small logs and drier
logs (decay class 1), compared with the old growth stands. Hollow
or damaged trees, either living or dead, were a major source of
carbon stock loss (3.8–21.7 tC ha21) (Table 4). Where these trees
had hollows in the centre of the stem, flames funnel up like a
chimney and ignite exposed dry wood. In regrowth stands, hollow
trees comprised 2–12% of the total tree biomass, and contained a
carbon stock ranging from 7–50 tC ha21. In old-growth stands,
trees with hollows generally consisted of the older cohort of trees
but also included damaged younger trees. They represented a
highly variable proportion of the total biomass, from 9–49%, and
contained a carbon stock of 45–241 tC ha21.
The average carbon stock loss from biomass components was 40
tC ha21 and 58 tC ha21 in low- and high-severity fires,
respectively, and this represented an estimated maximum amount
(Table 4). As a proportion of the total biomass carbon stock
(above- and below-ground), this loss represented 6–7% in low-
severity fires and 9–14% in high-severity fires.
Distribution of carbon among components due to fireThe largest impact of fire on the ecosystem carbon stock was a
shift in distribution among biomass components. The proportion
of total biomass that was in living vegetation in unburnt sites was
72%, 71% and 89%, respectively in the 1983, 1939 regrowth and
old growth sites. The shift from living to dead biomass was 3%,
6% and 19% due to low-severity fire, and 85%, 97% and 84% due
to high-severity fire, respectively in the age categories (Figure 6).
CWD increased by only a small proportion in the burnt sites; some
logs were combusted and a similar amount was transferred into the
CWD component.
Carbon stock dynamicsCombustion of biomass during the fire resulted in an initial loss
of some carbon, but most of the biomass remained at the site. Our
simulation model predicted that carbon stocks would increase for
several decades after the fire due to the combination of
regeneration of living biomass and persistence of dead biomass
components (Figure 7). Mortality of trees during the fire produced
large amounts of dead biomass, but the trees only collapsed slowly
and then contributed to the CWD pool, from where carbon stock
loss by decomposition occurred over many decades. The lowest
carbon stock in an old growth forest occurred nearly a century
after a single fire when most of the dead biomass produced by the
fire had decomposed. The maximum fluctuation in carbon stock
Table 4. Summary of biomass components combusted by low- and high-severity fires.
Mass of carbon1 combusted (tC ha21)
1983 regrowth 1939 regrowth Old growth
Low-severity fire mean SE mean SE mean SE
Litter 6 1.0 9 1.0 9 1.0
Canopy leaves 3.5 3.5 3.5
Small stems 1.5 0.6 0.6 0.4 0.2 0.2
Small branches 11.9 1.2 11.8 2.7 7.6 3.4
Decorticating bark 0.3 0.02 0.3 0.06 0.5 0.07
Rough bark 0.6 0.2 0.6 0.1 1.3 0.3
CWD 1.4 0.6 1.8 0.7 0.2 0.2
Dead standing trees 3.8 0.9 9 1.7 17.6 5.2
Total biomass2 combusted2 29 4.5 36.6 6.7 39.9 10.4
Total carbon stock3 433 35 475 91 564 88
Proportion combusted4 0.063 0.072 0.066
High-severity fire
Litter 6 1.0 9 1.0 9 1.0
Canopy leaves 7 7 7
Canopy twigs 7 7 7
Small stems 2.2 0.5 0.8 0.3 0.3 0.2
Small branches 14 3.0 15 4.0 9 2.0
Decorticating bark 0.3 0.05 0.4 0.1 0.5 0.1
Rough bark 0.8 0.1 0.7 0.2 2.9 0.4
CWD 2.4 1.7 1.7 0.5 0.4 0.3
Dead standing trees 7 1.9 14.8 1.2 21.7 6.2
Total biomass2 combusted2 46.7 8.3 56.4 7.9 57.8 10.2
Total carbon stock3 28 46 459 102 589 63
Proportion combusted4 0.140 0.109 0.089
1Mass of carbon (mean 6standard error, n = 6 sites).2Total biomass combusted is the sum of all components combusted.3Total carbon stock (above- and below-ground) pre-fire is current carbon stock before the fire.4Proportion combusted is the total biomass combusted divided by the pre-fire carbon stock.doi:10.1371/journal.pone.0107126.t004
Carbon Accounting of Wildfires
PLOS ONE | www.plosone.org 9 September 2014 | Volume 9 | Issue 9 | e107126

over time as a result of fire was estimated to be 20% from the
scenario of a single high-severity fire in old growth forest where
there was no trend in total biomass due to changes in forest age
(Figure 7a).
The carbon stock dynamics in the forests of initially different
ages reflect the differences in the total biomass stock, its
distribution among living and dead trees and CWD, the
proportion combusted, and the proportions remaining in each of
the components after the fire. The old growth forest had the
largest increase in total biomass with the combined regeneration
plus remaining dead trees, but subsequently the largest decline in
total biomass as the dead trees collapsed and decomposed
(Figure 7b). In the regrowth forests from 1939 and 1983, there
was less dead biomass after the fire and the regeneration resulted
in increasing total biomass carbon stock over most of the century
following the fire (Figure 7c and d).
Under a regime of repeated fires on a 112-year return time,
trends occurred in the total biomass carbon stock because forest age
changed from that of the initial forest. The old growth forest
decreased in carbon stock because of the more frequent disturbance,
whereas the 1983 and 1939 regrowth forests increased in carbon
stock because they remained undisturbed for a longer period than at
their initial age. These scenarios of carbon stock dynamics represent
an average forest stand of a given initial age subject to the average
wildfire regime. A range of forest age classes occur across the
landscape, including forests much older than 112 years. Forests that
remain undisturbed for several hundred years have the capacity to
continue accumulating carbon stocks.
Spatial estimation of carbon stocks post-2009 wildfireThe carbon stock loss post-2009 fire was estimated spatially
from the distribution of biomass carbon density in the unburnt
montane ash forest and the proportion of biomass combusted in
low- and high-severity fire for each forest age category (Figure 8).
The total carbon stock in the montane ash forest region (2,326
km2) was 112.8 TgC pre-2009 and an estimated 3.9 TgC was
emitted from biomass combustion during the 2009 wildfire (burnt
area of 768 km2 or 33% of the area of montane ash forest). The
carbon emitted represented 8.5% of the total biomass carbon stock
in the area of montane ash forest that was burnt.
Discussion
Although the total amount of carbon stock loss across the
landscape burnt during the wildfire was large as an annual flow in
the national inventory, we found that the proportion of total
ecosystem carbon stock combusted was relatively small, both at site
and landscape scales. The major impact of wildfire was the
redistribution of carbon among biomass components, from living to
dead biomass and CWD, and their longer-term rates of change due
Figure 6. Distribution of carbon stocks among components in relation to stand age and fire severity. Distribution is shown as theproportion of carbon in each biomass component, including living vegetation, dead standing trees, litter and coarse woody debris.doi:10.1371/journal.pone.0107126.g006
Carbon Accounting of Wildfires
PLOS ONE | www.plosone.org 10 September 2014 | Volume 9 | Issue 9 | e107126

to decomposition and regeneration. Assessing the carbon stock loss
by combustion in relation to the total stock, rather than fuel load,
meant that changes in stock could be tracked over time and
compared between different human activities and disturbance types.
Amount and proportion of forest ecosystem carbonstock combustedWe found that the proportion of total ecosystem biomass carbon
stock combusted during a wildfire in the montane ash forest was
Figure 7. Simulated carbon stock change in biomass components of forests of different ages after high-severity wildfire. Initial fireoccurred in year 1 and the change over time in each biomass component, plus the total biomass, is simulated; (a) old growth forest initially that isburnt in year 1 and recovery is simulated over 250 years assuming no other disturbance; (b) old growth forest initially that is burnt in years 1 and 113,according to the average fire frequency, and recovery simulated over two fire cycles; (c) 1939 regrowth forest initially that is simulated over two firecycles; (d) 1983 regrowth forest initially that is simulated over two fire cycles.doi:10.1371/journal.pone.0107126.g007
Carbon Accounting of Wildfires
PLOS ONE | www.plosone.org 11 September 2014 | Volume 9 | Issue 9 | e107126

6–14% at the site scale depending on fire severity and forest age
(27 years to old growth), with an average of 8.5% across the
landscape that was burnt. This is a relatively small proportion
compared with impacts of human disturbance events, such as
logging that removes biomass off-site [46,83,84]. Our results are
similar to studies in other forest ecosystems (boreal, temperate
mixed conifer, savannah woodlands, and other temperate wet
sclerophyll) that estimated the relationship between carbon stock
loss with total stock, but are lower than estimates of proportion of
biomass combusted related to fine and coarse fuel loads (data and
references in Table S1).
The estimated loss of only a small proportion of ecosystem
carbon stock combusted in a fire concords with simulation results
of net losses of carbon by 4 to 8% over 180 years under a fire
regime scenario of increased frequency and intensity in south-east
Australia [85]. Under this scenario, the loss was due to increased
mortality leading to a younger age distribution of trees. Similarly,
a sensitivity analysis of the carbon balance model for Canadian
forests showed that a three-fold increase in area burned decreased
the total forest carbon stock by 6% over 100 years [86]. These
predicted losses of carbon stocks are relatively small over a century
or two compared with the impact of many human activities.
Differences in the proportion of fine fuel combusted in different
ecosystems are insignificant in terms of the total ecosystem carbon
stock, representing 0.5 to 1% or 0.5 to 3 tC ha21. The proportion
of coarse fuel combusted varies greatly depending on the size of
material, which is influenced not only by forest age but also by
disturbance history. Although proportions of biomass combusted
were lower in montane ash forest than in other forest types, the
amounts combusted in these fuel size classes were greater (Table
S1). Amounts of carbon emitted during combustion in different
ecosystems depend on vegetation type, past disturbances resulting
in dead biomass, and fire weather conditions [87].
We conclude from our methodology that estimating carbon
stock loss as a proportion of the total ecosystem carbon stock
(based on tracking each biomass component) is a useful metric to
compare with other impacts on ecosystem carbon stocks and other
sectors of the national GHG inventory. This metric is thus more
appropriate for national accounts than the current default
reporting of emissions as the product of a combustion factor and
fuel load in the IPCC guidelines and Australian national inventory
report [6,15,82,88,89]. In our method, all biomass components
are assessed without making assumptions about which components
constitute fuel.
Our values of carbon stock loss in a wildfire may be small
overestimates because some of the biomass combusted is not
volatilised and therefore not emitted to the atmosphere. Under
conditions of reduced oxygen, partial combustion forms char that
Figure 8. Spatially modelled change in carbon density (tC ha21) across the montane ash forest region. Change in carbon stock wascalculated as the difference between pre- and post-2009 wildfire, including total biomass of living and dead trees, above- and below-ground, shrubs,litter and coarse woody debris.doi:10.1371/journal.pone.0107126.g008
Carbon Accounting of Wildfires
PLOS ONE | www.plosone.org 12 September 2014 | Volume 9 | Issue 9 | e107126

remains on the ground, or particulate carbon that is transported in
smoke but settles to the ground elsewhere. The proportion of char
produced in wildfires has been estimated to be 1–10% of the
biomass combusted [90]. Both these forms of carbon are highly
resistant to decay and form a long-term stable component of soil
carbon stocks [90].
Changes in forest biomass carbon dynamicsThe major impact of wildfire in the montane ash forest was the
redistribution of carbon among biomass components, from living
to dead, and subsequent long-term stock losses from decomposi-
tion and gains by regeneration. The relative rates of these
processes and subsequent mean residence times of the biomass
components determine the long-term dynamics of carbon stock in
the ecosystem. These long-term dynamics resulted in changes of
up to 20% about the mean stock, whereas direct losses from
combustion represented 6–14% of the total biomass stock.
Mean residence time of the biomass components combusted is
critical for determining the impact of wildfire on longer-term
carbon dynamics. More than half the stock losses from combustion
were derived from biomass components with short lifetimes; in the
canopy, bark, litter layer and shrubs. These components are
described as fine fuel, and this amount remains reasonably
constant after about 10 years post-fire in a range of forest types
[91]. For example, fine litter in montane ash forest has a mean
residence time of 1–4 years [50,70], and 85–95% of the litter mass
has accumulated within a decade after fire [91]. Recovery of the
carbon stock within a decade in the montane ash forest is within
the range of up to 10–20 years for recovery of rates of carbon
uptake estimated from eddy covariance measurements of net
ecosystem carbon exchange at chronosequence sites across a range
of forest types in North America [92].
The components combusted with longer mean residence times,
such as CWD and large hollow trees, have variable stocks and
proportions combusted depending on forest type, conditions for
decomposition, logging and fire history. This coarse material
contributed 18 to 45% of the carbon combusted in the montane
ash forest, with an increasing proportion in older stands. The
residence time of this coarse material is in the order of decades to
centuries [67,93].
Rates of carbon accumulation in regenerating stands are
difficult to estimate due to limited site data of known forest age,
particularly in older aged stands. We compared carbon uptake in
regenerated living biomass at a given age estimated from our site
data, for example, 3.8 tC ha21 yr21 at 80 years, with the net
ecosystem exchange (NEE) estimated from eddy covariance
measurements. An average NEE over 10 years of measurements
was 5.8 tC ha21 yr21 and the maximum was 9.3 tC ha21 yr21 in
an 80 year old stand of Eucalyptus delegatensis or Alpine Ash [94].
This average NEE is comparable to the 6 tC ha21 yr21 in a
temperate forest in Oregon, which is the highest value reported for
forests of a similar age in North America [92]. Carbon
accumulated in living biomass does not include uptake of carbon
that is then transferred to dead biomass pools and soil organic
matter.
Our simulated carbon stocks for each biomass component were
within the range observed in the field. Actual magnitudes of stocks
at different ages were difficult to verify because of the confounding
disturbances of wildfire and salvage logging that have occurred in
these forests. Among our sites, there were no younger stands that
had been burnt but not logged and such stands would be rare in
the landscape. Our simulated turnover times appeared to be
slower than in some other ecosystems, such as boreal forests [95].
However, observations of large logs remaining after 60–90 years in
the montane ash forest [50,96] suggested that even slower rates
may be characteristic of large biomass components. Uncertainty
about the magnitude of the changes and their timing in the long-
term dynamics of carbon occurred mainly because of limited
information about rates of tree fall and decomposition.
Inclusion of wildfire in national carbon accountsChanges in carbon stocks due to natural disturbances, such as
wildfire, must be included in national carbon accounts. The
current UNFCCC carbon accounting guidelines for forest
management (Article 3 paragraph 4 clause 33) address carbon
stock change due to natural disturbances under the ‘force majeure’provision (Decision 2/CMP.7, CoP 17 Durban Climate Confer-
ence) [97]. Natural disturbances, such as wildfire, outbreaks of
pests and diseases, extreme weather events and geological
disturbances, are considered as extraordinary events that are
outside human control. An average net stock change due to
natural disturbances is calculated as a background level within the
forest management reference level. These accounts for forest
management and natural disturbances must be included in the
2015 inventory reports from signatory nations to the Kyoto
Protocol (38 of the 43 Annex 1 nations), which are assessed for
compliance against emissions reduction targets [98].
The current negotiations under the Durban Platform for
Enhanced Action [23] represent a critical time to provide
quantitative data on carbon stock changes due to disturbance
and to interpret the implications of the inventory for maximising
outcomes of mitigation activities. Nations can develop and choose
methodologies, within the UNFCCC guidelines, that are appro-
priate for their accounts [99]. The default method is calculated as
an average of net stock change from natural disturbances from
1990 to 2009, plus a margin of twice the standard deviation.
Annual stock changes that are above this background level are
excluded from the accounts. When this exclusion occurs, the area
of land affected is removed from the inventory so that subsequent
uptake by the regenerating vegetation is not counted, until pre-
disturbance carbon stocks are restored [99]. The UNFCCC
guidelines provide some flexibility, but the methodology should
adhere to the objectives of the force majeure provision of
minimising annual variability in the reported net stock changes
due to natural disturbance events. The rationale is that this
variability should not negate reductions in emissions due to human
mitigation activities over the timeframe of the reporting [97].
Our results about the magnitude and timeframes of carbon
stock changes due to wildfires suggest that carbon accounts need to
be comprehensive and include all stocks and flows. Such accounts
enable differentiation of stock changes due to natural disturbances
and human activities. There are four reasons why constructing
carbon accounts which differentiate carbon stock changes are
beneficial.
First, our results show that in terms of national annual net
change in carbon stocks, the magnitude of carbon stock loss due to
combustion in a wildfire is sufficient to mask reduced emissions
due to mitigation activities. Our estimated carbon stock loss was
3.9 TgC from a single (albeit large) fire in 2009 within the
montane ash forest. The annual average for all fires in Australia is
estimated to be 8.7 TgC yr21 [100]. These single and average
wildfire emissions represent about 27% and 59%, respectively, of
Australia’s annual emissions reduction target of 14.7 TgC yr21
[100]. Similar magnitudes of emissions from individual wildfires
have been quantified elsewhere, for example 2.9 TgC from the
2003 Californian fires [101]. Hence, differentiation of carbon
stock changes due to natural disturbances and human activities is
important when national GHG inventory reports are used for
Carbon Accounting of Wildfires
PLOS ONE | www.plosone.org 13 September 2014 | Volume 9 | Issue 9 | e107126
assessing progress in meeting emission reduction targets over short
time periods.
Second, we demonstrated that the changes in carbon stocks in
response to a disturbance event occur over the following decades.
Hence, derivation of a background level of net carbon stocks over
a two decade period (1990–2009) is not adequate to account for
the variations in carbon dynamics within a disturbed area.
However, the carbon stock at the landscape scale represents the
sum of forest stands that have been burnt at different times and
intensities, thus producing a mosaic of stand age classes, amounts
of debris, and stages of recovery from disturbance. Under a stable
disturbance regime, the carbon stock at the landscape scale
remains stable when accounted for over sufficiently long time
periods. Hence, carbon stock losses from combustion of biomass
components do not increase the accumulated atmospheric CO2
concentration under a stable fire regime. Carbon stock dynamics
may alter at the landscape level if fire regimes change due to
climate change, or due to the effects of growth from a forest age
class distribution affected by historical activities [9,85,86,
102,103,104].
Third, the increases and decreases in carbon stock post-fire
resulting from differential rates of regeneration, mortality and
decomposition mean that excluding burnt areas from the national
inventory until carbon stocks are restored to pre-fire levels, is not
an adequate method for excluding the effect of natural
disturbances on net changes in carbon stocks. In fact, the increase
in carbon stocks for some decades post-fire would produce
artificial credits, but later decreases due to decomposition would
produce artificial debits in the national inventory, which are not
related to human activities. Additionally, the high levels of
uncertainty in these long-term dynamics could produce errors in
the national inventory.
Fourth, an averaging period of net stock changes from a
disturbance regime over two decades, or within the time period of
adequate records, does not encompass the temporal scale of
natural variability in wildfire regimes in many temperate forest
ecosystems [105], such as montane ash forest with a return interval
of many decades [30,31]. The frequency and intensity of wildfire is
influenced by interactions of large-scale features of atmospheric
circulation, such as the El Nina-Southern Oscillation, Indian
Ocean Dipole, Southern Annular Mode and the Sub-Tropical
Ridge, which drive multi-decadal climate variability [13,106,107].
If a background level is to be used in an accounting system, then
the preferred method would be to re-calculate the actual incidence
of disturbance events at the end of the reporting period
[108,109,110].
Methodological and data uncertaintiesOur results suggest that data from ecological monitoring sites
can be used a posteriori to estimate carbon stock losses from
wildfire, when supplemented with additional field data and
ancillary data sources. Our approach used the basic framework
of estimating carbon stock changes due to wildfire from the area
burned, fuel load and combustion efficiency [87,90] However, our
sampling also incorporated spatial variability in fire severity and
initial carbon stocks at the landscape level. This provided a more
representative range in carbon stock losses at the regional scale.
Covering this range is important even though a balanced
experimental design is difficult to obtain in studies of stochastic
disturbance events where field sites may not be comparable
because of uncertainties in disturbance histories and stand ages.
Previous studies in Australia have used either experimental fires
imposed on a planned design of sites and pre-fire measurements,
where the fires were either lower severity than wildfire or
regeneration burns of logging slash [89,111,112,113], or post-fire
comparisons of burnt and unburnt sites albeit with limited
replicate sites [41,114].
Improved assessment of fire severity as a continuous variable at
the landscape scale is important to allow more accurate estimates
of carbon stock changes spatially [115]. New techniques in remote
sensing are providing quantitative information about fire radiative
power that can be related to factors that control fire severity
[116,117,118]. However, adequate field calibration of the
remotely sensed metric currently limits their application [116].
The results of up-scaling the site data to estimate carbon stocks
and stock losses across our study region revealed that the effect of
disturbance history on tree age structure and CWD was the major
source of uncertainty in spatial estimates of biomass carbon stocks.
Other studies have drawn similar conclusions that the determina-
tion of forest stand age is the main factor contributing to
uncertainty in assessment of regional carbon stocks [5].
Our results suggest that current national accounting that uses
default values (Tier 2 methodology) for fuel combustion efficiency
and fuel load can be improved by using site data from different
ecosystems. Data from existing state forest inventories need to be
augmented by comprehensive sampling of forest age structure,
including old growth forests, and all components of the carbon
stock, including dead wood. The methods used here are generic
and would constitute Tier 3 methodology that is appropriate for
national and project-based accounting. The sampling methods
were non-destructive and feasible to apply to a large number of
sites.
Conclusions
Carbon stocks in forest ecosystems change in response to
wildfire in the short-term by combustion and in the long-term by
redistribution among biomass components and their subsequent
differential rates of decomposition and regeneration. It is
important that carbon accounts include these processes because
all stock changes, activities and land areas contribute to
quantifying the global carbon cycle. However, the timeframes of
the ecological processes that determine carbon stock changes are
longer than the time periods for reporting of national inventories
for compliance with emissions reductions targets. This problem of
incongruous timeframes means that reporting against targets
should be based on net changes in carbon stocks from human
activities to incentivise mitigation activities. If the carbon accounts
differentiate stock changes between the sources from natural and
human-induced disturbances, then the net stock change from
human activities can be extracted from the accounts for use in
reporting. This distinction is currently made between the
comprehensive UNFCCC accounts and the reports against targets
for the Kyoto Protocol, except that the guidelines for the Protocol
include net stock changes from natural disturbances that can be
discounted above an averaged background level. However, our
results indicate that the spatial and temporal variability in carbon
dynamics is too high and the uncertainty of estimates too great to
enable a realistic averaged background level that would prevent
distortions of the inventory by stock changes that were outside
human control.
Supporting Information
Table S1 Biomass combusted in wildfire from differentforest ecosystems.
(DOCX)
Carbon Accounting of Wildfires
PLOS ONE | www.plosone.org 14 September 2014 | Volume 9 | Issue 9 | e107126

Acknowledgments
We wish to thank Clive Hilliker for expert assistance with the figures and
Steve Meacher for assistance with field measurements of shrub biomass.
Helpful discussions about fire ecology with Malcolm Gill, Geoff Cary and
Michael Doherty are gratefully acknowledged. The inventory plot data and
spatial data for the Central Highlands were obtained from the Victorian
Department of Sustainability and Environment under data access licence
agreement DALA_2009_082. We thank anonymous reviewers for
comments that have improved the manuscript.
Author Contributions
Conceived and designed the experiments: HK DL BM. Performed the
experiments: HK DB LM SO. Analyzed the data: HK LC. Contributed to
the writing of the manuscript: HK DL BM. Developed the conceptual
framework and global context: HK DL BM TKN.
References
1. United Nations Framework Convention on Climate Change 1992. Available:
http://unfccc.int/resource/docs/convkp/conveng.pdf. Accessed 2013 Oct 9.
2. Cubasch U, Wuebbles D, Chen D, Facchini MC, Frame D, et al. (2013)
Introduction. In: Stocker TF, Qin D, Plattner G-K, Tignor M, Allen SK, et al.,
editors. Climate Change 2013: The Physical Science Basis. Contribution of
Working Group I to the Fifth Assessment Report of the Intergovernmental
Panel on Climate Change. Cambridge University Press, Cambridge, United
Kingdom and New York, NY, USA. pp. 119–158.
3. Watson CE, Fishman J, Reichle HG (1990) The significance of biomass
burning as a source of carbon monoxide and ozone in the southern hemisphere
tropics: a satellite analysis. J Geophys Res 95: 16444–16450.
4. Cahoon DR, Stocks BJ, Levine JS, Cofer WR, O’Neill KP (1992) Seasonal
distribution of African savanna fires. Nature 359: 812–815.
5. Andreae MO, Merlet P (2001) Emission of trace gases and aerosols from
biomass burning. Global Biogeochem Cycles 15(4): 955–966.
6. van der Werf GR, Randerson JT, Giglio L, Collatz GJ, Kasibhatla PS, et al.
(2006) Interannual variability in global biomass burning emissions from 1997 to
2004. Atmosph Chem Phys 6: 3423–3441.
7. Kasischke ES, Bruhwiler LP (2003) Emissions of carbon dioxide, carbon
monoxide, and methane from boreal forest fires in 1998. J Geophys Res 108:
D1,8146.
8. Le Quere C, Raupach MR, Canadell JG, Marland G, Bopp L, et al. (2009)
Trends in the sources and sinks of carbon dioxide. Nature Geosci doi: 10.1038/
ngeo689.
9. Stocks BJ, Mason JA, Todd JB, Bosch EM, Wotton BM, et al. (2003) Large
forest fires in Canada, 1959–1997. J Geophys Res 108:(D1), 8149.
10. Kurz WA, Stinson G, Rampley GJ, Dymond CC, Neilson ET (2008) Risk of
natural disturbances makes future contribution of Canada’s forests to the global
carbon cycle highly uncertain. Proc Natl Acad Sci USA 105: 15551–1555.
11. Gill AM, Stephens SL, Cary GJ (2013) The worldwide ‘‘wildfire’’ problem.
Ecol Appl 23(2): 438–454.
12. Hurst DF, Griffith DWT, Cook GD (1994) Trace gas emissions from biomass
burning in tropical Australian savannas. J Geophys Res 99(D8): 16,441–6,456.
13. van der Werf GR, Randerson JT, Collatz GJ (2004) Continental-scale
partitioning of fire emissions during the 1997 to 2001 El Nino/La Nina
period. Science 303: 73–76.
14. Gill AM and Allan G (2008) Large fires, fire effects and the fire-regime concept.
International J Wildland Fire 17: 688–695.
15. de Groot WJ, Pritchard JM, Lynham TJ (2009) Forest floor fuel consumption
and carbon emissions in Canadian boreal forest fires. Can J For Res 39: 367–
382.
16. Hollis JJ, Matthews S, Ottmar RD, Prichard SJ, Slijepcevic A, et al. (2010)
Testing woody fuel consumption models for application in Australian southern
eucalypt forest fires. For Ecol Manag 260: 948–964.
17. Scholes RJ, Kendall J, Justice CO (1996a) The quantity of biomass burned in
southern Africa. J Geophys Res 101, D19: 23667–23676.
18. Scholes RJ, Ward DE, Justice CO (1996b) Emissions of trace gases and aerosol
particles due to vegetation burning in southern hemisphere Africa. J Geophys
Res 101: D19: 23677–23682.
19. Horowitz LW, Walters S, Mauzerall DL, Emmons LK, Rasch PJ, et al. (2003)
A global simulation of tropospheric ozone and related tracers: Description and
evaluation of MOZART, version 2. J Geophys Res 108: D24,4784.
20. Shirai T, Blake DR, Meinardi S, Rowland FS, Russell-Smith J, et al. (2003)
Emission estimates of selected volatile organic compounds from tropical
savannah burning in northern Australia. J Geophys Res 108: D3, 8406.
21. Hoelzemann J, Schulz MG, Brasseur GP, Granier C (2004) Global wildland
fire emission model (GWEM): Evaluating the use of global area burnt satellite
data. J Geophys Res 109: D14S04.
22. Ito A, Penner JE (2004) Global estimates of biomass burning emissions based
on satellite imagery for the year 2000. J Geophys Res Atm 109: D14S05.
23. UNFCCC (2012) Ad Hoc Working Group on the Durban Platform for
Enhanced Action. Available: http://unfccc.int/bodies/body/6645.php Ac-
cessed 8 August 2013.
24. Pan Y, Birdsey RA, Fang J, Houghton R, Kauppi PE, et al. (2011) A large and
persistent carbon sink in the world’s forests, 1990–2007. Science 333: 988–993.
25. Keith H, Mackey BG, Lindenmayer DB (2009) Re-evaluation of forest biomass
carbon stocks and lessons from the world’s most carbon dense forests. Proc Natl
Acad Sci USA 106(28): 11635–11640.
26. Mackey BG, Lindenmayer DB, Gill AM, McCarthy AM, Lindesay JA (2002)
Wildfire, Fire and Future Climate: A forest ecosystem analysis. CSIRO Publ.,
Melbourne.
27. Lindenmayer DB (2009) Forest Pattern and Ecological Processes: A Synthesis
of 25 Years of Research. CSIRO Publishing, Collingwood, Australia.
28. Department of Sustainability and Environment (1996) Study of old growth
forest in Victoria’s Central Highlands. Available: http://www.dse.vic.gov.au/
forests/publications/research-reports/study-of-old-growth-forests. Accessed
2013 Aug 8.
29. McCarthy MA, Lindenmayer DB (1998) Multi-aged mountain ash forest,
wildlife conservation and timber harvesting. For Ecol Manag 104: 43–56.
30. McCarthy MA, Gill AM, Lindenmayer DB (1999) Fire regimes in mountain
ash forest: evidence from forest age structure, extinction models and wildlife
habitat. For Ecol Manag 124: 193–203.
31. McCarthy MA, Gill AM, Bradstock RA (2001) Theoretical fire interval
distributions. Int J Wildland Fire 10: 73–77.
32. Ashton DH (1975a) The root and shoot development of Eucalyptus regnans F.Muell. Aust J Bot 23: 867–887.
33. Flinn D, Squire R, Waring K (2007) Victoria. In: Raison RJ, Squire RO,
editors. Forest Management in Australia: Implications for Carbon Budgets.
National Carbon Accounting System Technical Report No. 32, Australian
Greenhouse Office, Canberra. Ch 3, 103–146.
34. Tng DYP, Williamson GJ, Jordan GJ, Bowman DMJS (2012) Giant eucalypts –
globally unique fire – adapted rainforest trees? New Phytol doi: 10.1111/
j.1469–8137.2012.04359.x
35. Simkin R, Baker PJ (2008) Disturbance history and stand dynamics in tall open
forest and riparian rainforest in the Central Highlands of Victoria. Austral Ecol
33: 747–760.
36. Turner PAM, Balmer J, Kirkpatrick JP (2009) Stand-replacing wildfires? The
incidence of multi-cohort and single-cohort Eucalyptus regnans and E. obliquaforests in southern Tasmania. For Ecol Manag 258: 366–373.
37. Banks JCG (1993) Tree ring analysis of two Mountain Ash trees from the Watts
and O’Shannassy catchments, Central Highlands, Victoria. Report to the
Central Highlands Old Growth Forest Project, Department of Conservation
and Natural Resources, Melbourne.
38. Vivian LM, Cary GJ, Bradstock RA, Gill AM (2008) Influence of fire severity
on the regeneration, recruitment and distribution of eucalypts in the Cotter
River Catchment ACT. Austral Ecol 33: 55–67.
39. Lindenmayer DB, Cunningham RB, Donnelly CF, Franklin JF (2000)
Structural features of old growth Australian montane ash forests. For Ecol
Manag 134: 189–204.
40. Victorian Bushfires Royal Commission 2009, Australia. Available: http://
www.royalcommission.vic.gov.au/Documents/HR-Chapters/. Accessed 2013
Aug 8.
41. Cruz MG, Sullivan AL, Gould JS, Sims NC, Bannister AJ, et al. (2012)
Anatomy of a catastrophic wildfire: The Black Saturday Kilmore East fire in
Victoria, Australia. For Ecol Manag 284: 269–285.
42. Noble WS (1977) Ordeal by Fire: The Week a State Burned Up. Hawthorn
Press, Melbourne, Australia.
43. Ough K (2001) Regeneration of wet forest flora a decade after clear-felling or
wildfire – is there a difference? Aust J Bot 49: 645–664.
44. Lindenmayer DB, Ough K (2006) Salvage harvesting in the montane ash
forests of the Central Highlands and its potential impacts on biodiversity.
Conserv Biol 20: 1005–1015.
45. Lindenmayer DB, Burton PJ, Franklin JF (2008) Salvage Logging and its
Ecological Consequences. CSIRO Publishing, Collingwood, Australia.
46. Keith H, Lindenmayer DB, Mackey B, Blair D, Carter L, et al. (2014)
Managing temperate forests for carbon storage: impacts of logging versus forest
protection on carbon stocks. Ecosphere 5(6): 75 doi 10.1890
47. Jackson WD (1968) Fire, air, water and earth – an elemental ecology of
Tasmania. Proc Ecol Soc Aust 3: 9–16.
48. Lindenmayer DB, Hobbs RJ, Likens GE, Krebs CJ, Banks SC (2011) Newly
discovered landscape traps produce regime shifts in wet forests. Proc Natl Acad
Sci USA doi 10.1073
49. Taylor C, McCarthy MA, Lindenmayer DB (2014) Non-linear effects of stand
age on fire severity. Conserv Letters doi: 10.1111/conl.12122
50. Ashton DH (1975b) Studies in litter in Eucalyptus regnans forests. Aust J Bot23: 413–433.
Carbon Accounting of Wildfires
PLOS ONE | www.plosone.org 15 September 2014 | Volume 9 | Issue 9 | e107126

51. Sillett SC, van Pelt R, Koch GW, Ambrose AR, Carroll AL, et al. (2010)
Increasing wood production through old age in tall trees. For Ecol Manag 259:
976–994.
52. Illic J, Boland D, McDonald M, Downes G, Blakemore P (2000) Woody density
phase 1– state of knowledge. National Carbon Accounting System Technical
Report No. 18, Australian Greenhouse Office, Canberra.
53. Bootle KR (2005) Wood in Australia: types, properties and uses. McGraw-Hill,
Sydney.
54. Chafe SC (1985) The distribution and interrelationship of collapse, volumetric
shrinkage, moisture content and density in trees of Eucalyptus regnans F.
Muell. Wood Sci Tech 19: 329–345.
55. Mackensen J, Bauhus J (1999) The decay of coarse woody debris. National
Carbon Accounting System, Technical Report No. 6, Australian Greenhouse
Office, Canberra.
56. Gifford RM (2000) Carbon contents of above-ground tissues of forest and
woodland trees. National Carbon Accounting System Technical Report
No. 22, Australian Greenhouse Office, Canberra.
57. Keith H, Leuning R, Jacobsen KL, Cleugh HA, van Gorsel E, et al. (2009a)
Multiple measurements constrain estimates of net carbon exchange by a
Eucalyptus forest. Agric For Meteorol 149: 535–558.
58. Mackowski CW (1987) Wildlife hollows and timber management in Blackbutt
forest. Masters’ Thesis, University of New England, Armidale, NSW.
59. Gibbons P, Lindenmayer DB (2002) Tree hollows and wildlife conservation in
Australia. CSIRO Publications, Collingwood.
60. Department of Sustainability and Environment (2007) Victoria’s Statewide
Forest Resource Inventory – Central, Central Gippsland and Dandenong
Forest Management Areas, Natural Resources Report Series 07–1, Victorian
Government.
61. Feller MC (1980) Biomass and nutrient distribution in two eucalypt forest
ecosystems. Aust J Ecol 5: 309–333.
62. Keith H, Barrett D, Keenan R (2000) Review of allometric relationships for
estimating woody biomass for New South Wales, the Australian Capital
Territory, Victoria, Tasmania and South Australia. National Carbon
Accounting System Technical Report No. 5b, Australian Greenhouse Office,
Canberra.
63. Snowdon P, Eamus D, Gibbons P, Khanna P, Keith H, et al. (2000) Synthesis
of allometrics, review of root biomass and design of future woody biomass
sampling strategies. National Carbon Accounting System Technical report
No. 17, Australian Greenhouse Office, Canberra.
64. Van Wagner CE (1968) The line intersect method in forest fuel sampling. For
Sci 14: 20–26.
65. McKenzie N, Ryan P, Fogarty P, Wood J (2001) Sampling, measurement and
analytical protocols for carbon estimation in soil, litter ad coarse woody debris.
National Carbon Accounting System Technical Report No. 14, Australian
Greenhouse Office, Canberra.
66. Lindenmayer DB, Blair D, McBurney L, Banks S (2010) Forest Phoenix: How
a Great Forest Recovers after Wildfire. CSIRO Publishing, Melbourne. 128
pp.
67. Lindenmayer DB, Blanchard W, McBurney L, Blair D, Banks S, et al. (2012)
Interacting factors driving a major loss of large trees with cavities in a forest
ecosystem. PLoS 1: 7(10), e41864.
68. Andrew MH, Noble IR, Lange RT (1979) A non-destructive method for
estimating the weight of forage on shrubs. Aust Range J 1(3): 225–231.
69. Ashton D H (1975a) Studies of litter in Eucalyptus regnans forests. Aust J Bot23: 413–433.
70. Polglase PJ, Attiwill PM (1992) Nitrogen and phosphorus cycling in relation to
stand age of Eucalyptus regnans F. Muell. I. Return from plant to soil in
litterfall. Pl Soil 142: 157–166.
71. Jacobs M (1955) Growth Habits of the Eucalypts. Forestry and Timber Bureau,
Canberra.
72. Keith H (1991) Effects of fire and fertilization on nitrogen cycling and tree
growth in a subalpine eucalypt forest. PhD Thesis, Australian National
University, Canberra. 369 pp.
73. Keith H, Mackey BG, Berry S, Lindenmayer D, Gibbons P (2010) Estimating
carbon carrying capacity in natural forest ecosystems across heterogeneous
landscapes: addressing sources of error. Glob Change Biol 16: 2971–2989.
74. Mackey B, Berry S, Brown T (2008) Reconciling approaches to biogeographic
regionalization: a systematic and generic framework examined with a case
study of the Australian continent. J Biogeog 35: 213–229.
75. Berry S, Mackey B, Brown T (2007) Potential applications of remotely sensed
vegetation greenness to habitat analysis and the conservation of dispersive
fauna. Pac Conserv Biol 13(2): 120–127.
76. Ashton DH (1976) The development of even-aged stand of Eucalyptus regnansF. Muell. in Central Victoria. Aust J Bot 24: 397–414.
77. Watson FGR, Vertessy RA (1996) Estimating leaf area index from stem
diameter measurements in Mountain Ash forest. Cooperative Research Centre
for Catchment Hydrology, Report 96/7.
78. Attiwill PM (1994) Ecological disturbance and the conservative management of
eucalypt forests in Australia. For Ecol Manag 63: 301–346.
79. Wood SW, Hua Q, Allen KJ, Bowman DMJS (2010) Age and growth of a fire
prone Tasmanian temperate old-growth forest stand dominated by Eucalyptusregnans, the world’s tallest angiosperm. For Ecol Manag 260, 438–447.
80. Grove SJ, Stamm L, Barry C (2009) Log decomposition rates in TasmanianEucalyptus obliqua determined using an indirect chronosequence approach.
For Ecol Manag 258: 389–397.
81. IPCC (2006) Guidelines for National Greenhouse Gas Inventories. Eggleston S,
Buendia L, Miwa K, Ngara T, Tanabe K, editors. Institute for GlobalEnvironmental Strategies, Hayama, Japan. Available: http://www.ipcc-nggip.
iges.or.jp/public/2006gl/index.html. Accessed 2013 Oct 30.
82. DCCEE (2012) Department of Climate Change and Energy Efficiency,Australian National Greenhouse Gas Accounts, National Inventory Report
2010, Australian Government Submission to the United National FrameworkConvention on Climate Change, April 2012.
83. Harmon ME, Ferrell WK, Franklin JF (1990) Effects on carbon storage of
conversion of old growth forests to young forests. Science 247, 699–702.
84. Gough CM, Vogel CS, Harrold KH, George K, Curtis PS (2007) The legacy ofharvest and fire on ecosystem carbon storage in a north temperate forest. Glob
Change Biol 13, 1935–1949.
85. King KJ, deLigt RM, Cary GJ (2011) Fire and carbon dynamics under climatechange in south-eastern Australia: insights from FullCAM and FIRESCAPE
modelling. Int J Wildland Fire 20: 563–577.
86. Kurz WA, Apps MJ (1999) A 70-year retrospective analysis of carbon fluxes inthe Canadian forest sector. Ecol Appl 9(2): 526–547.
87. French NHF, de Groot WJ, Jenkins LK, Rogers BM, Alvarado E, et al. (2011)
Model comparisons for estimating carbon emissions from North American
wildland fire. J Geophys Res 116: G00K05.
88. IPCC (2003) Good practice guidance for land use, land use change and
forestry. Penman J et al., editors. National Greenhouse Gas Inventories
Programme, Institute for Global Environmental Strategies, Kanagawa, Japan.Available: http://www.ipcc-nggip.iges.or.jp/public/gpglulucf/gpglulucf-files.
Accessed 2013 Oct 30.
89. Gould JS, Cheney NP, Hutchings PT, Cheney S (1996) Final Report onPrediction of Bushfire Spread for Australian Co-ordination Committee
International Decade of Natural disaster Reduction. Project 4/95. CSIROForestry and Forest Products.
90. Seiler W, Crutzen PJ (1980) Estimates of gross and net fluxes of carbon between
the biosphere and the atmosphere from biomass burning. Clim Change 2: 207–247.
91. Gould JS, Cheney NP (2007) Fire management in Australian forests. In: Forest
management in Australia: implications for carbon budgets. Raison RJ and
Squire RO, editors. 341–371. National Carbon Accounting System TechnicalReport No.32.
92. Amiro BD, Barr AG, Barr JG, Black TA, Bracho R, et al. (2010) Ecosystem
carbon dioxide fluxes after disturbance in forests of North America. J GeophysRes 115: G00K02.
93. Lindenmayer DB, Wood JT (2010) Long-term patterns in the decay, collapse
and abundance of trees with hollows in the mountain ash (Eucalyptus regnans)forests of Victoria, southeastern Australia. Can J For Res 40: 48–54.
94. van Gorsel E, Berni JAJ, Briggs P, Cabello-Leblic A, Chasmer L, et al. (2013)
Primary and secondary effects of climate variability on net ecosystem carbonexchange in an evergreen Eucalyptus forest. Agric For Meteorol 182–183: 248–
256.
95. Manies KL, Harden JW, Bond-Lamberty BP, O’Neill KP, (2005) Woodydebris along an upland chronosequence in boreal Manitoba and its impact on
long-term carbon storage. Can J For Res 35: 472–482.
96. Lindenmayer DB, Incoll RD, Cunningham RB, Donnelly CF (1999) Attributesof logs on the floor of Australian Mountain Ash (Eucalyptus regnans) forests ofdifferent ages. For Ecol Manag 123: 195–203.
97. UNFCCC (2011) 17th Conference of the Parties to the UNFCCC in Durban,
CMP.7 Land Use, Land Use Change and Forestry. Available: http://unfccc.int/files/meetings/durban_nov_2011/decisions/application/pdf/awgkp_
lulucf.pdf. Accessed 2013 Aug 8.
98. UNFCCC (2013b) National Inventory Submissions. Available: http://unfccc.int/national_reports/annex_i_ghg_inventories/national_inventories_
submissions/. Accessed 2013 Aug 8.
99. UNFCCC (2013a) Revised Supplementary Methods and Good Practiceguidance arising from the Kyoto Protocol. Good Practice Guidance. Available:
http://www.ipcc-nggip.iges.or.jp/home/docs/kpsg/KP_Supplement_precopyedit.pdf. Accessed 2013 Aug 8.
100. Australian Treasury (2011) Strong growth, low pollution: modelling a carbon
price. Australian Government, Canberra.
101. Muhle J, Lueker TJ, Su Y, Miller BR, Prather KA, et al. (2007) Trace gas andparticulate emissions from the 2003 southern Californian wildfires. J Geophys
Res 112,D03307.
102. Williams A, Karoly D, Tapper N (2001) The sensitivity of Australian firedanger to climate change. Clim Change 49: 171–191.
103. Pitman A, Narisma G, McAneney J (2007) The impact of climate change on
the risk of forest and grassland fires in Australia. Clim Change 84: 383–401.
104. Clarke H, Smith P, Pitman A (2011) Regional signatures of future fire weatherover eastern Australia from global climate models. Int J Wildland Fire 20: 550–
562.
105. Macintosh A (2012a) Are forest management reference levels incompatible withrobust climate outcomes? A case study on Australia. Carbon Manag 2(6): 691–
707.
106. Esplin B, Gill AM, Enright N (2003) Report of the Inquiry into the 2002–2003
Victorian Bushfires. Office of the Emergency Services Commissioner, State
Carbon Accounting of Wildfires
PLOS ONE | www.plosone.org 16 September 2014 | Volume 9 | Issue 9 | e107126

Government of Victoria. Available: http://www.oesc.vic.gov.au/home/
reviews+and+inquiries/report+of+the+inquiry+into+the+2002-2003+Victorian+bushfires. Accessed 2013 Oct 15.
107. Murphy B, Timbal B (2008) A review of recent climate variability and climate
change in southeastern Australia. Int J Clim 28: 859–879.108. Canadell J, Kirschbaum M, Kurz W, Sanz M, Schlamadinger B, et al. (2007)
Factoring out natural and indirect human effects on terrestrial carbon sourcesand sinks. Environ Sci Policy 10, 370–384.
109. Schlamadinger B, Johns T, Ciccarese L, Braun M, Sato A, et al. (2007) Options
for including land use in a climate agreement post-2012: improving the KyotoProtocol approach. Environ Sci Policy 10, 295–305.
110. Macintosh A (2011) Potential carbon credits from reducing native forestharvesting in Australia. ANU Centre for Climate Law and Policy, Working
Paper Series 2011/1.111. Marsden-Smedley JB, Slijepcevic A (2001) Fuel characteristics and low
intensity burning in Eucalyptus obliqua wet forest at the Warra LTER site.
Tasforests 13(2): 261–277.112. Slijepcevic A (2001) Loss of carbon during controlled regeneration burns in
Eucalyptus obliqua forest. Tasforests 13(2): 281–290.
113. Tolhurst KG, Anderson WR, Gould JS (2006) Woody fuel consumption
experiments in an undisturbed forest. In: Conference Proceedings of the V
International Conference on Forest Fire Research. Viegas DX, editor.
114. Hollis JJ, Anderson WR, McCaw WL, Cruz MG, Burrows ND, et al. (2011)
The effect of fireline intensity on woody fuel consumption in southern
Australian eucalypt forest fires. Aust For 74: 81–96.
115. Turetsky MR, Kane ES, Harden JW, Ottmar RD, Manies KL, et al. (2011)
Recent acceleration of biomass burning and carbon losses in Alaskan forests
and peatlands. Nature Geosciences 4: 27–31.
116. Campbell J, Donato D, Azuma D, Law B (2007) Pyrogenis carbon emissions
from a large wildfire in Oregon, United States. J Geophys Res 122: G04014.
117. Barrett K, Kasischke ES, McGuire AD, Turetsky MR, Kane ES (2010)
Modelling fire severity in black spruce stands in the Alaskan boreal forest using
spectral and non-spectral geospatial data. Remote Sens Environ 114: 1494–
1503.
118. Barrett K, Kasischke ES (2013) Controls on variation in MODIS fire radiative
power in Alaskan boreal forests: Implications for fire severity conditions.
Remote Sens Environ 130: 171–181.
Carbon Accounting of Wildfires
PLOS ONE | www.plosone.org 17 September 2014 | Volume 9 | Issue 9 | e107126