Accounting and Financial Management - … · I. Introduction to Financial Accounting slide 1...
146
© Prof. Dr. Frank Andreas Schittenhelm I. Introduction to Financial Accounting slide 1 Accounting and Financial Management Prof. Dr. Frank Andreas Schittenhelm I. Introduction to Financial Accounting
Transcript of Accounting and Financial Management - … · I. Introduction to Financial Accounting slide 1...
© Prof. Dr. Frank Andreas SchittenhelmI. Introduction to Financial Accounting slide 1
Accounting and Financial Management
Prof. Dr. Frank Andreas Schittenhelm
I. Introduction to Financial Accounting
© Prof. Dr. Frank Andreas SchittenhelmI. Introduction to Financial Accounting slide 2
Literature
Basic LiteratureAnthony/Hawkins/Merchant: Accounting, 11thed., McGraw-Hill
Additional LiteratureDyckman/Dukes/Davis: Intermediate Accounting, 4thed., McGraw-HillHorngren/Harrison/Bamber: Accounting, 5thed., Prentice HallHoyle/Schaefer/Doupnik: Advanced Accounting, 5thed., McGraw-HillPerks: Financial Accounting for Non-Specialists, McGraw-Hill
© Prof. Dr. Frank Andreas SchittenhelmI. Introduction to Financial Accounting slide 3
Table of Contents
I. Introduction to Financial Accounting1. Financial Statements
1. Balance Sheet2. Income Statement3. Double Entry System4. Cash Flow Statement
2. Specific Balance Sheet Items1. Inventory2. Fixed Assets3. Accruals
3. Financial Analysis1. Balance Sheet Analysis2. Income Statement Analysis3. Cash Flow Statement Analysis
4. Consolidated Financial Statement1. Business Combinations2. Consolidated Statements
© Prof. Dr. Frank Andreas SchittenhelmI. Introduction to Financial Accounting slide 4
I. Introduction to Financial Accounting Learning Target Financial Accounting
The learning target of this chapter is to understand
the content of financial statements,
the concept of the „double entry system“,
the impact of different costing methods,
the concept of depreciation,
measures used in financial analysis,
the consideration of business combinations.
© Prof. Dr. Frank Andreas SchittenhelmI. Introduction to Financial Accounting slide 5
0. Introduction Introduction
© Prof. Dr. Frank Andreas SchittenhelmI. Introduction to Financial Accounting slide 6
0. Introduction Introduction (2)
Goal: Corporations need to communicate their results. Business activity is recorded, summarized and analysedWithin the company: accounting information provides means to control, evaluate and plan operations
Target groups:EmployeesInvestorsCreditorsCustomersSuppliersCommunities
© Prof. Dr. Frank Andreas SchittenhelmI. Introduction to Financial Accounting slide 7
0. Introduction Introduction (3)
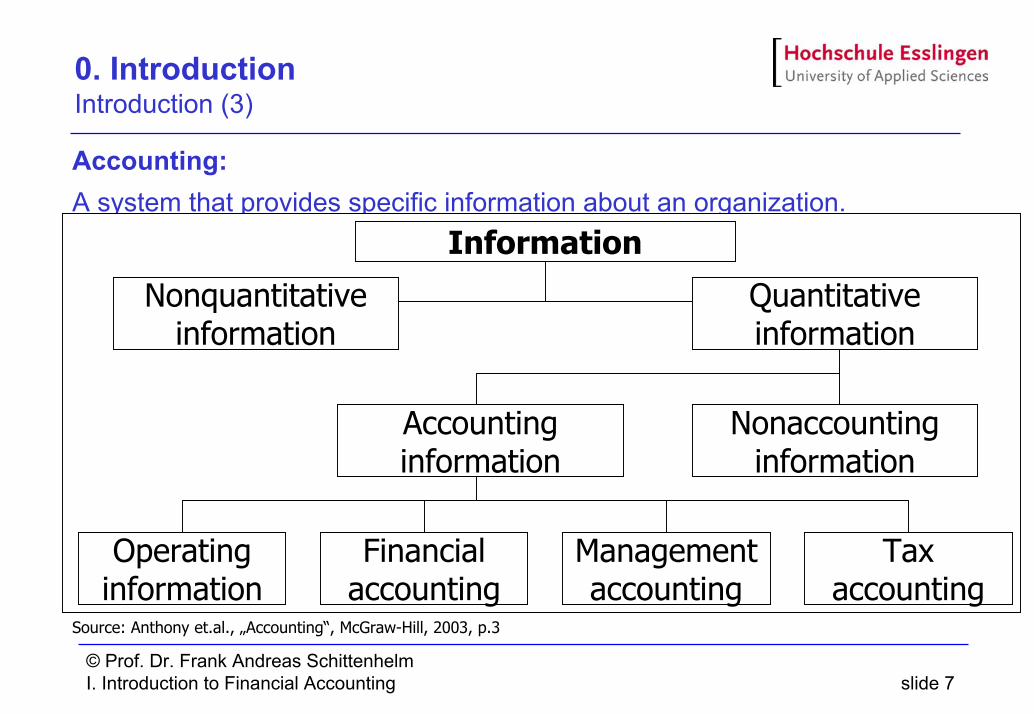
Accounting:A system that provides specific information about an organization.
Source: Anthony et.al., „Accounting“, McGraw-Hill, 2003, p.3
Information
Nonquantitativeinformation
Quantitativeinformation
Accountinginformation
Nonaccountinginformation
Operatinginformation
Taxaccounting
Managementaccounting
Financialaccounting
© Prof. Dr. Frank Andreas SchittenhelmI. Introduction to Financial Accounting slide 8
0. Introduction Introduction (4)
Definition (from the American Accounting Association Committee):Accounting is the process of identifying, measuring, and communicating economic information to permit informed judgements and decisions by users of the information.
Financial statements are the final product of the accounting process, they typically consist ofBalance Sheet, Income Statement, Cash Flow Statement
Profession of Accountants:Bookkeepers and other data-entry employeesStaff accountants who decide how items should be reported, prepare the reports, interpret these reports, etc.Independent public accountants: Certified Public Accountants (CPAs), American Institute of Certified Public Accountants (AICPA)
© Prof. Dr. Frank Andreas SchittenhelmI. Introduction to Financial Accounting slide 9
0. Introduction Introduction (5)
History: Accounting has been around from the beginning of time:
In biblical times to keep track of how much grain was stored in the community‘s silosLuca Pacioli: Summa – Codification of the double entry bookkeeping 1494In modern times accounting answers basic questions about a business as:
What does a company own?How much does a company owe others?How well did a company‘s operations perform?How does the company get the cash to fund itself?
© Prof. Dr. Frank Andreas SchittenhelmI. Introduction to Financial Accounting slide 10
0. Introduction Introduction (6)
Study Goals:Ability to ask for relevant accounting informationAbility to use relevant accounting informationNot to acquire expert knowledge of complex accounting rules
It is relevantfor decision makingin settlement negotiationsif personal performance is evaluated with accounting data
© Prof. Dr. Frank Andreas SchittenhelmI. Introduction to Financial Accounting slide 11
1. Financial Statements
Contents1.1. Balance Sheet
1.1.1. Accounting Transaction1.1.2. Exercise
1.2. Income Statement1.2.1. Accounting Transaction1.2.2. Exercise
1.3. Double Entry System1.4. Cash Flow Statement
1.4.1. Accounting Transaction1.4.2. Exercise
© Prof. Dr. Frank Andreas SchittenhelmI. Introduction to Financial Accounting slide 12
1. Financial Statements 1.1. Balance Sheet
Definition:A Balance Sheet (formal: statement of financial position) reports the assets and equities (liabilities and owners’ equity) of the entity (company) at a specific moment in time status report
Fundamental Accounting EquationAssets = Liabilities + Owner’s Equity
© Prof. Dr. Frank Andreas SchittenhelmI. Introduction to Financial Accounting slide 13
1. Financial Statements 1.1. Balance Sheet (2)
Assets:Assets are the resources that the company possess for the future benefit of the business
CashMarketable SecuritiesAccounts ReceivablesInventoryPrepaid ExpensesLandEquipmentBuildingsInvestmentsIntangible Assets
© Prof. Dr. Frank Andreas SchittenhelmI. Introduction to Financial Accounting slide 14
1. Financial Statements 1.1. Balance Sheet (3)
Liabilities:Liabilities are obligations to repay borrowing, debts, and other obligations to providegoods or services to others.
Bank debtAmounts owed to suppliers: accounts payablePrepaid accounts or advances from customers to deliver goods and servicesTaxes owed Wages owed to employees
Owner’s equity:Owner’s equity is the accumulated measure of the owners’ investment in the company.
Common stockAdditional paid-in capitalRetained earnings
© Prof. Dr. Frank Andreas SchittenhelmI. Introduction to Financial Accounting slide 15
1. Financial Statements 1.1.1. Accounting Transaction
The Balance Sheet is always in balance.
Four categories of accounting transactions affect the balance sheet
Assets ExchangeExample: Company buys a machine and pays in cash (price 1.000 €)
Liabilities/Equity ExchangeExample: Company takes loan to pay accounts payable
Assets and Liabilities/Equity increaseExample: Company buys a machine on credit (price 1.000 €)
Assets and Liabilities/Equity decreaseExample: Company pays back credit with cash (10.000 €)
© Prof. Dr. Frank Andreas SchittenhelmI. Introduction to Financial Accounting slide 16
1. Financial Statements 1.1.1. Accounting Transaction (2)
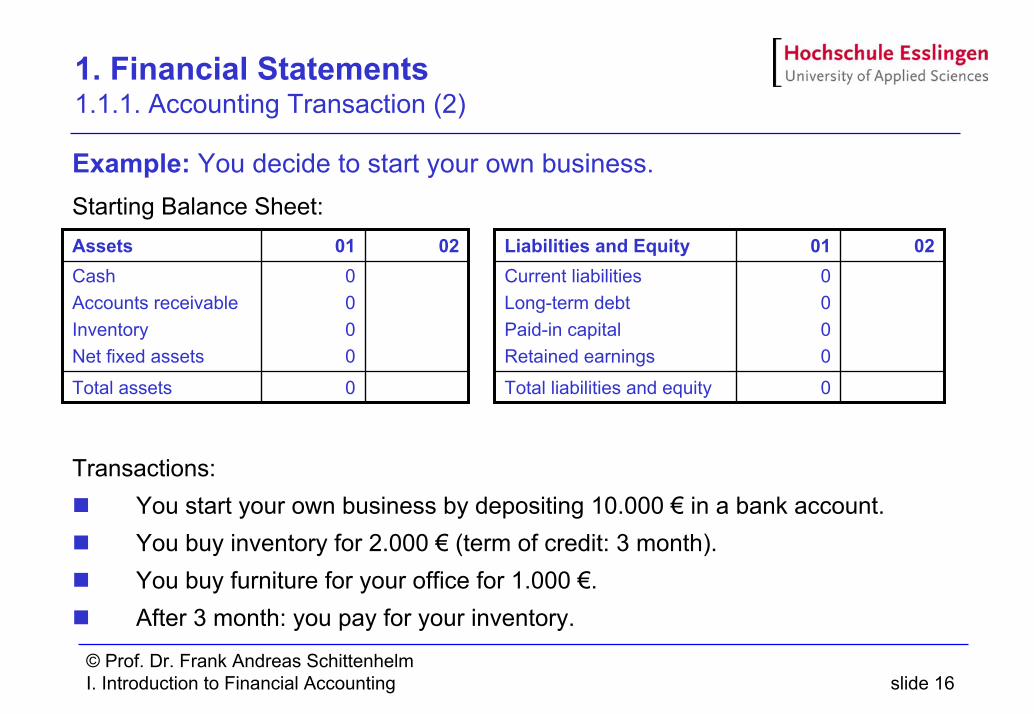
Example: You decide to start your own business. Starting Balance Sheet:
Transactions:You start your own business by depositing 10.000 € in a bank account.You buy inventory for 2.000 € (term of credit: 3 month).You buy furniture for your office for 1.000 €.After 3 month: you pay for your inventory.
0
0000
01
Total assets
CashAccounts receivableInventoryNet fixed assets
02Assets
0
0000
01
Total liabilities and equity
Current liabilitiesLong-term debtPaid-in capitalRetained earnings
02Liabilities and Equity
© Prof. Dr. Frank Andreas SchittenhelmI. Introduction to Financial Accounting slide 17
1. Financial Statements 1.1.1. Accounting Transaction (3)
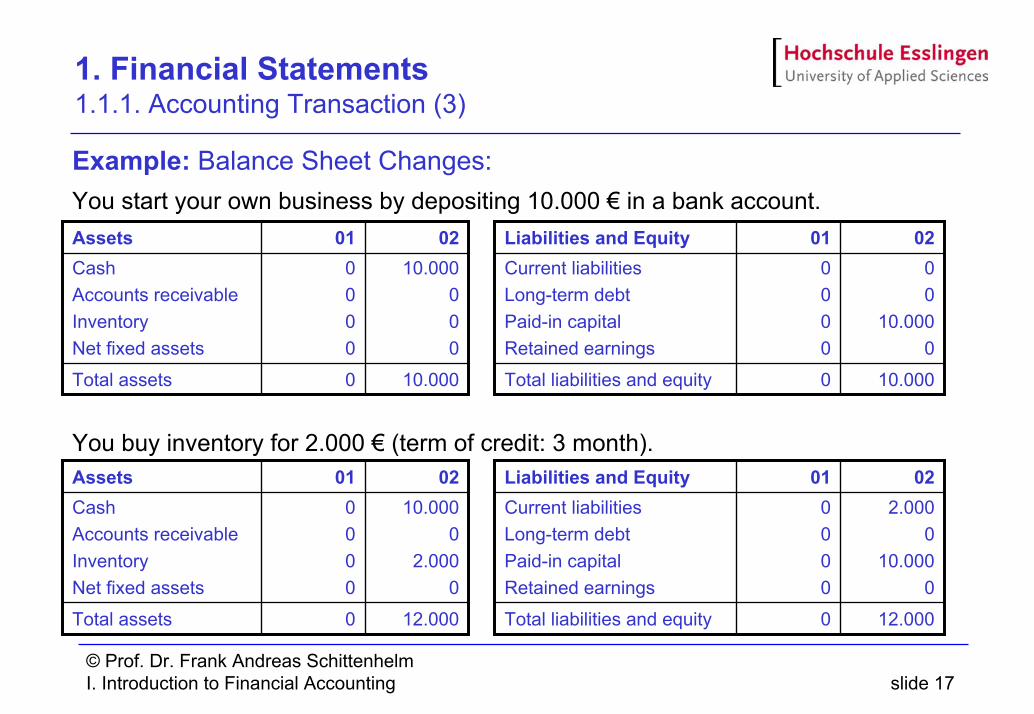
Example: Balance Sheet Changes:You start your own business by depositing 10.000 € in a bank account.
You buy inventory for 2.000 € (term of credit: 3 month).
0
0000
01
10.000Total assets
10.000000
CashAccounts receivableInventoryNet fixed assets
02Assets
0
0000
01
10.000Total liabilities and equity
00
10.0000
Current liabilitiesLong-term debtPaid-in capitalRetained earnings
02Liabilities and Equity
0
0000
01
12.000Total assets
10.0000
2.0000
CashAccounts receivableInventoryNet fixed assets
02Assets
0
0000
01
12.000Total liabilities and equity
2.0000
10.0000
Current liabilitiesLong-term debtPaid-in capitalRetained earnings
02Liabilities and Equity
© Prof. Dr. Frank Andreas SchittenhelmI. Introduction to Financial Accounting slide 18
1. Financial Statements 1.1.1. Accounting Transaction (4)
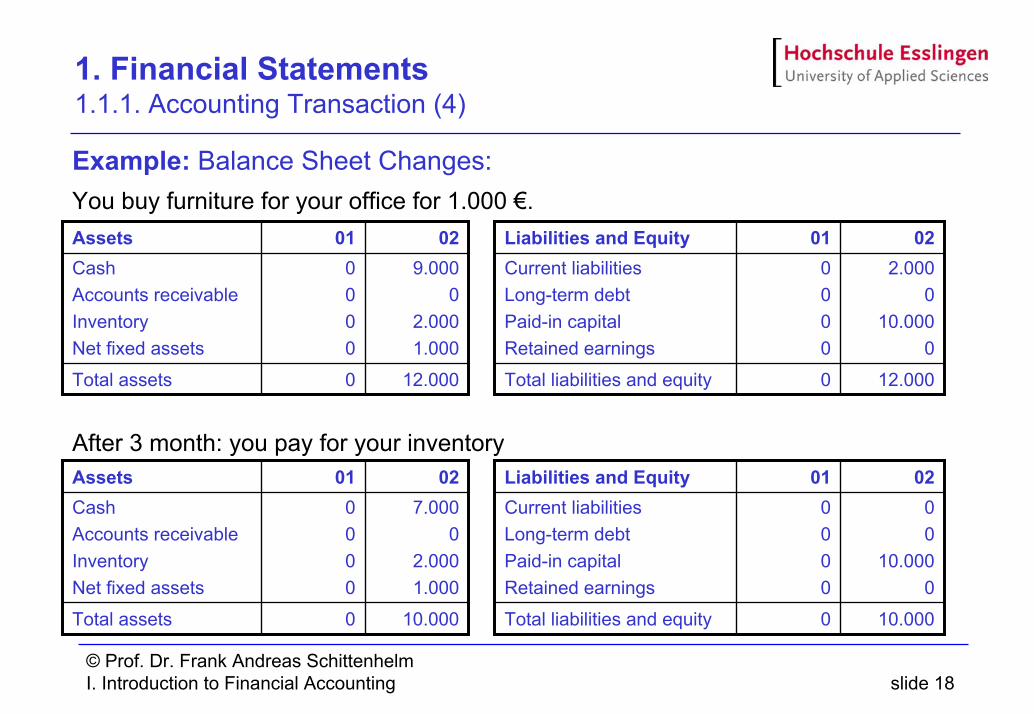
Example: Balance Sheet Changes:You buy furniture for your office for 1.000 €.
After 3 month: you pay for your inventory
0
0000
01
12.000Total assets
9.0000
2.0001.000
CashAccounts receivableInventoryNet fixed assets
02Assets
0
0000
01
12.000Total liabilities and equity
2.0000
10.0000
Current liabilitiesLong-term debtPaid-in capitalRetained earnings
02Liabilities and Equity
0
0000
01
10.000Total assets
7.0000
2.0001.000
CashAccounts receivableInventoryNet fixed assets
02Assets
0
0000
01
10.000Total liabilities and equity
00
10.0000
Current liabilitiesLong-term debtPaid-in capitalRetained earnings
02Liabilities and Equity
© Prof. Dr. Frank Andreas SchittenhelmI. Introduction to Financial Accounting slide 19
1. Financial Statements 1.1.2. Exercise
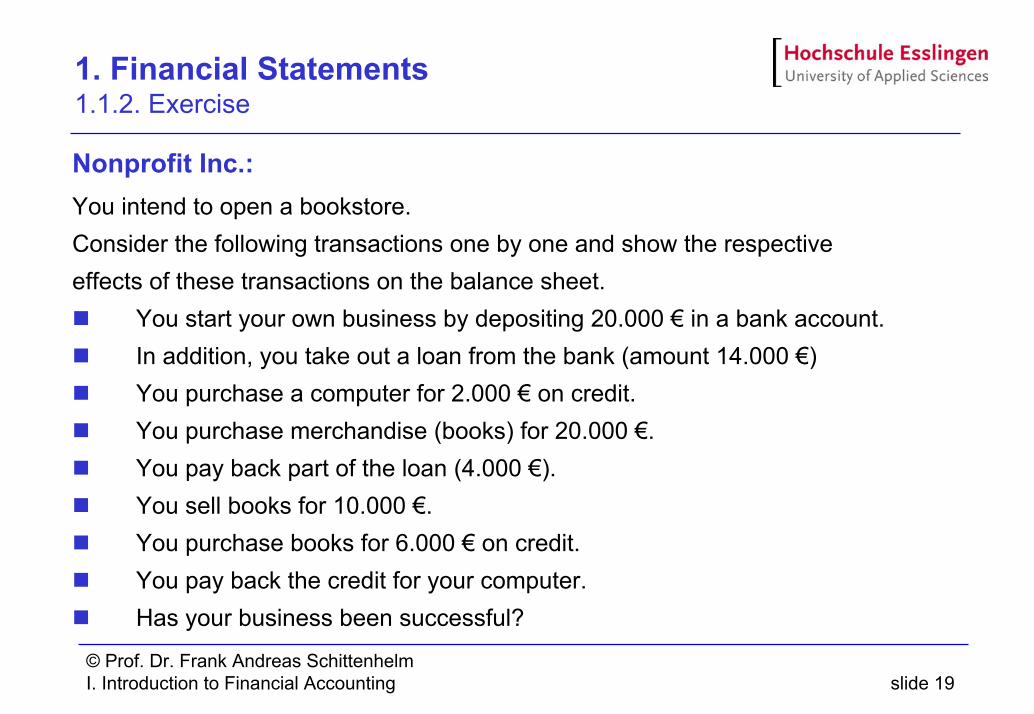
Nonprofit Inc.:You intend to open a bookstore.Consider the following transactions one by one and show the respective effects of these transactions on the balance sheet.
You start your own business by depositing 20.000 € in a bank account.In addition, you take out a loan from the bank (amount 14.000 €) You purchase a computer for 2.000 € on credit.You purchase merchandise (books) for 20.000 €.You pay back part of the loan (4.000 €).You sell books for 10.000 €.You purchase books for 6.000 € on credit.You pay back the credit for your computer.Has your business been successful?
© Prof. Dr. Frank Andreas SchittenhelmI. Introduction to Financial Accounting slide 20
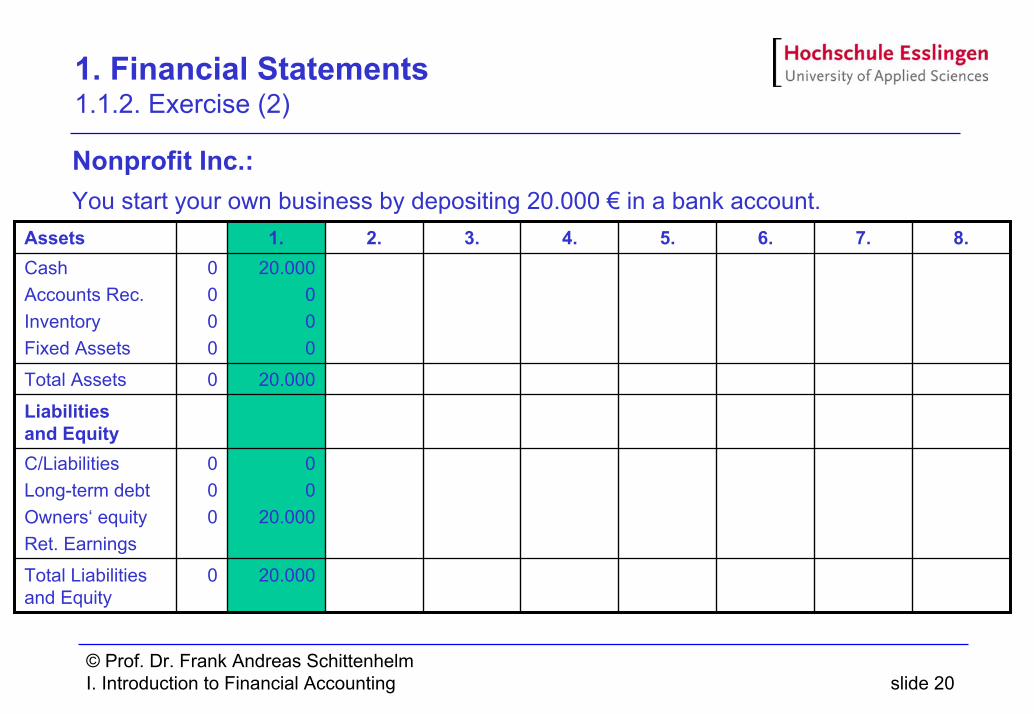
1. Financial Statements 1.1.2. Exercise (2)
Nonprofit Inc.:You start your own business by depositing 20.000 € in a bank account.
20.0000Total Liabilitiesand Equity
00
20.000
000
C/LiabilitiesLong-term debtOwners‘ equityRet. Earnings
Liabilitiesand Equity
20.0000Total Assets
20.000000
0000
CashAccounts Rec.InventoryFixed Assets
8.7.6.5.4.3.2.1.Assets
© Prof. Dr. Frank Andreas SchittenhelmI. Introduction to Financial Accounting slide 21
1. Financial Statements 1.2. Income Statement
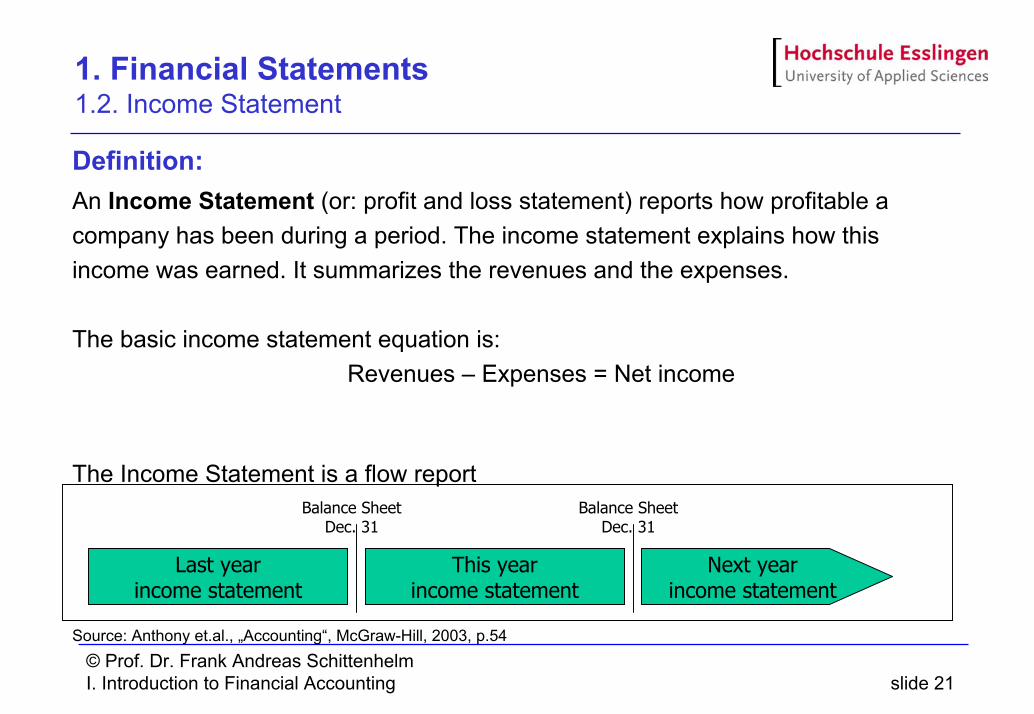
Definition:An Income Statement (or: profit and loss statement) reports how profitable a company has been during a period. The income statement explains how this income was earned. It summarizes the revenues and the expenses.
The basic income statement equation is:Revenues – Expenses = Net income
The Income Statement is a flow report
Source: Anthony et.al., „Accounting“, McGraw-Hill, 2003, p.54
Next yearincome statement
This yearincome statement
Last yearincome statement
Balance SheetDec. 31
Balance SheetDec. 31
© Prof. Dr. Frank Andreas SchittenhelmI. Introduction to Financial Accounting slide 22
1. Financial Statements 1.2. Income Statement (2)
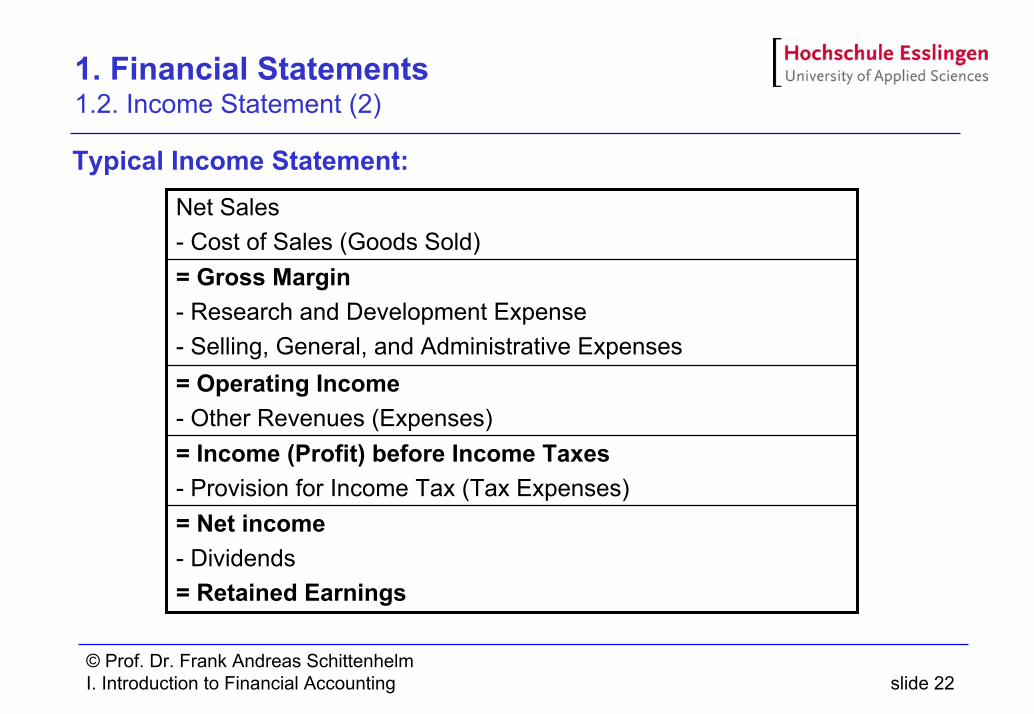
Typical Income Statement:
= Operating Income- Other Revenues (Expenses)
= Net income- Dividends= Retained Earnings
= Income (Profit) before Income Taxes- Provision for Income Tax (Tax Expenses)
= Gross Margin- Research and Development Expense- Selling, General, and Administrative Expenses
Net Sales- Cost of Sales (Goods Sold)
© Prof. Dr. Frank Andreas SchittenhelmI. Introduction to Financial Accounting slide 23
1. Financial Statements 1.2. Income Statement (3)
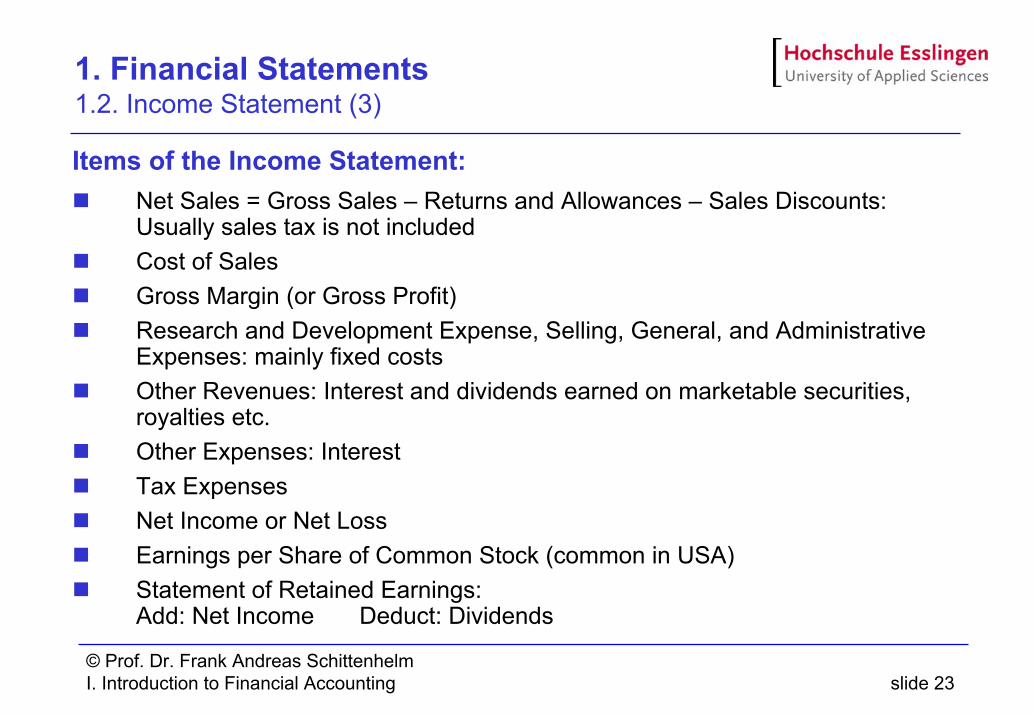
Items of the Income Statement:Net Sales = Gross Sales – Returns and Allowances – Sales Discounts:Usually sales tax is not includedCost of SalesGross Margin (or Gross Profit)Research and Development Expense, Selling, General, and Administrative Expenses: mainly fixed costsOther Revenues: Interest and dividends earned on marketable securities, royalties etc.Other Expenses: InterestTax ExpensesNet Income or Net LossEarnings per Share of Common Stock (common in USA)Statement of Retained Earnings:Add: Net Income Deduct: Dividends
© Prof. Dr. Frank Andreas SchittenhelmI. Introduction to Financial Accounting slide 24
1. Financial Statements 1.2. Income Statement (4)
Accrual Accounting:Accrual Accounting measures income for a period as the difference between the revenues recognized in that period and the expenses that are matched with those revenues.
Other Concepts of Income:Cash-basis Accounting: Sales and costs are not recorded until the period in which they received cash.Modified Cash-basis Accounting: Depreciation for long-lived assets
For smaller companies with rather no fixed assetsIncome Tax Accounting: general goal: reduce taxable income and/or postpone
tax payments
© Prof. Dr. Frank Andreas SchittenhelmI. Introduction to Financial Accounting slide 25
1. Financial Statements 1.2.1. Accounting Transaction
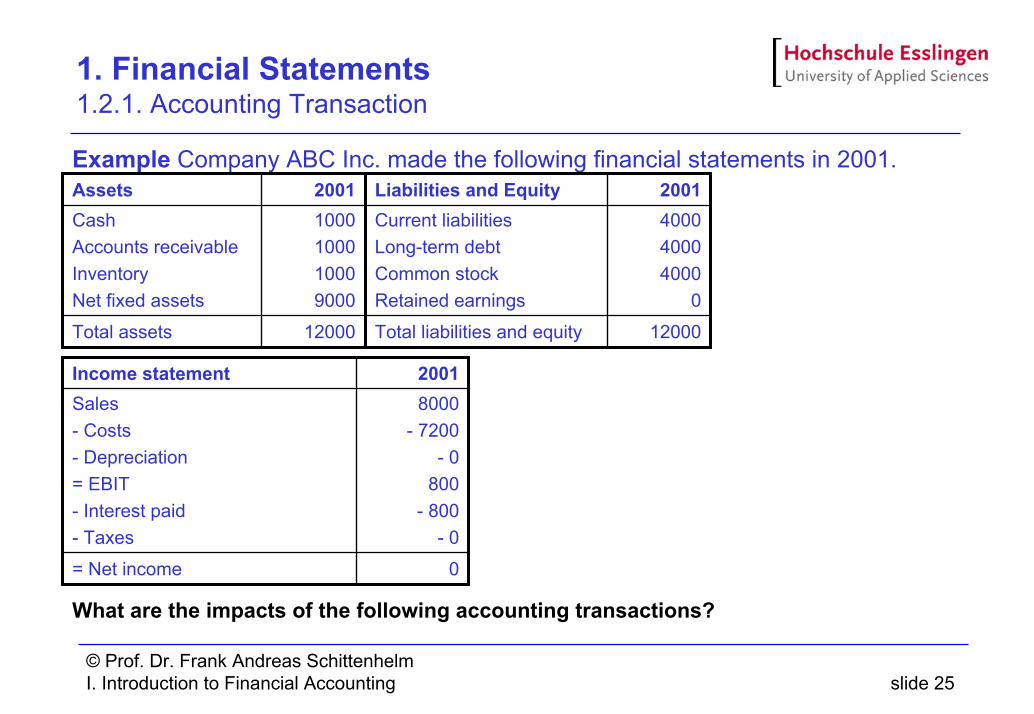
Example Company ABC Inc. made the following financial statements in 2001.
What are the impacts of the following accounting transactions?
12000
1000100010009000
2001
Total assets
CashAccounts receivableInventoryNet fixed assets
Assets
0= Net income
8000- 7200
- 0800
- 800- 0
Sales- Costs- Depreciation= EBIT- Interest paid- Taxes
2001Income statement
12000
400040004000
0
2001
Total liabilities and equity
Current liabilitiesLong-term debtCommon stockRetained earnings
Liabilities and Equity
© Prof. Dr. Frank Andreas SchittenhelmI. Introduction to Financial Accounting slide 26
1. Financial Statements 1.2.1. Accounting Transaction (2)
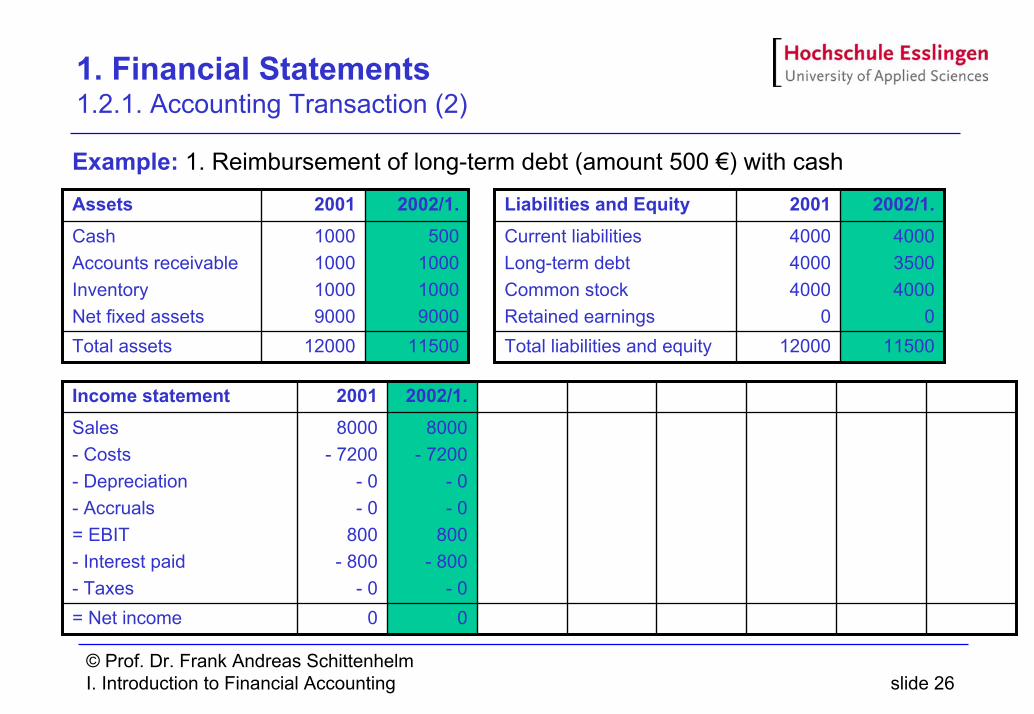
Example: 1. Reimbursement of long-term debt (amount 500 €) with cash
12000
1000100010009000
2001
11500Total assets
500100010009000
CashAccounts receivableInventoryNet fixed assets
2002/1.Assets
12000
400040004000
0
2001
11500Total liabilities and equity
400035004000
0
Current liabilitiesLong-term debtCommon stockRetained earnings
2002/1.Liabilities and Equity
0
8000- 7200
- 0- 0
800- 800
- 0
2001
0
8000- 7200
- 0- 0
800- 800
- 0
2002/1.
= Net income
Sales- Costs- Depreciation- Accruals= EBIT- Interest paid- Taxes
Income statement
© Prof. Dr. Frank Andreas SchittenhelmI. Introduction to Financial Accounting slide 27
1. Financial Statements 1.2.1. Accounting Transaction (3)
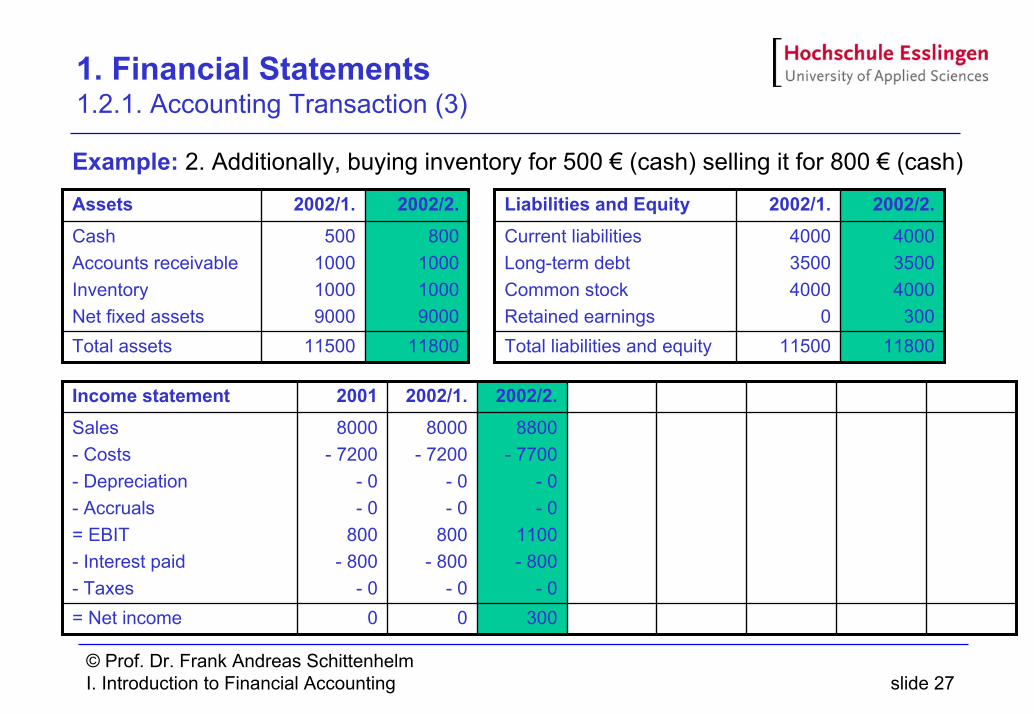
Example: 2. Additionally, buying inventory for 500 € (cash) selling it for 800 € (cash)
11500
500100010009000
2002/1.
11800Total assets
800100010009000
CashAccounts receivableInventoryNet fixed assets
2002/2.Assets
11500
400035004000
0
2002/1.
11800Total liabilities and equity
400035004000300
Current liabilitiesLong-term debtCommon stockRetained earnings
2002/2.Liabilities and Equity
0
8000- 7200
- 0- 0
800- 800
- 0
2001
300
8800- 7700
- 0- 0
1100- 800
- 0
2002/2.
0
8000- 7200
- 0- 0
800- 800
- 0
2002/1.
= Net income
Sales- Costs- Depreciation- Accruals= EBIT- Interest paid- Taxes
Income statement
© Prof. Dr. Frank Andreas SchittenhelmI. Introduction to Financial Accounting slide 28
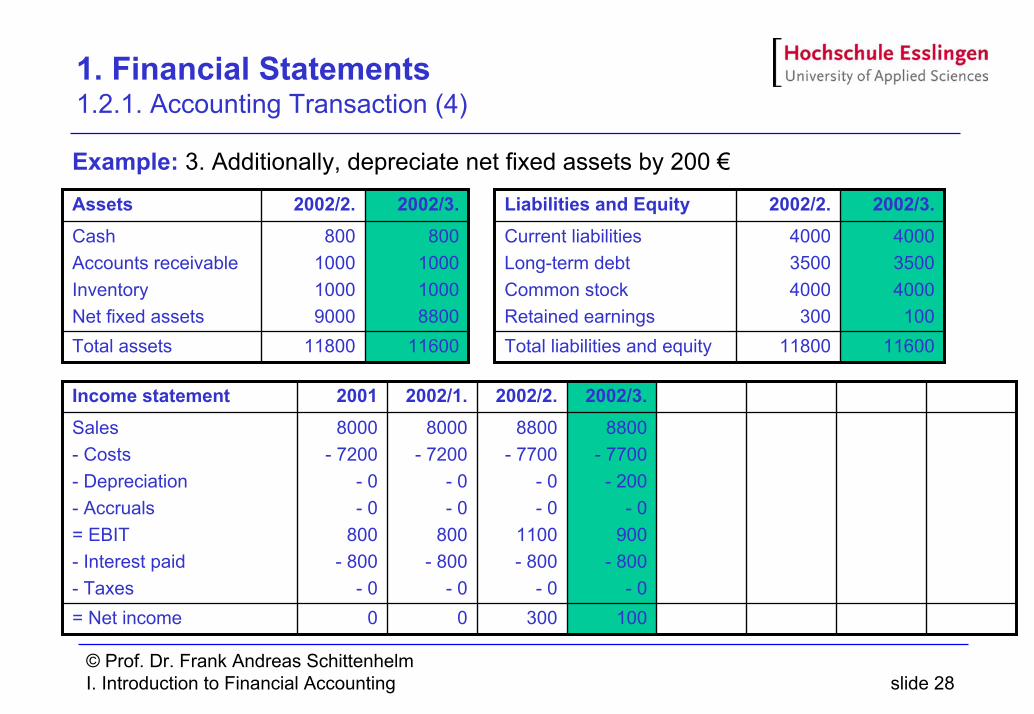
1. Financial Statements 1.2.1. Accounting Transaction (4)
Example: 3. Additionally, depreciate net fixed assets by 200 €
11800
800100010009000
2002/2.
11600Total assets
800100010008800
CashAccounts receivableInventoryNet fixed assets
2002/3.Assets
11800
400035004000300
2002/2.
11600Total liabilities and equity
400035004000100
Current liabilitiesLong-term debtCommon stockRetained earnings
2002/3.Liabilities and Equity
100
8800- 7700- 200
- 0900
- 800- 0
2002/3.
0
8000- 7200
- 0- 0
800- 800
- 0
2001
300
8800- 7700
- 0- 0
1100- 800
- 0
2002/2.
0
8000- 7200
- 0- 0
800- 800
- 0
2002/1.
= Net income
Sales- Costs- Depreciation- Accruals= EBIT- Interest paid- Taxes
Income statement
© Prof. Dr. Frank Andreas SchittenhelmI. Introduction to Financial Accounting slide 29
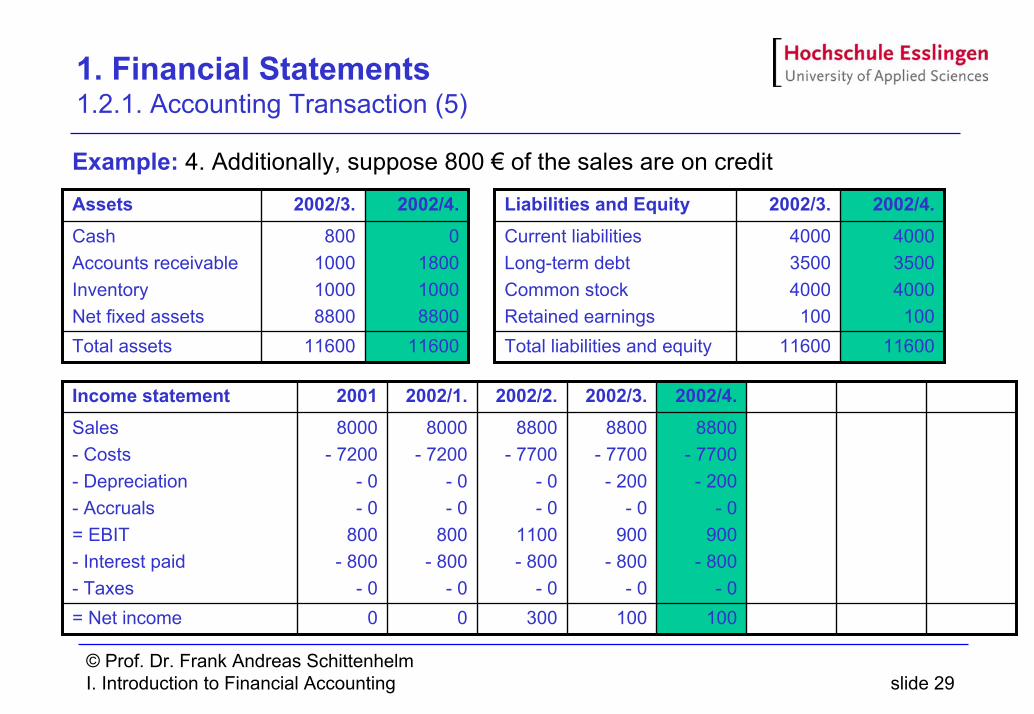
1. Financial Statements 1.2.1. Accounting Transaction (5)
Example: 4. Additionally, suppose 800 € of the sales are on credit
11600
800100010008800
2002/3.
11600Total assets
0180010008800
CashAccounts receivableInventoryNet fixed assets
2002/4.Assets
11600
400035004000100
2002/3.
11600Total liabilities and equity
400035004000100
Current liabilitiesLong-term debtCommon stockRetained earnings
2002/4.Liabilities and Equity
100
8800- 7700- 200
- 0900
- 800- 0
2002/3.
0
8000- 7200
- 0- 0
800- 800
- 0
2001
300
8800- 7700
- 0- 0
1100- 800
- 0
2002/2.
100
8800- 7700- 200
- 0900
- 800- 0
2002/4.
0
8000- 7200
- 0- 0
800- 800
- 0
2002/1.
= Net income
Sales- Costs- Depreciation- Accruals= EBIT- Interest paid- Taxes
Income statement
© Prof. Dr. Frank Andreas SchittenhelmI. Introduction to Financial Accounting slide 30
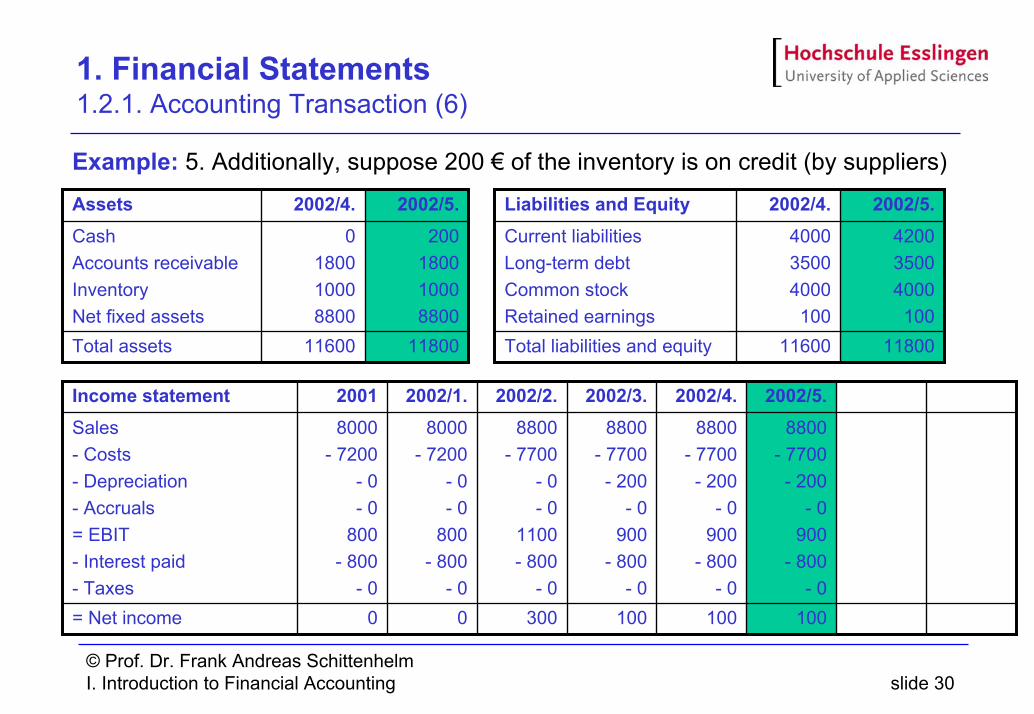
1. Financial Statements 1.2.1. Accounting Transaction (6)
Example: 5. Additionally, suppose 200 € of the inventory is on credit (by suppliers)
11600
0180010008800
2002/4.
11800Total assets
200180010008800
CashAccounts receivableInventoryNet fixed assets
2002/5.Assets
11600
400035004000100
2002/4.
11800Total liabilities and equity
420035004000100
Current liabilitiesLong-term debtCommon stockRetained earnings
2002/5.Liabilities and Equity
100
8800- 7700- 200
- 0900
- 800- 0
2002/5.
100
8800- 7700- 200
- 0900
- 800- 0
2002/3.
0
8000- 7200
- 0- 0
800- 800
- 0
2001
300
8800- 7700
- 0- 0
1100- 800
- 0
2002/2.
100
8800- 7700- 200
- 0900
- 800- 0
2002/4.
0
8000- 7200
- 0- 0
800- 800
- 0
2002/1.
= Net income
Sales- Costs- Depreciation- Accruals= EBIT- Interest paid- Taxes
Income statement
© Prof. Dr. Frank Andreas SchittenhelmI. Introduction to Financial Accounting slide 31
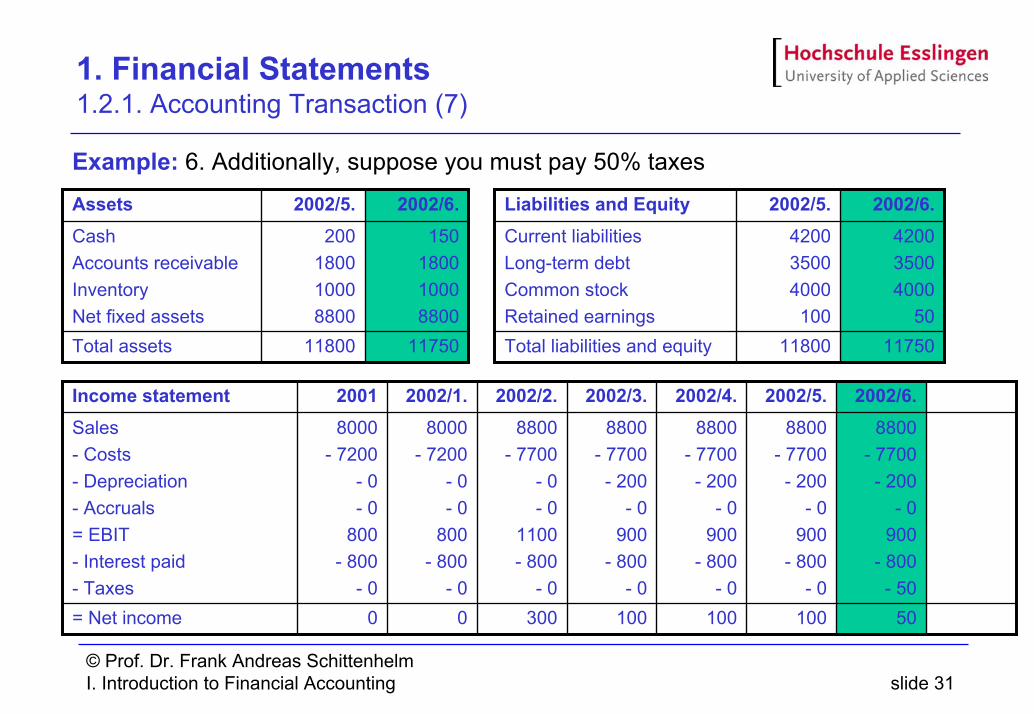
1. Financial Statements 1.2.1. Accounting Transaction (7)
Example: 6. Additionally, suppose you must pay 50% taxes
11800
200180010008800
2002/5.
11750Total assets
150180010008800
CashAccounts receivableInventoryNet fixed assets
2002/6.Assets
11800
420035004000100
2002/5.
11750Total liabilities and equity
420035004000
50
Current liabilitiesLong-term debtCommon stockRetained earnings
2002/6.Liabilities and Equity
50
8800- 7700- 200
- 0900
- 800- 50
2002/6.
100
8800- 7700- 200
- 0900
- 800- 0
2002/5.
100
8800- 7700- 200
- 0900
- 800- 0
2002/3.
0
8000- 7200
- 0- 0
800- 800
- 0
2001
300
8800- 7700
- 0- 0
1100- 800
- 0
2002/2.
100
8800- 7700- 200
- 0900
- 800- 0
2002/4.
0
8000- 7200
- 0- 0
800- 800
- 0
2002/1.
= Net income
Sales- Costs- Depreciation- Accruals= EBIT- Interest paid- Taxes
Income statement
© Prof. Dr. Frank Andreas SchittenhelmI. Introduction to Financial Accounting slide 32
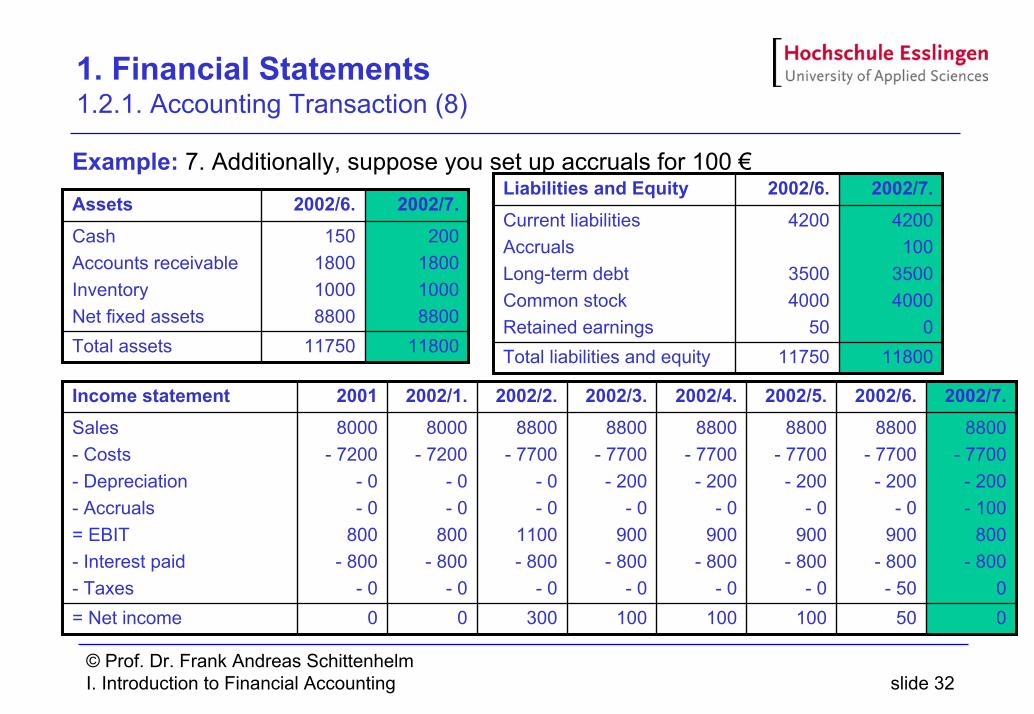
1. Financial Statements 1.2.1. Accounting Transaction (8)
Example: 7. Additionally, suppose you set up accruals for 100 €
11750
150180010008800
2002/6.
11800Total assets
200180010008800
CashAccounts receivableInventoryNet fixed assets
2002/7.Assets
50
8800- 7700- 200
- 0900
- 800- 50
2002/6.
100
8800- 7700- 200
- 0900
- 800- 0
2002/5.
100
8800- 7700- 200
- 0900
- 800- 0
2002/3.
0
8000- 7200
- 0- 0
800- 800
- 0
2001
0
8800- 7700- 200- 100
800- 800
0
2002/7.
300
8800- 7700
- 0- 0
1100- 800
- 0
2002/2.
100
8800- 7700- 200
- 0900
- 800- 0
2002/4.
0
8000- 7200
- 0- 0
800- 800
- 0
2002/1.
= Net income
Sales- Costs- Depreciation- Accruals= EBIT- Interest paid- Taxes
Income statement
11750
4200
35004000
50
2002/6.
11800Total liabilities and equity
4200100
35004000
0
Current liabilitiesAccrualsLong-term debtCommon stockRetained earnings
2002/7.Liabilities and Equity
© Prof. Dr. Frank Andreas SchittenhelmI. Introduction to Financial Accounting slide 33
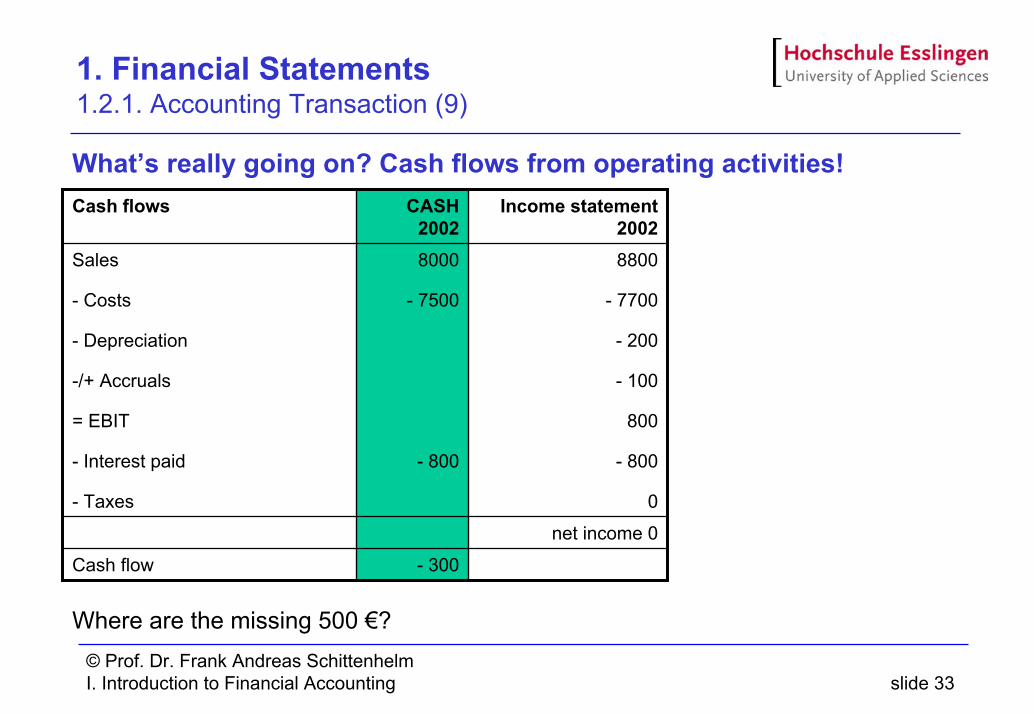
1. Financial Statements 1.2.1. Accounting Transaction (9)
What’s really going on? Cash flows from operating activities!
Where are the missing 500 €?
net income 0
8800
- 7700
- 200
- 100
800
- 800
0
Income statement 2002
- 300
8000
- 7500
- 800
CASH2002
Cash flow
Sales
- Costs
- Depreciation
-/+ Accruals
= EBIT
- Interest paid
- Taxes
Cash flows
© Prof. Dr. Frank Andreas SchittenhelmI. Introduction to Financial Accounting slide 34
1. Financial Statements 1.2.2. Exercise
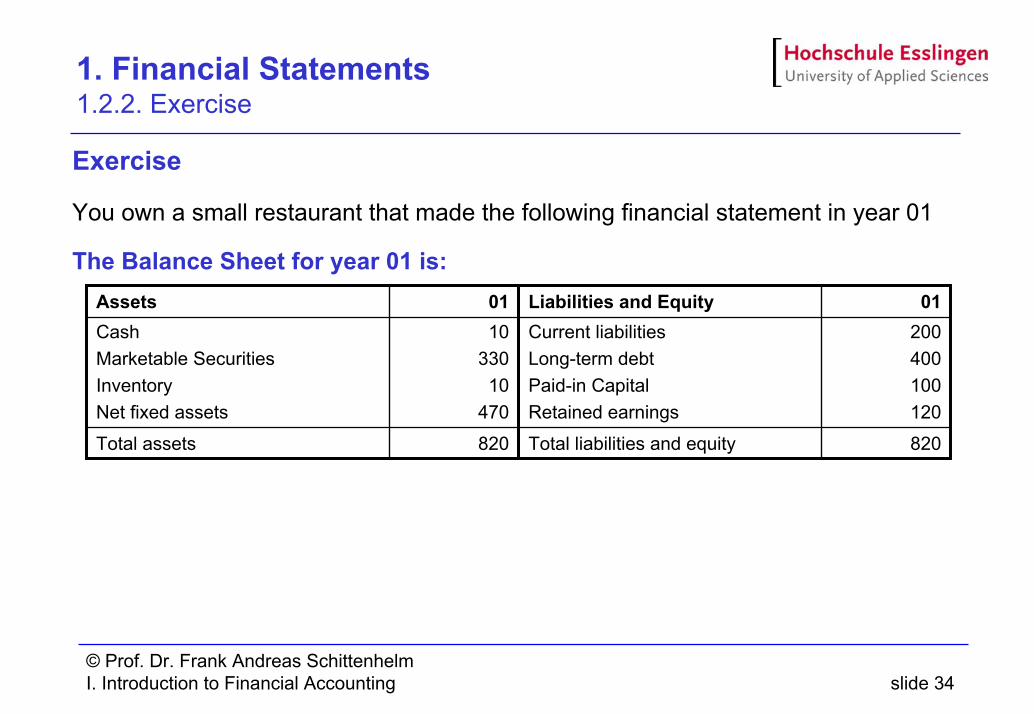
Exercise
You own a small restaurant that made the following financial statement in year 01
The Balance Sheet for year 01 is:
820
10330
10470
01
Total assets
CashMarketable SecuritiesInventoryNet fixed assets
Assets
820
200400100120
01
Total liabilities and equity
Current liabilitiesLong-term debtPaid-in CapitalRetained earnings
Liabilities and Equity
© Prof. Dr. Frank Andreas SchittenhelmI. Introduction to Financial Accounting slide 35
1. Financial Statements 1.2.2. Exercise (2)
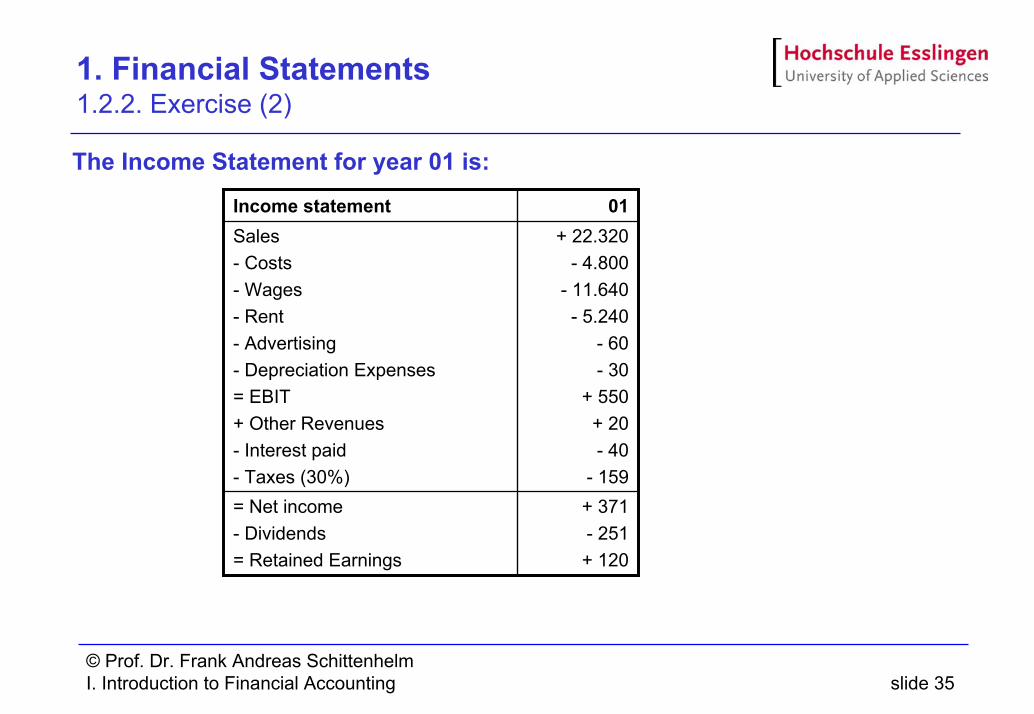
The Income Statement for year 01 is:
+ 371- 251+ 120
= Net income- Dividends= Retained Earnings
+ 22.320- 4.800
- 11.640- 5.240
- 60 - 30
+ 550+ 20- 40
- 159
Sales- Costs- Wages- Rent- Advertising- Depreciation Expenses= EBIT+ Other Revenues- Interest paid- Taxes (30%)
01Income statement
© Prof. Dr. Frank Andreas SchittenhelmI. Introduction to Financial Accounting slide 36
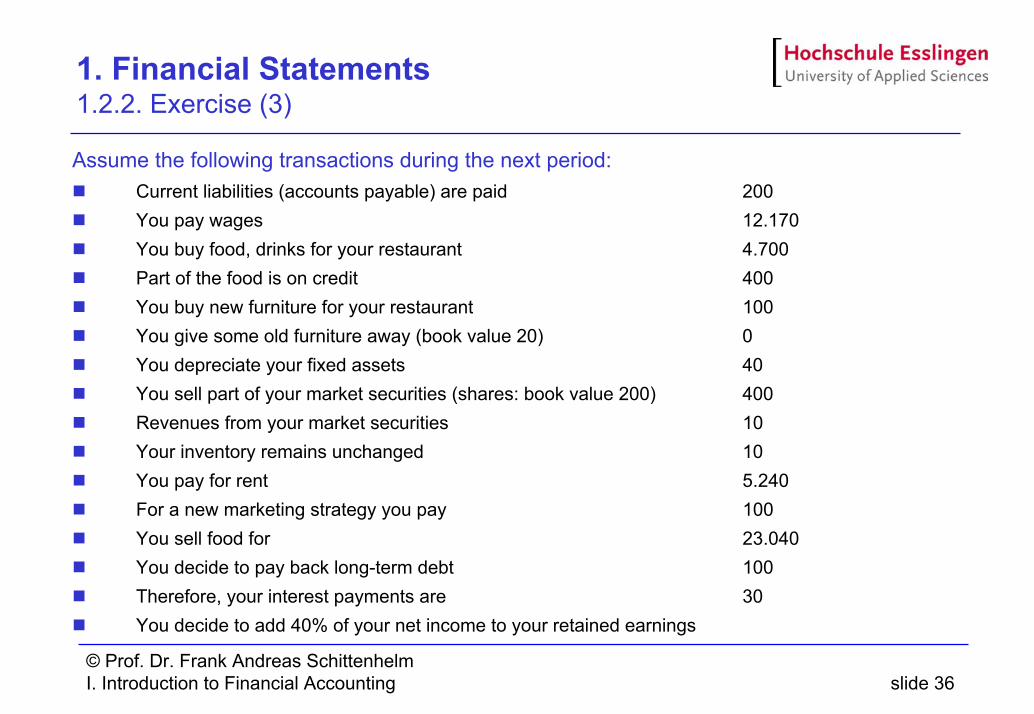
1. Financial Statements 1.2.2. Exercise (3)
Assume the following transactions during the next period:Current liabilities (accounts payable) are paid 200You pay wages 12.170You buy food, drinks for your restaurant 4.700Part of the food is on credit 400You buy new furniture for your restaurant 100You give some old furniture away (book value 20) 0You depreciate your fixed assets 40You sell part of your market securities (shares: book value 200) 400Revenues from your market securities 10Your inventory remains unchanged 10You pay for rent 5.240For a new marketing strategy you pay 100You sell food for 23.040You decide to pay back long-term debt 100Therefore, your interest payments are 30You decide to add 40% of your net income to your retained earnings
© Prof. Dr. Frank Andreas SchittenhelmI. Introduction to Financial Accounting slide 37
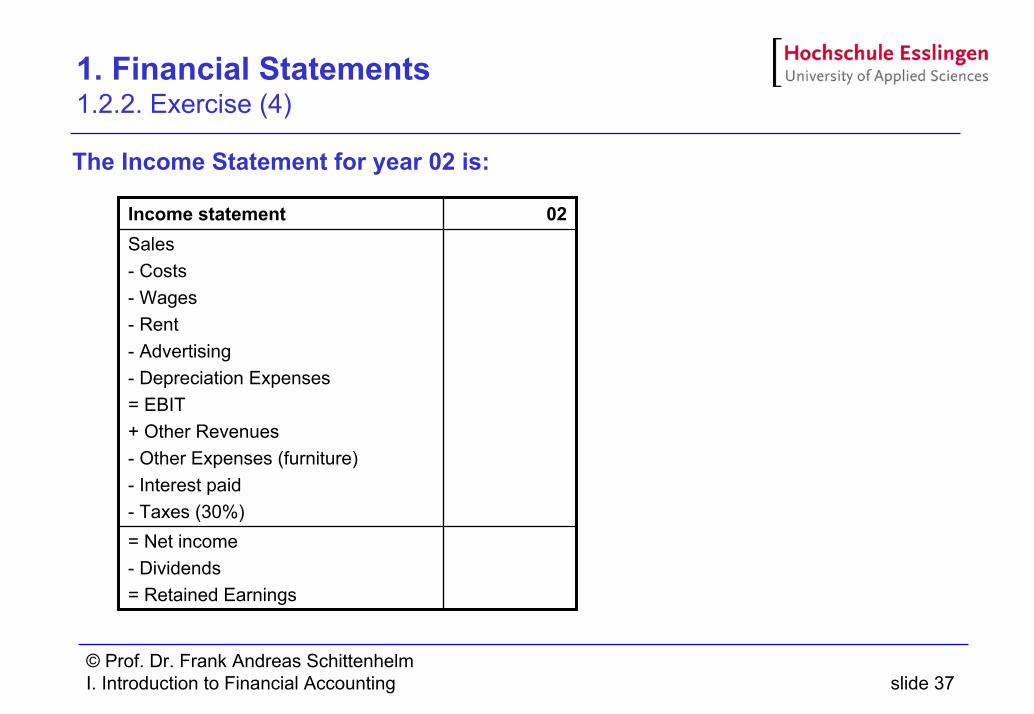
1. Financial Statements 1.2.2. Exercise (4)
The Income Statement for year 02 is:
= Net income- Dividends= Retained Earnings
Sales- Costs- Wages- Rent- Advertising- Depreciation Expenses= EBIT+ Other Revenues- Other Expenses (furniture)- Interest paid- Taxes (30%)
02Income statement
© Prof. Dr. Frank Andreas SchittenhelmI. Introduction to Financial Accounting slide 38
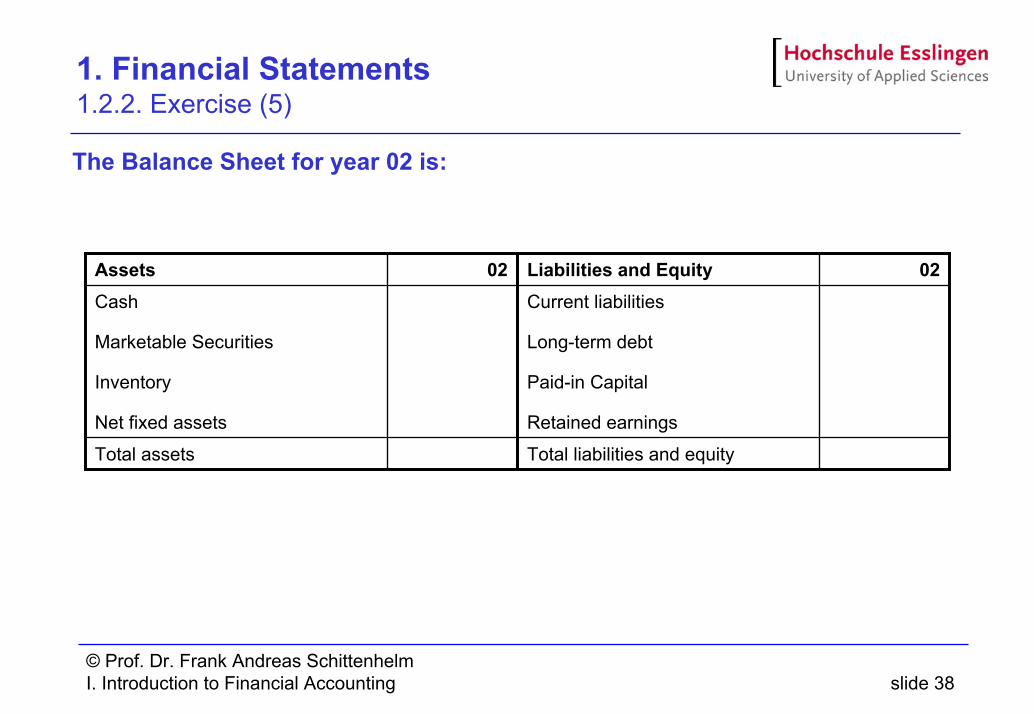
1. Financial Statements 1.2.2. Exercise (5)
The Balance Sheet for year 02 is:
02
Total assets
Cash
Marketable Securities
Inventory
Net fixed assets
Assets 02
Total liabilities and equity
Current liabilities
Long-term debt
Paid-in Capital
Retained earnings
Liabilities and Equity
© Prof. Dr. Frank Andreas SchittenhelmI. Introduction to Financial Accounting slide 39
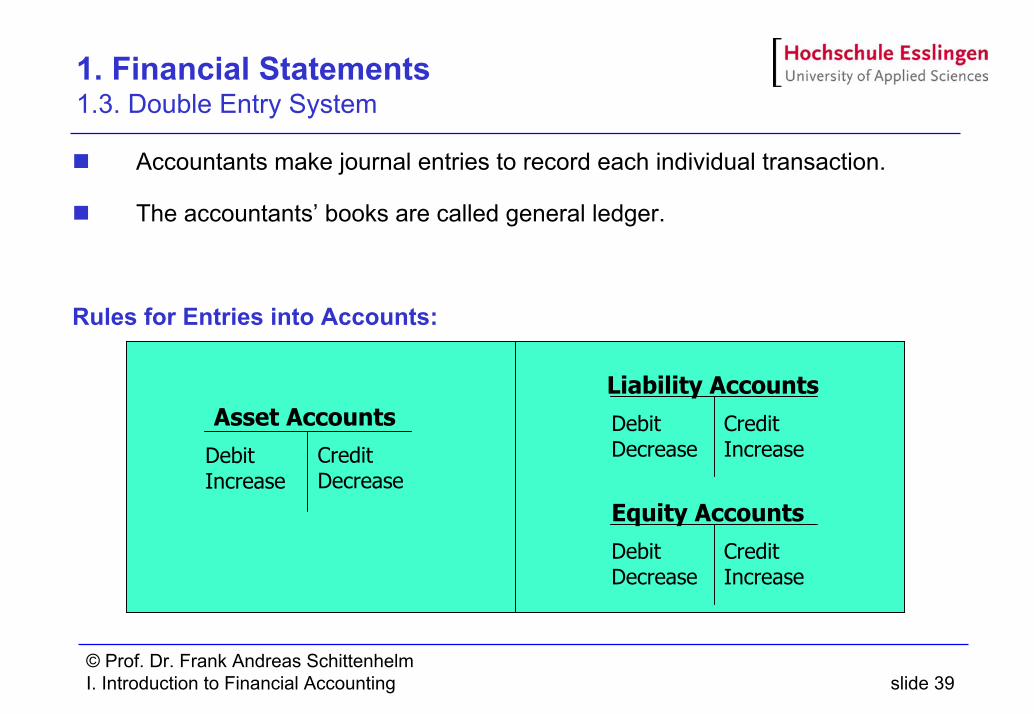
1. Financial Statements 1.3. Double Entry System
Accountants make journal entries to record each individual transaction.
The accountants’ books are called general ledger.
Rules for Entries into Accounts:
Asset AccountsDebitIncrease
CreditDecrease
Liability AccountsDebitDecrease
CreditIncrease
Equity AccountsDebitDecrease
CreditIncrease
© Prof. Dr. Frank Andreas SchittenhelmI. Introduction to Financial Accounting slide 40
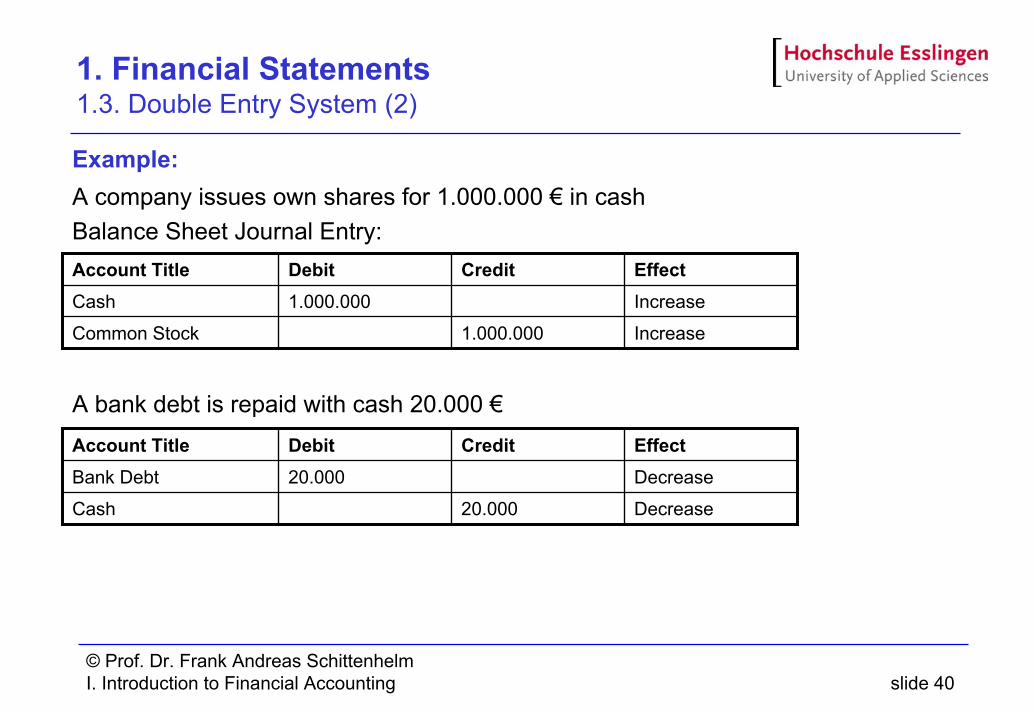
1. Financial Statements 1.3. Double Entry System (2)
Example:A company issues own shares for 1.000.000 € in cashBalance Sheet Journal Entry:
A bank debt is repaid with cash 20.000 €
Increase1.000.000Cash
Increase1.000.000Common Stock
EffectCreditDebitAccount Title
Decrease20.000Bank Debt
Decrease20.000Cash
EffectCreditDebitAccount Title
© Prof. Dr. Frank Andreas SchittenhelmI. Introduction to Financial Accounting slide 41
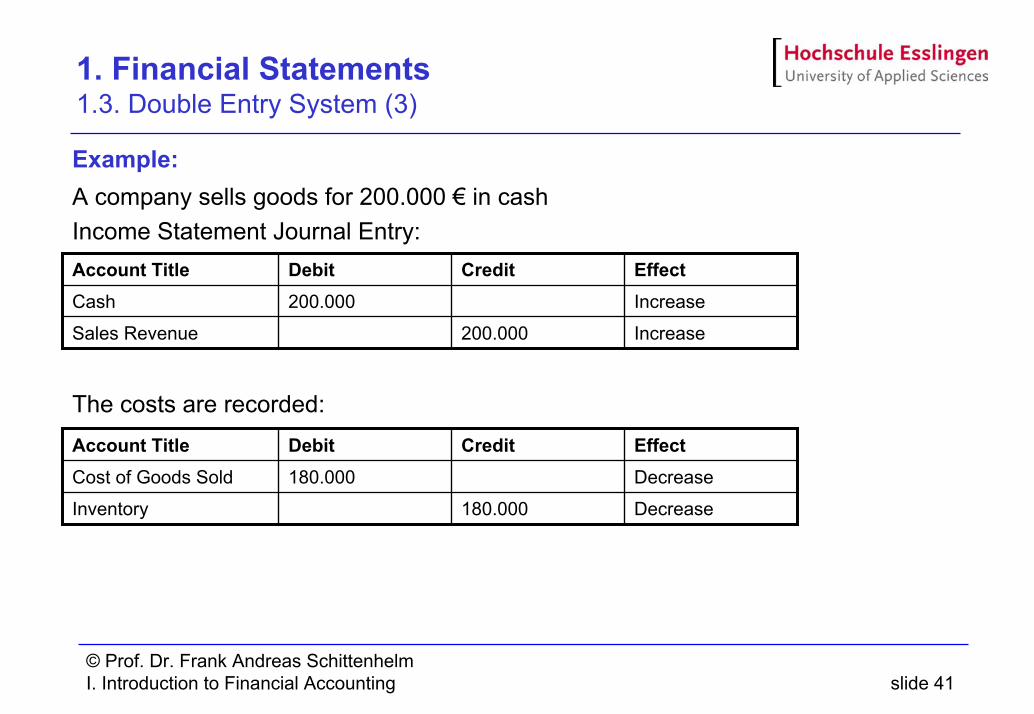
1. Financial Statements 1.3. Double Entry System (3)
Example:A company sells goods for 200.000 € in cashIncome Statement Journal Entry:
The costs are recorded:
Increase200.000Cash
Increase200.000Sales Revenue
EffectCreditDebitAccount Title
Decrease180.000Cost of Goods Sold
Decrease180.000Inventory
EffectCreditDebitAccount Title
© Prof. Dr. Frank Andreas SchittenhelmI. Introduction to Financial Accounting slide 42
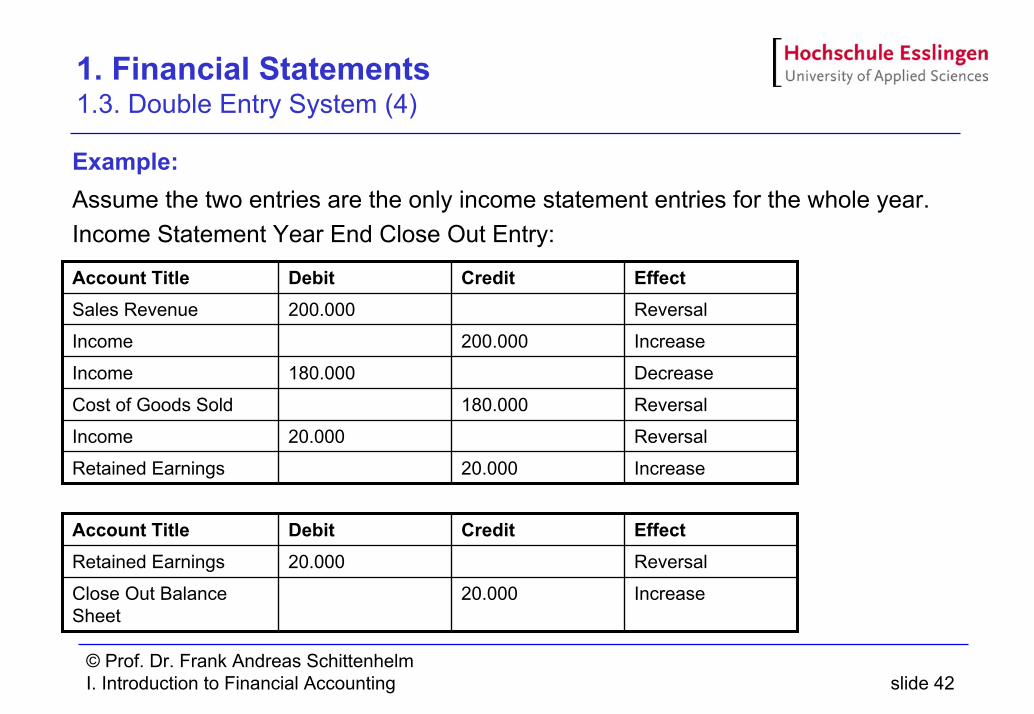
1. Financial Statements 1.3. Double Entry System (4)
Example:Assume the two entries are the only income statement entries for the whole year. Income Statement Year End Close Out Entry:
Reversal20.000Income
Reversal180.000Cost of Goods Sold
Increase200.000Income
Decrease180.000Income
Reversal200.000Sales Revenue
Increase20.000Retained Earnings
EffectCreditDebitAccount Title
Increase20.000Close Out BalanceSheet
Reversal20.000Retained Earnings
EffectCreditDebitAccount Title
© Prof. Dr. Frank Andreas SchittenhelmI. Introduction to Financial Accounting slide 43
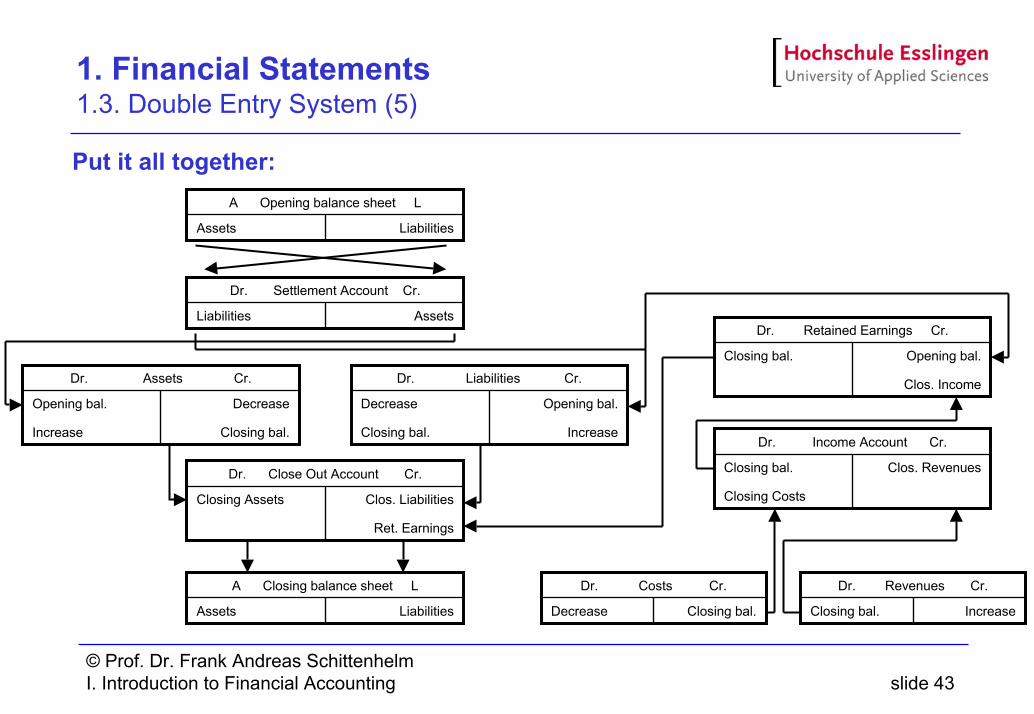
1. Financial Statements 1.3. Double Entry System (5)
Put it all together:
LiabilitiesAssets
A Opening balance sheet L
AssetsLiabilities
Dr. Settlement Account Cr.
Opening bal.
Clos. Income
Closing bal.
Dr. Retained Earnings Cr.
Opening bal.
Increase
Decrease
Closing bal.
Dr. Liabilities Cr.
Decrease
Closing bal.
Opening bal.
Increase
Dr. Assets Cr.
Clos. Liabilities
Ret. Earnings
Closing Assets
Dr. Close Out Account Cr.
LiabilitiesAssets
A Closing balance sheet L
IncreaseClosing bal.
Dr. Revenues Cr.
Closing bal.Decrease
Dr. Costs Cr.
Clos. RevenuesClosing bal.
Closing Costs
Dr. Income Account Cr.
© Prof. Dr. Frank Andreas SchittenhelmI. Introduction to Financial Accounting slide 44
1. Financial Statements 1.4. Cash Flow Statement
Definition:A Cash Flow Statement shows the net change in cash for the year.
Was the company a seemingly profitable company, but must borrow heavily just to stay alive?Did the company’s operations throw off cash, even though it may be just marginally profitable according to the income statement?What is relationship between cash flow and earnings?How are dividends financed?How are debts paid off?How is the cash generated by operations usedAre management’s stated financial policies reflected in the cash flow?
© Prof. Dr. Frank Andreas SchittenhelmI. Introduction to Financial Accounting slide 45
1. Financial Statements 1.4. Cash Flow Statement (2)
Types of business activities:Operations Activities
When the company is healthy, operating activities will generate cash
Investing ActivitiesDoes the company require a great investment in fixed assets?Is the company selling off its assets to fill an insatiable cash drain from operations?
Financing ActivitiesDid the company borrow heavily?Has the company gone to investors to fund its operational or investing activities?
Rearranging the fundamental accounting equation one gets:Cash+Other Current Assets+Fixed Assets = Current Liabilities + LT Debt + EquityCash = Current Liabilities – Current Assets – Fixed Assets + LT Debt + Equity
© Prof. Dr. Frank Andreas SchittenhelmI. Introduction to Financial Accounting slide 46
1. Financial Statements 1.4.1. Accounting Transaction
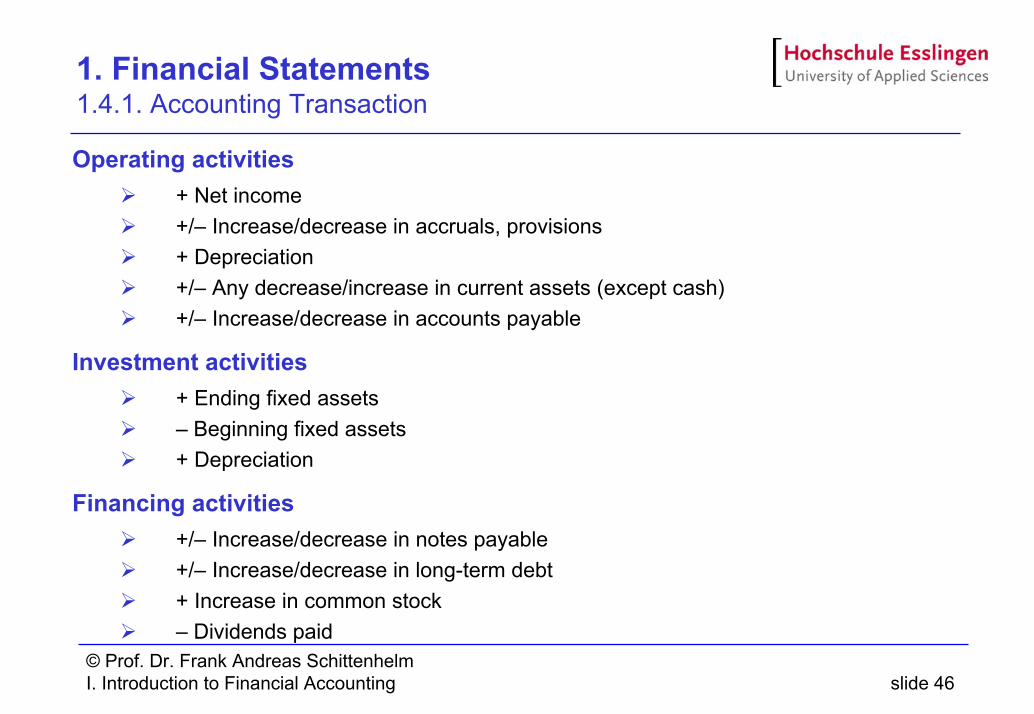
Operating activities+ Net income+/– Increase/decrease in accruals, provisions+ Depreciation+/– Any decrease/increase in current assets (except cash)+/– Increase/decrease in accounts payable
Investment activities+ Ending fixed assets– Beginning fixed assets+ Depreciation
Financing activities+/– Increase/decrease in notes payable+/– Increase/decrease in long-term debt+ Increase in common stock– Dividends paid
© Prof. Dr. Frank Andreas SchittenhelmI. Introduction to Financial Accounting slide 47
1. Financial Statements 1.4.1. Accounting Transaction (2)
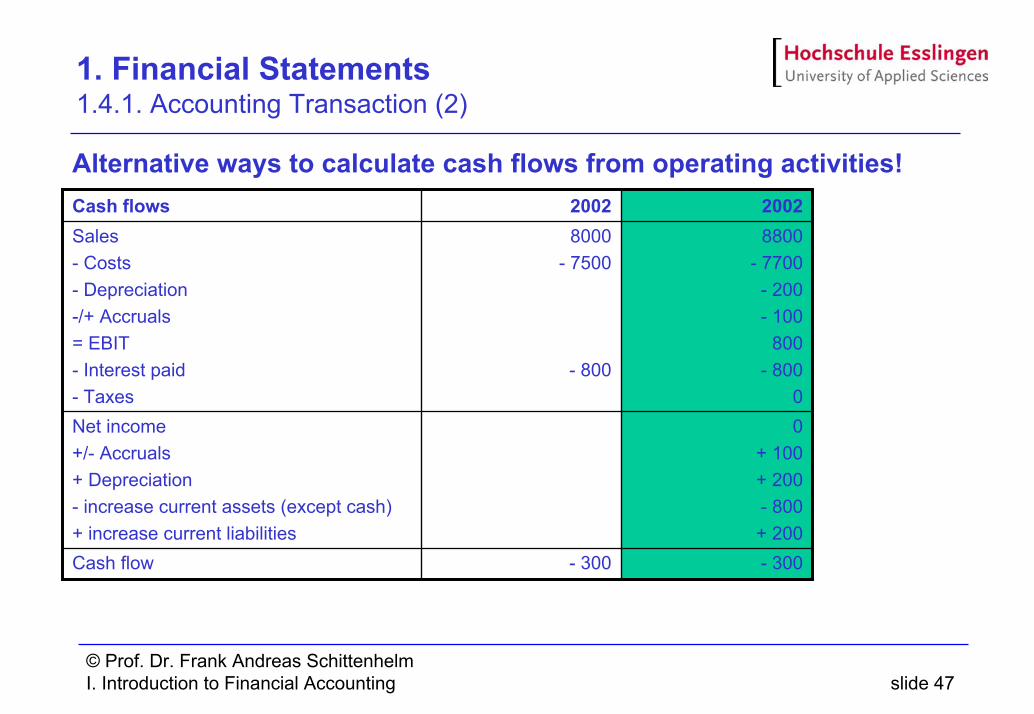
Alternative ways to calculate cash flows from operating activities!
- 300
0+ 100 + 200- 800+ 200
8800- 7700- 200- 100
800- 800
0
2002
- 300
8000- 7500
- 800
2002
Net income+/- Accruals+ Depreciation- increase current assets (except cash)+ increase current liabilitiesCash flow
Sales- Costs- Depreciation-/+ Accruals= EBIT- Interest paid- Taxes
Cash flows
© Prof. Dr. Frank Andreas SchittenhelmI. Introduction to Financial Accounting slide 48
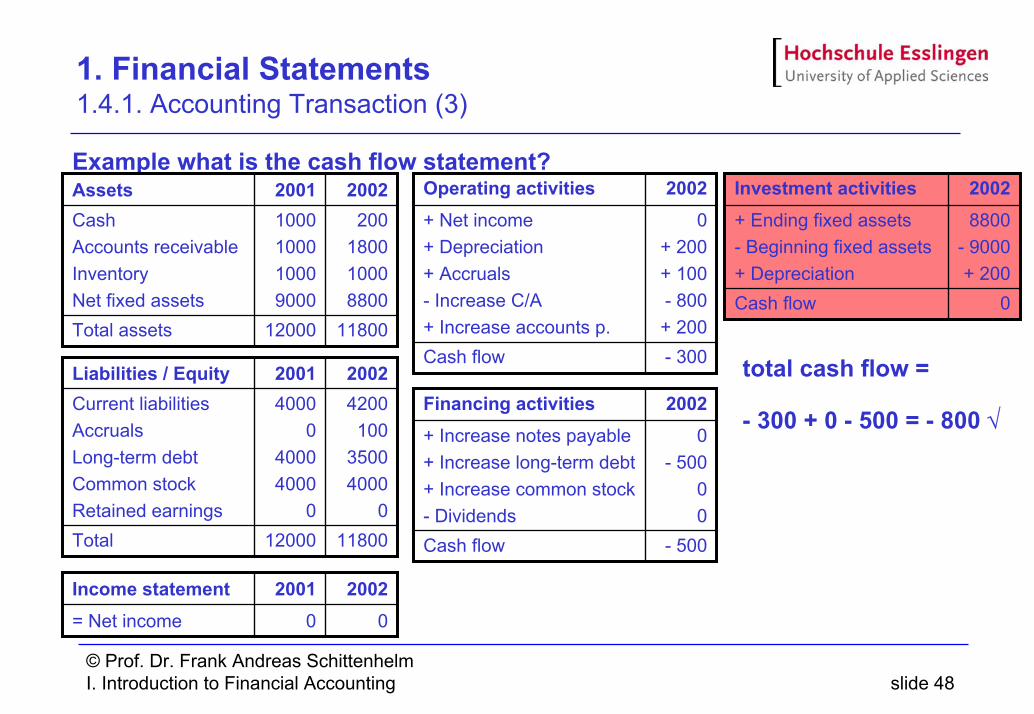
1. Financial Statements 1.4.1. Accounting Transaction (3)
Example what is the cash flow statement?
total cash flow =
- 300 + 0 - 500 = - 800 √
12000
1000100010009000
2001
11800
200180010008800
2002
Total assets
CashAccounts receivableInventoryNet fixed assets
Assets
0
20010
2002= Net income
Income statement
12000
40000
40004000
0
2001
11800
4200100
35004000
0
2002
Total
Current liabilitiesAccruals Long-term debtCommon stockRetained earnings
Liabilities / Equity- 300
0+ 200 + 100- 800+ 200
2002
Cash flow
+ Net income+ Depreciation+ Accruals- Increase C/A+ Increase accounts p.
Operating activities
0
8800- 9000+ 200
2002
Cash flow
+ Ending fixed assets- Beginning fixed assets+ Depreciation
Investment activities
- 500
0- 500
00
2002
Cash flow
+ Increase notes payable+ Increase long-term debt+ Increase common stock- Dividends
Financing activities
© Prof. Dr. Frank Andreas SchittenhelmI. Introduction to Financial Accounting slide 49
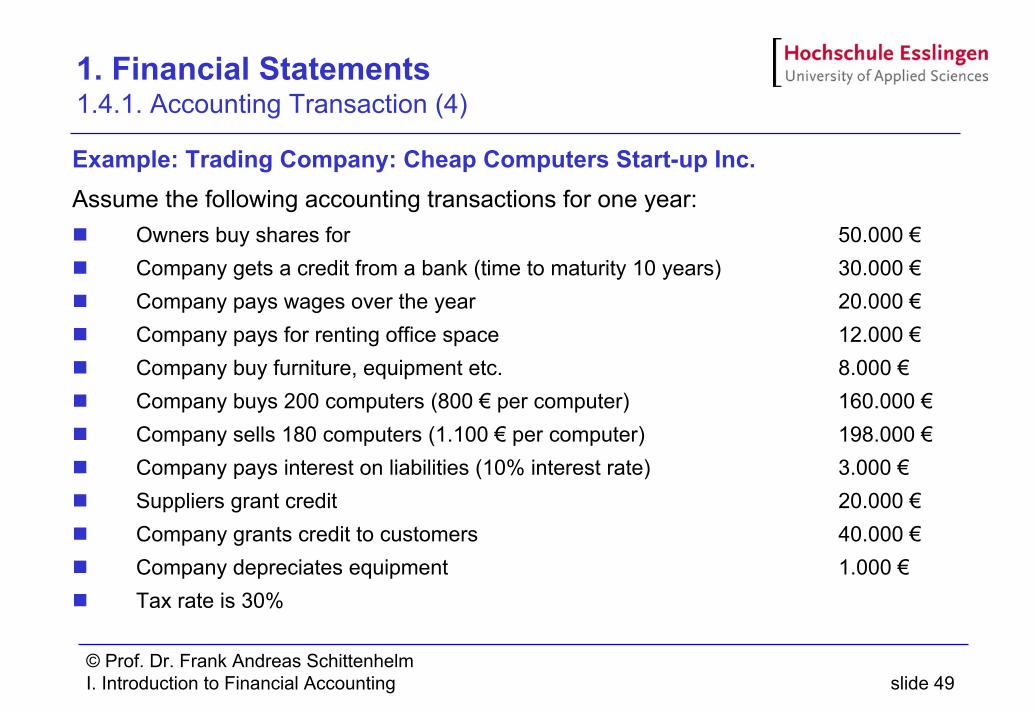
1. Financial Statements 1.4.1. Accounting Transaction (4)
Example: Trading Company: Cheap Computers Start-up Inc.Assume the following accounting transactions for one year:
Owners buy shares for 50.000 €Company gets a credit from a bank (time to maturity 10 years) 30.000 €Company pays wages over the year 20.000 €Company pays for renting office space 12.000 €Company buy furniture, equipment etc. 8.000 €Company buys 200 computers (800 € per computer) 160.000 €Company sells 180 computers (1.100 € per computer) 198.000 €Company pays interest on liabilities (10% interest rate) 3.000 €Suppliers grant credit 20.000 €Company grants credit to customers 40.000 €Company depreciates equipment 1.000 €Tax rate is 30%
© Prof. Dr. Frank Andreas SchittenhelmI. Introduction to Financial Accounting slide 50
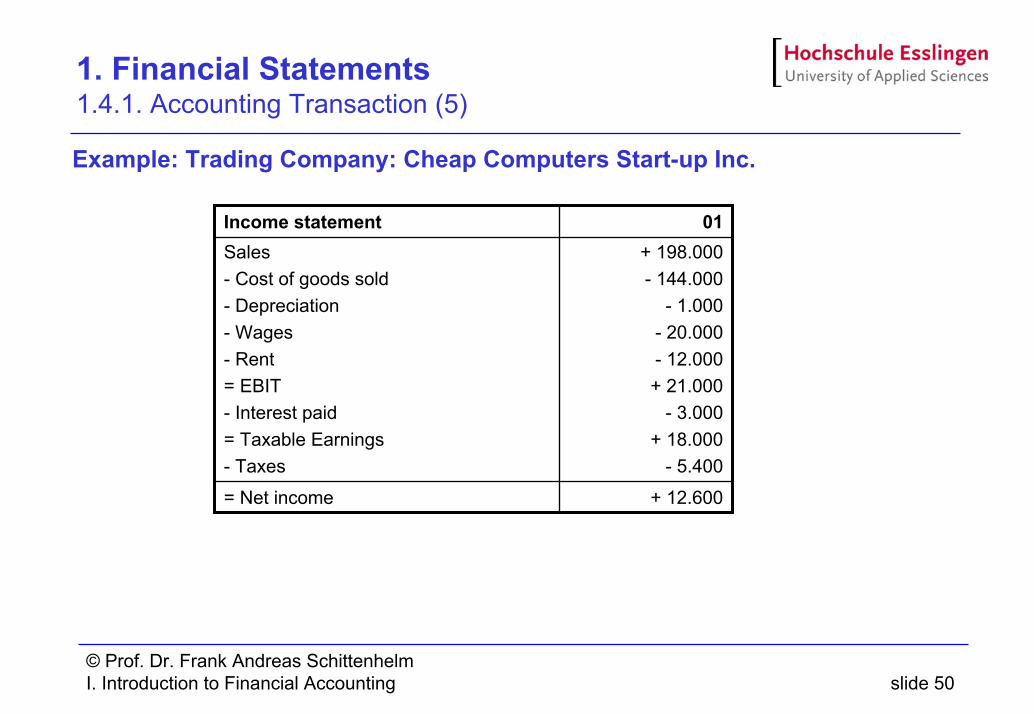
1. Financial Statements 1.4.1. Accounting Transaction (5)
Example: Trading Company: Cheap Computers Start-up Inc.
+ 12.600= Net income
+ 198.000- 144.000
- 1.000- 20.000- 12.000+ 21.000
- 3.000+ 18.000
- 5.400
Sales- Cost of goods sold- Depreciation- Wages- Rent= EBIT- Interest paid= Taxable Earnings- Taxes
01Income statement
© Prof. Dr. Frank Andreas SchittenhelmI. Introduction to Financial Accounting slide 51
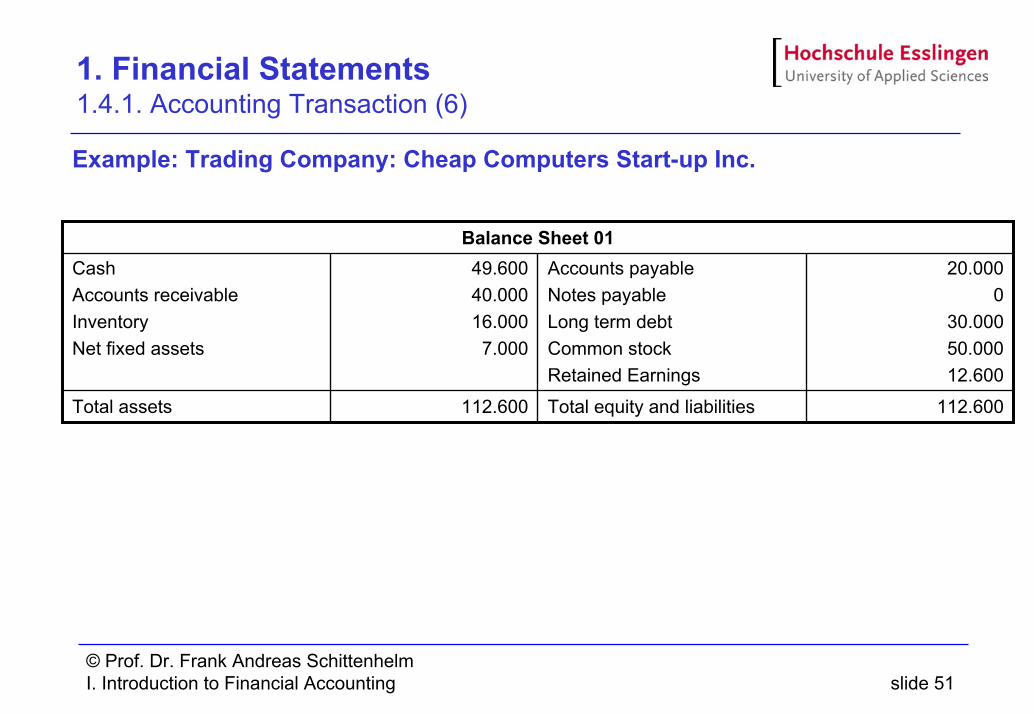
1. Financial Statements 1.4.1. Accounting Transaction (6)
Example: Trading Company: Cheap Computers Start-up Inc.
112.600Total equity and liabilities112.600Total assets
20.0000
30.000 50.00012.600
Accounts payableNotes payableLong term debtCommon stockRetained Earnings
49.600 40.00016.0007.000
CashAccounts receivableInventoryNet fixed assets
Balance Sheet 01
© Prof. Dr. Frank Andreas SchittenhelmI. Introduction to Financial Accounting slide 52
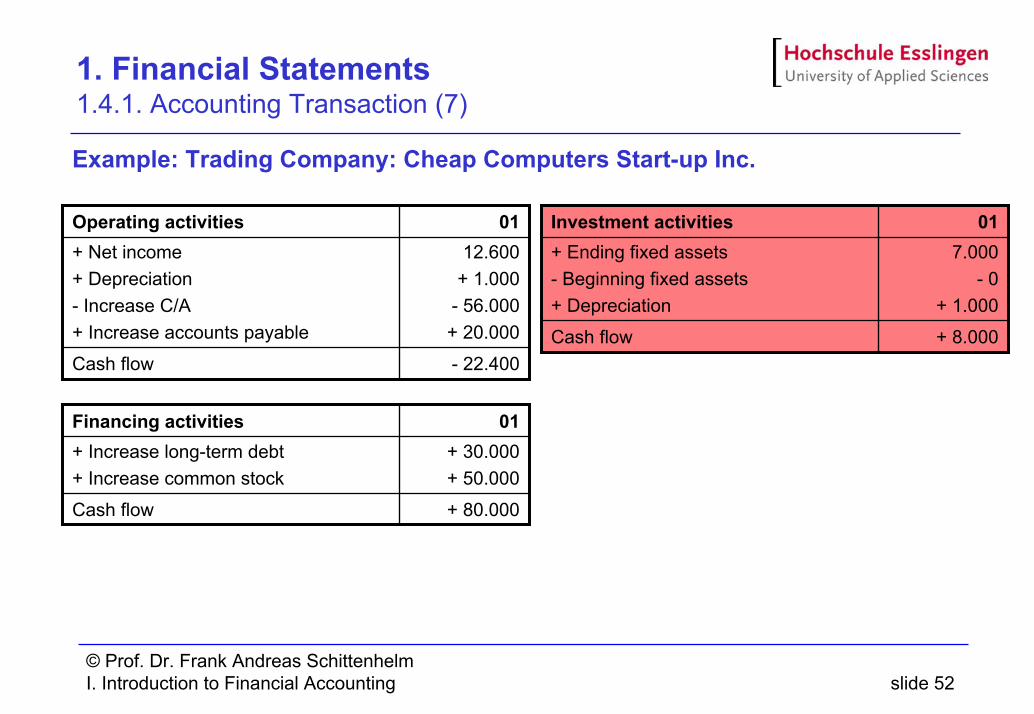
1. Financial Statements 1.4.1. Accounting Transaction (7)
Example: Trading Company: Cheap Computers Start-up Inc.
- 22.400
12.600+ 1.000
- 56.000+ 20.000
01
Cash flow
+ Net income+ Depreciation- Increase C/A+ Increase accounts payable
Operating activities
+ 8.000
7.000- 0
+ 1.000
01
Cash flow
+ Ending fixed assets- Beginning fixed assets+ Depreciation
Investment activities
+ 80.000
+ 30.000+ 50.000
01
Cash flow
+ Increase long-term debt+ Increase common stock
Financing activities
© Prof. Dr. Frank Andreas SchittenhelmI. Introduction to Financial Accounting slide 53
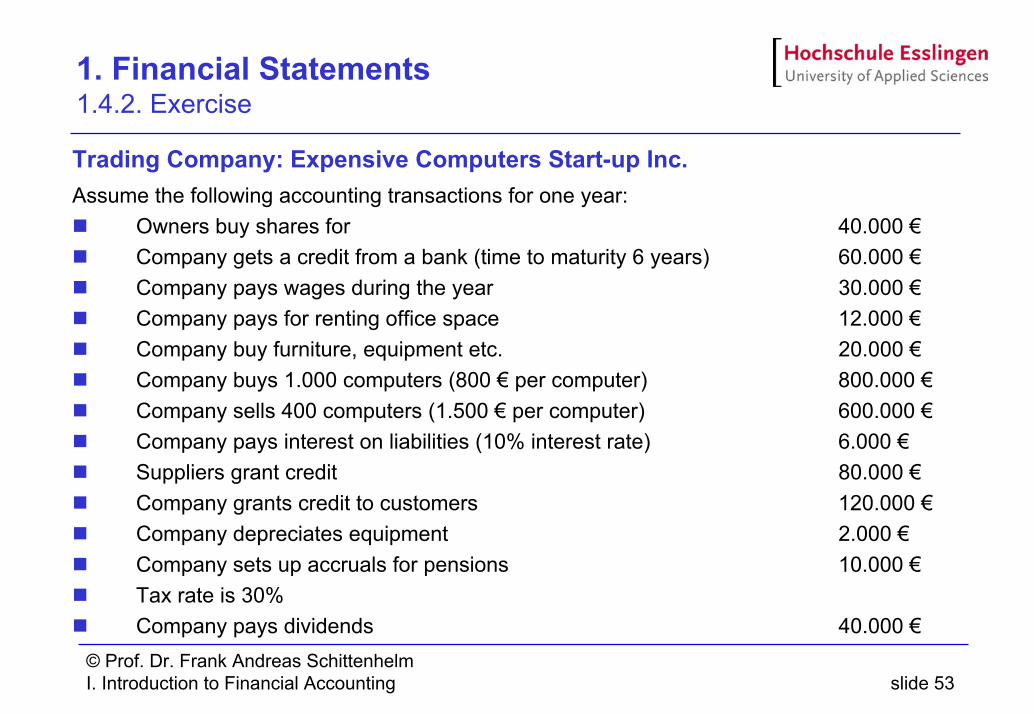
1. Financial Statements 1.4.2. Exercise
Trading Company: Expensive Computers Start-up Inc.Assume the following accounting transactions for one year:
Owners buy shares for 40.000 €Company gets a credit from a bank (time to maturity 6 years) 60.000 €Company pays wages during the year 30.000 €Company pays for renting office space 12.000 €Company buy furniture, equipment etc. 20.000 €Company buys 1.000 computers (800 € per computer) 800.000 €Company sells 400 computers (1.500 € per computer) 600.000 €Company pays interest on liabilities (10% interest rate) 6.000 €Suppliers grant credit 80.000 €Company grants credit to customers 120.000 €Company depreciates equipment 2.000 €Company sets up accruals for pensions 10.000 €Tax rate is 30%Company pays dividends 40.000 €
© Prof. Dr. Frank Andreas SchittenhelmI. Introduction to Financial Accounting slide 54
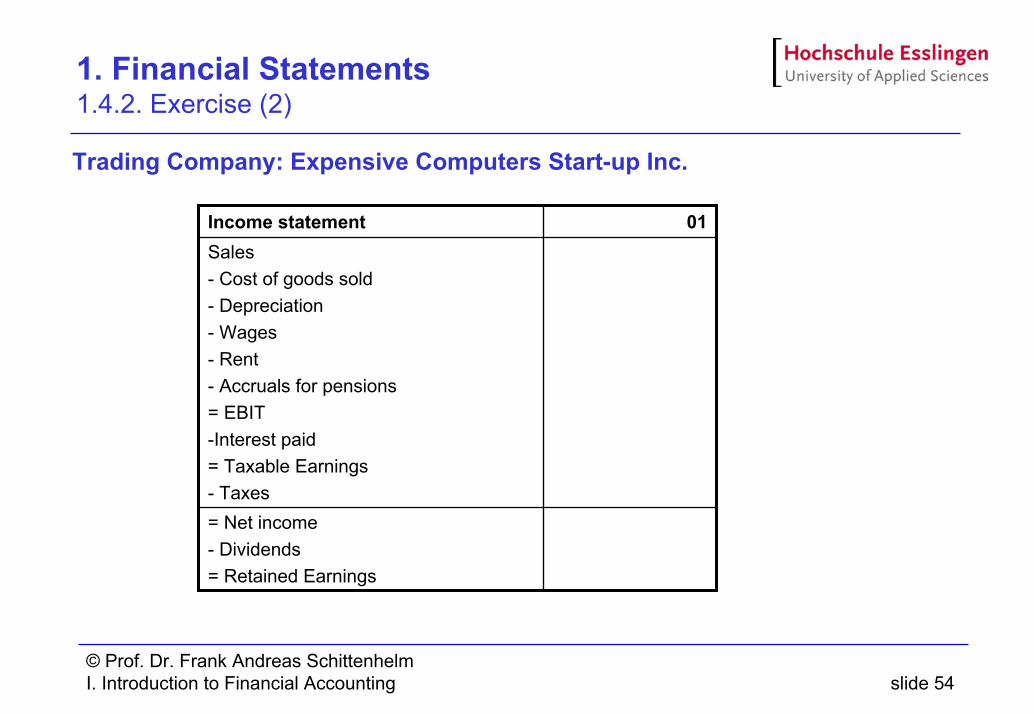
1. Financial Statements 1.4.2. Exercise (2)
Trading Company: Expensive Computers Start-up Inc.
= Net income- Dividends= Retained Earnings
Sales- Cost of goods sold- Depreciation- Wages- Rent- Accruals for pensions= EBIT-Interest paid= Taxable Earnings- Taxes
01Income statement
© Prof. Dr. Frank Andreas SchittenhelmI. Introduction to Financial Accounting slide 55
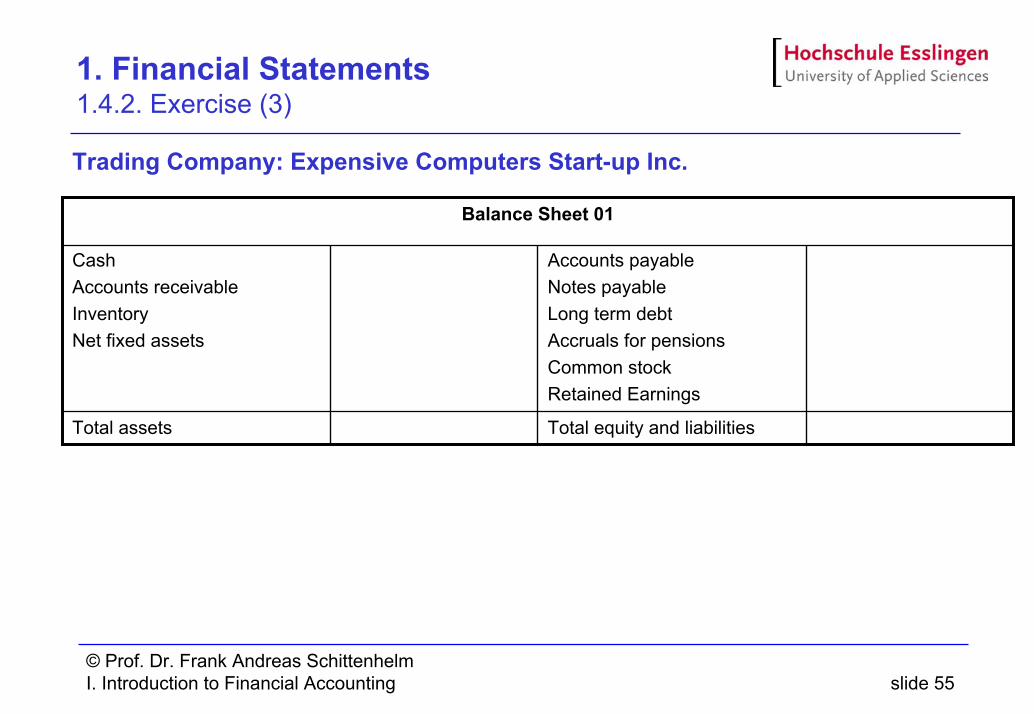
1. Financial Statements 1.4.2. Exercise (3)
Trading Company: Expensive Computers Start-up Inc.
Total equity and liabilitiesTotal assets
Accounts payableNotes payableLong term debtAccruals for pensionsCommon stockRetained Earnings
CashAccounts receivableInventoryNet fixed assets
Balance Sheet 01
© Prof. Dr. Frank Andreas SchittenhelmI. Introduction to Financial Accounting slide 56
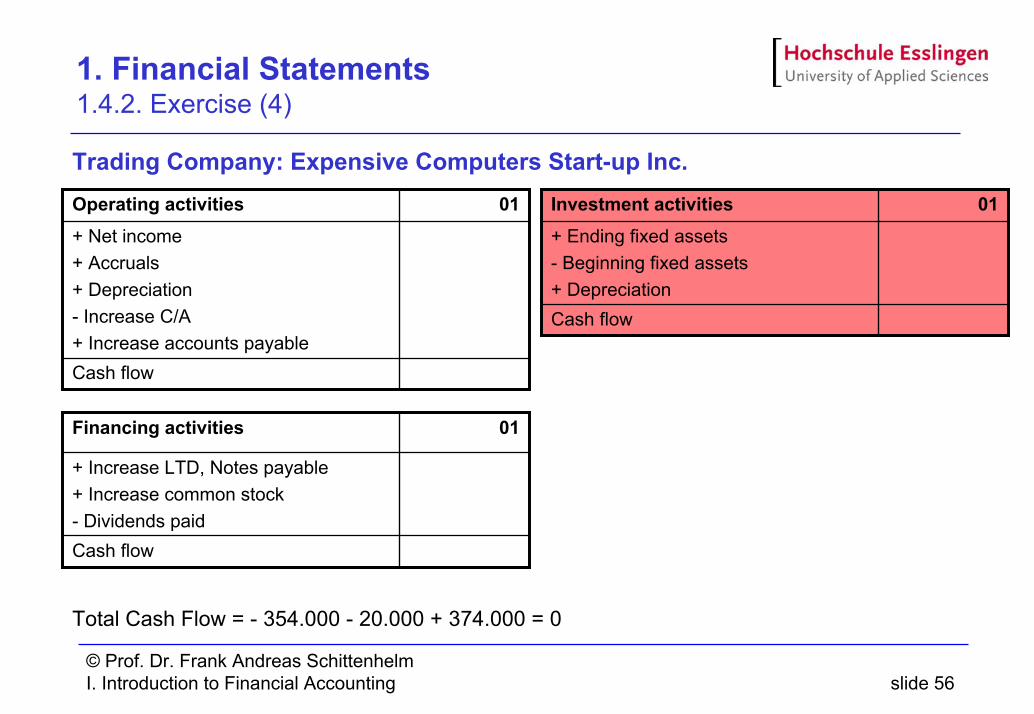
1. Financial Statements 1.4.2. Exercise (4)
Trading Company: Expensive Computers Start-up Inc.
Total Cash Flow = - 354.000 - 20.000 + 374.000 = 0
01
Cash flow
+ Net income+ Accruals+ Depreciation- Increase C/A+ Increase accounts payable
Operating activities 01
Cash flow
+ Ending fixed assets- Beginning fixed assets+ Depreciation
Investment activities
01
Cash flow
+ Increase LTD, Notes payable+ Increase common stock- Dividends paid
Financing activities
© Prof. Dr. Frank Andreas SchittenhelmI. Introduction to Financial Accounting slide 57
2. Specific Balance Sheet Items
Contents2.1. Inventory
2.1.1. Inventory Costing Methods2.1.2. Example2.1.3. Exercise
2.2. Fixed Assets2.2.1. Depreciation2.2.2. Example2.2.3. Exercise
2.3. Accruals2.3.1. Accruals for Pensions2.3.2. Example2.3.3. Exercise
© Prof. Dr. Frank Andreas SchittenhelmI. Introduction to Financial Accounting slide 58
2. Specific Balance Sheet Items 2.1. Inventory
Definition:Goods owned by a business and held either for
Use in the manufacture of productsProducts awaiting sale
Inventories are classified as1. Merchandise inventory: goods purchased for resale2. Manufacturing inventory
Raw materials: goods obtained for direct use in the manufactureWork in progress: goods requiring further processingFinished goods: manufactured items held for saleManufacturing supplies, e.g. cleaning materials
3. Miscellaneous inventory, e.g. office supplies
© Prof. Dr. Frank Andreas SchittenhelmI. Introduction to Financial Accounting slide 59
2. Specific Balance Sheet Items 2.1. Inventory (2)
Inventories are an important asset to most businesses.Inventories represent typically the largest current asset of manufacturing and retail companies
To consider:Adequate inventory levels are important to companies in assuring production schedules and meeting customer requirementsHolding inventories at the same time is costly
just-in-time production
© Prof. Dr. Frank Andreas SchittenhelmI. Introduction to Financial Accounting slide 60
2. Specific Balance Sheet Items 2.1. Inventory (3)
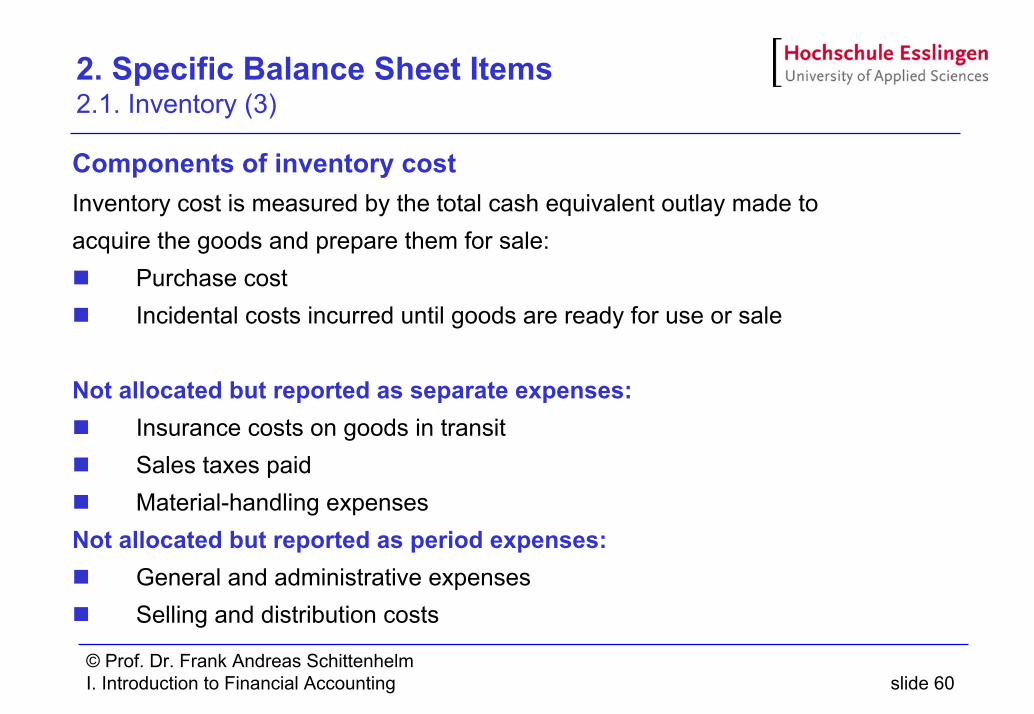
Components of inventory costInventory cost is measured by the total cash equivalent outlay made to acquire the goods and prepare them for sale:
Purchase costIncidental costs incurred until goods are ready for use or sale
Not allocated but reported as separate expenses:Insurance costs on goods in transitSales taxes paidMaterial-handling expenses
Not allocated but reported as period expenses:General and administrative expensesSelling and distribution costs
© Prof. Dr. Frank Andreas SchittenhelmI. Introduction to Financial Accounting slide 61
2. Specific Balance Sheet Items 2.1. Inventory (4)
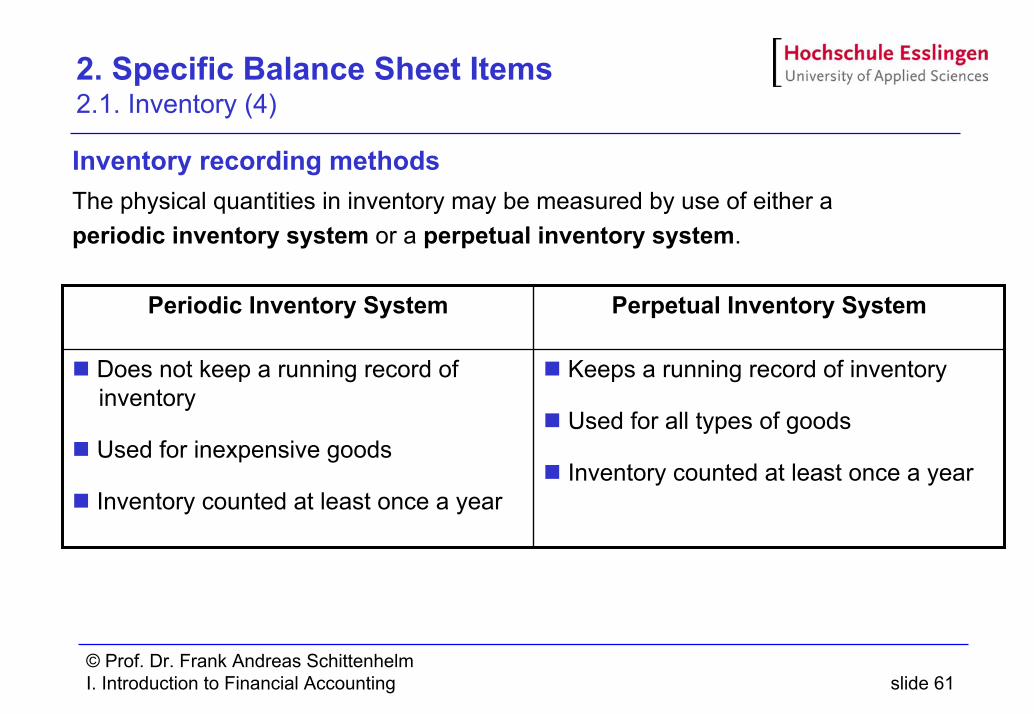
Inventory recording methodsThe physical quantities in inventory may be measured by use of either a periodic inventory system or a perpetual inventory system.
Keeps a running record of inventory
Used for all types of goods
Inventory counted at least once a year
Does not keep a running record of inventory
Used for inexpensive goods
Inventory counted at least once a year
Perpetual Inventory SystemPeriodic Inventory System
© Prof. Dr. Frank Andreas SchittenhelmI. Introduction to Financial Accounting slide 62
2. Specific Balance Sheet Items 2.1. Inventory (5)
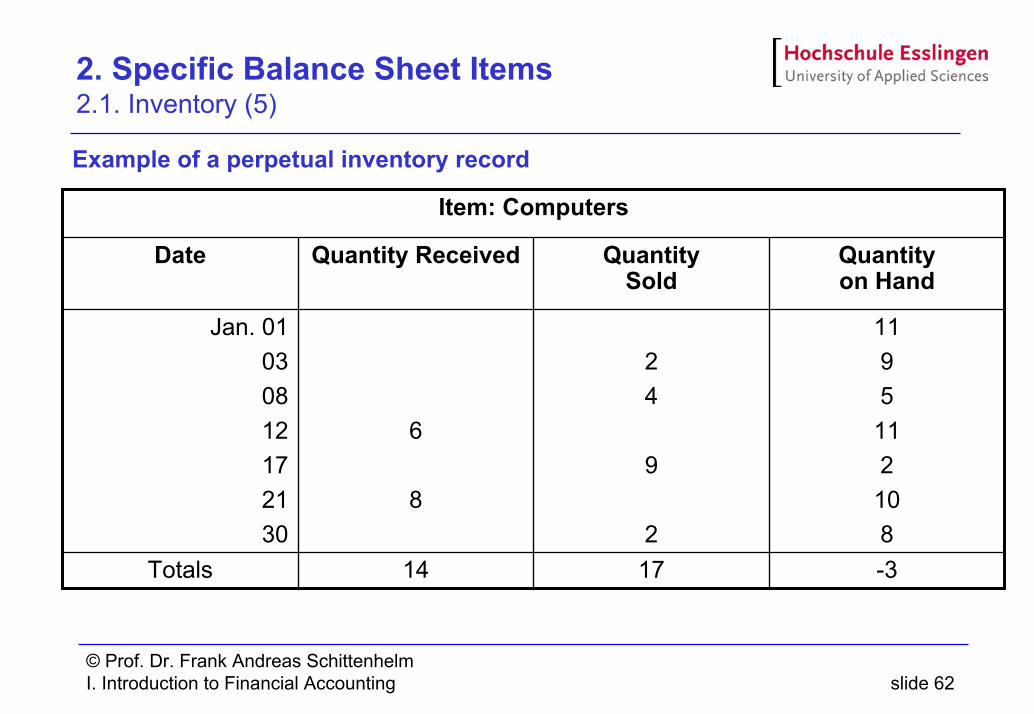
Example of a perpetual inventory record
-31714Totals
1195112108
24
9
2
6
8
Jan. 01030812172130
Quantityon Hand
QuantitySold
Quantity ReceivedDate
Item: Computers
© Prof. Dr. Frank Andreas SchittenhelmI. Introduction to Financial Accounting slide 63
2. Specific Balance Sheet Items 2.1.1. Inventory Costing Methods
General problemThe unit cost of inventory often changesHow can an accountant assign a cost to each item sold?
The four costing methods e.g. GAAP allows are:1. Specific unit cost2. Weighted-average cost3. First-in, first-out (FIFO) cost4. Last-in, first-out (LIFO) cost
© Prof. Dr. Frank Andreas SchittenhelmI. Introduction to Financial Accounting slide 64
2. Specific Balance Sheet Items 2.1.1. Inventory Costing Methods (2)
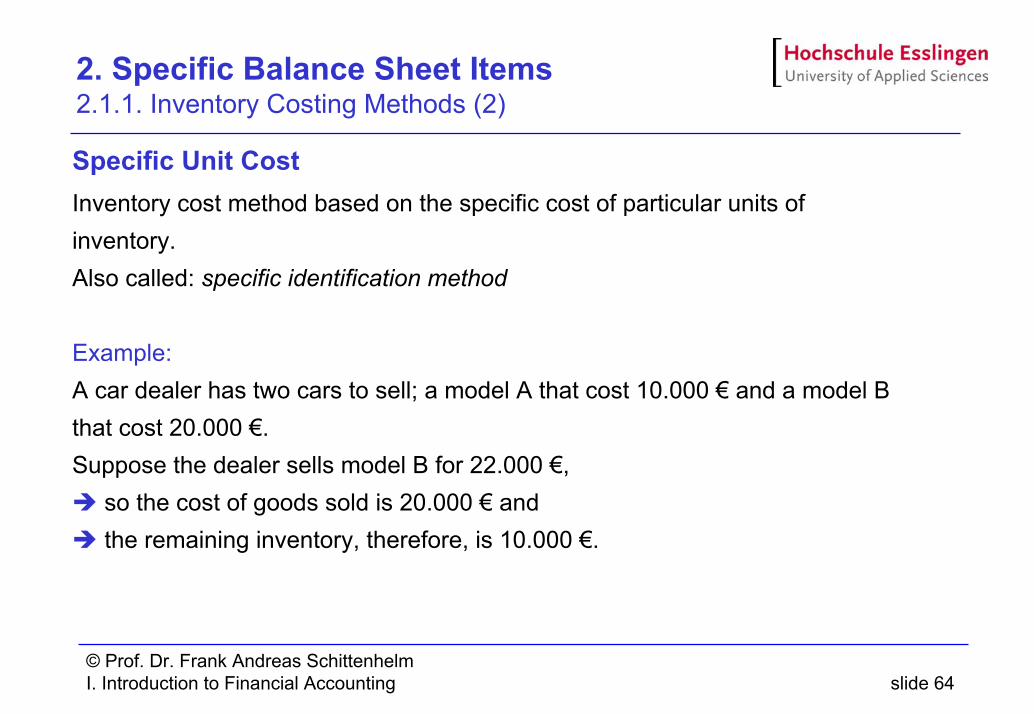
Specific Unit CostInventory cost method based on the specific cost of particular units of inventory.Also called: specific identification method
Example:A car dealer has two cars to sell; a model A that cost 10.000 € and a model B that cost 20.000 €. Suppose the dealer sells model B for 22.000 €,
so the cost of goods sold is 20.000 € andthe remaining inventory, therefore, is 10.000 €.
© Prof. Dr. Frank Andreas SchittenhelmI. Introduction to Financial Accounting slide 65
2. Specific Balance Sheet Items 2.1.1. Inventory Costing Methods (3)
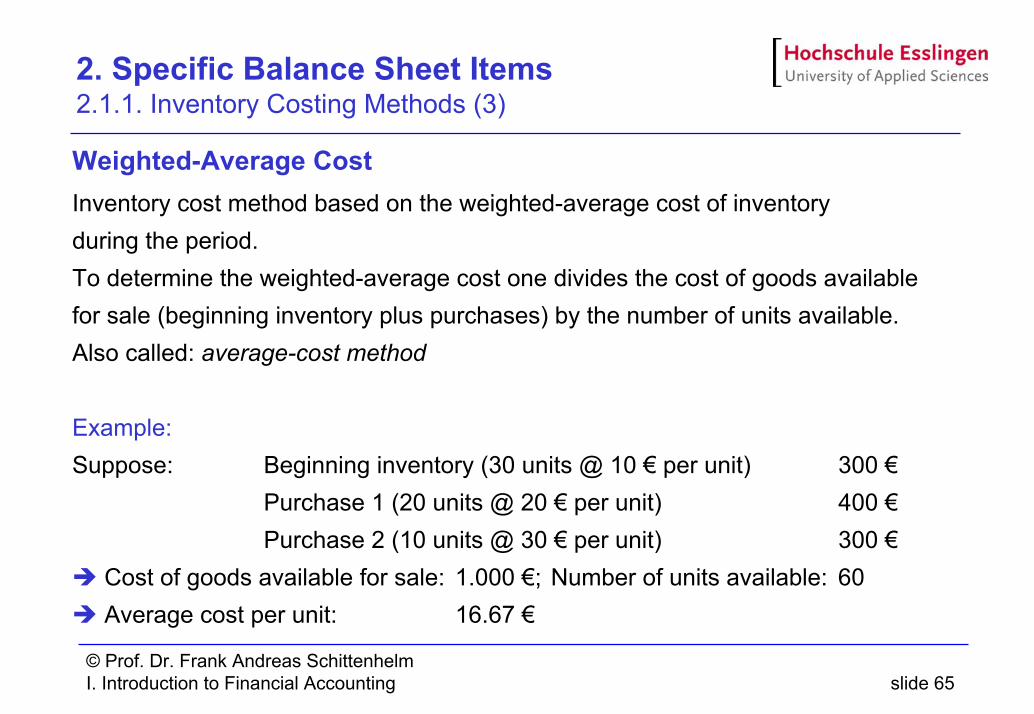
Weighted-Average CostInventory cost method based on the weighted-average cost of inventory during the period.To determine the weighted-average cost one divides the cost of goods available for sale (beginning inventory plus purchases) by the number of units available.Also called: average-cost method
Example:Suppose: Beginning inventory (30 units @ 10 € per unit) 300 €
Purchase 1 (20 units @ 20 € per unit) 400 €Purchase 2 (10 units @ 30 € per unit) 300 €
Cost of goods available for sale: 1.000 €; Number of units available: 60Average cost per unit: 16.67 €
© Prof. Dr. Frank Andreas SchittenhelmI. Introduction to Financial Accounting slide 66
2. Specific Balance Sheet Items 2.1.1. Inventory Costing Methods (4)
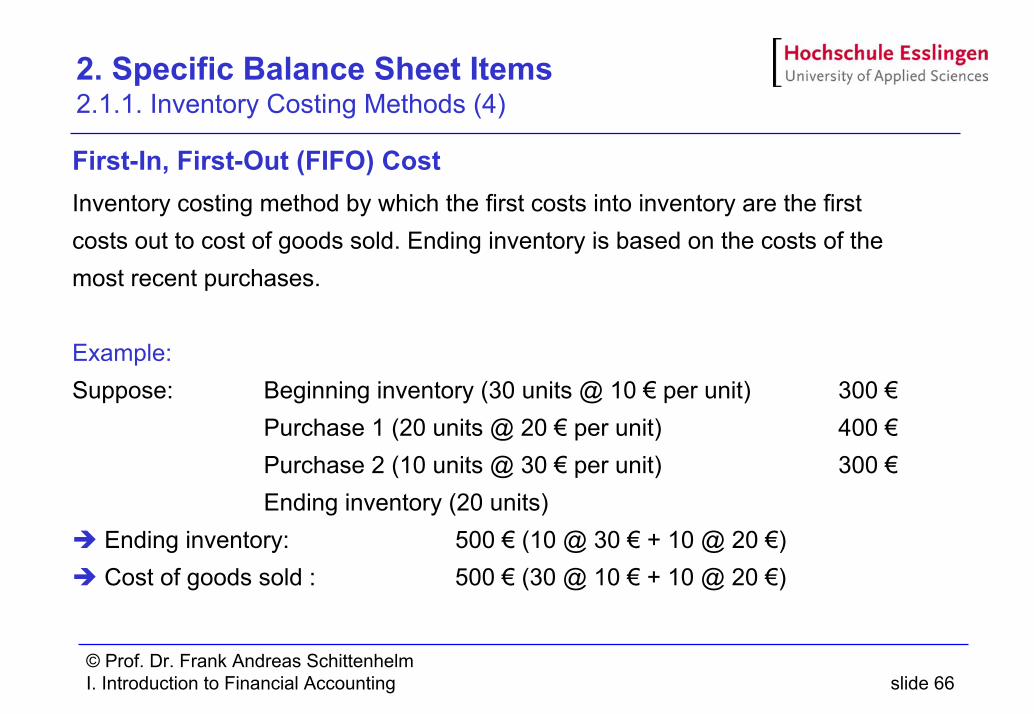
First-In, First-Out (FIFO) CostInventory costing method by which the first costs into inventory are the first costs out to cost of goods sold. Ending inventory is based on the costs of the most recent purchases.
Example:Suppose: Beginning inventory (30 units @ 10 € per unit) 300 €
Purchase 1 (20 units @ 20 € per unit) 400 €Purchase 2 (10 units @ 30 € per unit) 300 €Ending inventory (20 units)
Ending inventory: 500 € (10 @ 30 € + 10 @ 20 €)Cost of goods sold : 500 € (30 @ 10 € + 10 @ 20 €)
© Prof. Dr. Frank Andreas SchittenhelmI. Introduction to Financial Accounting slide 67
2. Specific Balance Sheet Items 2.1.1. Inventory Costing Methods (5)
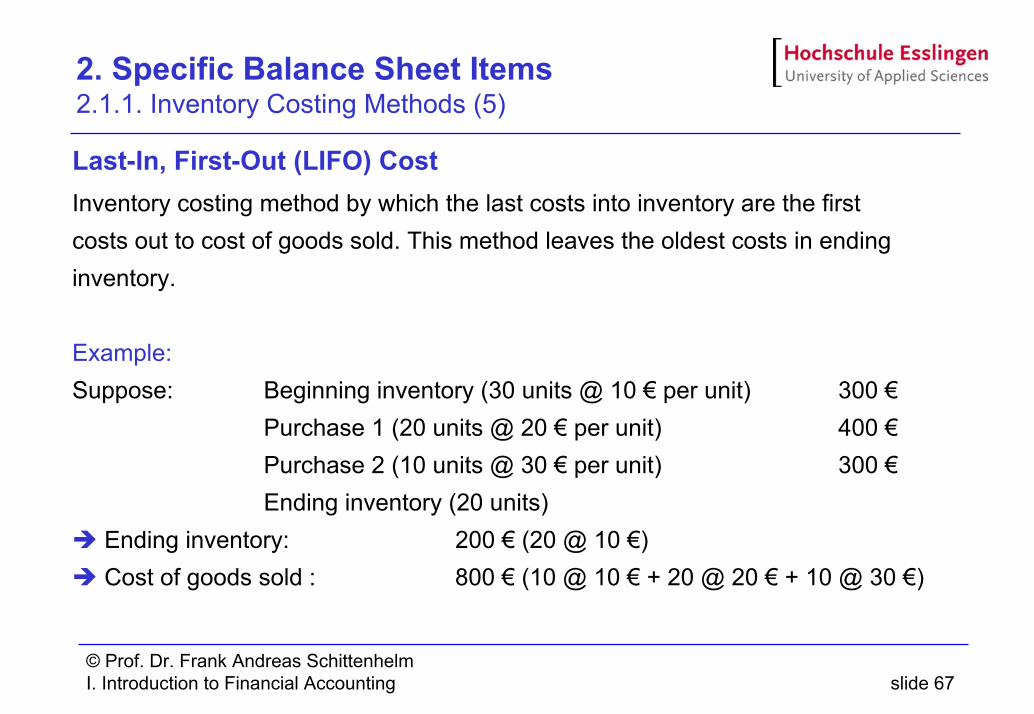
Last-In, First-Out (LIFO) CostInventory costing method by which the last costs into inventory are the first costs out to cost of goods sold. This method leaves the oldest costs in ending inventory.
Example:Suppose: Beginning inventory (30 units @ 10 € per unit) 300 €
Purchase 1 (20 units @ 20 € per unit) 400 €Purchase 2 (10 units @ 30 € per unit) 300 €Ending inventory (20 units)
Ending inventory: 200 € (20 @ 10 €)Cost of goods sold : 800 € (10 @ 10 € + 20 @ 20 € + 10 @ 30 €)
© Prof. Dr. Frank Andreas SchittenhelmI. Introduction to Financial Accounting slide 68
2. Specific Balance Sheet Items 2.1.1. Inventory Costing Methods (6)
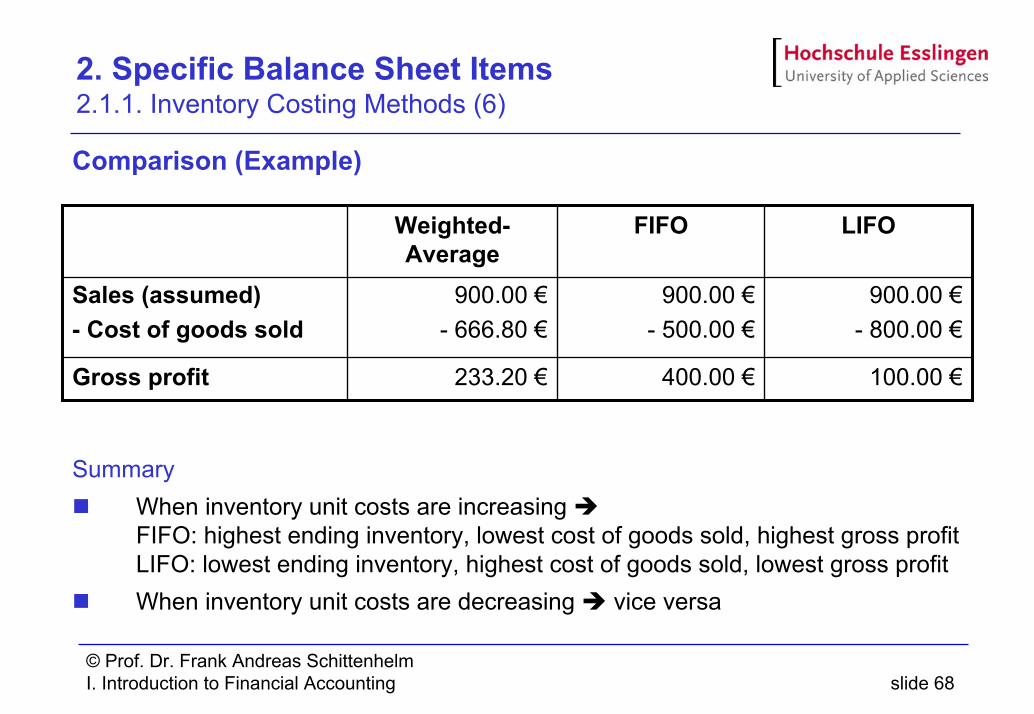
Comparison (Example)
SummaryWhen inventory unit costs are increasing FIFO: highest ending inventory, lowest cost of goods sold, highest gross profitLIFO: lowest ending inventory, highest cost of goods sold, lowest gross profitWhen inventory unit costs are decreasing vice versa
100.00 €400.00 €233.20 €Gross profit
900.00 €- 800.00 €
900.00 €- 500.00 €
900.00 €- 666.80 €
Sales (assumed)- Cost of goods sold
LIFOFIFOWeighted-Average
© Prof. Dr. Frank Andreas SchittenhelmI. Introduction to Financial Accounting slide 69
2. Specific Balance Sheet Items 2.1.1. Inventory Costing Methods (7)
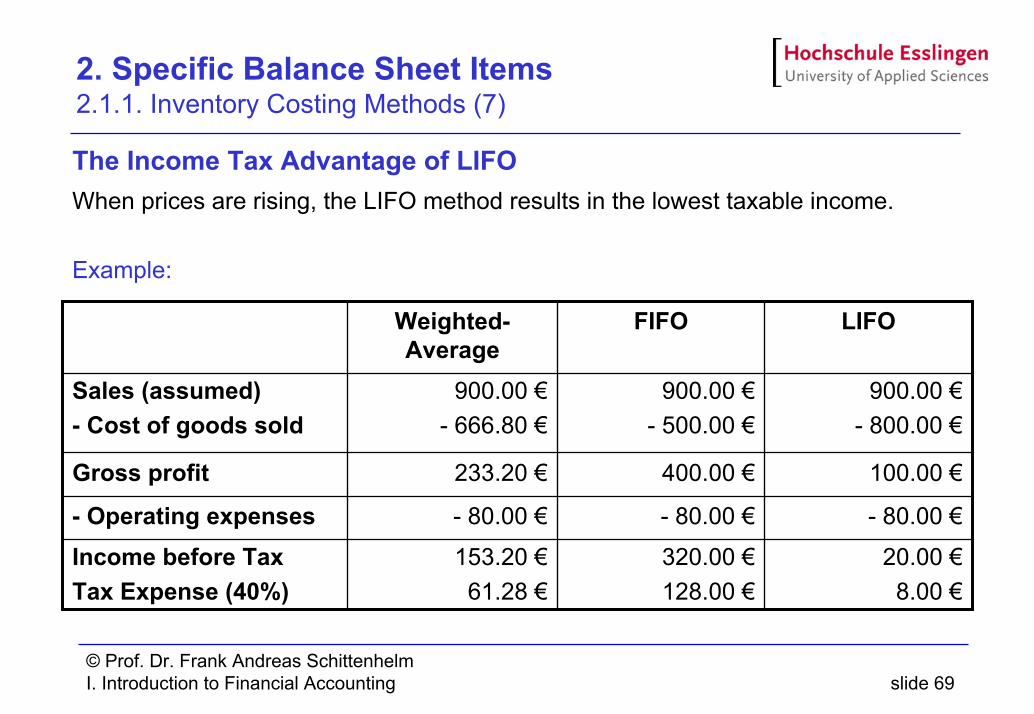
The Income Tax Advantage of LIFOWhen prices are rising, the LIFO method results in the lowest taxable income.
Example:
100.00 €400.00 €233.20 €Gross profit
- 80.00 €- 80.00 €- 80.00 €- Operating expenses20.00 €8.00 €
320.00 €128.00 €
153.20 €61.28 €
Income before TaxTax Expense (40%)
900.00 €- 800.00 €
900.00 €- 500.00 €
900.00 €- 666.80 €
Sales (assumed)- Cost of goods sold
LIFOFIFOWeighted-Average
© Prof. Dr. Frank Andreas SchittenhelmI. Introduction to Financial Accounting slide 70
2. Specific Balance Sheet Items 2.1.2. Example
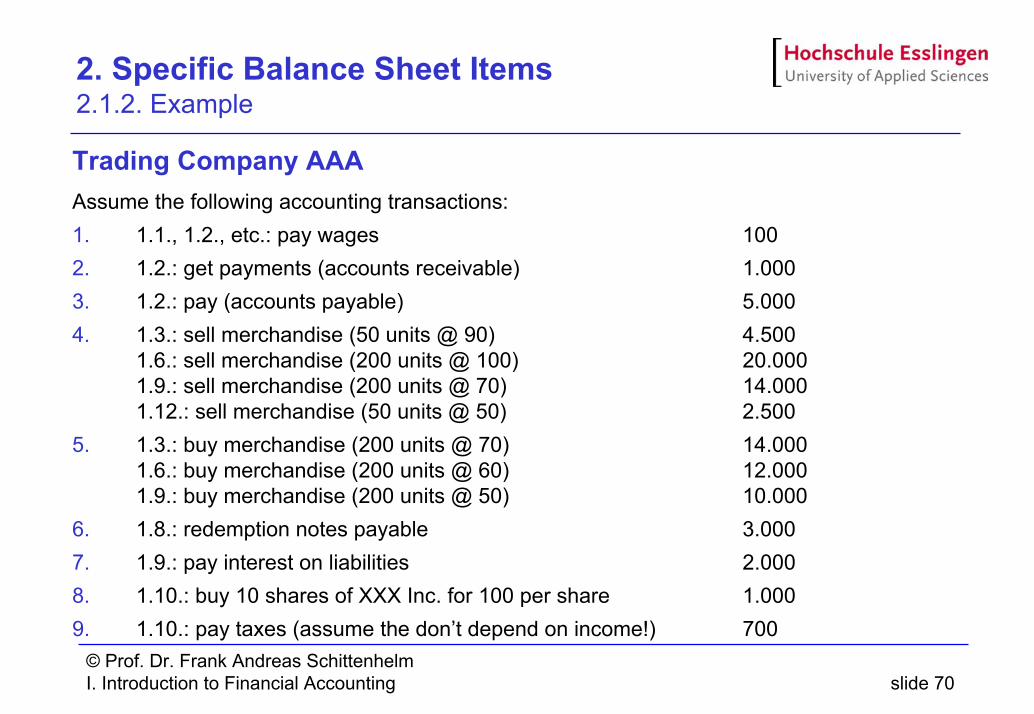
Trading Company AAAAssume the following accounting transactions:1. 1.1., 1.2., etc.: pay wages 1002. 1.2.: get payments (accounts receivable) 1.0003. 1.2.: pay (accounts payable) 5.0004. 1.3.: sell merchandise (50 units @ 90) 4.500
1.6.: sell merchandise (200 units @ 100) 20.0001.9.: sell merchandise (200 units @ 70) 14.0001.12.: sell merchandise (50 units @ 50) 2.500
5. 1.3.: buy merchandise (200 units @ 70) 14.0001.6.: buy merchandise (200 units @ 60) 12.0001.9.: buy merchandise (200 units @ 50) 10.000
6. 1.8.: redemption notes payable 3.0007. 1.9.: pay interest on liabilities 2.0008. 1.10.: buy 10 shares of XXX Inc. for 100 per share 1.0009. 1.10.: pay taxes (assume the don’t depend on income!) 700
© Prof. Dr. Frank Andreas SchittenhelmI. Introduction to Financial Accounting slide 71
2. Specific Balance Sheet Items 2.1.2. Example (2)
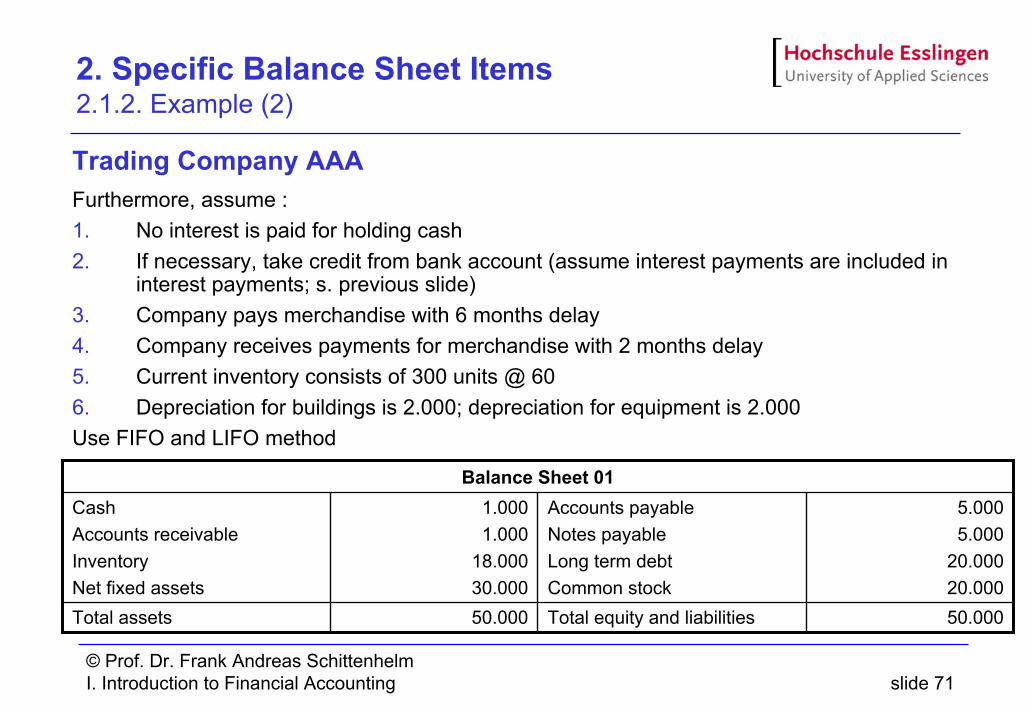
Trading Company AAAFurthermore, assume :1. No interest is paid for holding cash2. If necessary, take credit from bank account (assume interest payments are included in
interest payments; s. previous slide)3. Company pays merchandise with 6 months delay4. Company receives payments for merchandise with 2 months delay5. Current inventory consists of 300 units @ 606. Depreciation for buildings is 2.000; depreciation for equipment is 2.000Use FIFO and LIFO method
50.000Total equity and liabilities50.000Total assets
5.0005.000
20.000 20.000
Accounts payableNotes payableLong term debtCommon stock
1.0001.000
18.00030.000
CashAccounts receivableInventoryNet fixed assets
Balance Sheet 01
© Prof. Dr. Frank Andreas SchittenhelmI. Introduction to Financial Accounting slide 72
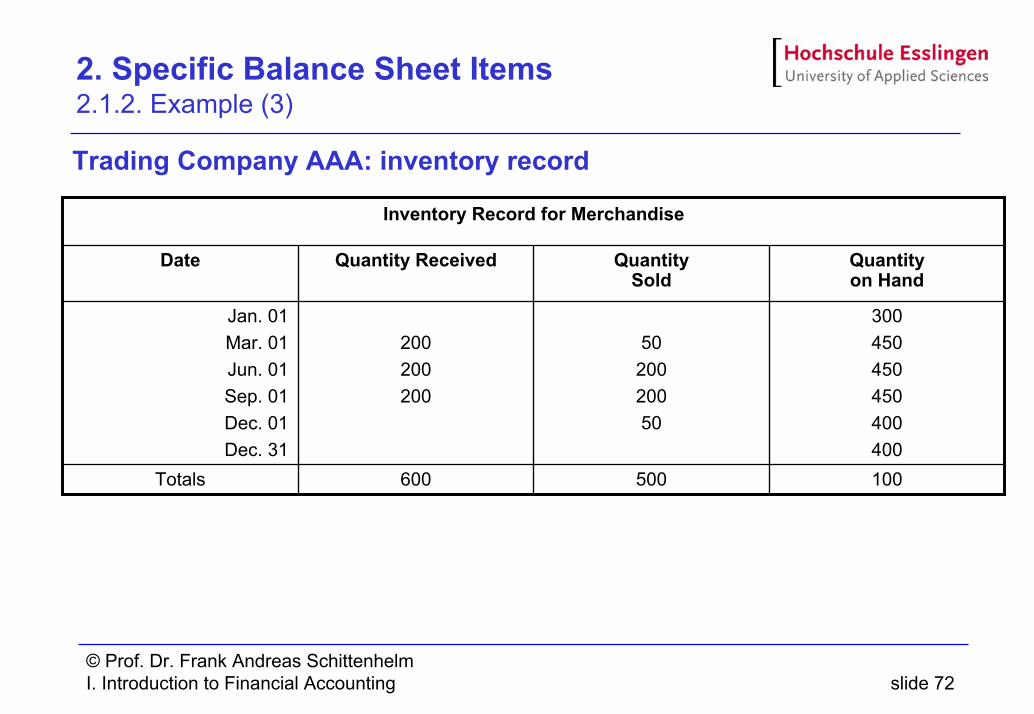
2. Specific Balance Sheet Items 2.1.2. Example (3)
Trading Company AAA: inventory record
100500600Totals
300450450450400400
5020020050
200200200
Jan. 01Mar. 01Jun. 01Sep. 01Dec. 01Dec. 31
Quantityon Hand
QuantitySold
Quantity ReceivedDate
Inventory Record for Merchandise
© Prof. Dr. Frank Andreas SchittenhelmI. Introduction to Financial Accounting slide 73
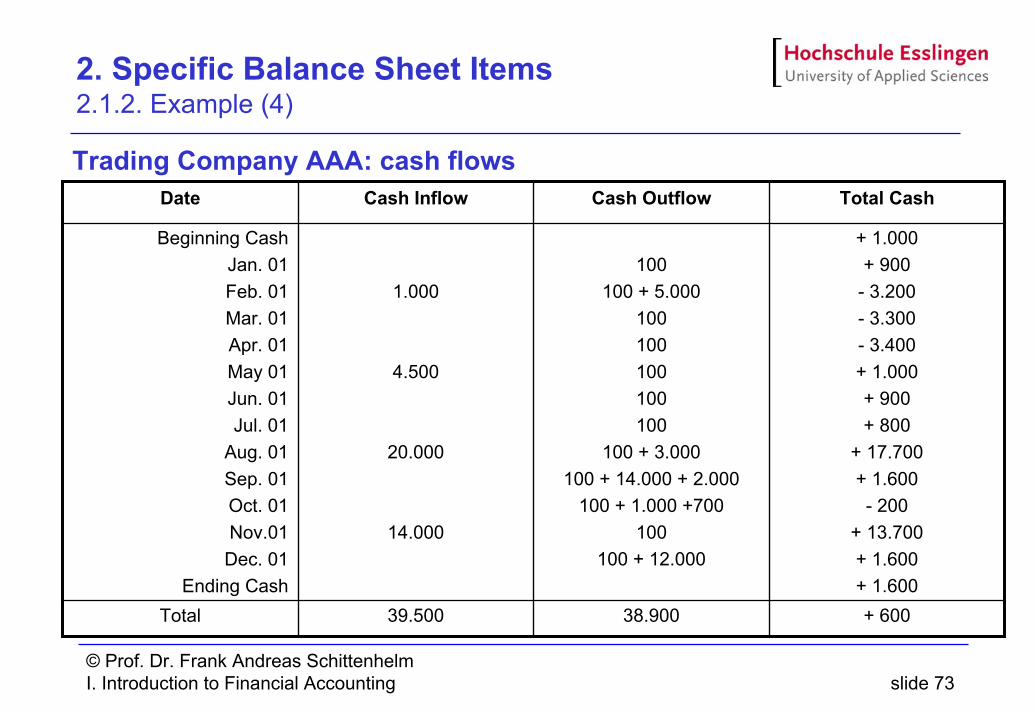
2. Specific Balance Sheet Items 2.1.2. Example (4)
Trading Company AAA: cash flows
+ 60038.90039.500Total
+ 1.000+ 900
- 3.200- 3.300- 3.400+ 1.000+ 900+ 800
+ 17.700+ 1.600- 200
+ 13.700+ 1.600+ 1.600
100100 + 5.000
100100100100100
100 + 3.000100 + 14.000 + 2.000
100 + 1.000 +700100
100 + 12.000
1.000
4.500
20.000
14.000
Beginning CashJan. 01Feb. 01Mar. 01Apr. 01May 01Jun. 01Jul. 01
Aug. 01Sep. 01Oct. 01Nov.01Dec. 01
Ending Cash
Total CashCash OutflowCash InflowDate
© Prof. Dr. Frank Andreas SchittenhelmI. Introduction to Financial Accounting slide 74
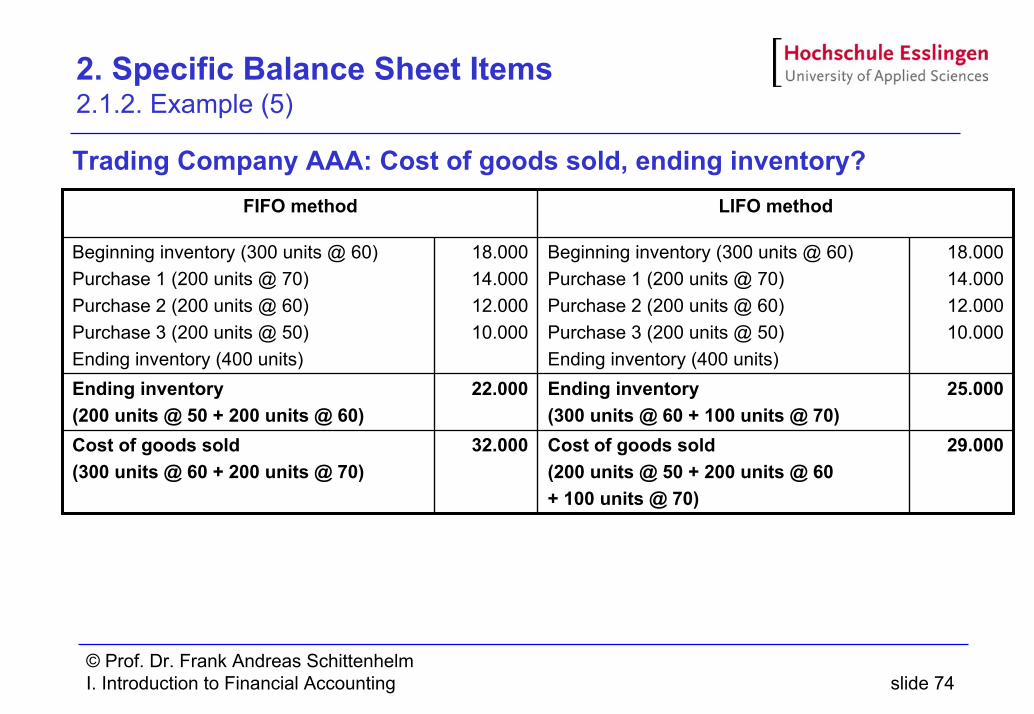
2. Specific Balance Sheet Items 2.1.2. Example (5)
Trading Company AAA: Cost of goods sold, ending inventory?
25.000Ending inventory(300 units @ 60 + 100 units @ 70)
22.000Ending inventory(200 units @ 50 + 200 units @ 60)
LIFO methodFIFO method
29.000Cost of goods sold(200 units @ 50 + 200 units @ 60+ 100 units @ 70)
32.000Cost of goods sold(300 units @ 60 + 200 units @ 70)
18.00014.00012.00010.000
Beginning inventory (300 units @ 60)Purchase 1 (200 units @ 70)Purchase 2 (200 units @ 60)Purchase 3 (200 units @ 50)Ending inventory (400 units)
18.00014.00012.00010.000
Beginning inventory (300 units @ 60)Purchase 1 (200 units @ 70)Purchase 2 (200 units @ 60)Purchase 3 (200 units @ 50)Ending inventory (400 units)
© Prof. Dr. Frank Andreas SchittenhelmI. Introduction to Financial Accounting slide 75
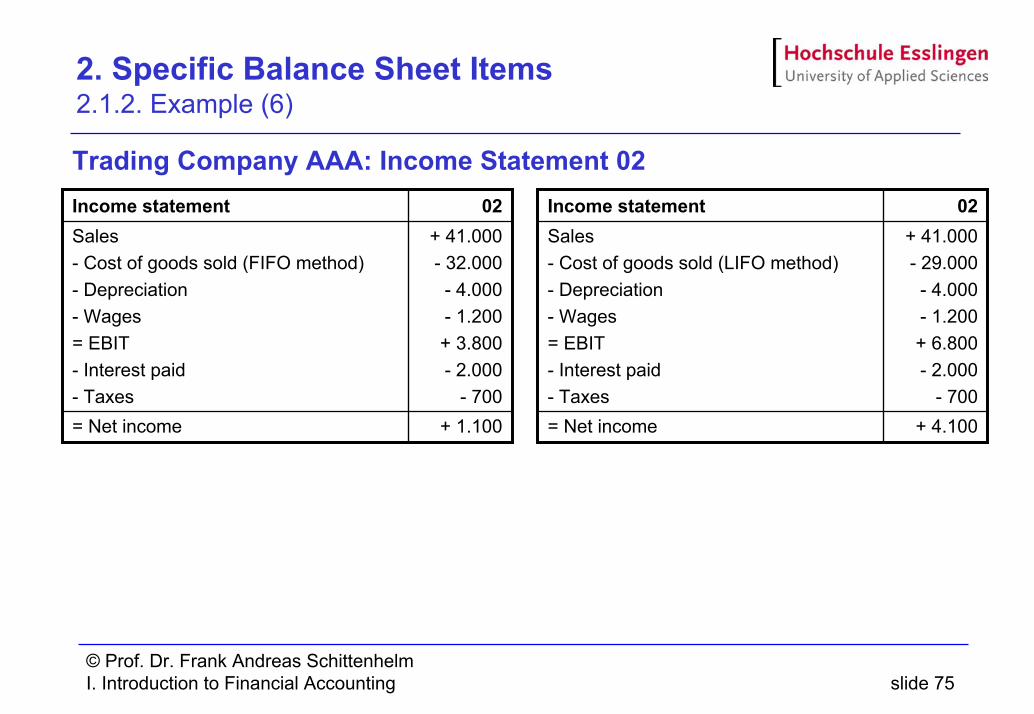
2. Specific Balance Sheet Items 2.1.2. Example (6)
Trading Company AAA: Income Statement 02
+ 1.100= Net income
+ 41.000- 32.000- 4.000- 1.200+ 3.800- 2.000
- 700
Sales- Cost of goods sold (FIFO method)- Depreciation- Wages= EBIT- Interest paid- Taxes
02Income statement
+ 4.100= Net income
+ 41.000- 29.000- 4.000- 1.200+ 6.800- 2.000
- 700
Sales- Cost of goods sold (LIFO method)- Depreciation- Wages= EBIT- Interest paid- Taxes
02Income statement
© Prof. Dr. Frank Andreas SchittenhelmI. Introduction to Financial Accounting slide 76
2. Specific Balance Sheet Items 2.1.2. Example (7)
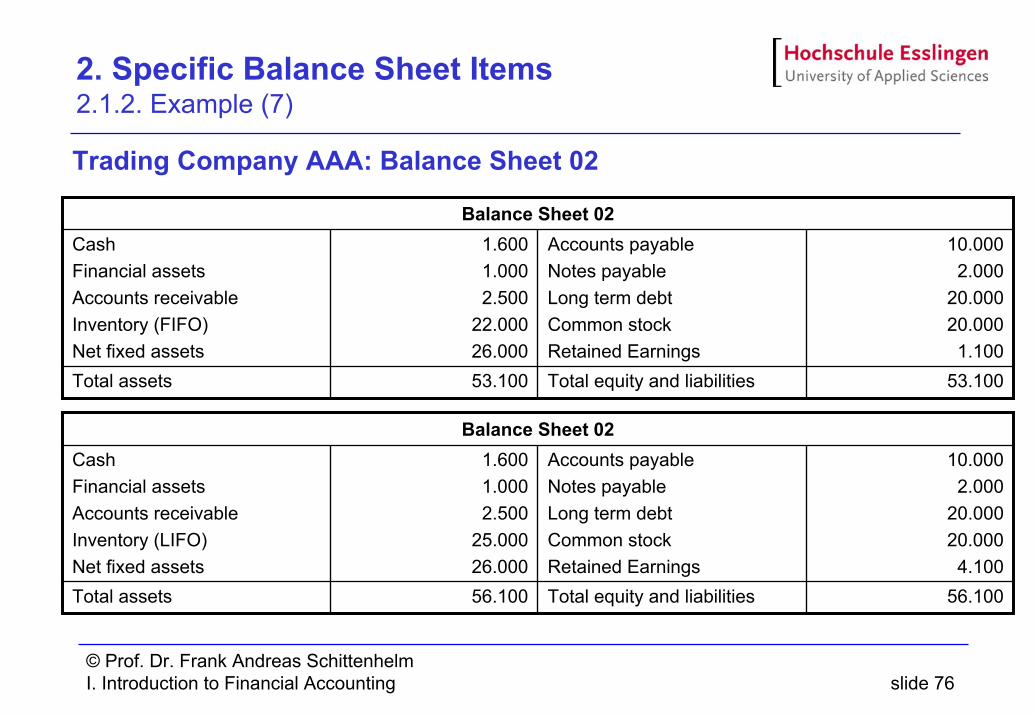
Trading Company AAA: Balance Sheet 02
53.100Total equity and liabilities53.100Total assets
10.0002.000
20.000 20.0001.100
Accounts payableNotes payableLong term debtCommon stockRetained Earnings
1.6001.0002.500
22.00026.000
CashFinancial assets Accounts receivableInventory (FIFO)Net fixed assets
Balance Sheet 02
56.100Total equity and liabilities56.100Total assets
10.0002.000
20.000 20.0004.100
Accounts payableNotes payableLong term debtCommon stockRetained Earnings
1.6001.000 2.500
25.00026.000
CashFinancial assetsAccounts receivableInventory (LIFO)Net fixed assets
Balance Sheet 02
© Prof. Dr. Frank Andreas SchittenhelmI. Introduction to Financial Accounting slide 77
2. Specific Balance Sheet Items 2.1.2. Example (8)
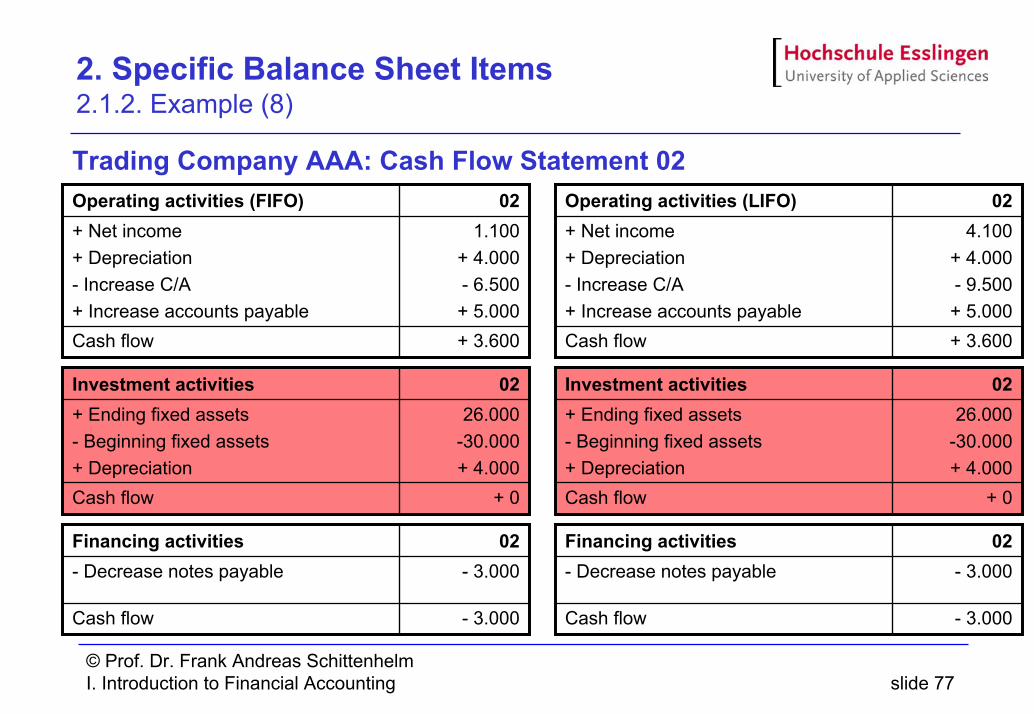
Trading Company AAA: Cash Flow Statement 02
+ 3.600
1.100+ 4.000- 6.500+ 5.000
02
Cash flow
+ Net income+ Depreciation- Increase C/A+ Increase accounts payable
Operating activities (FIFO)
+ 0
26.000-30.000+ 4.000
02
Cash flow
+ Ending fixed assets- Beginning fixed assets+ Depreciation
Investment activities
- 3.000
- 3.00002
Cash flow
- Decrease notes payableFinancing activities
+ 3.600
4.100+ 4.000- 9.500+ 5.000
02
Cash flow
+ Net income+ Depreciation- Increase C/A+ Increase accounts payable
Operating activities (LIFO)
+ 0
26.000-30.000+ 4.000
02
Cash flow
+ Ending fixed assets- Beginning fixed assets+ Depreciation
Investment activities
- 3.000
- 3.00002
Cash flow
- Decrease notes payableFinancing activities
© Prof. Dr. Frank Andreas SchittenhelmI. Introduction to Financial Accounting slide 78
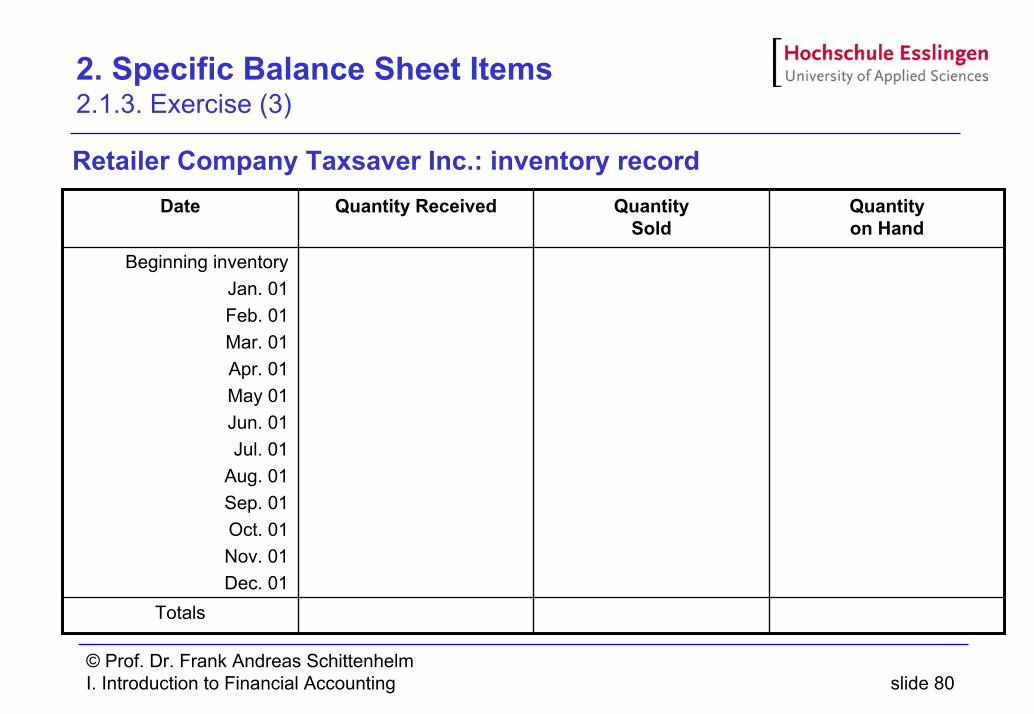
2. Specific Balance Sheet Items 2.1.3. Exercise
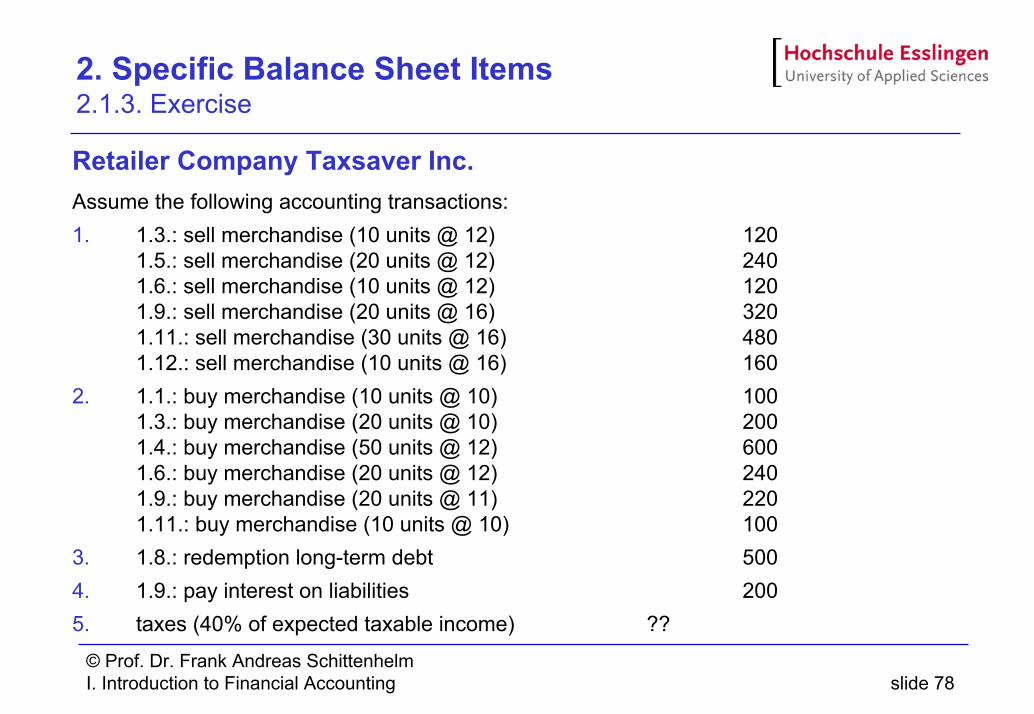
Retailer Company Taxsaver Inc.Assume the following accounting transactions:1. 1.3.: sell merchandise (10 units @ 12) 120
1.5.: sell merchandise (20 units @ 12) 240 1.6.: sell merchandise (10 units @ 12) 1201.9.: sell merchandise (20 units @ 16) 3201.11.: sell merchandise (30 units @ 16) 4801.12.: sell merchandise (10 units @ 16) 160
2. 1.1.: buy merchandise (10 units @ 10) 1001.3.: buy merchandise (20 units @ 10) 2001.4.: buy merchandise (50 units @ 12) 600 1.6.: buy merchandise (20 units @ 12) 2401.9.: buy merchandise (20 units @ 11) 2201.11.: buy merchandise (10 units @ 10) 100
3. 1.8.: redemption long-term debt 5004. 1.9.: pay interest on liabilities 2005. taxes (40% of expected taxable income) ??
© Prof. Dr. Frank Andreas SchittenhelmI. Introduction to Financial Accounting slide 79
2. Specific Balance Sheet Items 2.1.3. Exercise (2)
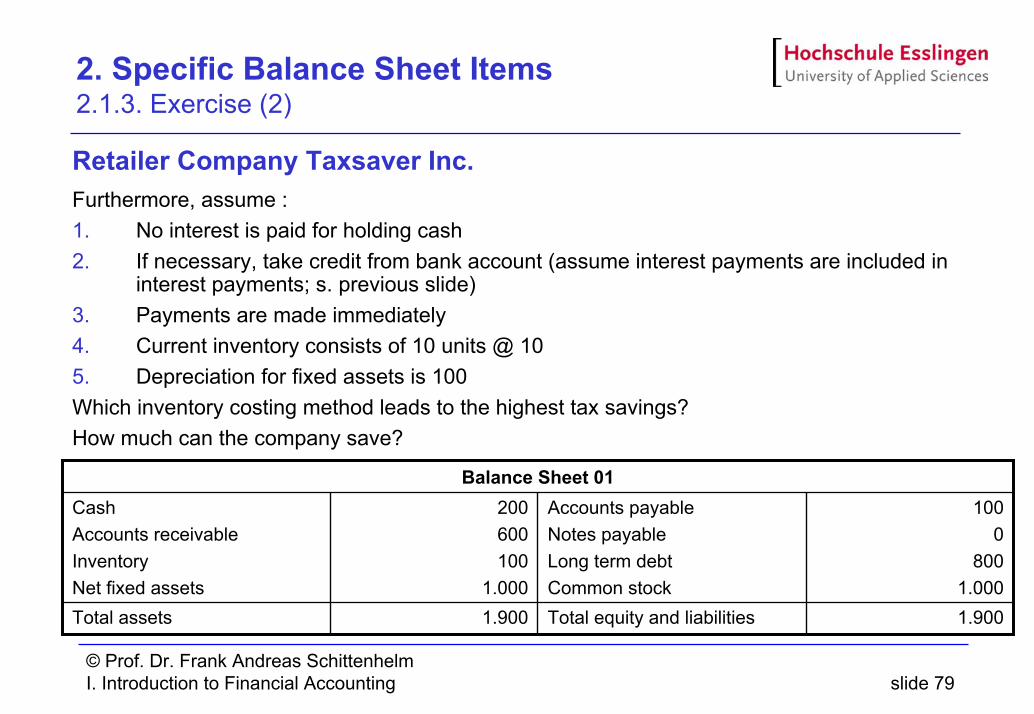
Retailer Company Taxsaver Inc.Furthermore, assume :1. No interest is paid for holding cash2. If necessary, take credit from bank account (assume interest payments are included in
interest payments; s. previous slide)3. Payments are made immediately4. Current inventory consists of 10 units @ 105. Depreciation for fixed assets is 100Which inventory costing method leads to the highest tax savings?How much can the company save?
1.900Total equity and liabilities1.900Total assets
1000
800 1.000
Accounts payableNotes payableLong term debtCommon stock
200600100
1.000
CashAccounts receivableInventoryNet fixed assets
Balance Sheet 01
© Prof. Dr. Frank Andreas SchittenhelmI. Introduction to Financial Accounting slide 80
2. Specific Balance Sheet Items 2.1.3. Exercise (3)
Retailer Company Taxsaver Inc.: inventory record
Totals
Beginning inventoryJan. 01Feb. 01Mar. 01Apr. 01May 01Jun. 01Jul. 01
Aug. 01Sep. 01Oct. 01Nov. 01Dec. 01
Quantityon Hand
QuantitySold
Quantity ReceivedDate
© Prof. Dr. Frank Andreas SchittenhelmI. Introduction to Financial Accounting slide 81
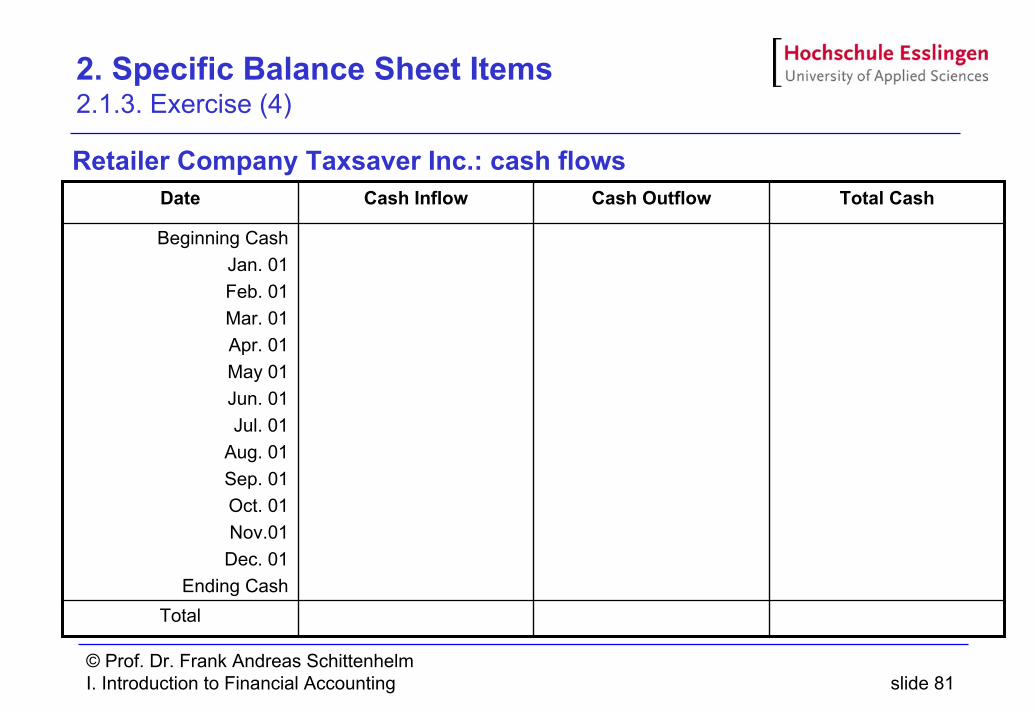
2. Specific Balance Sheet Items 2.1.3. Exercise (4)
Retailer Company Taxsaver Inc.: cash flows
Total
Beginning CashJan. 01Feb. 01Mar. 01Apr. 01May 01Jun. 01Jul. 01
Aug. 01Sep. 01Oct. 01Nov.01Dec. 01
Ending Cash
Total CashCash OutflowCash InflowDate
© Prof. Dr. Frank Andreas SchittenhelmI. Introduction to Financial Accounting slide 82
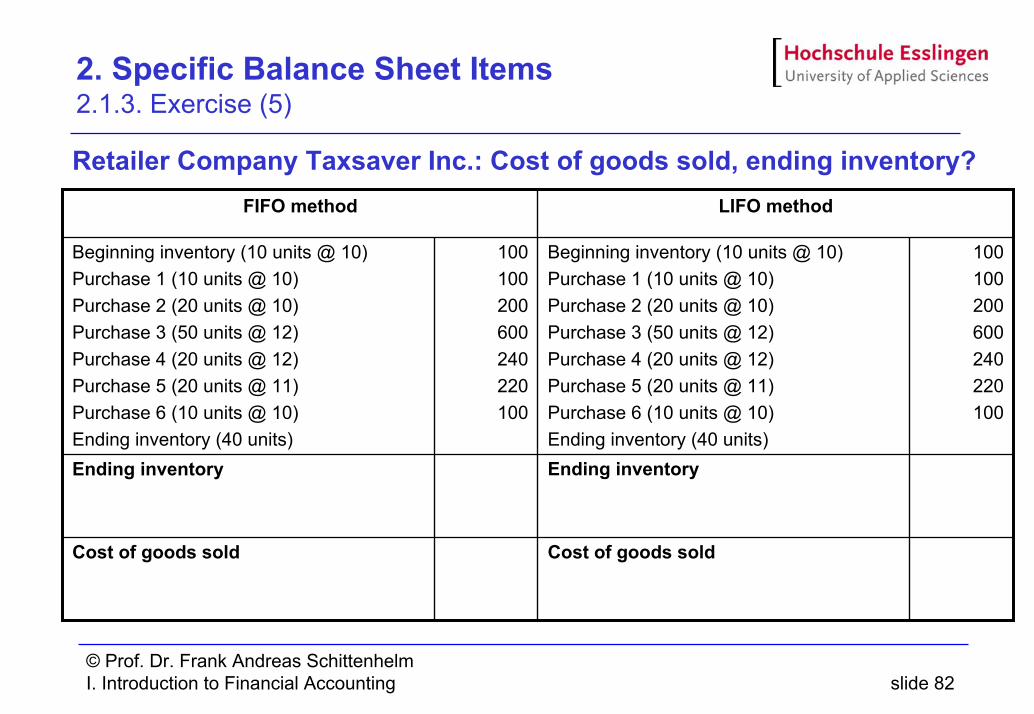
2. Specific Balance Sheet Items 2.1.3. Exercise (5)
Retailer Company Taxsaver Inc.: Cost of goods sold, ending inventory?
Ending inventoryEnding inventory
LIFO methodFIFO method
Cost of goods soldCost of goods sold
100100200600240220100
Beginning inventory (10 units @ 10)Purchase 1 (10 units @ 10)Purchase 2 (20 units @ 10)Purchase 3 (50 units @ 12)Purchase 4 (20 units @ 12)Purchase 5 (20 units @ 11)Purchase 6 (10 units @ 10)Ending inventory (40 units)
100100200600240220100
Beginning inventory (10 units @ 10)Purchase 1 (10 units @ 10)Purchase 2 (20 units @ 10)Purchase 3 (50 units @ 12)Purchase 4 (20 units @ 12)Purchase 5 (20 units @ 11)Purchase 6 (10 units @ 10)Ending inventory (40 units)
© Prof. Dr. Frank Andreas SchittenhelmI. Introduction to Financial Accounting slide 83
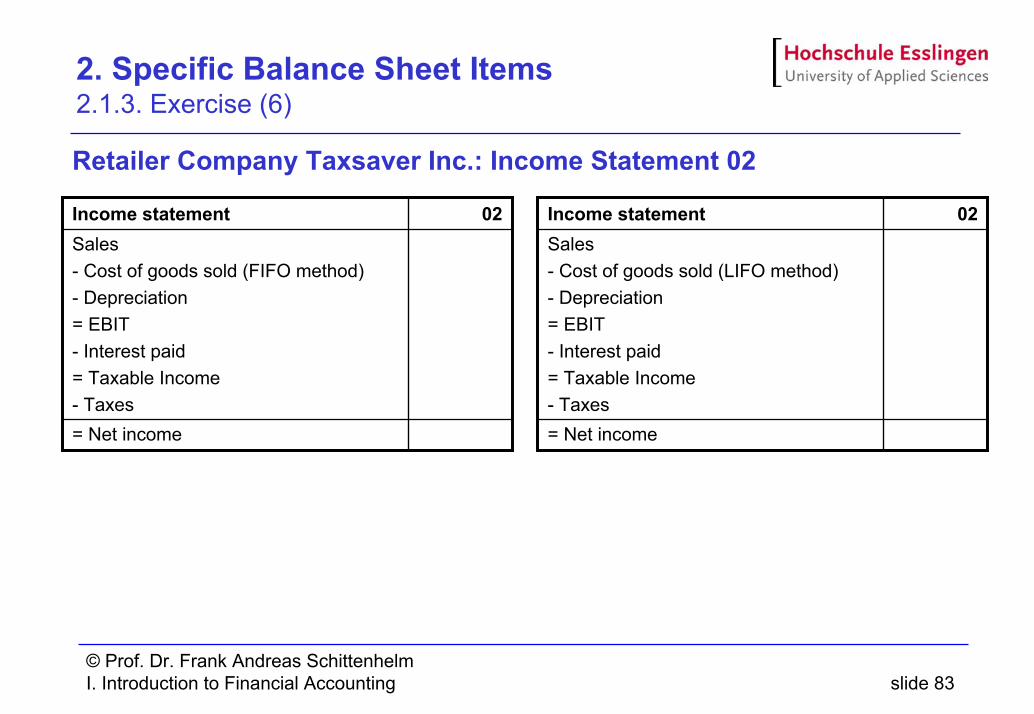
2. Specific Balance Sheet Items 2.1.3. Exercise (6)
Retailer Company Taxsaver Inc.: Income Statement 02
Income statemen
= Net income
Sales- Cost of goods sold (FIFO method)- Depreciation= EBIT- Interest paid= Taxable Income- Taxes
02t
= Net income
Sales- Cost of goods sold (LIFO method)- Depreciation= EBIT- Interest paid= Taxable Income- Taxes
02Income statement
© Prof. Dr. Frank Andreas SchittenhelmI. Introduction to Financial Accounting slide 84
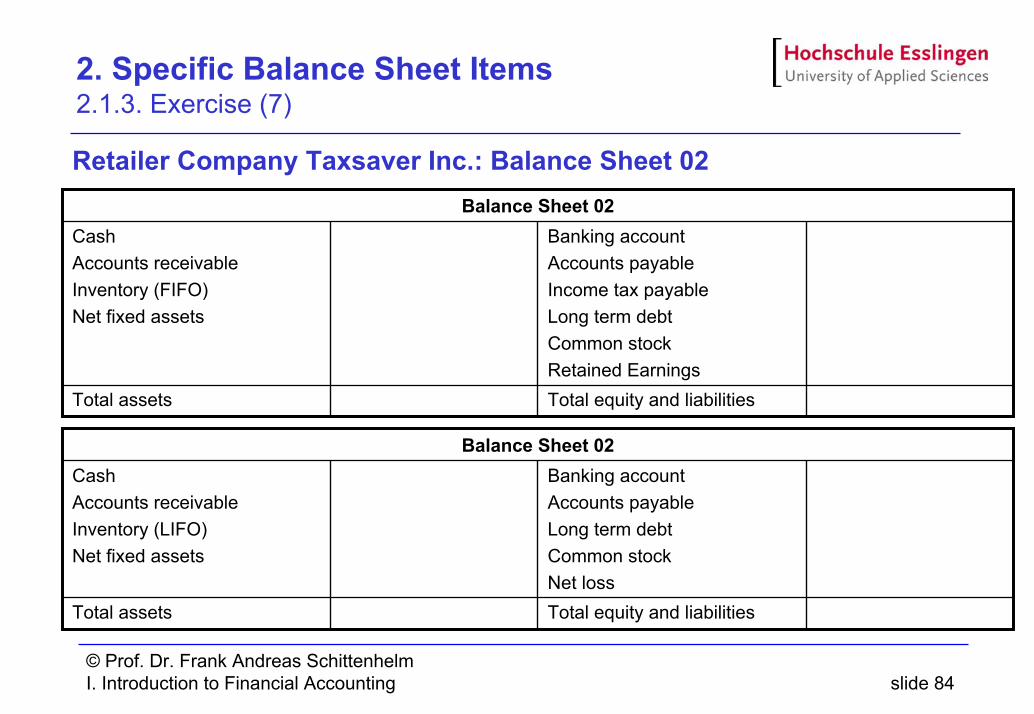
2. Specific Balance Sheet Items 2.1.3. Exercise (7)
Retailer Company Taxsaver Inc.: Balance Sheet 02
Total equity and liabilitiesTotal assets
Banking accountAccounts payableLong term debtCommon stockNet loss
CashAccounts receivableInventory (LIFO)Net fixed assets
Balance Sheet 02
Total equity and liabilitiesTotal assets
Banking accountAccounts payableIncome tax payableLong term debtCommon stockRetained Earnings
CashAccounts receivableInventory (FIFO)Net fixed assets
Balance Sheet 02
© Prof. Dr. Frank Andreas SchittenhelmI. Introduction to Financial Accounting slide 85
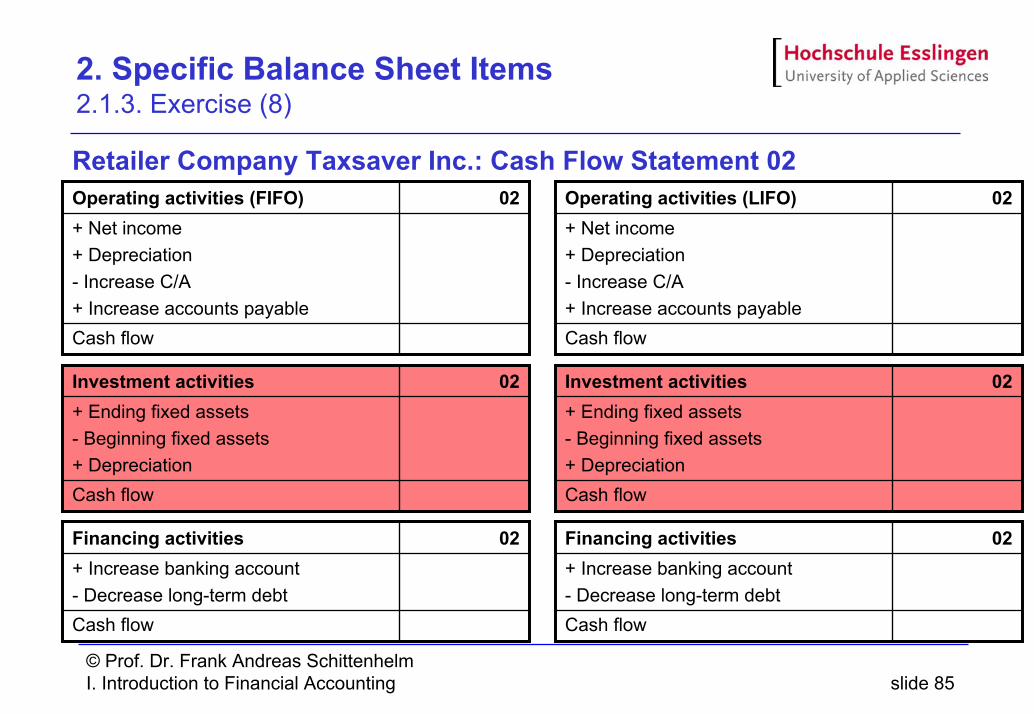
2. Specific Balance Sheet Items 2.1.3. Exercise (8)
Retailer Company Taxsaver Inc.: Cash Flow Statement 02Operatin 02
Cash flow
+ Net income+ Depreciation- Increase C/A+ Increase accounts payable
g activities (FIFO) 02
Cash flow
+ Net income+ Depreciation- Increase C/A+ Increase accounts payable
Operating activities (LIFO)
02
Cash flow
+ Ending fixed assets- Beginning fixed assets+ Depreciation
Investment activities 02
Cash flow
+ Ending fixed assets- Beginning fixed assets+ Depreciation
Investment activities
02
Cash flow
+ Increase banking account- Decrease long-term debt
Financing activities 02
Cash flow
+ Increase banking account- Decrease long-term debt
Financing activities
© Prof. Dr. Frank Andreas SchittenhelmI. Introduction to Financial Accounting slide 86
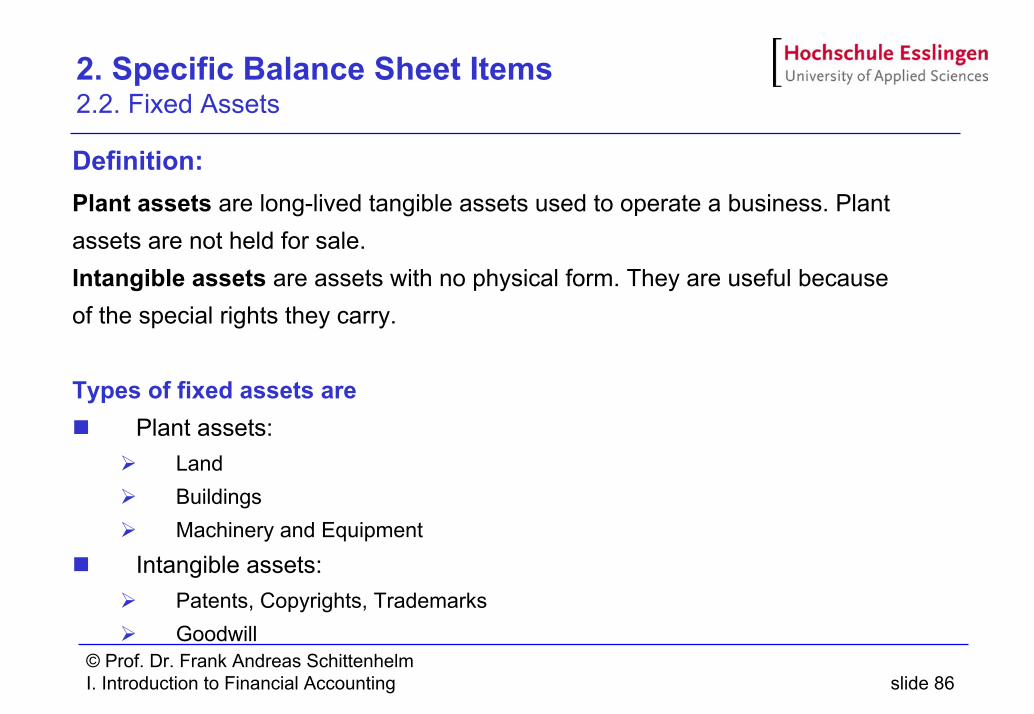
2. Specific Balance Sheet Items 2.2. Fixed Assets
Definition:Plant assets are long-lived tangible assets used to operate a business. Plant assets are not held for sale. Intangible assets are assets with no physical form. They are useful because of the special rights they carry.
Types of fixed assets arePlant assets:
LandBuildingsMachinery and Equipment
Intangible assets:Patents, Copyrights, TrademarksGoodwill
© Prof. Dr. Frank Andreas SchittenhelmI. Introduction to Financial Accounting slide 87
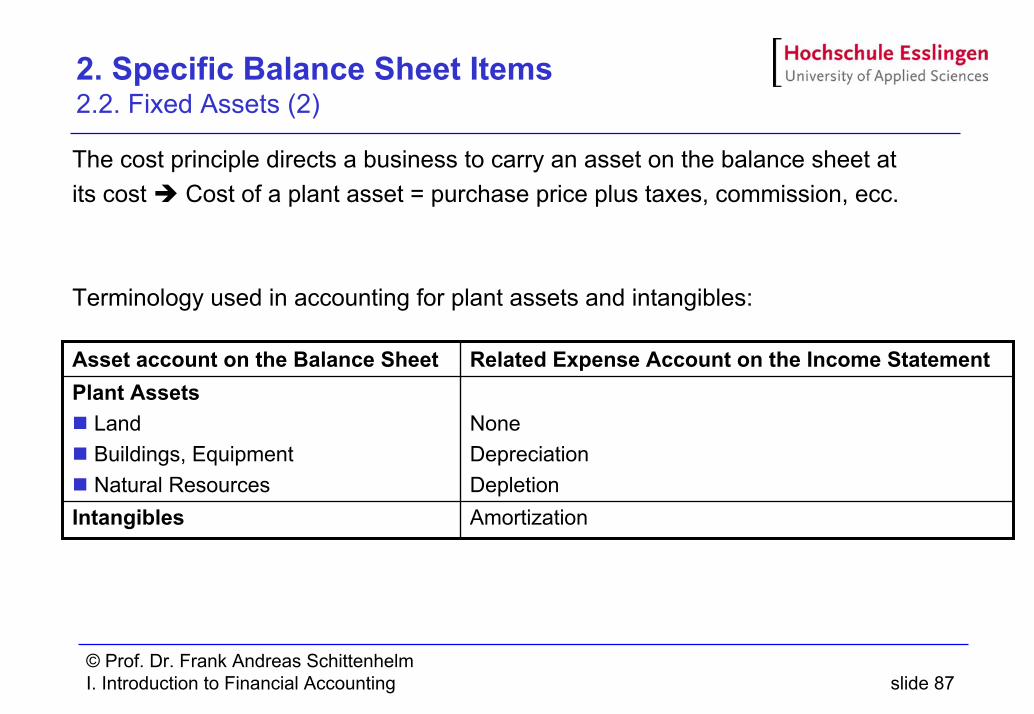
2. Specific Balance Sheet Items 2.2. Fixed Assets (2)
The cost principle directs a business to carry an asset on the balance sheet atits cost Cost of a plant asset = purchase price plus taxes, commission, ecc.
Terminology used in accounting for plant assets and intangibles:
NoneDepreciationDepletion
Plant AssetsLandBuildings, EquipmentNatural Resources
AmortizationIntangibles
Related Expense Account on the Income StatementAsset account on the Balance Sheet
© Prof. Dr. Frank Andreas SchittenhelmI. Introduction to Financial Accounting slide 88
2. Specific Balance Sheet Items 2.2.1. Depreciation
DefinitionThe allocation of a plant asset’s cost to expense over the asset’s useful life is called depreciation.
Concept explanation:Depreciation is not a process of valuation. Businesses do not record depreciation based on market (sales) value of their plant assets at the end of each year. Instead, businesses allocate an asset’s cost to expense during the period of its use.Depreciation does not mean that the business sets aside cash to replace an assets when it is used up. Establishing a cash fund is entirely separate from depreciation, and depreciation does not represent cash
Causes of depreciation:Physical wear and tear
Obsolescence
© Prof. Dr. Frank Andreas SchittenhelmI. Introduction to Financial Accounting slide 89
2. Specific Balance Sheet Items 2.2.1. Depreciation (2)
Measuring DepreciationCost: a known amountEstimated useful life
Length of the service period expected from an asset. May be expressed in years, units of output, miles, or another measure
Estimated residual value (scrap value or salvage value)Expected cash value of an asset at the end of its useful life.
Depreciable costThe cost of a plant asset minus its estimated residual value.
Depreciation methods:Different methods allocate different amounts of depreciation to each period.However, they all result in the same total amount of depreciation over the life of the asset.
© Prof. Dr. Frank Andreas SchittenhelmI. Introduction to Financial Accounting slide 90
2. Specific Balance Sheet Items 2.2.1. Depreciation (3)
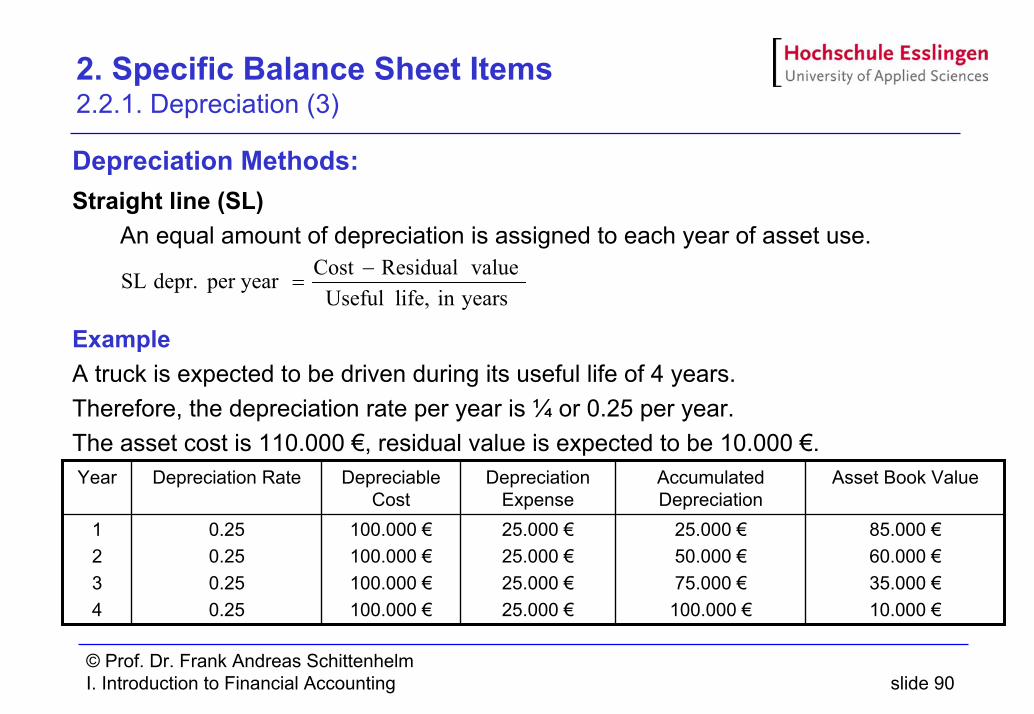
Depreciation Methods:Straight line (SL)
An equal amount of depreciation is assigned to each year of asset use.
ExampleA truck is expected to be driven during its useful life of 4 years.Therefore, the depreciation rate per year is ¼ or 0.25 per year.The asset cost is 110.000 €, residual value is expected to be 10.000 €.
yearsin life, Useful valueResidualCostper year depr. SL −
=
85.000 €60.000 €35.000 €10.000 €
25.000 €50.000 €75.000 €
100.000 €
25.000 €25.000 €25.000 €25.000 €
100.000 €100.000 €100.000 €100.000 €
0.250.250.250.25
1234
Asset Book ValueAccumulated Depreciation
Depreciation Expense
Depreciable Cost
Depreciation RateYear
© Prof. Dr. Frank Andreas SchittenhelmI. Introduction to Financial Accounting slide 91
2. Specific Balance Sheet Items 2.2.1. Depreciation (4)
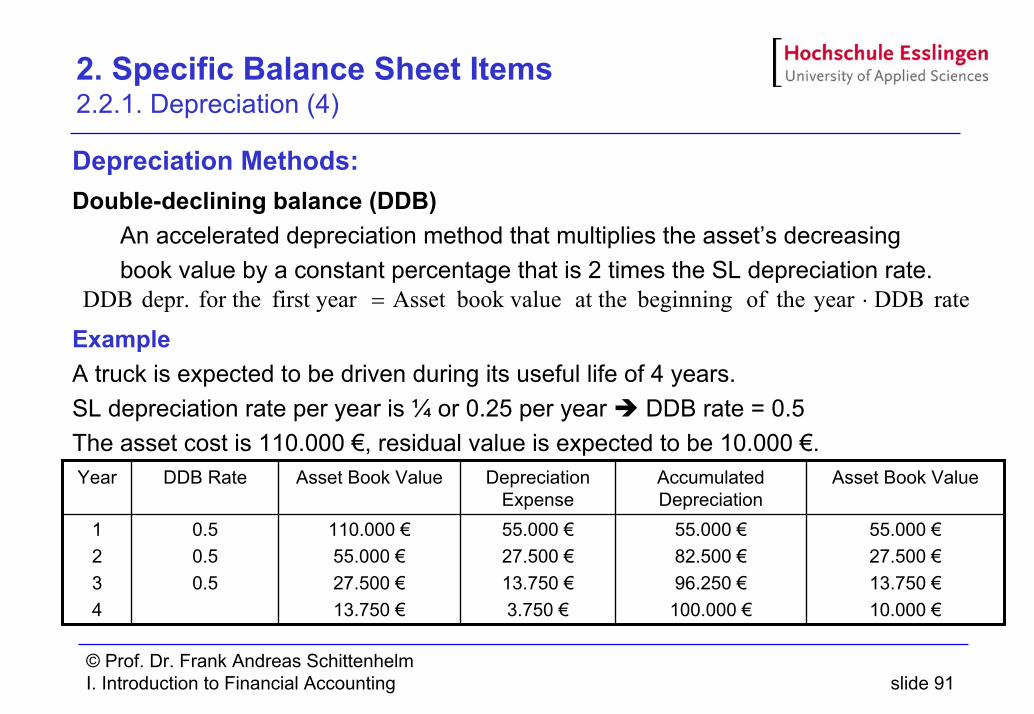
Depreciation Methods:Double-declining balance (DDB)
An accelerated depreciation method that multiplies the asset’s decreasing book value by a constant percentage that is 2 times the SL depreciation rate.
ExampleA truck is expected to be driven during its useful life of 4 years.SL depreciation rate per year is ¼ or 0.25 per year DDB rate = 0.5The asset cost is 110.000 €, residual value is expected to be 10.000 €.
rate DDB year theof beginning at the book valueAsset first year for the depr. DDB ⋅=
55.000 €27.500 €13.750 €10.000 €
55.000 €82.500 €96.250 €
100.000 €
55.000 €27.500 €13.750 €3.750 €
110.000 €55.000 €27.500 €13.750 €
0.50.50.5
1234
Asset Book ValueAccumulated Depreciation
Depreciation Expense
Asset Book ValueDDB RateYear
© Prof. Dr. Frank Andreas SchittenhelmI. Introduction to Financial Accounting slide 92
2. Specific Balance Sheet Items 2.2.2. Example
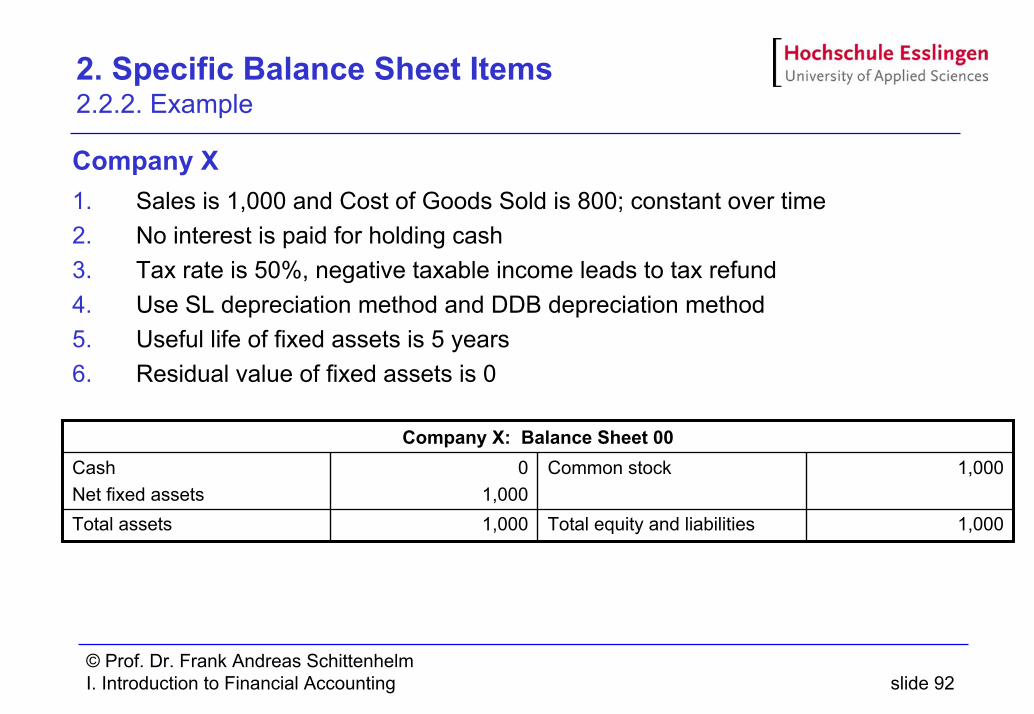
Company X1. Sales is 1,000 and Cost of Goods Sold is 800; constant over time2. No interest is paid for holding cash3. Tax rate is 50%, negative taxable income leads to tax refund4. Use SL depreciation method and DDB depreciation method5. Useful life of fixed assets is 5 years6. Residual value of fixed assets is 0
1,000Total equity and liabilities1,000Total assets
1,000Common stock01,000
CashNet fixed assets
Company X: Balance Sheet 00
© Prof. Dr. Frank Andreas SchittenhelmI. Introduction to Financial Accounting slide 93
2. Specific Balance Sheet Items 2.2.2. Example (2)
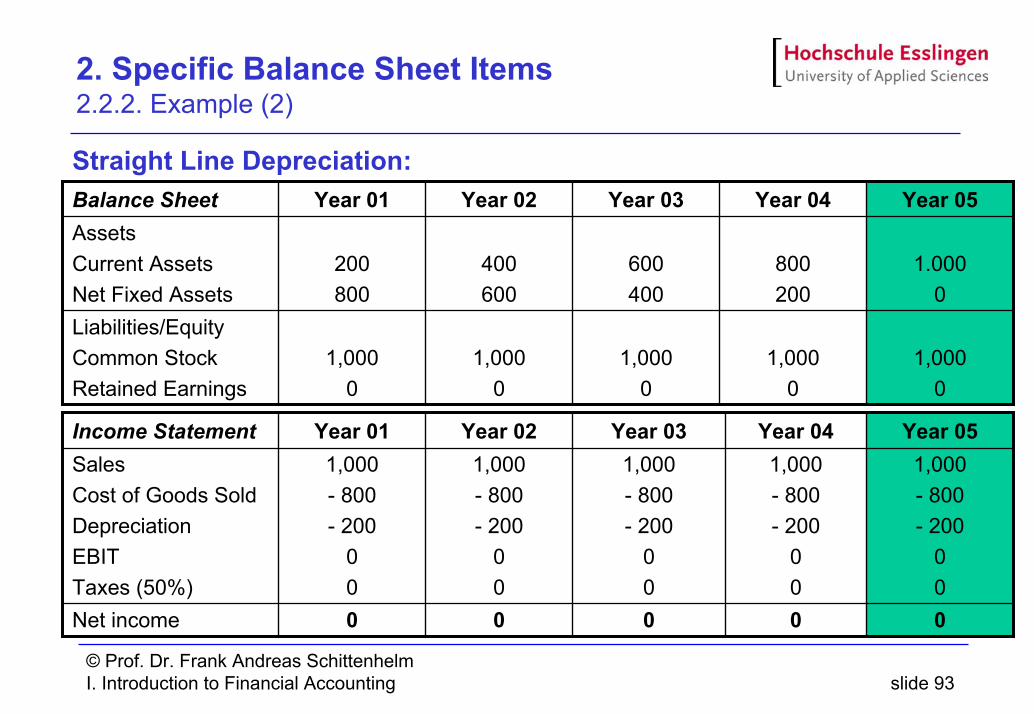
Straight Line Depreciation:
1,0000
1,0000
1,0000
1,0000
1,0000
Liabilities/EquityCommon StockRetained Earnings
1.0000
800200
600400
400600
200800
AssetsCurrent AssetsNet Fixed Assets
Year 05Year 04Year 03Year 02Year 01Balance Sheet
00000Net income
1,000- 800- 200
00
1,000- 800- 200
00
1,000- 800- 200
00
1,000- 800- 200
00
1,000- 800- 200
00
SalesCost of Goods SoldDepreciationEBITTaxes (50%)
Year 05Year 04Year 03Year 02Year 01Income Statement
© Prof. Dr. Frank Andreas SchittenhelmI. Introduction to Financial Accounting slide 94
2. Specific Balance Sheet Items 2.2.2. Example (3)
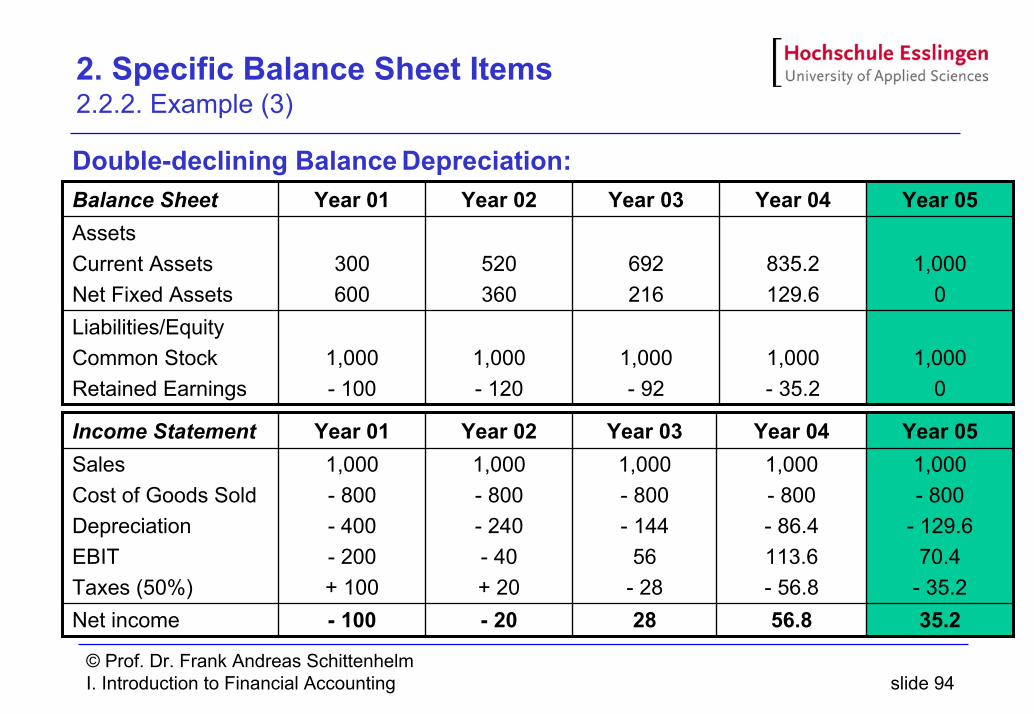
Double-declining Balance Depreciation:
1,0000
1,000- 35.2
1,000- 92
1,000- 120
1,000- 100
Liabilities/EquityCommon StockRetained Earnings
1,0000
835.2129.6
692216
520360
300600
AssetsCurrent AssetsNet Fixed Assets
Year 05Year 04Year 03Year 02Year 01Balance Sheet
35.256.828- 20- 100Net income
1,000- 800
- 129.670.4
- 35.2
1,000- 800- 86.4113.6- 56.8
1,000- 800- 144
56- 28
1,000- 800- 240- 40+ 20
1,000- 800- 400- 200+ 100
SalesCost of Goods SoldDepreciationEBITTaxes (50%)
Year 05Year 04Year 03Year 02Year 01Income Statement
© Prof. Dr. Frank Andreas SchittenhelmI. Introduction to Financial Accounting slide 95
2. Specific Balance Sheet Items 2.2.2. Example (4)
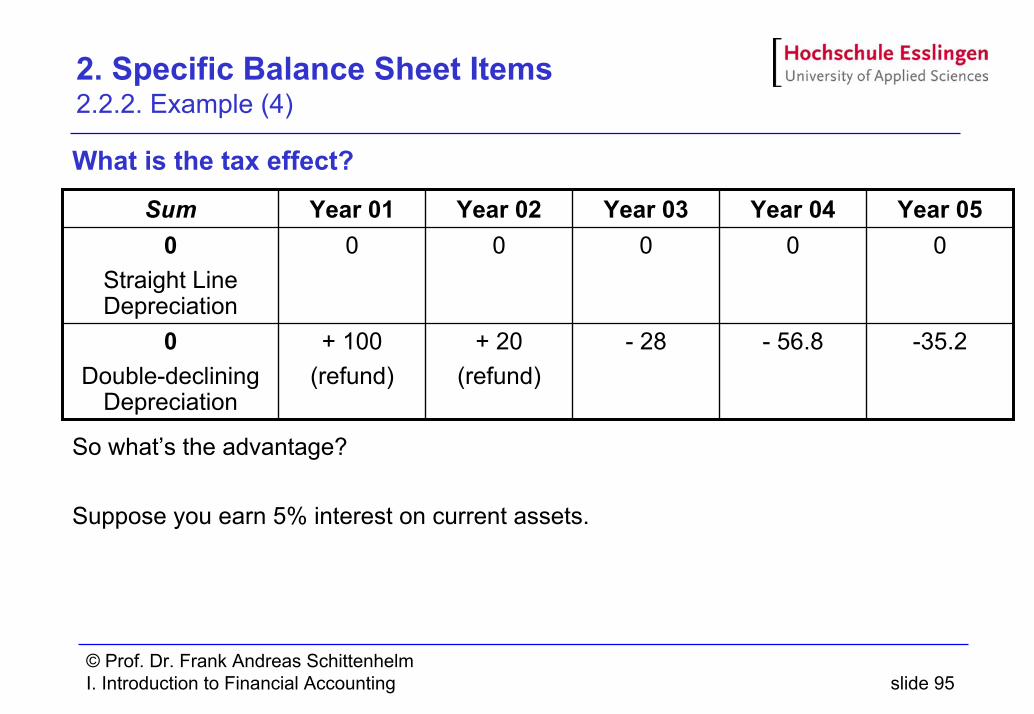
What is the tax effect?
So what’s the advantage?
Suppose you earn 5% interest on current assets.
-35.2- 56.8- 28+ 20(refund)
+ 100(refund)
0Double-declining
Depreciation
000000Straight LineDepreciation
Year 05Year 04Year 03Year 02Year 01Sum
© Prof. Dr. Frank Andreas SchittenhelmI. Introduction to Financial Accounting slide 96
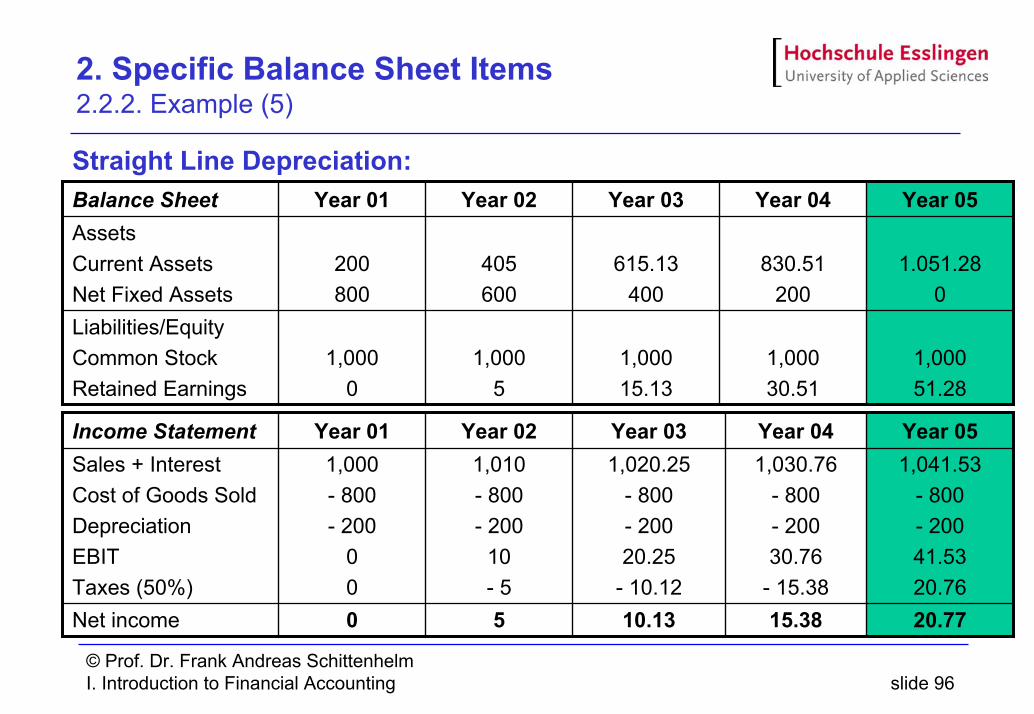
2. Specific Balance Sheet Items 2.2.2. Example (5)
Straight Line Depreciation:
1,00051.28
1,00030.51
1,00015.13
1,0005
1,0000
Liabilities/EquityCommon StockRetained Earnings
1.051.280
830.51200
615.13400
405600
200800
AssetsCurrent AssetsNet Fixed Assets
Year 05Year 04Year 03Year 02Year 01Balance Sheet
20.7715.3810.1350Net income
1,041.53- 800- 20041.5320.76
1,030.76- 800- 20030.76
- 15.38
1,020.25- 800- 20020.25
- 10.12
1,010- 800- 200
10- 5
1,000- 800- 200
00
Sales + InterestCost of Goods SoldDepreciationEBITTaxes (50%)
Year 05Year 04Year 03Year 02Year 01Income Statement
© Prof. Dr. Frank Andreas SchittenhelmI. Introduction to Financial Accounting slide 97
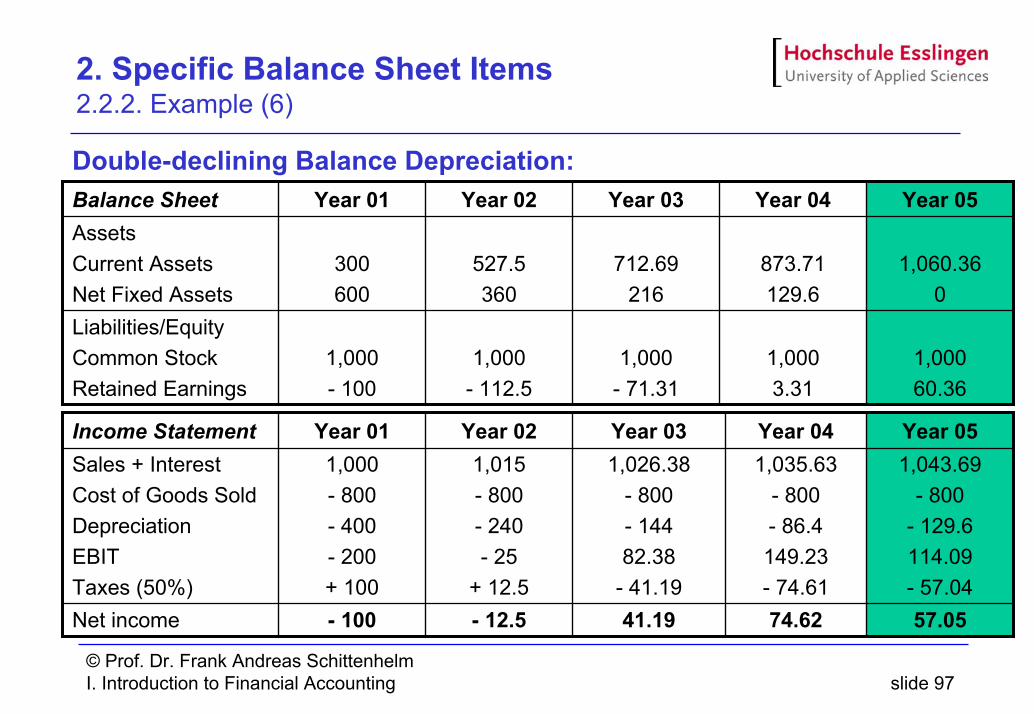
2. Specific Balance Sheet Items 2.2.2. Example (6)
Double-declining Balance Depreciation:
1,00060.36
1,0003.31
1,000- 71.31
1,000- 112.5
1,000- 100
Liabilities/EquityCommon StockRetained Earnings
1,060.360
873.71129.6
712.69216
527.5360
300600
AssetsCurrent AssetsNet Fixed Assets
Year 05Year 04Year 03Year 02Year 01Balance Sheet
57.0574.6241.19- 12.5- 100Net income
1,043.69- 800
- 129.6114.09- 57.04
1,035.63- 800- 86.4149.23- 74.61
1,026.38- 800- 14482.38
- 41.19
1,015- 800- 240- 25
+ 12.5
1,000- 800- 400- 200+ 100
Sales + InterestCost of Goods SoldDepreciationEBITTaxes (50%)
Year 05Year 04Year 03Year 02Year 01Income Statement
© Prof. Dr. Frank Andreas SchittenhelmI. Introduction to Financial Accounting slide 98
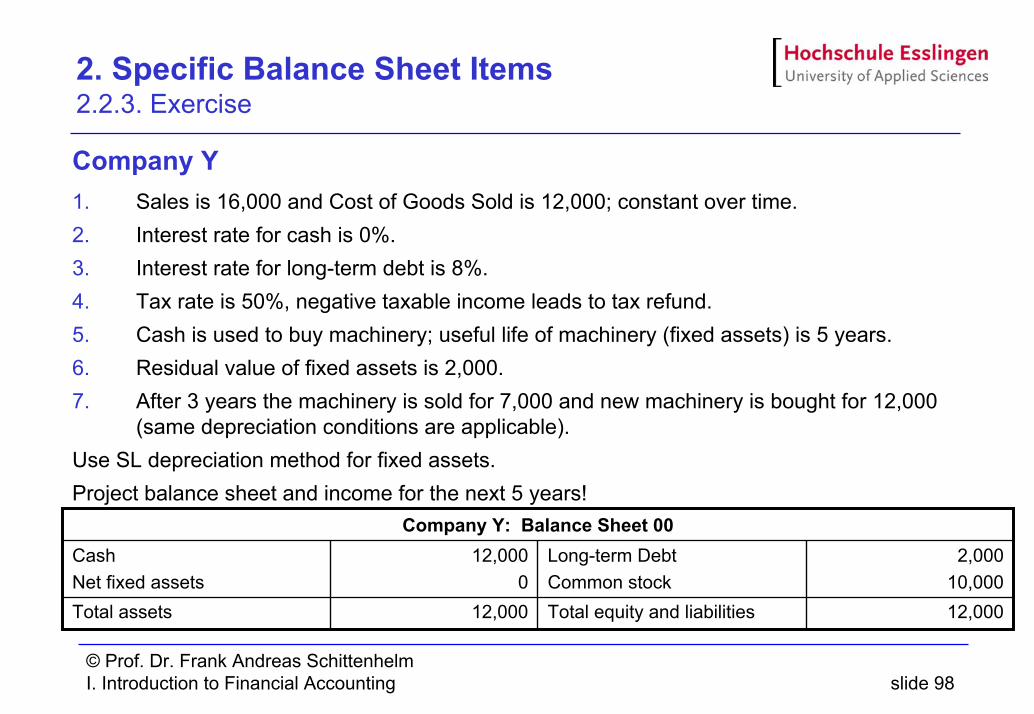
2. Specific Balance Sheet Items 2.2.3. Exercise
Company Y1. Sales is 16,000 and Cost of Goods Sold is 12,000; constant over time. 2. Interest rate for cash is 0%.3. Interest rate for long-term debt is 8%.4. Tax rate is 50%, negative taxable income leads to tax refund.5. Cash is used to buy machinery; useful life of machinery (fixed assets) is 5 years.6. Residual value of fixed assets is 2,000.7. After 3 years the machinery is sold for 7,000 and new machinery is bought for 12,000
(same depreciation conditions are applicable).Use SL depreciation method for fixed assets.Project balance sheet and income for the next 5 years!
12,000Total equity and liabilities12,000Total assets
2,00010,000
Long-term DebtCommon stock
12,0000
CashNet fixed assets
Company Y: Balance Sheet 00
© Prof. Dr. Frank Andreas SchittenhelmI. Introduction to Financial Accounting slide 99
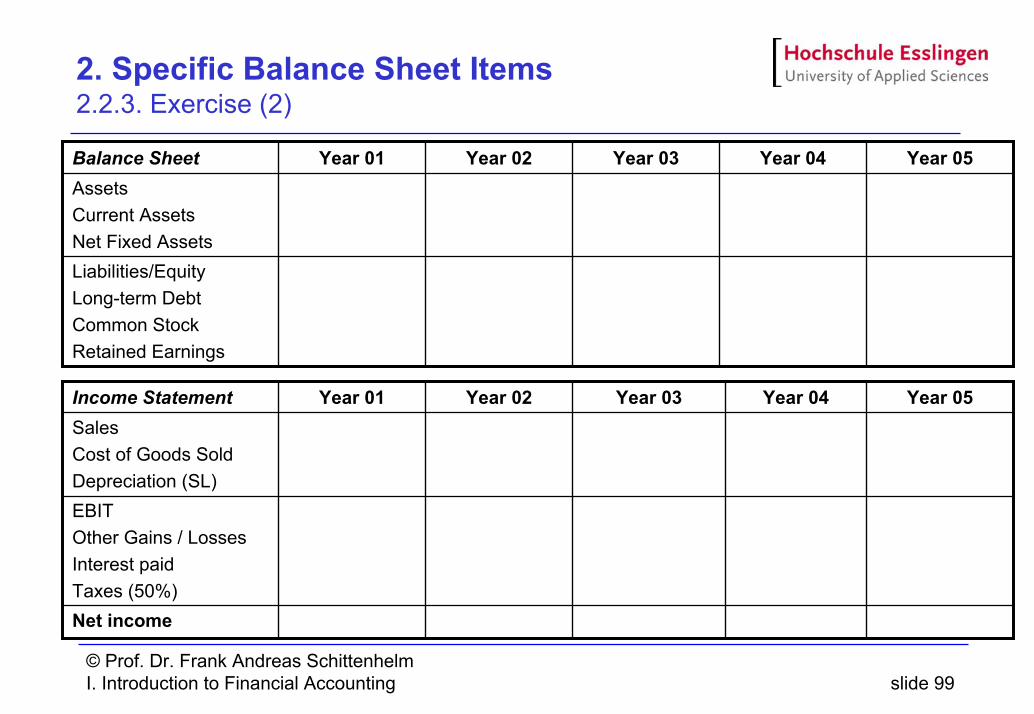
2. Specific Balance Sheet Items 2.2.3. Exercise (2)
Liabilities/EquityLong-term DebtCommon StockRetained Earnings
AssetsCurrent AssetsNet Fixed Assets
Year 05Year 04Year 03Year 02Year 01Balance Sheet
EBITOther Gains / LossesInterest paidTaxes (50%)Net income
SalesCost of Goods SoldDepreciation (SL)
Year 05Year 04Year 03Year 02Year 01Income Statement
© Prof. Dr. Frank Andreas SchittenhelmI. Introduction to Financial Accounting slide 100
3. Financial Analysis
Contents3.0. Introduction and Preparation3.1. Balance Sheet Analysis
3.1.1. Capitalization Structure3.1.2. Asset Structure3.1.3. Fixed Asset Coverage 3.1.4. Liquidity Analysis
3.2. Income Statement Analysis3.2.1. Asset Utilization3.2.2. Profitability Analysis
3.3. Cash Flow Statement Analysis
© Prof. Dr. Frank Andreas SchittenhelmI. Introduction to Financial Accounting slide 101
3. Financial Analysis 3.0. Introduction and Preparation
Questions and Objectives:Is a company able to achieve its business objectives?
Create value for its shareholders / ownersEmployee satisfaction, social responsibility etc.
Information to assess a company’s financial strengthInformation to assess a company’s liquidity statusInformation to assess a company’s profitabilityInformation to assess a company’s overall developmentInformation to make comparison possible (often industry-specific)Etc.
© Prof. Dr. Frank Andreas SchittenhelmI. Introduction to Financial Accounting slide 102
3. Financial Analysis 3.0. Introduction and Preparation (2)
Bases for Comparison:Experience
Subjective standardsBudgets
Compare performance with prepared budgetsBUT: budgeted amounts might not have been developed carefullyBUT: budgets are based on assumptions that turned out to be incorrect
Historical StandardsContinuous improvement hypothesisBUT: It only shows that a company did better or worse
External BenchmarksCompare company with othersBUT: environmental and accounting differencesBUT: different tax treatment
© Prof. Dr. Frank Andreas SchittenhelmI. Introduction to Financial Accounting slide 103
3. Financial Analysis 3.0. Introduction and Preparation (3)
Balance Sheet Preparation:Objective:Aggregation of specific items of a balance sheetDetermination of percentage measures of total assetsConsideration of figures of the preceding year and annual absolute changes
Problems:Maturity of liabilities explanatory notesMaturity of accruals esp. for pensions generally not assessableUse of net incomeDifferences in definition of items
© Prof. Dr. Frank Andreas SchittenhelmI. Introduction to Financial Accounting slide 104
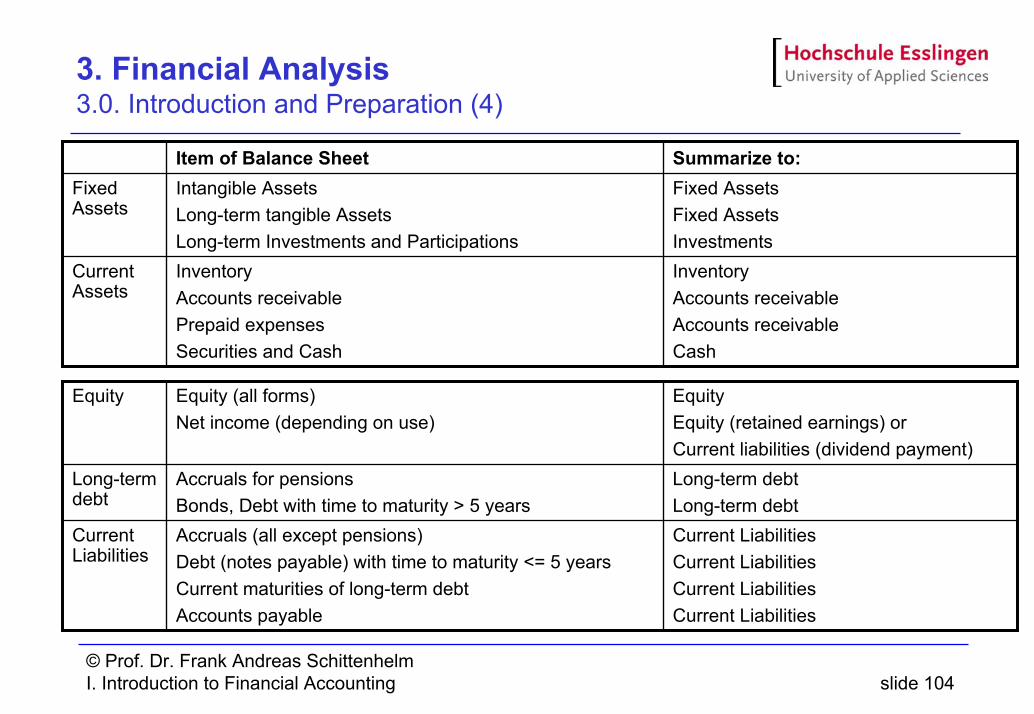
3. Financial Analysis 3.0. Introduction and Preparation (4)
InventoryAccounts receivableAccounts receivableCash
InventoryAccounts receivablePrepaid expensesSecurities and Cash
Current Assets
Fixed AssetsFixed AssetsInvestments
Intangible AssetsLong-term tangible AssetsLong-term Investments and Participations
Fixed Assets
Summarize to: Item of Balance Sheet
Current LiabilitiesCurrent LiabilitiesCurrent LiabilitiesCurrent Liabilities
Accruals (all except pensions)Debt (notes payable) with time to maturity <= 5 yearsCurrent maturities of long-term debtAccounts payable
Current Liabilities
Long-term debtLong-term debt
Accruals for pensionsBonds, Debt with time to maturity > 5 years
Long-term debt
EquityEquity (retained earnings) orCurrent liabilities (dividend payment)
Equity (all forms)Net income (depending on use)
Equity
© Prof. Dr. Frank Andreas SchittenhelmI. Introduction to Financial Accounting slide 105
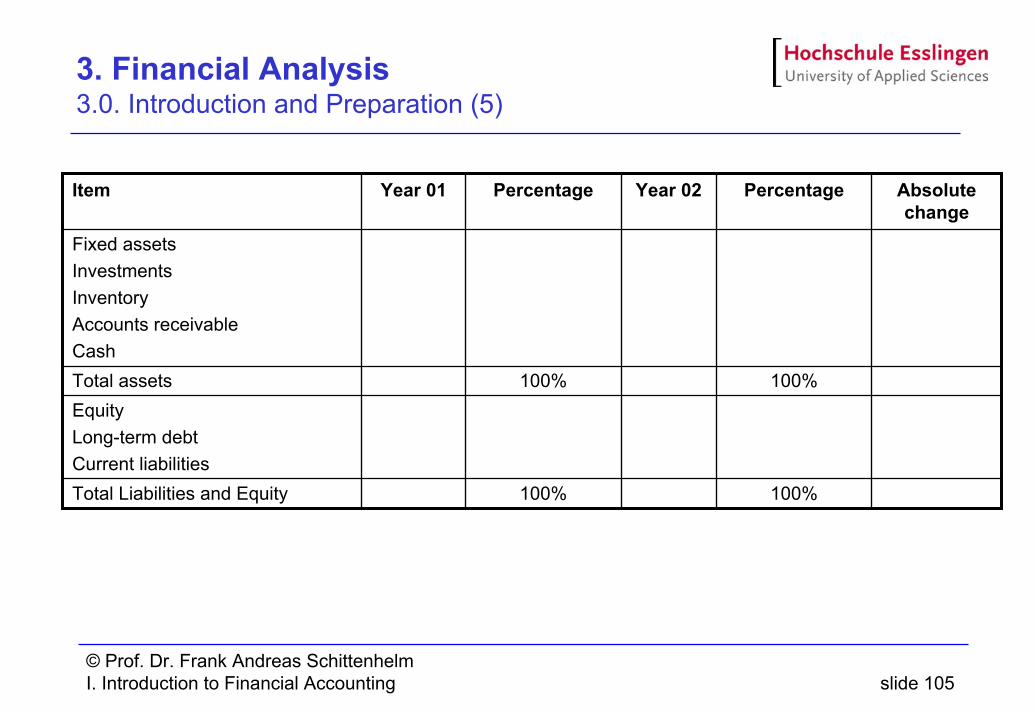
3. Financial Analysis 3.0. Introduction and Preparation (5)
EquityLong-term debtCurrent liabilities
100%100%Total Liabilities and Equity
100%100%Total assets
Fixed assetsInvestmentsInventoryAccounts receivableCash
Absolute change
PercentageYear 02PercentageYear 01Item
© Prof. Dr. Frank Andreas SchittenhelmI. Introduction to Financial Accounting slide 106
3. Financial Analysis 3.1. Balance Sheet Analysis
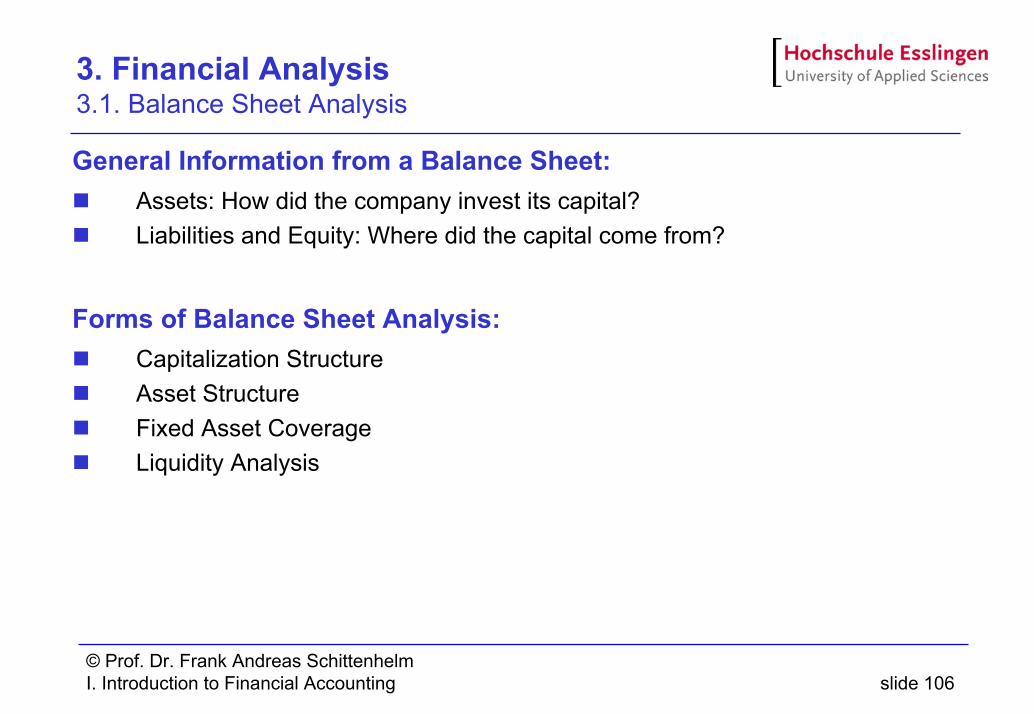
General Information from a Balance Sheet:Assets: How did the company invest its capital?Liabilities and Equity: Where did the capital come from?
Forms of Balance Sheet Analysis:Capitalization StructureAsset StructureFixed Asset CoverageLiquidity Analysis
© Prof. Dr. Frank Andreas SchittenhelmI. Introduction to Financial Accounting slide 107
3. Financial Analysis 3.1.1. Capitalization Structure
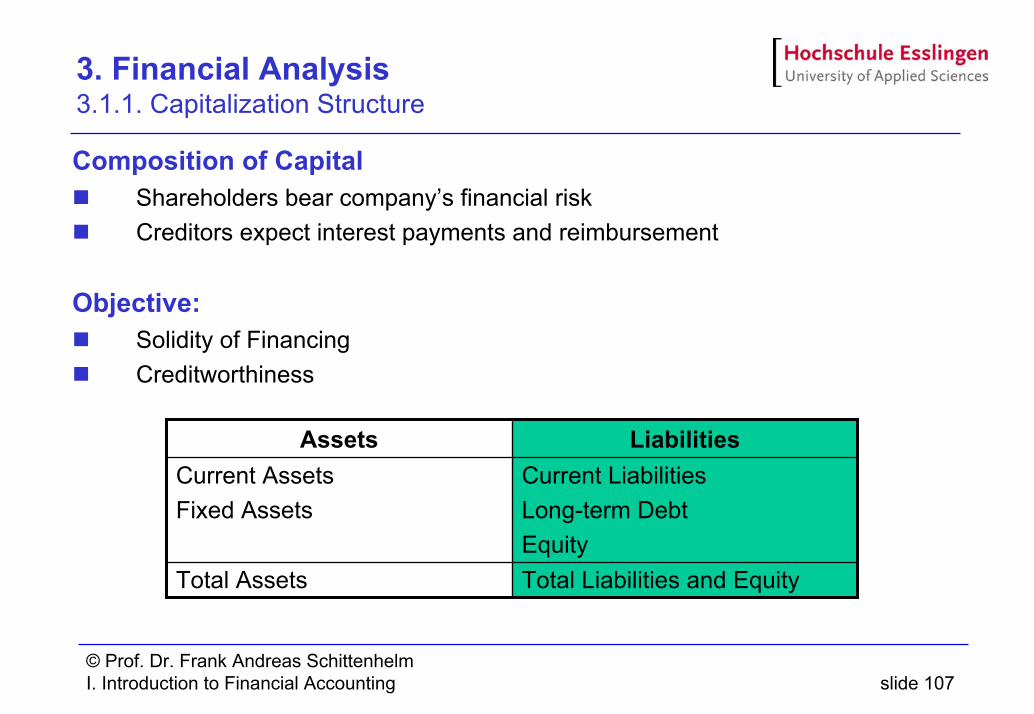
Composition of CapitalShareholders bear company’s financial riskCreditors expect interest payments and reimbursement
Objective:Solidity of FinancingCreditworthiness
Current LiabilitiesLong-term DebtEquity
Current AssetsFixed Assets
Total Liabilities and EquityTotal Assets
LiabilitiesAssets
© Prof. Dr. Frank Andreas SchittenhelmI. Introduction to Financial Accounting slide 108
3. Financial Analysis 3.1.1. Capitalization Structure (2)
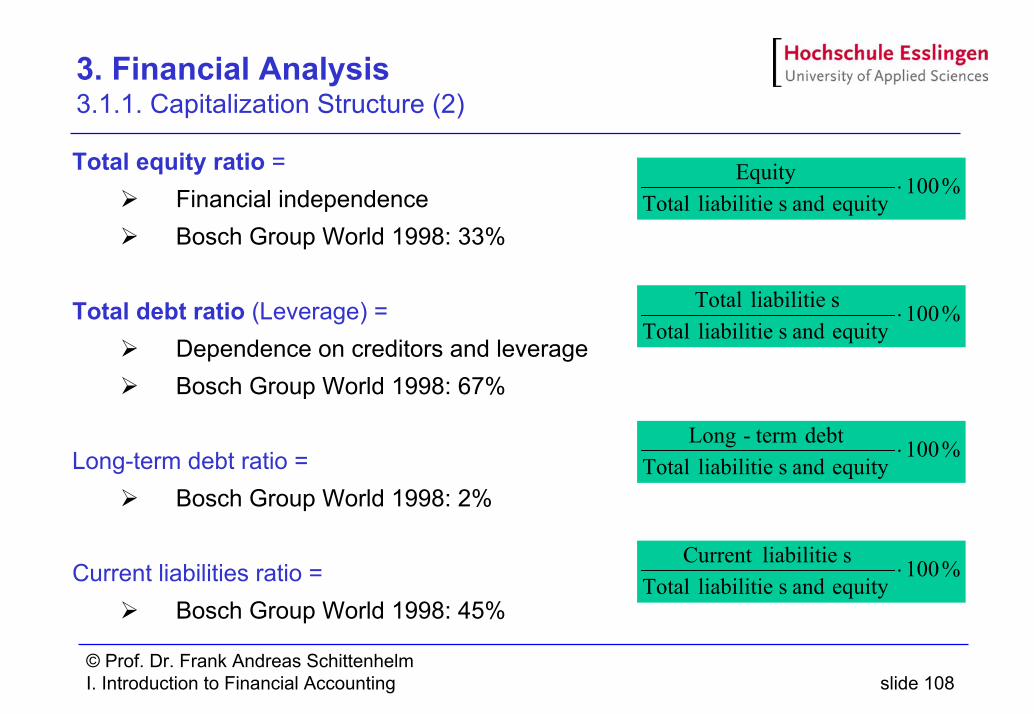
Total equity ratio =Financial independenceBosch Group World 1998: 33%
Total debt ratio (Leverage) = Dependence on creditors and leverageBosch Group World 1998: 67%
Long-term debt ratio =Bosch Group World 1998: 2%
Current liabilities ratio =Bosch Group World 1998: 45%
%100equity and sliabilitie Total
Equity⋅
%100equity and sliabilitie Totalsliabilitie Total
⋅
%100equity and sliabilitie Total
debt term-Long⋅
%100equity and sliabilitie TotalsliabilitieCurrent
⋅
© Prof. Dr. Frank Andreas SchittenhelmI. Introduction to Financial Accounting slide 109
3. Financial Analysis 3.1.2. Asset Structure
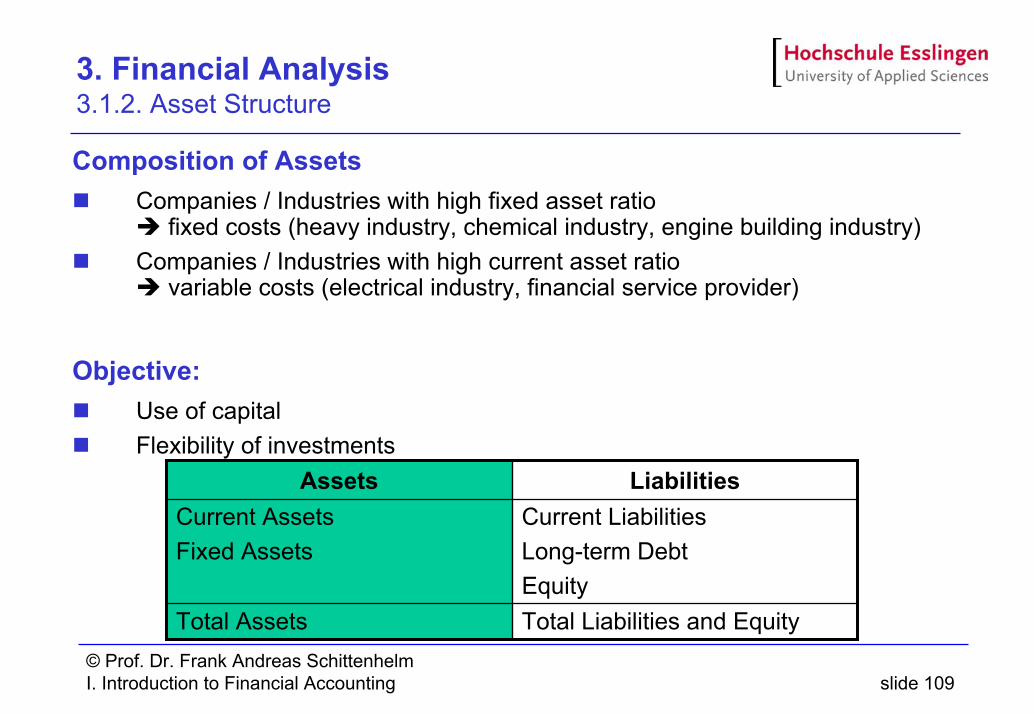
Composition of AssetsCompanies / Industries with high fixed asset ratio
fixed costs (heavy industry, chemical industry, engine building industry)Companies / Industries with high current asset ratio
variable costs (electrical industry, financial service provider)
Objective:Use of capital Flexibility of investments
Current LiabilitiesLong-term DebtEquity
Current AssetsFixed Assets
Total Liabilities and EquityTotal Assets
LiabilitiesAssets
© Prof. Dr. Frank Andreas SchittenhelmI. Introduction to Financial Accounting slide 110
3. Financial Analysis 3.1.2. Asset Structure (2)
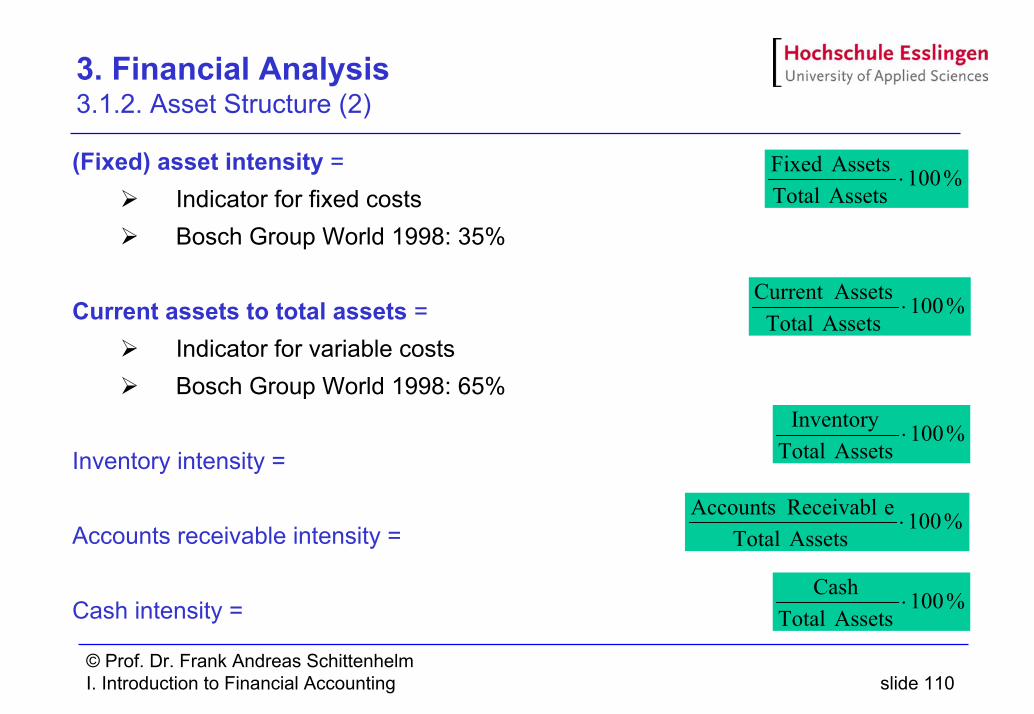
(Fixed) asset intensity =Indicator for fixed costsBosch Group World 1998: 35%
Current assets to total assets = Indicator for variable costsBosch Group World 1998: 65%
Inventory intensity =
Accounts receivable intensity =
Cash intensity =
%100Assets TotalAssets Fixed
⋅
%100Assets Total
AssetsCurrent ⋅
%100Assets Total
Inventory⋅
%100Assets Total
e ReceivablAccounts⋅
%100Assets Total
Cash⋅
© Prof. Dr. Frank Andreas SchittenhelmI. Introduction to Financial Accounting slide 111
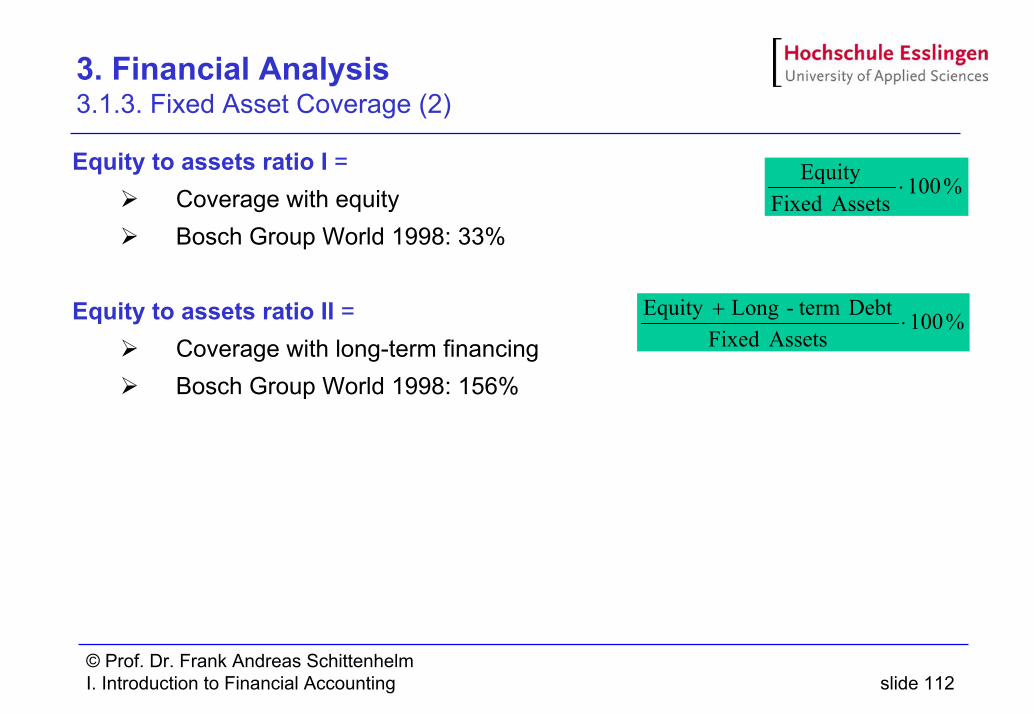
3. Financial Analysis 3.1.3. Fixed Asset Coverage
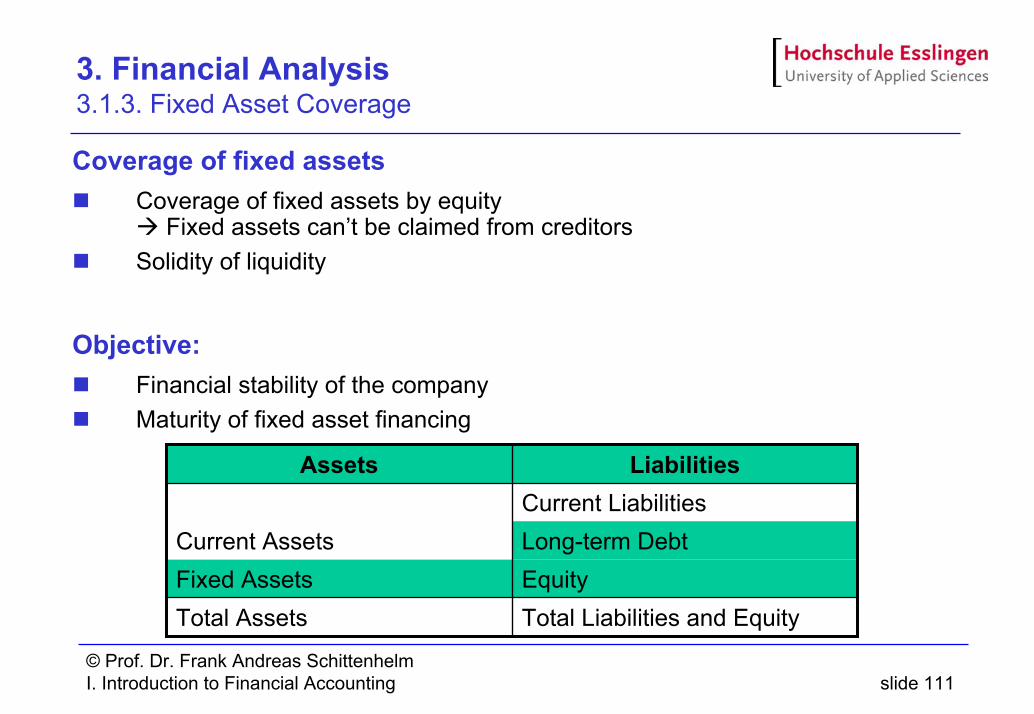
Coverage of fixed assetsCoverage of fixed assets by equity
Fixed assets can’t be claimed from creditorsSolidity of liquidity
Objective:Financial stability of the companyMaturity of fixed asset financing
Current LiabilitiesLong-term DebtCurrent AssetsEquityFixed AssetsTotal Liabilities and EquityTotal Assets
LiabilitiesAssets
© Prof. Dr. Frank Andreas SchittenhelmI. Introduction to Financial Accounting slide 112
3. Financial Analysis 3.1.3. Fixed Asset Coverage (2)
Equity to assets ratio I =Coverage with equityBosch Group World 1998: 33%
Equity to assets ratio II = Coverage with long-term financingBosch Group World 1998: 156%
%100Assets Fixed
Equity⋅
%100Assets Fixed
Debtterm- LongEquity ⋅
+
© Prof. Dr. Frank Andreas SchittenhelmI. Introduction to Financial Accounting slide 113
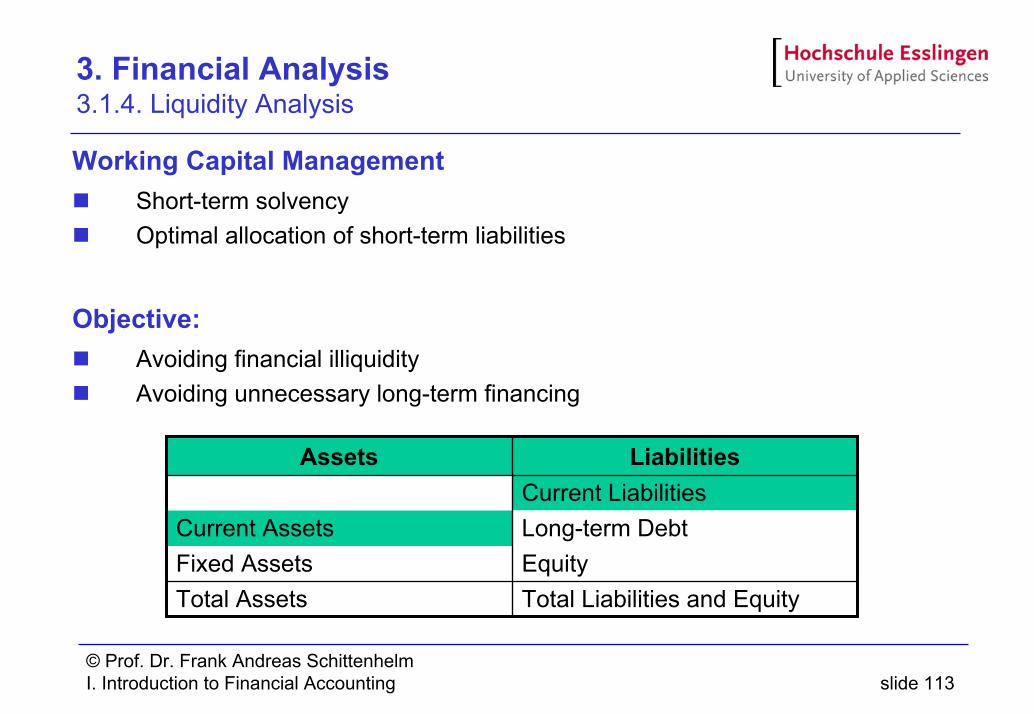
3. Financial Analysis 3.1.4. Liquidity Analysis
Working Capital ManagementShort-term solvencyOptimal allocation of short-term liabilities
Objective:Avoiding financial illiquidityAvoiding unnecessary long-term financing
Current LiabilitiesLong-term DebtCurrent AssetsEquityFixed AssetsTotal Liabilities and EquityTotal Assets
LiabilitiesAssets
© Prof. Dr. Frank Andreas SchittenhelmI. Introduction to Financial Accounting slide 114
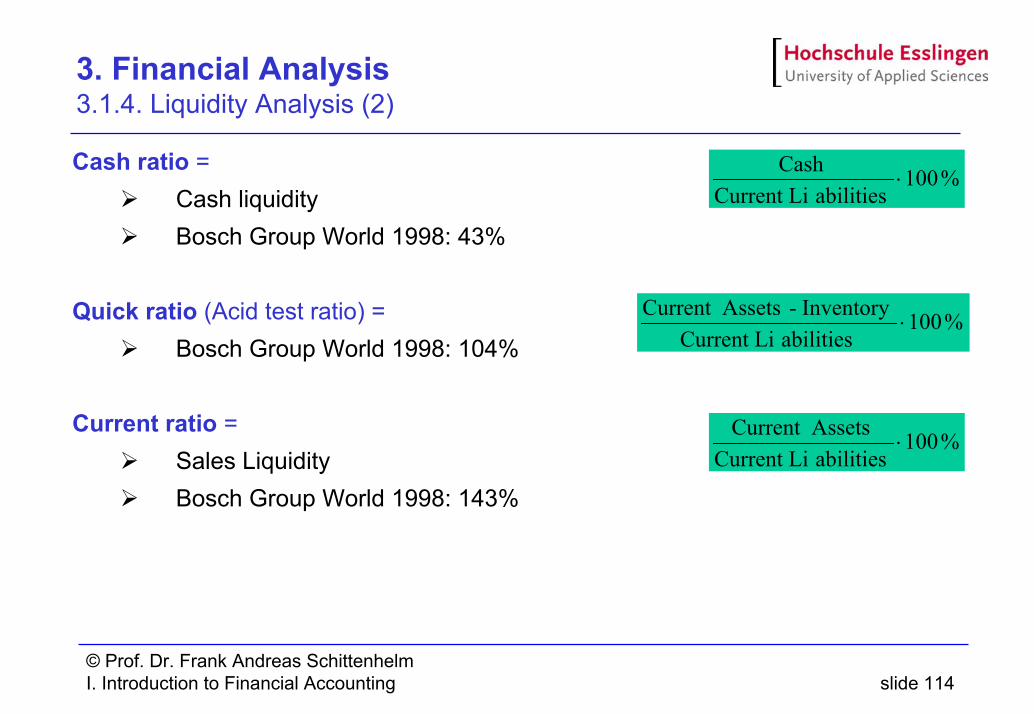
3. Financial Analysis 3.1.4. Liquidity Analysis (2)
Cash ratio =Cash liquidityBosch Group World 1998: 43%
Quick ratio (Acid test ratio) = Bosch Group World 1998: 104%
Current ratio =Sales LiquidityBosch Group World 1998: 143%
%100abilitiesCurrent Li
Cash⋅
%100abilitiesCurrent Li
Inventory -AssetsCurrent ⋅
%100abilitiesCurrent LiAssetsCurrent
⋅
© Prof. Dr. Frank Andreas SchittenhelmI. Introduction to Financial Accounting slide 115
3. Financial Analysis 3.2. Income Statement Analysis
General Information from an Income Statement:How did the company use its assets?How profitable did the capital work?
Forms of Income Statement Analysis:Asset Utilization or Turnover RatiosProfitability Ratios
© Prof. Dr. Frank Andreas SchittenhelmI. Introduction to Financial Accounting slide 116
3. Financial Analysis 3.2.1. Asset Utilization
Working Capital Management (Assets)capital turnover capital lockupwhich capital investment is necessary to realize sales?Receivables turnover Time for paymentfor how long does the company grant credit? Inventory turnover Time of storagehow long does the company hold inventory?
Objective:Reduction of capital lockupReduction of time for paymentReduction of time of storage
Increase flexibility of the company
© Prof. Dr. Frank Andreas SchittenhelmI. Introduction to Financial Accounting slide 117
3. Financial Analysis 3.2.1. Asset Utilization (2)
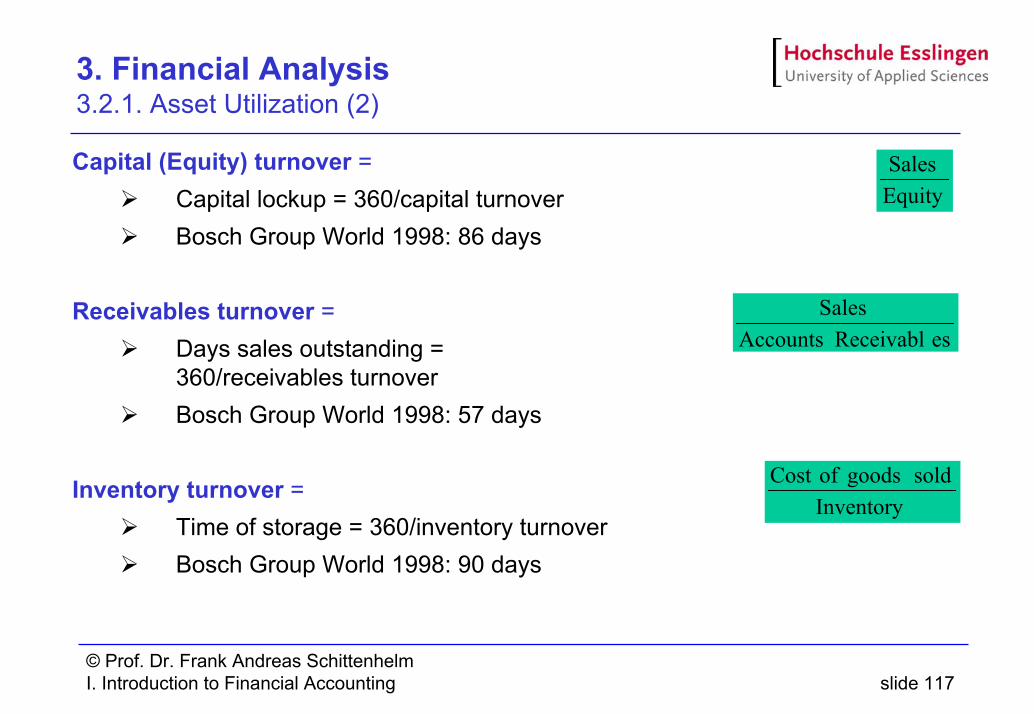
Capital (Equity) turnover =Capital lockup = 360/capital turnoverBosch Group World 1998: 86 days
Receivables turnover = Days sales outstanding = 360/receivables turnoverBosch Group World 1998: 57 days
Inventory turnover =Time of storage = 360/inventory turnoverBosch Group World 1998: 90 days
EquitySales
es ReceivablAccountsSales
Inventorysold goods ofCost
© Prof. Dr. Frank Andreas SchittenhelmI. Introduction to Financial Accounting slide 118
3. Financial Analysis 3.2.2. Profitability Analysis
Net Income correctedEliminate extraordinary IncomeCapital RatiosSales Ratios
Objective:Maximize return on equity Causes of profitability
© Prof. Dr. Frank Andreas SchittenhelmI. Introduction to Financial Accounting slide 119
3. Financial Analysis 3.2.2. Profitability Analysis (2)
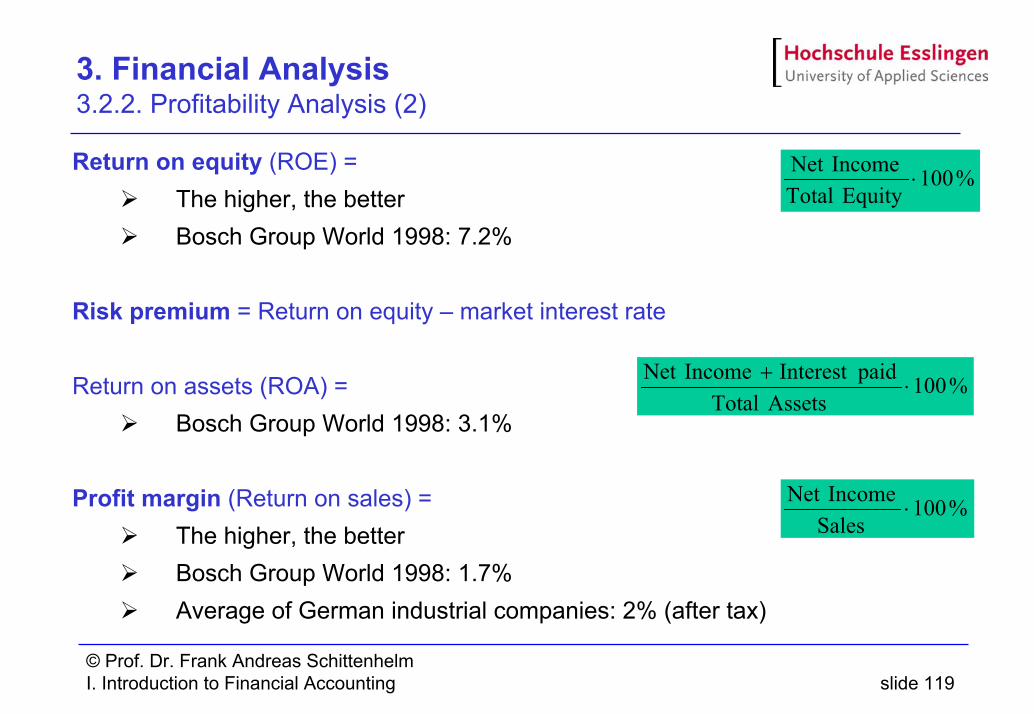
Return on equity (ROE) =The higher, the betterBosch Group World 1998: 7.2%
Risk premium = Return on equity – market interest rate
Return on assets (ROA) = Bosch Group World 1998: 3.1%
Profit margin (Return on sales) =The higher, the betterBosch Group World 1998: 1.7%Average of German industrial companies: 2% (after tax)
%100 EquityTotalIncomeNet
⋅
%100Assets Total
paidInterest IncomeNet ⋅
+
%100SalesIncomeNet
⋅
© Prof. Dr. Frank Andreas SchittenhelmI. Introduction to Financial Accounting slide 120
3. Financial Analysis 3.3. Cash Flow Statement Analysis
General Information from an Cash Flow Statement:What are the financial means of a company to self-finance it? What is financial potential of the company for investments, debt redemption and paying dividends?
Forms of Cash Flow Statement Analysis:Cash flowCash flow marginDynamic gearing
© Prof. Dr. Frank Andreas SchittenhelmI. Introduction to Financial Accounting slide 121
3. Financial Analysis 3.3. Cash Flow Statement Analysis (2)
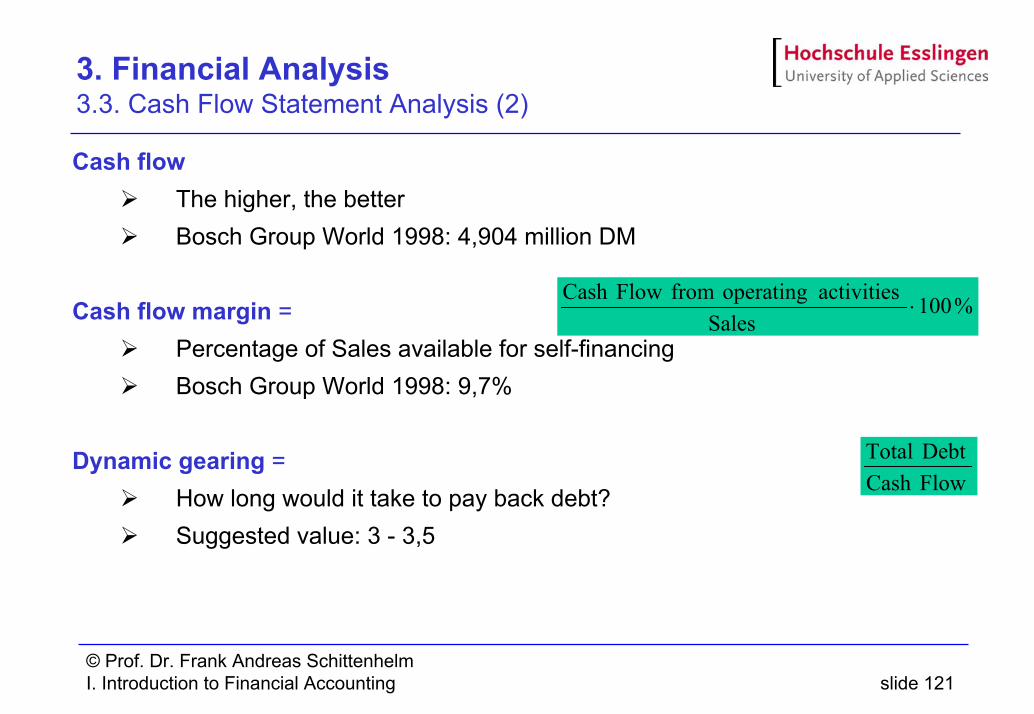
Cash flowThe higher, the betterBosch Group World 1998: 4,904 million DM
Cash flow margin = Percentage of Sales available for self-financingBosch Group World 1998: 9,7%
Dynamic gearing =How long would it take to pay back debt?Suggested value: 3 - 3,5
FlowCash DebtTotal
%100Sales
activities operating from Flow Cash⋅
© Prof. Dr. Frank Andreas SchittenhelmI. Introduction to Financial Accounting slide 122
4. Consolidated Financial Statement
Contents4.0. Introduction4.1. Business Combinations
4.1.1. Accounting as a Pooling4.1.2. Accounting as a Purchase
4.2. Consolidated Statements4.2.1. Consolidation Procedure4.2.2. Minority Interest4.2.3. Example
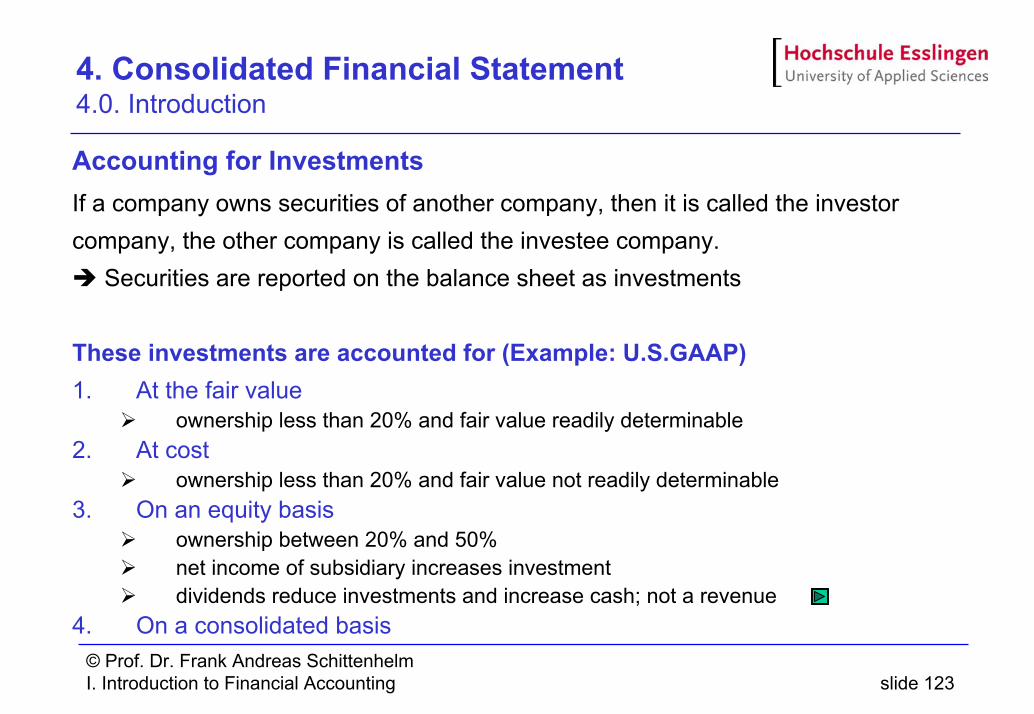
© Prof. Dr. Frank Andreas SchittenhelmI. Introduction to Financial Accounting slide 123
4. Consolidated Financial Statement 4.0. Introduction
Accounting for InvestmentsIf a company owns securities of another company, then it is called the investor company, the other company is called the investee company.
Securities are reported on the balance sheet as investments
These investments are accounted for (Example: U.S.GAAP)1. At the fair value
ownership less than 20% and fair value readily determinable2. At cost
ownership less than 20% and fair value not readily determinable3. On an equity basis
ownership between 20% and 50%net income of subsidiary increases investmentdividends reduce investments and increase cash; not a revenue
4. On a consolidated basis
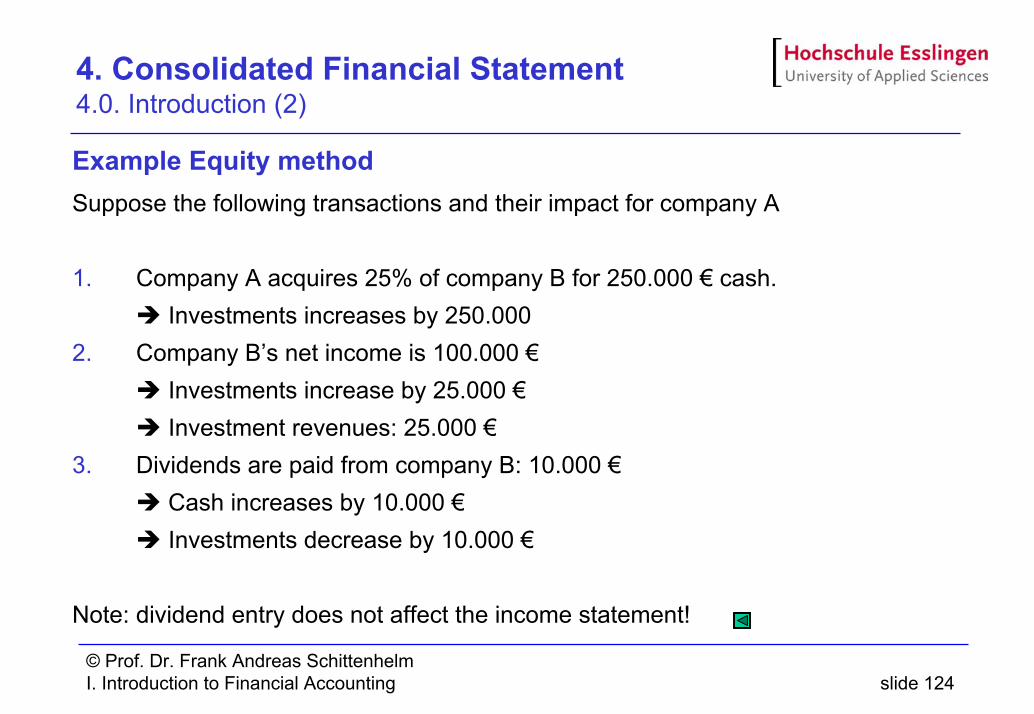
© Prof. Dr. Frank Andreas SchittenhelmI. Introduction to Financial Accounting slide 124
4. Consolidated Financial Statement 4.0. Introduction (2)
Example Equity methodSuppose the following transactions and their impact for company A
1. Company A acquires 25% of company B for 250.000 € cash.Investments increases by 250.000
2. Company B’s net income is 100.000 €Investments increase by 25.000 €Investment revenues: 25.000 €
3. Dividends are paid from company B: 10.000 €Cash increases by 10.000 €Investments decrease by 10.000 €
Note: dividend entry does not affect the income statement!
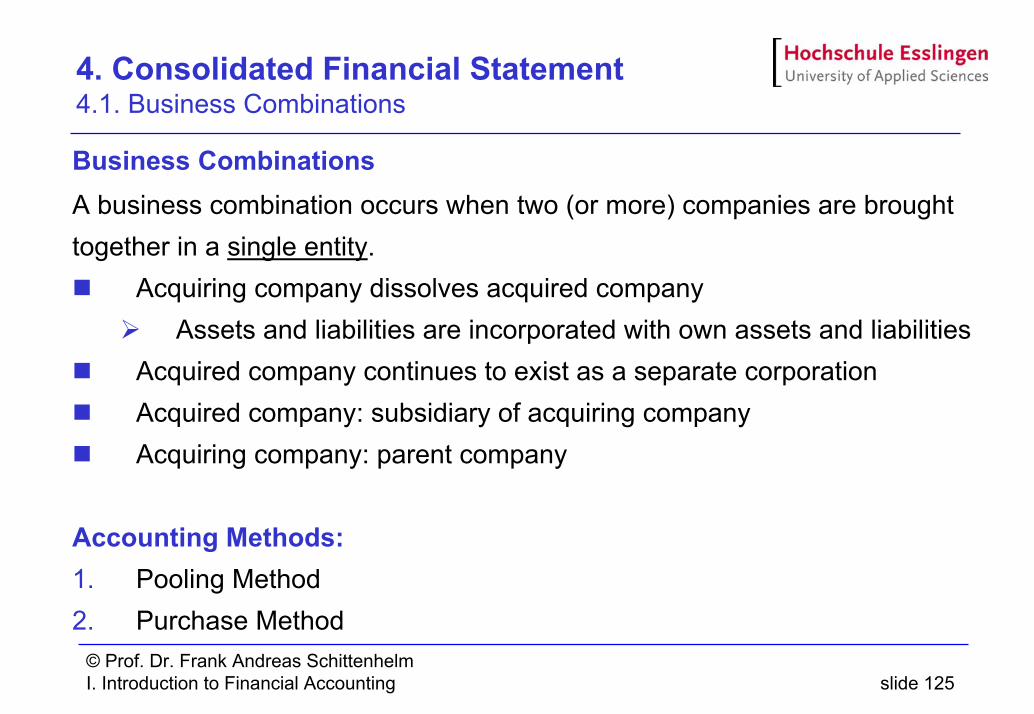
© Prof. Dr. Frank Andreas SchittenhelmI. Introduction to Financial Accounting slide 125
4. Consolidated Financial Statement 4.1. Business Combinations
Business CombinationsA business combination occurs when two (or more) companies are brought together in a single entity.
Acquiring company dissolves acquired companyAssets and liabilities are incorporated with own assets and liabilities
Acquired company continues to exist as a separate corporationAcquired company: subsidiary of acquiring companyAcquiring company: parent company
Accounting Methods:1. Pooling Method2. Purchase Method
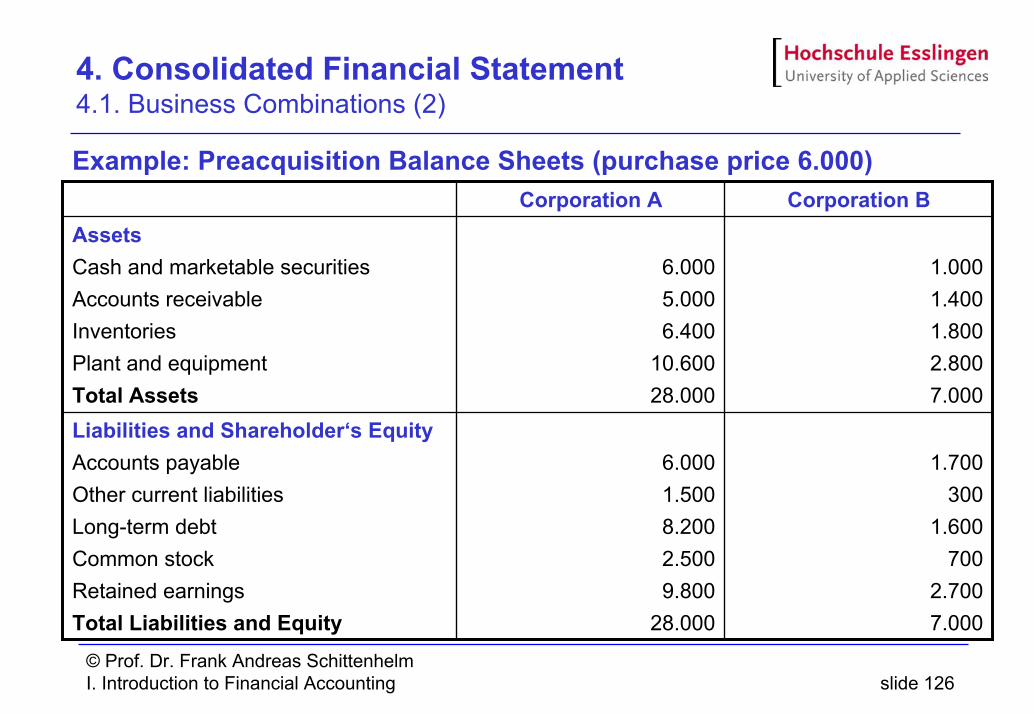
© Prof. Dr. Frank Andreas SchittenhelmI. Introduction to Financial Accounting slide 126
4. Consolidated Financial Statement 4.1. Business Combinations (2)
Example: Preacquisition Balance Sheets (purchase price 6.000)
1.700300
1.600700
2.7007.000
6.0001.5008.2002.5009.800
28.000
Liabilities and Shareholder‘s EquityAccounts payableOther current liabilitiesLong-term debtCommon stockRetained earningsTotal Liabilities and Equity
1.0001.4001.8002.8007.000
6.0005.0006.400
10.60028.000
AssetsCash and marketable securitiesAccounts receivableInventoriesPlant and equipmentTotal Assets
Corporation BCorporation A
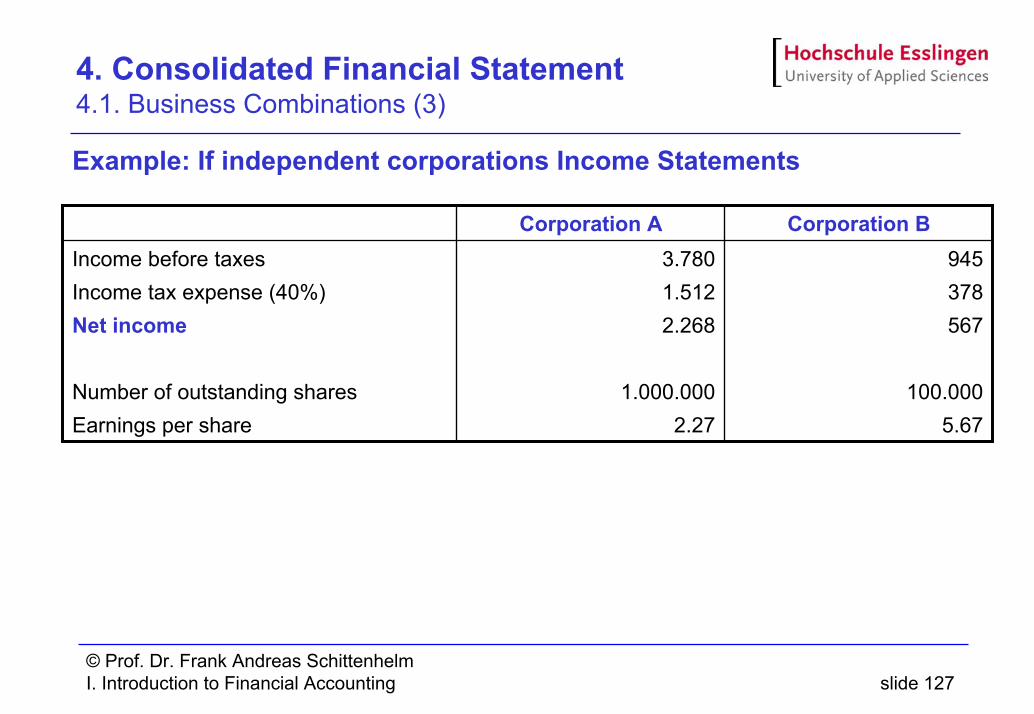
© Prof. Dr. Frank Andreas SchittenhelmI. Introduction to Financial Accounting slide 127
4. Consolidated Financial Statement 4.1. Business Combinations (3)
Example: If independent corporations Income Statements
945378567
100.0005.67
3.7801.5122.268
1.000.0002.27
Income before taxesIncome tax expense (40%)Net income
Number of outstanding sharesEarnings per share
Corporation BCorporation A
© Prof. Dr. Frank Andreas SchittenhelmI. Introduction to Financial Accounting slide 128
4. Consolidated Financial Statement 4.1.1. Accounting as a Pooling
Marriage of the two entitiesMerging of the two firms’ resources, talents, risks, and earnings streams.
Consolidated balance sheet: Balance sheets of the two companies are simply added together.
Any incorporate obligations involved are eliminated.
Note: Under U.S. GAAP and IAS not allowed anymore
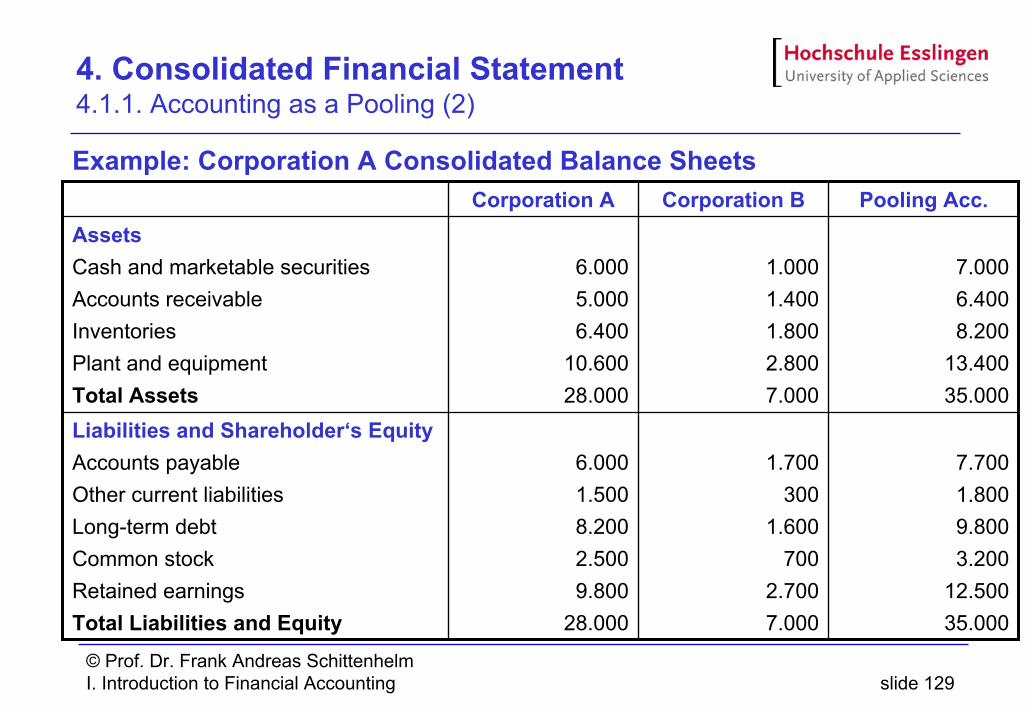
© Prof. Dr. Frank Andreas SchittenhelmI. Introduction to Financial Accounting slide 129
4. Consolidated Financial Statement 4.1.1. Accounting as a Pooling (2)
Example: Corporation A Consolidated Balance Sheets
1.700300
1.600700
2.7007.000
1.0001.4001.8002.8007.000
Corporation B
7.7001.8009.8003.200
12.50035.000
7.0006.4008.200
13.40035.000
Pooling Acc.
6.0001.5008.2002.5009.800
28.000
Liabilities and Shareholder‘s EquityAccounts payableOther current liabilitiesLong-term debtCommon stockRetained earningsTotal Liabilities and Equity
6.0005.0006.400
10.60028.000
AssetsCash and marketable securitiesAccounts receivableInventoriesPlant and equipmentTotal Assets
Corporation A

© Prof. Dr. Frank Andreas SchittenhelmI. Introduction to Financial Accounting slide 130
4. Consolidated Financial Statement 4.1.1. Accounting as a Pooling (3)
Example: Corporation A Consolidated Income Results
945378567
100.0005.67
Corporation B
4.7251.8902.835
1.200.0002.36
Pooling Acc.
3.7801.5122.268
1.000.0002.27
Combined A-B, pooling treatment
Income before taxesIncome tax expense (40%)Net income
Number of outstanding sharesEarnings per share
Corporation A
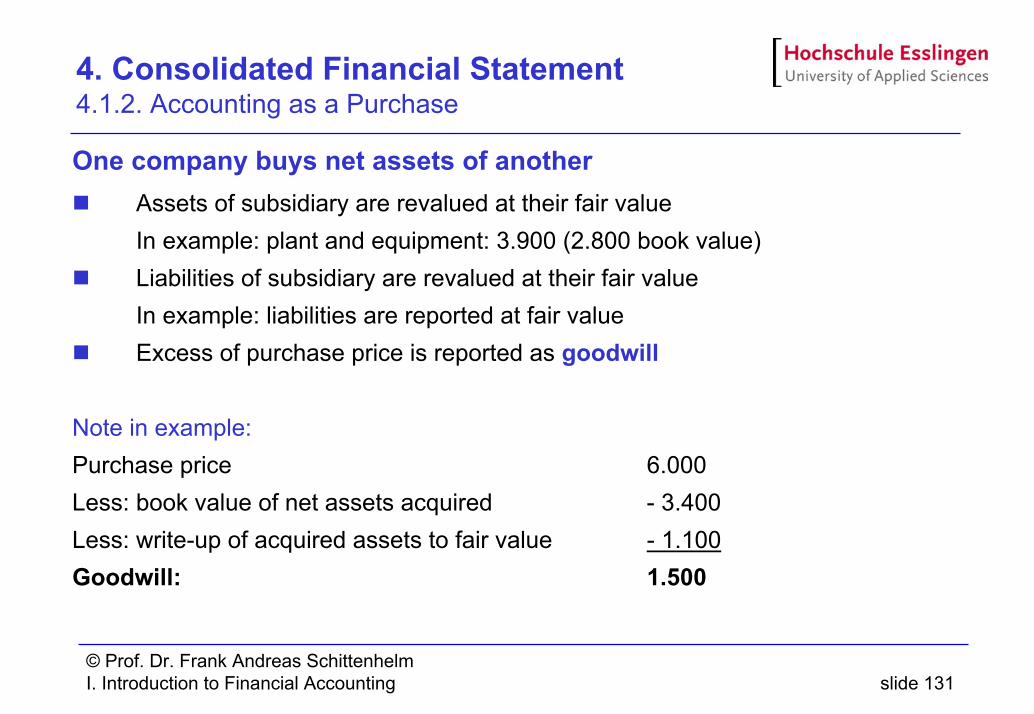
© Prof. Dr. Frank Andreas SchittenhelmI. Introduction to Financial Accounting slide 131
4. Consolidated Financial Statement 4.1.2. Accounting as a Purchase
One company buys net assets of anotherAssets of subsidiary are revalued at their fair valueIn example: plant and equipment: 3.900 (2.800 book value)Liabilities of subsidiary are revalued at their fair valueIn example: liabilities are reported at fair valueExcess of purchase price is reported as goodwill
Note in example:Purchase price 6.000Less: book value of net assets acquired - 3.400Less: write-up of acquired assets to fair value - 1.100Goodwill: 1.500
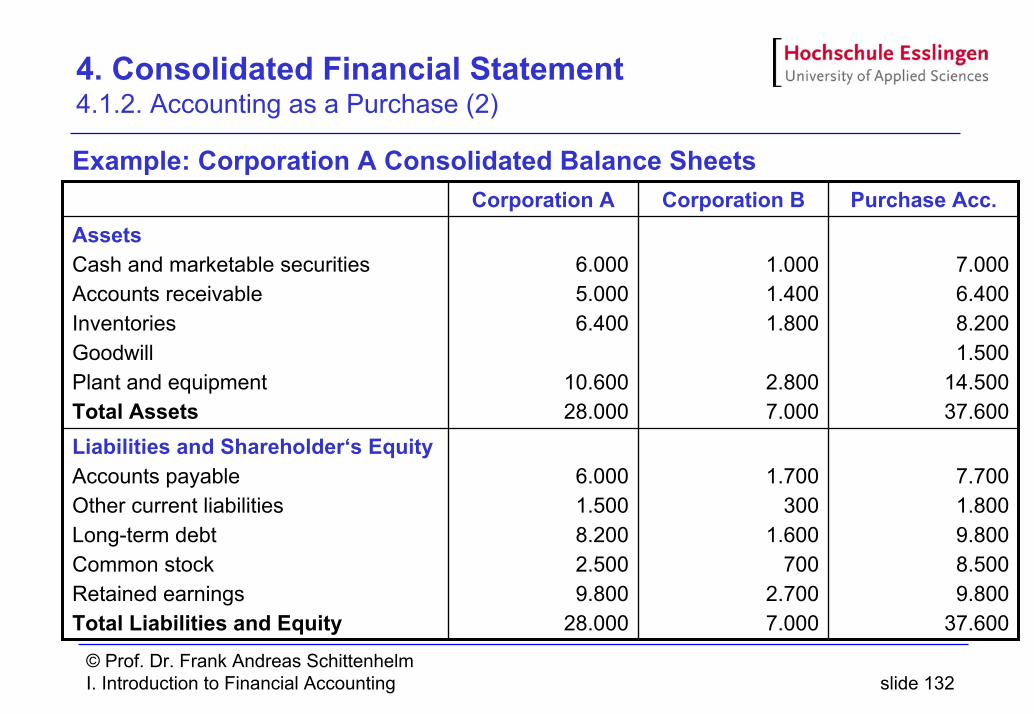
© Prof. Dr. Frank Andreas SchittenhelmI. Introduction to Financial Accounting slide 132
4. Consolidated Financial Statement 4.1.2. Accounting as a Purchase (2)
Example: Corporation A Consolidated Balance Sheets
1.700300
1.600700
2.7007.000
1.0001.4001.800
2.8007.000
Corporation B
7.7001.8009.8008.5009.800
37.600
7.0006.4008.2001.500
14.50037.600
Purchase Acc.
6.0001.5008.2002.5009.800
28.000
Liabilities and Shareholder‘s EquityAccounts payableOther current liabilitiesLong-term debtCommon stockRetained earningsTotal Liabilities and Equity
6.0005.0006.400
10.60028.000
AssetsCash and marketable securitiesAccounts receivableInventoriesGoodwillPlant and equipmentTotal Assets
Corporation A
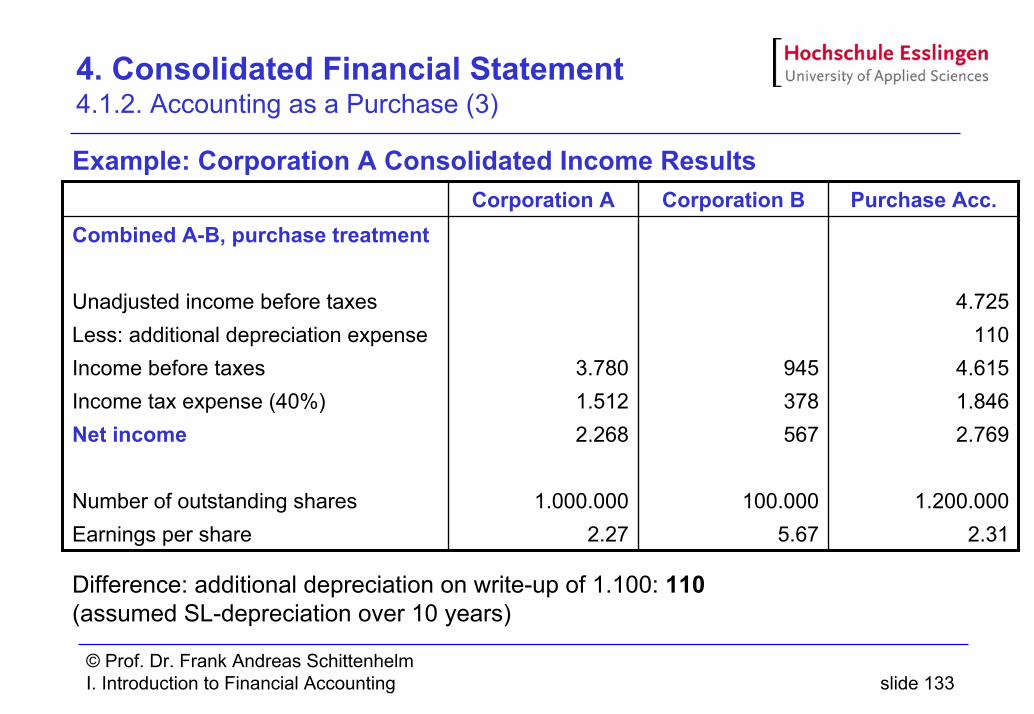
© Prof. Dr. Frank Andreas SchittenhelmI. Introduction to Financial Accounting slide 133
4. Consolidated Financial Statement 4.1.2. Accounting as a Purchase (3)
Example: Corporation A Consolidated Income Results
945378567
100.0005.67
Corporation B
4.725110
4.6151.8462.769
1.200.0002.31
Purchase Acc.
3.7801.5122.268
1.000.0002.27
Combined A-B, purchase treatment
Unadjusted income before taxesLess: additional depreciation expenseIncome before taxesIncome tax expense (40%)Net income
Number of outstanding sharesEarnings per share
Corporation A
Difference: additional depreciation on write-up of 1.100: 110(assumed SL-depreciation over 10 years)
© Prof. Dr. Frank Andreas SchittenhelmI. Introduction to Financial Accounting slide 134
4. Consolidated Financial Statement 4.2. Consolidated Statements
Consolidated Financial StatementsA company that consists of various different corporations. Each corporation
has its own financial statements but the company is required to prepare a set
of financial statements for the whole entity even if it is not a separate legal
entity.
Difficulties:
Basis for Consolidationin the U.S.A.: parent company owns more than 50% of subsidiaryoften: no exact quantitative statement
Different Businesses
Currency exchange
Etc.
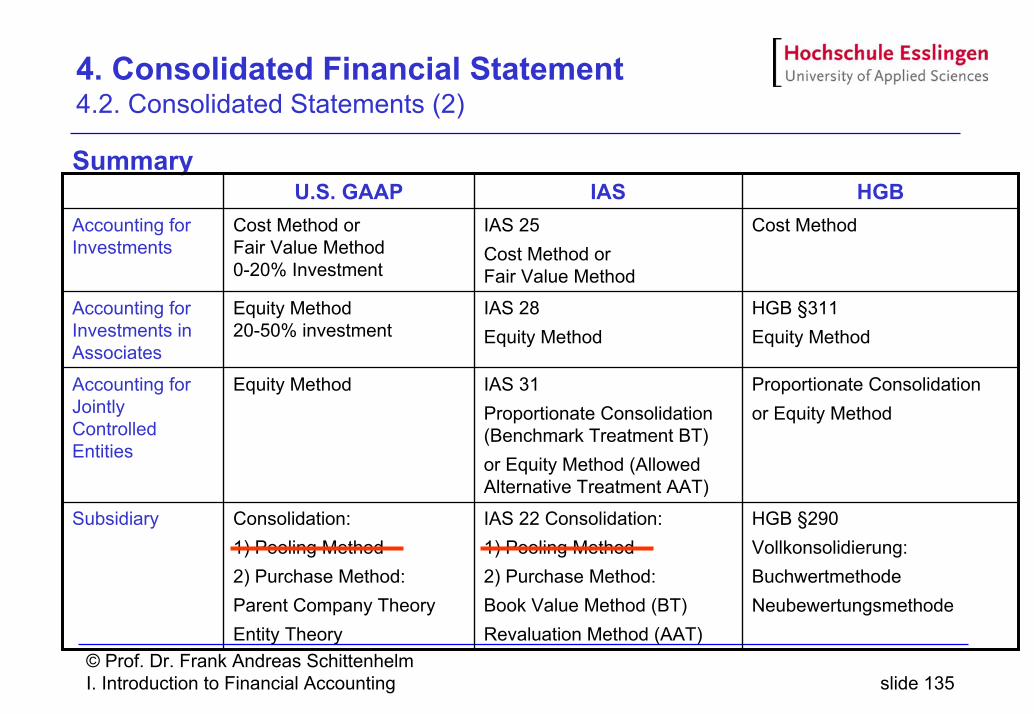
© Prof. Dr. Frank Andreas SchittenhelmI. Introduction to Financial Accounting slide 135
4. Consolidated Financial Statement 4.2. Consolidated Statements (2)
Summary
HGB §290Vollkonsolidierung:BuchwertmethodeNeubewertungsmethode
IAS 22 Consolidation:1) Pooling Method2) Purchase Method:Book Value Method (BT)Revaluation Method (AAT)
Consolidation:1) Pooling Method2) Purchase Method:Parent Company TheoryEntity Theory
Subsidiary
Proportionate Consolidationor Equity Method
IAS 31Proportionate Consolidation(Benchmark Treatment BT)or Equity Method (Allowed Alternative Treatment AAT)
Equity MethodAccounting for Jointly Controlled Entities
HGB §311Equity Method
IAS 28Equity Method
Equity Method20-50% investment
Accounting for Investments in Associates
Cost MethodIAS 25Cost Method or Fair Value Method
Cost Method or Fair Value Method0-20% Investment
Accounting for Investments
HGBIASU.S. GAAP
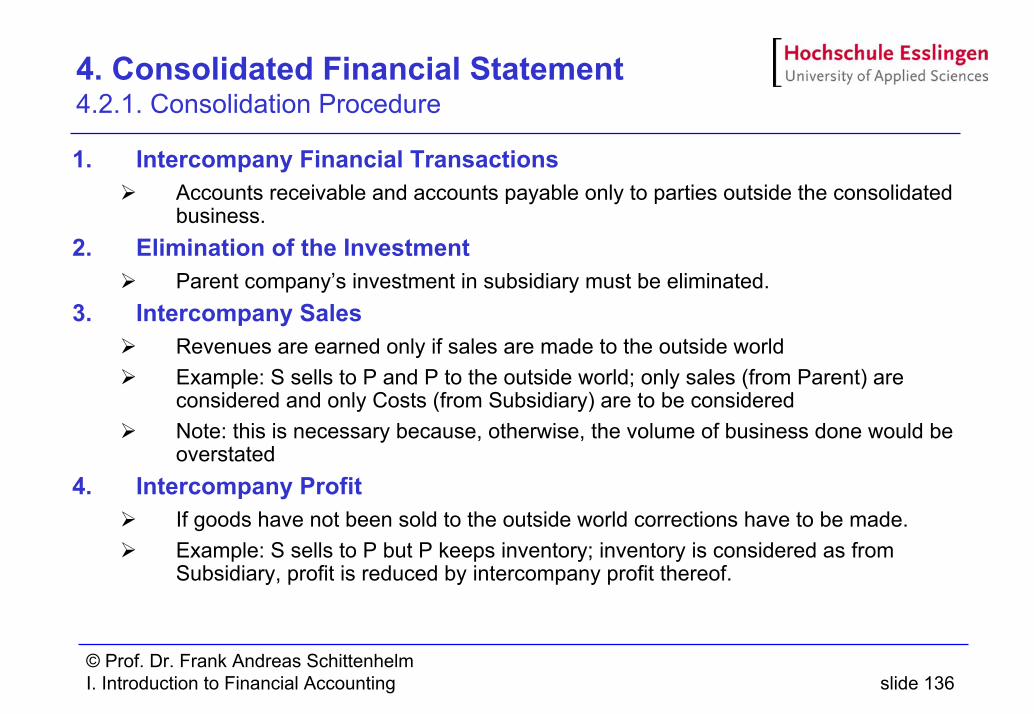
© Prof. Dr. Frank Andreas SchittenhelmI. Introduction to Financial Accounting slide 136
4. Consolidated Financial Statement 4.2.1. Consolidation Procedure
1. Intercompany Financial TransactionsAccounts receivable and accounts payable only to parties outside the consolidated business.
2. Elimination of the InvestmentParent company’s investment in subsidiary must be eliminated.
3. Intercompany SalesRevenues are earned only if sales are made to the outside worldExample: S sells to P and P to the outside world; only sales (from Parent) are considered and only Costs (from Subsidiary) are to be consideredNote: this is necessary because, otherwise, the volume of business done would be overstated
4. Intercompany ProfitIf goods have not been sold to the outside world corrections have to be made.Example: S sells to P but P keeps inventory; inventory is considered as from Subsidiary, profit is reduced by intercompany profit thereof.
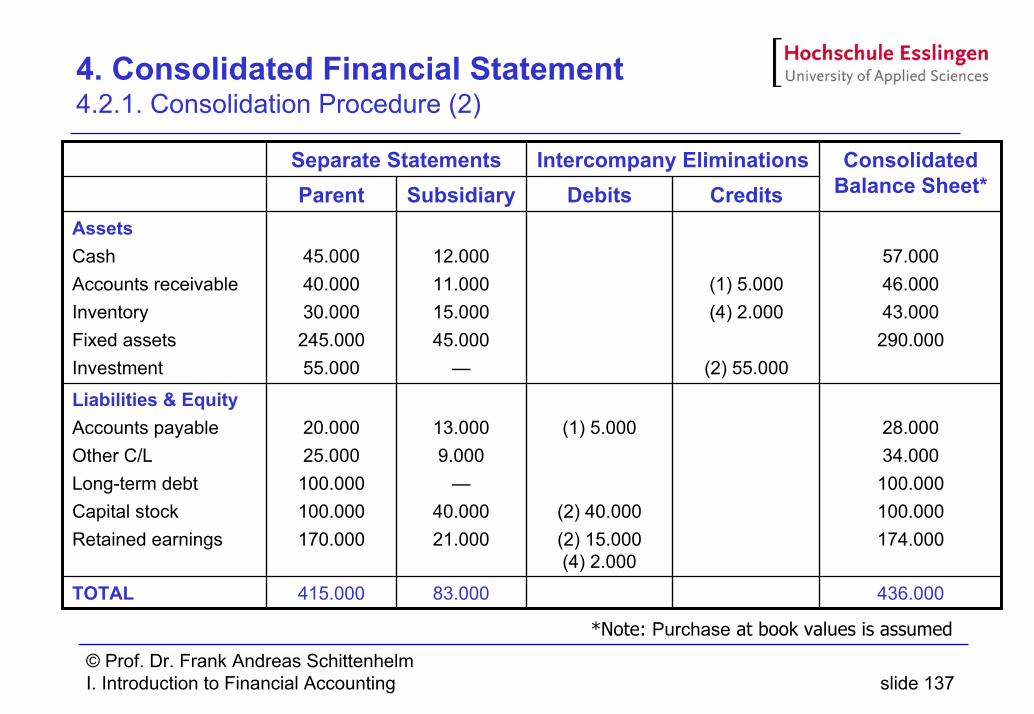
© Prof. Dr. Frank Andreas SchittenhelmI. Introduction to Financial Accounting slide 137
4. Consolidated Financial Statement 4.2.1. Consolidation Procedure (2)
28.00034.000
100.000100.000174.000
(1) 5.000
(2) 40.000(2) 15.000(4) 2.000
13.0009.000
—40.00021.000
20.00025.000
100.000100.000170.000
Liabilities & EquityAccounts payableOther C/LLong-term debtCapital stockRetained earnings
436.00083.000415.000TOTAL
57.00046.00043.000
290.000
(1) 5.000(4) 2.000
(2) 55.000
12.00011.00015.00045.000
—
45.00040.00030.000
245.00055.000
AssetsCashAccounts receivableInventoryFixed assetsInvestment
CreditsDebitsSubsidiaryParentConsolidated
Balance Sheet*Intercompany EliminationsSeparate Statements
*Note: Purchase at book values is assumed
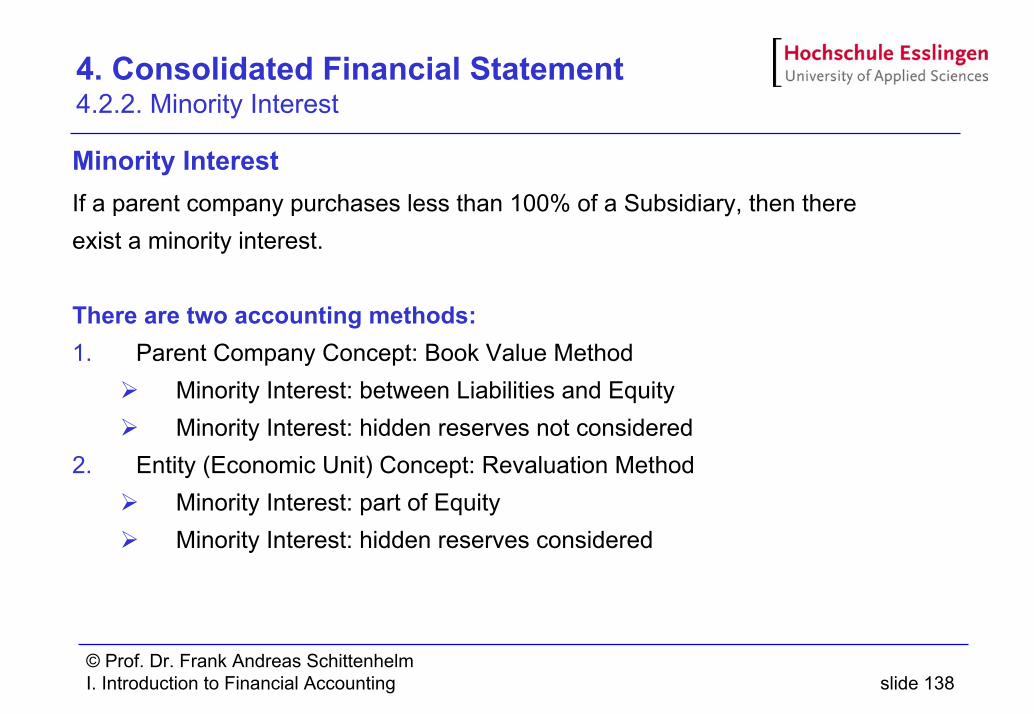
© Prof. Dr. Frank Andreas SchittenhelmI. Introduction to Financial Accounting slide 138
4. Consolidated Financial Statement 4.2.2. Minority Interest
Minority InterestIf a parent company purchases less than 100% of a Subsidiary, then there exist a minority interest.
There are two accounting methods:1. Parent Company Concept: Book Value Method
Minority Interest: between Liabilities and EquityMinority Interest: hidden reserves not considered
2. Entity (Economic Unit) Concept: Revaluation MethodMinority Interest: part of Equity Minority Interest: hidden reserves considered
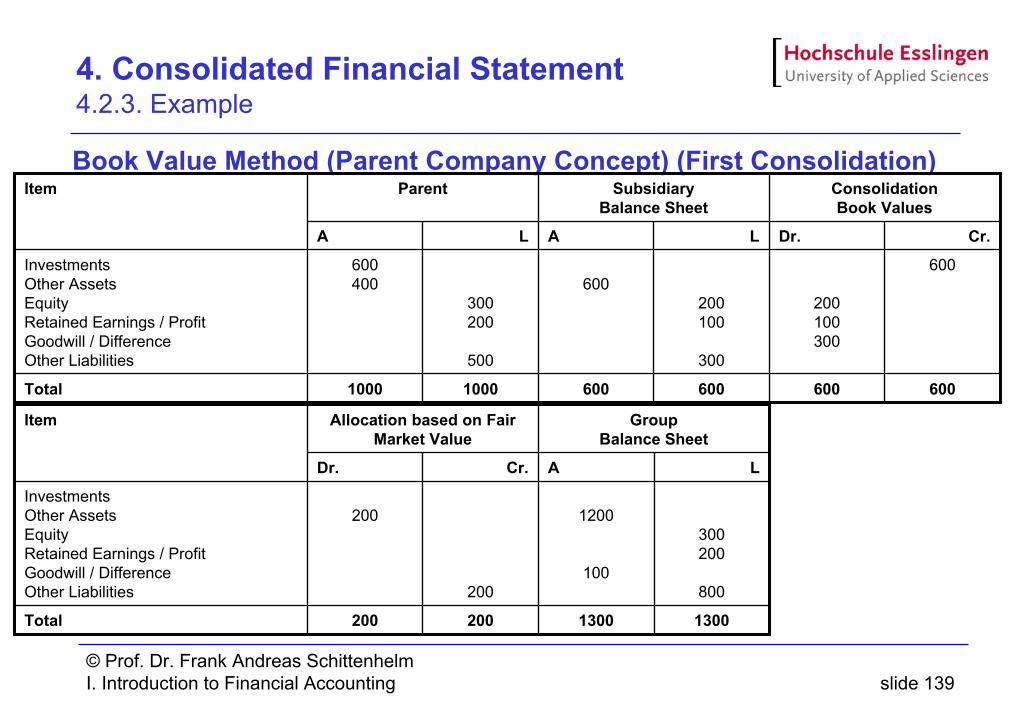
© Prof. Dr. Frank Andreas SchittenhelmI. Introduction to Financial Accounting slide 139
4. Consolidated Financial Statement 4.2.3. Example
Book Value Method (Parent Company Concept) (First Consolidation)ConsolidationBook Values
SubsidiaryBalance Sheet
Parent
1000
600400
A
1000
300200
500
L
600
600
A
600
200100
300
L
600
200100300
Dr.
600Total
600InvestmentsOther AssetsEquityRetained Earnings / ProfitGoodwill / DifferenceOther Liabilities
Cr.
Item
GroupBalance Sheet
Allocation based on Fair Market Value
200
200
Dr.
200
200
Cr.
1300
1200
100
A
1300Total
300200
800
InvestmentsOther AssetsEquityRetained Earnings / ProfitGoodwill / DifferenceOther Liabilities
L
Item
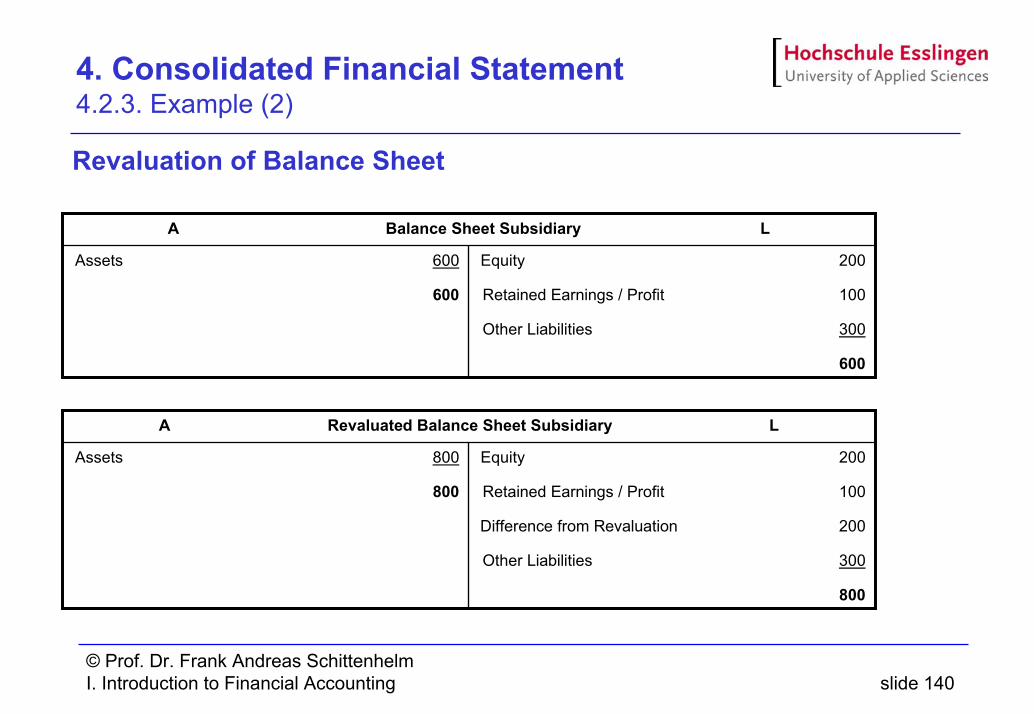
© Prof. Dr. Frank Andreas SchittenhelmI. Introduction to Financial Accounting slide 140
4. Consolidated Financial Statement 4.2.3. Example (2)
Revaluation of Balance Sheet
Equity 200
Retained Earnings / Profit 100
Other Liabilities 300
600
Assets 600
600
A Balance Sheet Subsidiary L
Equity 200
Retained Earnings / Profit 100
Difference from Revaluation 200
Other Liabilities 300
800
Assets 800
800
A Revaluated Balance Sheet Subsidiary L
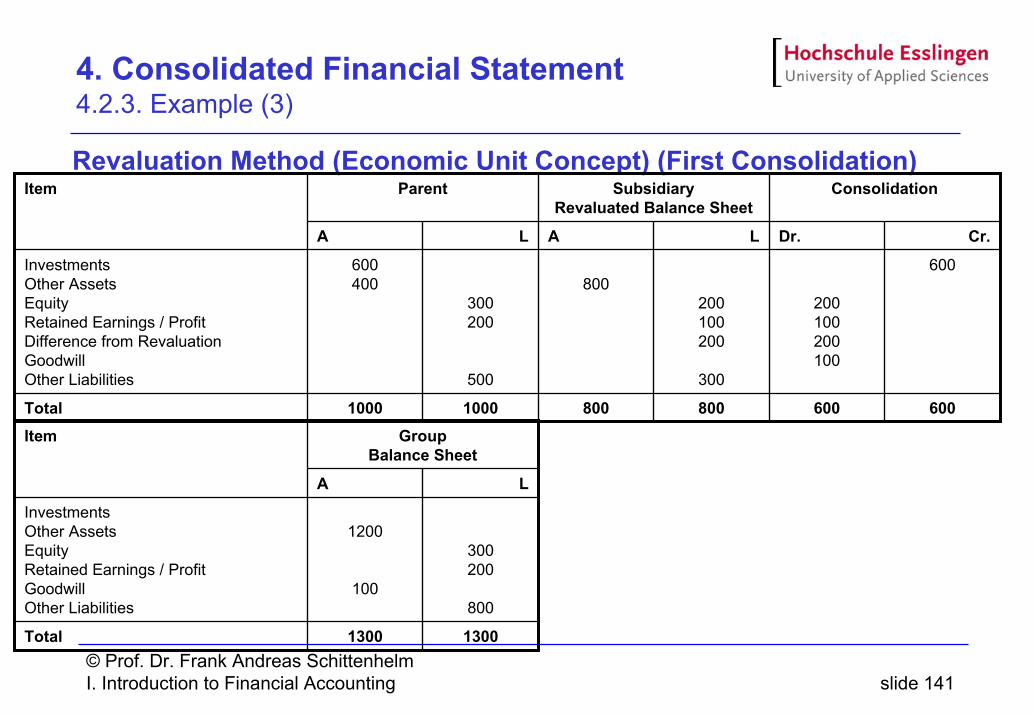
© Prof. Dr. Frank Andreas SchittenhelmI. Introduction to Financial Accounting slide 141
4. Consolidated Financial Statement 4.2.3. Example (3)
Revaluation Method (Economic Unit Concept) (First Consolidation)ConsolidationSubsidiary
Revaluated Balance SheetParent
1000
600400
A
1000
300200
500
L
800
800
A
800
200100200
300
L
600
200100200100
Dr.
600Total
600InvestmentsOther AssetsEquityRetained Earnings / ProfitDifference from RevaluationGoodwillOther Liabilities
Cr.
Item
Total
InvestmentsOther AssetsEquityRetained Earnings / ProfitGoodwillOther Liabilities
Item GroupBalance Sheet
1300
1200
100
A
1300
300200
800
L
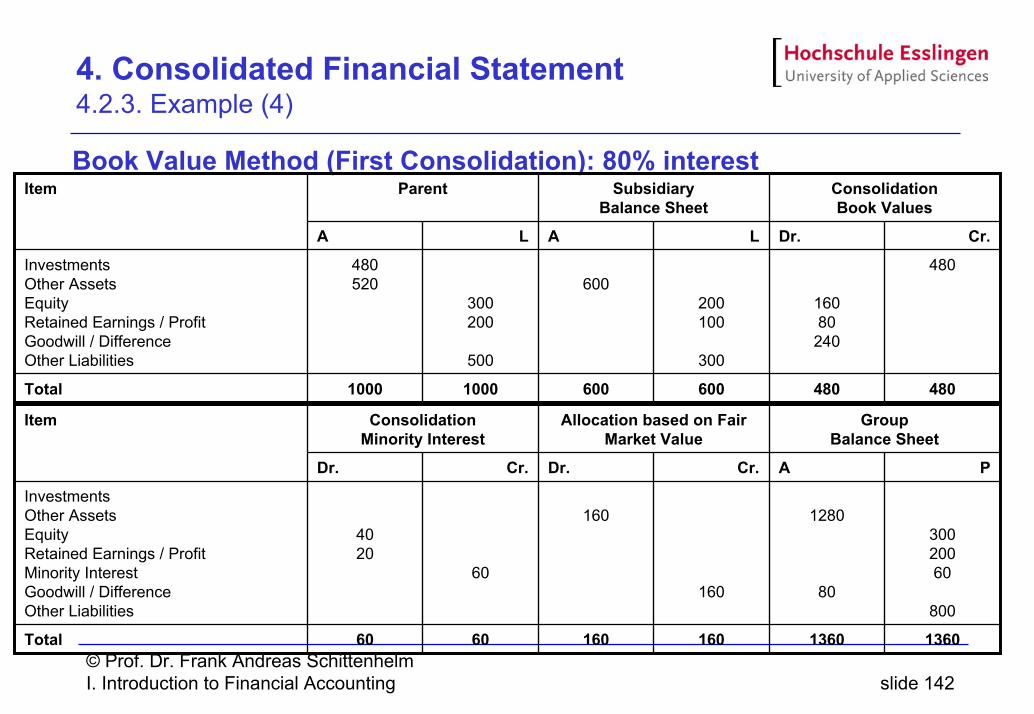
© Prof. Dr. Frank Andreas SchittenhelmI. Introduction to Financial Accounting slide 142
4. Consolidated Financial Statement 4.2.3. Example (4)
Book Value Method (First Consolidation): 80% interestConsolidationBook Values
Subsidiary Balance Sheet
Parent
1000
480520
A
1000
300200
500
L
600
600
A
600
200100
300
L
480
16080240
Dr.
480Total
480InvestmentsOther AssetsEquityRetained Earnings / ProfitGoodwill / Difference Other Liabilities
Cr.
Item
GroupBalance Sheet
Allocation based on Fair Market Value
ConsolidationMinority Interest
60
4020
Dr.
60
60
Cr.
160
160
Dr.
160
160
Cr.
1360
1280
80
A
1360Total
30020060
800
InvestmentsOther AssetsEquityRetained Earnings / ProfitMinority Interest Goodwill / DifferenceOther Liabilities
P
Item
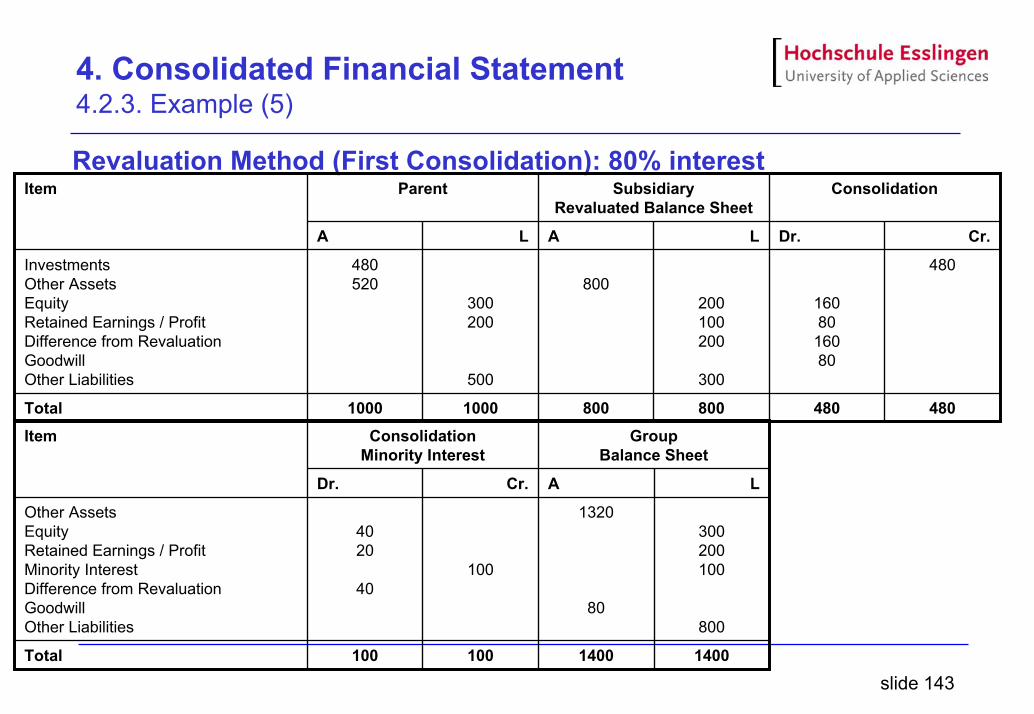
slide 143
4. Consolidated Financial Statement 4.2.3. Example (5)
Revaluation Method (First Consolidation): 80% interestConsolidationSubsidiary
Revaluated Balance SheetParent
1000
480520
A
1000
300200
500
L
800
800
A
800
200100200
300
L
480
1608016080
Dr.
480Total
480InvestmentsOther AssetsEquityRetained Earnings / ProfitDifference from RevaluationGoodwill Other Liabilities
Cr.
Item
GroupBalance Sheet
ConsolidationMinority Interest
100
4020
40
Dr.
100
100
Cr.
1400
1320
80
A
1400Total
300200100
800
Other AssetsEquityRetained Earnings / ProfitMinority Interest Difference from RevaluationGoodwill Other Liabilities
L
Item
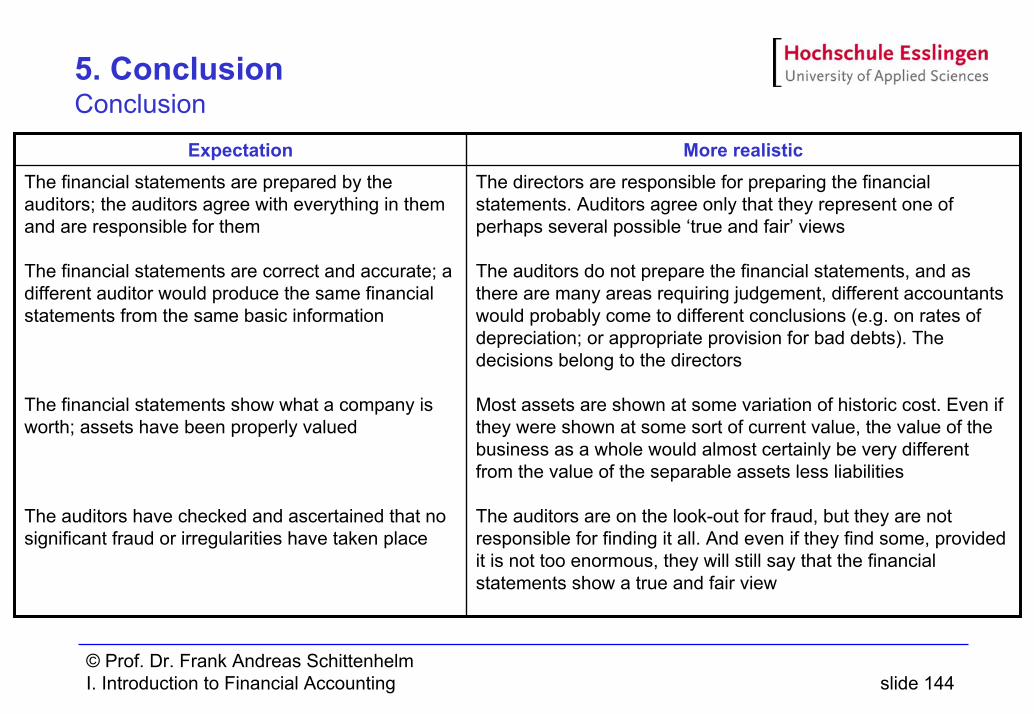
© Prof. Dr. Frank Andreas SchittenhelmI. Introduction to Financial Accounting slide 144
5. Conclusion Conclusion
The directors are responsible for preparing the financial statements. Auditors agree only that they represent one of perhaps several possible ‘true and fair’ views
The auditors do not prepare the financial statements, and as there are many areas requiring judgement, different accountants would probably come to different conclusions (e.g. on rates of depreciation; or appropriate provision for bad debts). The decisions belong to the directors
Most assets are shown at some variation of historic cost. Even if they were shown at some sort of current value, the value of the business as a whole would almost certainly be very different from the value of the separable assets less liabilities
The auditors are on the look-out for fraud, but they are not responsible for finding it all. And even if they find some, provided it is not too enormous, they will still say that the financial statements show a true and fair view
The financial statements are prepared by the auditors; the auditors agree with everything in them and are responsible for them
The financial statements are correct and accurate; a different auditor would produce the same financial statements from the same basic information
The financial statements show what a company is worth; assets have been properly valued
The auditors have checked and ascertained that no significant fraud or irregularities have taken place
More realisticExpectation
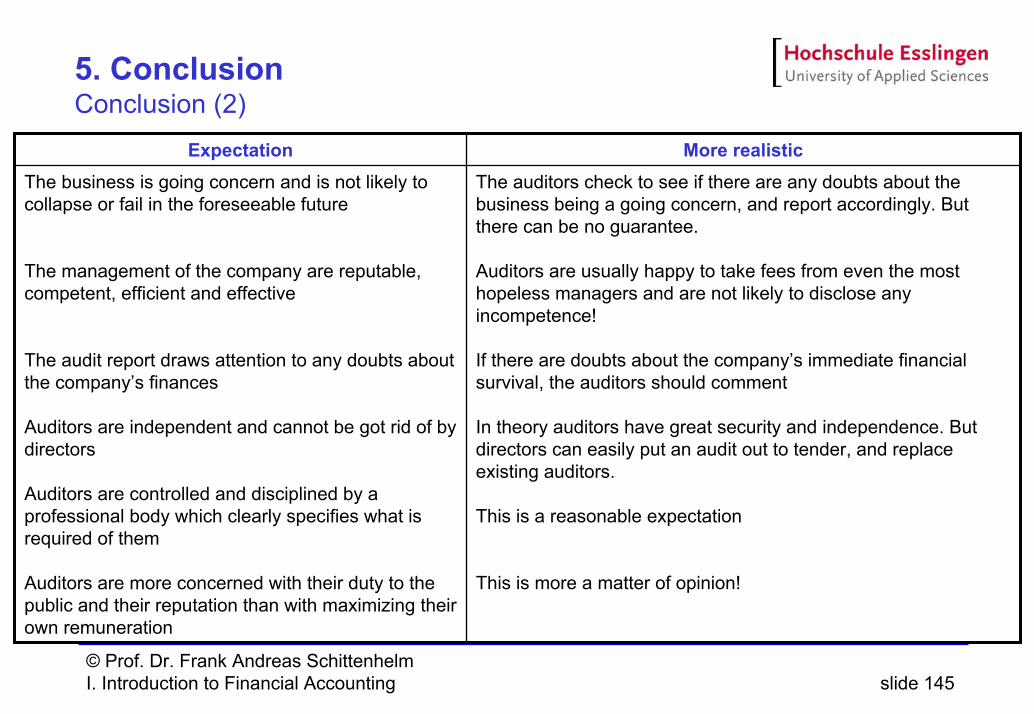
© Prof. Dr. Frank Andreas SchittenhelmI. Introduction to Financial Accounting slide 145
5. Conclusion Conclusion (2)
The auditors check to see if there are any doubts about the business being a going concern, and report accordingly. But there can be no guarantee.
Auditors are usually happy to take fees from even the most hopeless managers and are not likely to disclose any incompetence!
If there are doubts about the company’s immediate financial survival, the auditors should comment
In theory auditors have great security and independence. But directors can easily put an audit out to tender, and replace existing auditors.
This is a reasonable expectation
This is more a matter of opinion!
The business is going concern and is not likely to collapse or fail in the foreseeable future
The management of the company are reputable, competent, efficient and effective
The audit report draws attention to any doubts about the company’s finances
Auditors are independent and cannot be got rid of by directors
Auditors are controlled and disciplined by a professional body which clearly specifies what is required of them
Auditors are more concerned with their duty to the public and their reputation than with maximizing their own remuneration
More realisticExpectation
© Prof. Dr. Frank Andreas SchittenhelmI. Introduction to Financial Accounting slide 146
5. Conclusion Conclusion (3)