Accountable Care Collaborative Annual Report
30
COLORADO DEPARTMENT OF HEALTH CARE POLICY & FINANCING 1570 Grant Street, Denver, CO 80203-1818 (303) 866-2993 (303) 866-4411 Fax John W. Hickenlooper, Governor Susan E. Birch MBA, BSN, RN, Executive Director November 1, 2012 The Honorable Cheri Gerou, Chairman Joint Budget Committee 200 East 14 th Avenue, Third Floor Denver, CO 80203 Dear Representative Gerou: Please find the Department’s response to the Joint Budget Committee on the Department of Health Care Policy and Financing’s Medical Services Premiums, Legislative Request for Information #6. Legislative Request for Information #6 states: The Department is requested to submit a report by November 1, 2012, to the Joint Budget Committee, providing information on the implementation of the Accountable Care Collaborative Organization project. In the report, the Department is requested to inform the Committee on how many Medicaid clients are enrolled in the pilot program, the current administrative fees and costs for the program, and any initial results that demonstrate savings for the pilot program. If data is not available to determine saving results, the Department shall note when such data is anticipated to be available. Attached is the Accountable Care Collaborative annual report which provides information regarding program enrollment, expenditure, and performance in FY 2011-12. Questions regarding this response can be addressed to Laurel Karabatsos, Director, Health Programs, at 303-866-2445. Sincerely, Susan E. Birch, MBA, BSN, RN Executive Director
Transcript of Accountable Care Collaborative Annual Report

COLORADO DEPARTMENT OF HEALTH CARE POLICY & FINANCING
1570 Grant Street, Denver, CO 80203-1818 (303) 866-2993 (303) 866-4411 Fax
John W. Hickenlooper, Governor Susan E. Birch MBA, BSN, RN, Executive Director
November 1, 2012 The Honorable Cheri Gerou, Chairman Joint Budget Committee 200 East 14th Avenue, Third Floor Denver, CO 80203 Dear Representative Gerou: Please find the Department’s response to the Joint Budget Committee on the Department of Health Care Policy and Financing’s Medical Services Premiums, Legislative Request for Information #6. Legislative Request for Information #6 states: The Department is requested to submit a report by November 1, 2012, to the Joint Budget Committee, providing information on the implementation of the Accountable Care Collaborative Organization project. In the report, the Department is requested to inform the Committee on how many Medicaid clients are enrolled in the pilot program, the current administrative fees and costs for the program, and any initial results that demonstrate savings for the pilot program. If data is not available to determine saving results, the Department shall note when such data is anticipated to be available. Attached is the Accountable Care Collaborative annual report which provides information regarding program enrollment, expenditure, and performance in FY 2011-12. Questions regarding this response can be addressed to Laurel Karabatsos, Director, Health Programs, at 303-866-2445. Sincerely, Susan E. Birch, MBA, BSN, RN Executive Director

Enclosure(s) Cc: Senator Mary Hodge, Vice-Chair, Joint Budget Committee Senator Pat Steadman, Joint Budget Committee Senator Kent Lambert, Joint Budget Committee Representative Jon Becker, Joint Budget Committee Representative Claire Levy, Joint Budget Committee Senator Brandon Shaffer, President of the Senate Senator John Morse, Senate Majority Leader Senator Bill Cadman, Senate Minority Leader Representative Frank McNulty, Speaker of the House Representative Amy Stephens, House Majority Leader Representative Mark Ferrandino, House Minority Leader John Ziegler, Staff Director, JBC Eric Kurtz, JBC Analyst Henry Sobanet, Director, Office of State Planning and Budgeting Erick Scheminske, Deputy Director, Office of State Planning and Budgeting Bettina Schneider, Budget Analyst, Office of State Planning and Budgeting Legislative Council Library (6 copies) State Library (4 copies) Susan E. Birch, Executive Director Suzanne Brennan, Health Programs Office Director John Bartholomew, Finance Office Director Lorez Meinhold, Community Partnerships Office Director Dr. Judy Zerzan, Clinical Services Office Director Tom Massey, Policy and Communications Office Director Antoinette Taranto, Client Services Eligibility & Enrollment Office Director Phil Kalin, Center for Improving Value in Health Care (CIVHC) Director Mary Kathryn Hurd, Legislative Liaison Joanne Zahora, Public Information Officer HCPF Budget Library, HCPF Budget Division

COLORADO DEPARTMENT OF HEALTH CARE POLICY AND FINANCING
REPORT TO THE JOINT BUDGET COMMITTEE
ACCOUNTABLE CARE COLLABORATIVE ANNUAL REPORT
NOVEMBER 1, 2012

LRFI 6 Page 1
Executive Summary
The Accountable Care Collaborative completed its first year of operations in June 2012. Initial results of the program are very positive in terms of enrollments, cost savings, quality of care, patient outcomes, and utilization of services. The Department of Health Care Policy and Financing (the Department) submits this annual report on the Accountable Care Collaborative (ACC) Program to the Joint Budget Committee (the Committee) in response to a request for the following items:
1. The number of Medicaid clients enrolled in the pilot program. As of June 2012, the total enrollment was 132,227 including 48,382 members from the “Eligible Children” and “Foster Care” eligibility types and 83,845 clients from other Medicaid eligibility types.
2. The current administrative fees and costs for the program. The administrative costs of the program in FY 2011-12 totaled $17,907,833. The administrative costs consist of the following:
• $12,303,473 for payments to the Regional Care Collaborative Organizations (RCCOs)
• $2,904,360 for payments to Primary Care Medical Providers (PCMPs) • $2,700,000 for services purchased from the Statewide Data and Analytics
Contractor (SDAC)
3. Any initial results that demonstrate savings for the pilot program. If data is not available to determine saving results, the Department shall note when such data is anticipated to be available. Extensive analysis of the program’s performance demonstrates:
• Reduced utilization rates for emergency room (ER) visits, hospital readmissions, and high-cost imaging services;
• Lower rates of aggravated chronic health conditions such as asthma and diabetes; and
• Reduced total cost of care for clients enrolled in the ACC Program. The program is demonstrating cost savings and reductions in utilization, even without full scale program enrollment and operations. Given that the program was ramping up in terms of enrollments, access to claims information, and implementation of care coordination activities, the Department’s November 1, 2013 report will more accurately reflect the full potential of the ACC Program.
Key Performance Indicators Three metrics identify the initial areas of focus for performance improvements based on the reduction of inappropriate service utilization in the ACC Program. The key performance

LRFI 6 Page 2
indicators for both the ACC-enrolled population and the control group of clients not enrolled in the ACC Program are compared to identify the program’s impact.
• Inpatient Hospital Readmissions o ACC members experienced an 8.6 percentage point reduction in hospital
readmissions compared to the non-enrolled group.
• Emergency Room Utilization o Although ER utilization rates increased by an aggregate 1% for all Medicaid
clients since the ACC Program was implemented, utilization by ACC enrollees increased 1.2 percentage points less than utilization by non-enrollees, or an increase of 0.23% for ACC enrollees compared to an increase of 1.47% for non-enrollees.
• High-Cost Imaging Services
o ACC enrollee utilization rates of high-cost imaging services decreased 3.3 percentage points more than the non-enrolled population.
Performance indicators offer insight only to select points along the continuum of care. Consequently, both an analysis of total cost of care and more granular analysis are needed to better understand the impact of the ACC program. Chronic Disease Management Chronic diseases are the most significant drivers of cost in the health care system and a major cause of death and disability. The ACC Program helps prevent the exacerbation of chronic disease through increased access to robust primary care, comprehensive care coordination, and data and analytics that allow providers to maximize these interventions. The ACC Program effectively reduced the rates of:
• Preventable hospitalizations and readmissions for clients with asthma • Preventable hospitalizations and readmissions for clients with diabetes
In addition, prescription drug utilization for medications to manage hypertension increased statewide. Medical management of hypertension is one example of a minor short-term increase in expenditure that is associated with significant mid- to long-term benefits. Untreated hypertension can result in serious cardiovascular illness, renal disease, and a host of other secondary conditions. Treatment of these conditions is significantly more expensive than proactive treatment of hypertension with medications. Further, client outcomes and quality of life are drastically improved when the more serious cardiovascular illness can be avoided. Total Cost of Care In the Department’s February 2012 forecast of Medical Services Premiums expenditure, the Department forecast gross program savings of approximately $20 million for FY 2011-12. Based on results from the first year of program operations, the Department identified an approximate $30 million dollar program savings using industry-standard statistical methods. Using a wider array of statistical methodologies to produce a more conservative

LRFI 6 Page 3
estimate, the Department has calculated a range of estimated gross program savings between $9 million and $30 million for FY 2011-12. While using multiple statistical methodologies creates a relatively large range of savings, when combined with additional evidence on changes in utilization patterns and cost avoidance for specific services, the total cost of care modeling supports the conclusion that the Department’s previous estimate of approximately $20 million gross savings is a reasonable estimate of the program’s impact in FY 2011-12. (See Appendix B for details regarding total cost of care modeling and differences in assumptions between models). Most importantly, all evidence indicates that the program produced results even during the enrollment ramp-up phase of the program, during which access to claims data, provider network infrastructure, and care coordination activities were still being developed. Consequently, the Department expects that the ACC Program will continue to see positive results in future years of operation.

LRFI 6 Page 4
Accountable Care Collaborative Annual Report
The purpose of the Accountable Care Collaborative (ACC) Program is to transform the Medicaid program into a better system of integrated care for clients and to lower costs for the State of Colorado. The goals of the program are to:
• Ensure access to a focal point of care or medical home; • Coordinate medical care and non-medical care; • Improve member and provider experiences; and • Provide the necessary data to support these goals.
The ACC Program is a solution to improving care and reducing costs as well as a long-term investment in better health futures and savings for Colorado’s population. The program design includes a focus on clinically-effective and cost-effective utilization of services.
Accountable Care Program Operations
Core Program Components Three core components of the ACC Program include:
• Regional Care Collaborative Organizations (RCCOs) • Primary Care Medical Providers (PCMPs) • Statewide Data and Analytics Contractor (SDAC)
RCCOs Seven RCCOs are each responsible for a discrete geographic region. The RCCOs’ four main responsibilities are:
• Network development: developing a formal contracted network of primary care providers and an informal network of specialists and ancillary providers;

LRFI 6 Page 5
• Provider support: supporting the PCMPs in providing efficient, high quality care by providing clinical tools, client materials, administrative support, practice redesign, etc;
• Medical management and care coordination: the RCCOs must ensure that every client receives an appropriate level of medical management and care coordination; and
• Accountability and reporting: the RCCOs are responsible for reporting to the state on the region’s progress, and meeting programmatic and Departmental goals.
Primary Care Medical Providers The role of PCMPs is to serve as a focal point of care or medical home for ACC members. Every member should be linked with a PCMP as his or her central point of care. The PCMPs are directly responsible for ensuring timely access to primary care. Statewide Data and Analytics Contractor The Statewide Data and Analytics Contractor (SDAC) is responsible for providing the Department, RCCOs, and PCMPs with actionable data at both the population and client level. Population level data is used to evaluate and improve the program, individual RCCOs, and individual PCMPs. Client level data supports care management activities. The data is provided to the Department, RCCOs, and PCMPs via an online portal with secure, role-based access. Currently, only paid claims data are included. The online Web portal was launched in January of 2012.
The SDAC tracks three Key Performance Indicators (KPIs). The KPIs include:
• Inpatient hospital readmissions; • ER visits; and • High-cost imaging services.
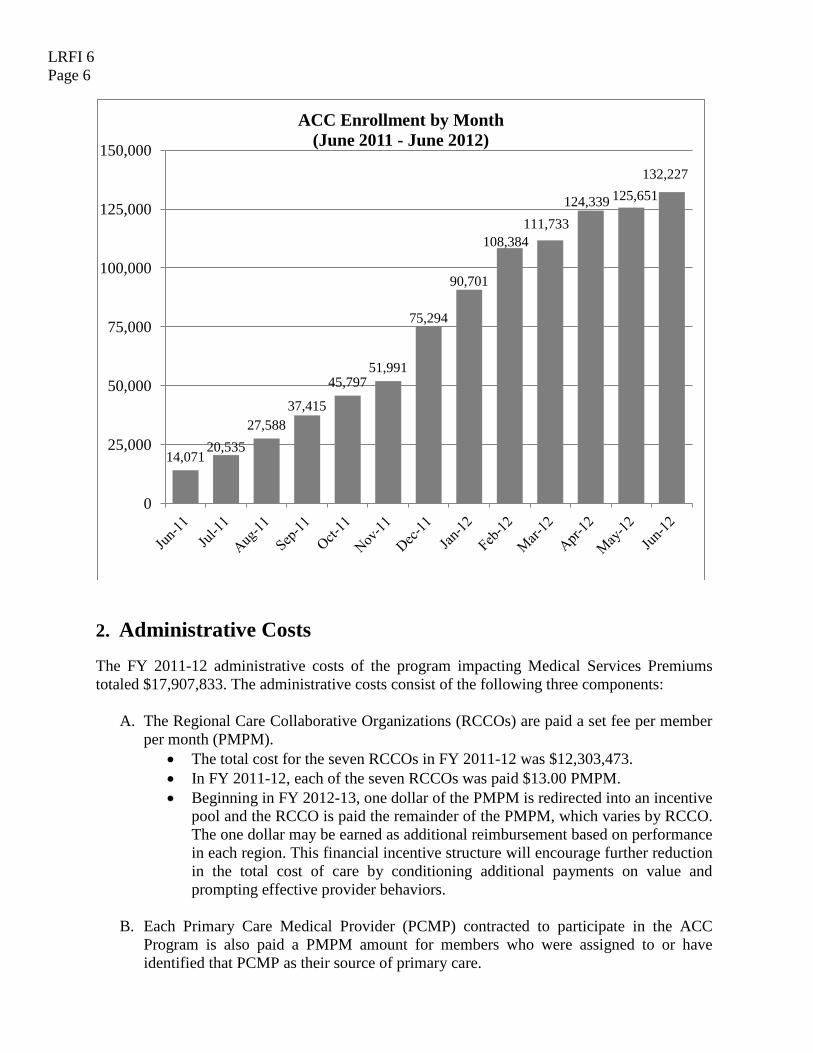
1. Medicaid Enrollment in the ACC Program Over the past year, the number of enrollees in the program has steadily increased each month. As of June 2012, the total enrollment was 132,227, including 48,382 members from the “Eligible Children” and “Foster Care” eligibility types and 83,845 clients from other Medicaid eligibility types. The ACC Program comprised 21% of the total Medicaid population of 619,963 in FY 2011-12. The overall Medicaid population consists of approximately one-third adults and two-thirds children. Because adults in Medicaid generally have more health needs (approximately two-thirds of adults enrolled in Medicaid are eligible through the Aged, Blind, and Disabled (ABD) category), the Department initially enrolled more adults into the program than children. As the program expands, the Department is beginning to align the program’s enrollment with the overall Medicaid population’s ratio of children and adults. Medicaid clients who are institutionalized or who are dually Medicare-Medicaid eligible are not being actively enrolled in the program. However, if clients are institutionalized or become dually Medicare-Medicaid eligible after being enrolled in the ACC Program, they may remain in the program.
LRFI 6 Page 6
2. Administrative Costs
The FY 2011-12 administrative costs of the program impacting Medical Services Premiums totaled $17,907,833. The administrative costs consist of the following three components:
A. The Regional Care Collaborative Organizations (RCCOs) are paid a set fee per member per month (PMPM).
• The total cost for the seven RCCOs in FY 2011-12 was $12,303,473. • In FY 2011-12, each of the seven RCCOs was paid $13.00 PMPM. • Beginning in FY 2012-13, one dollar of the PMPM is redirected into an incentive
pool and the RCCO is paid the remainder of the PMPM, which varies by RCCO. The one dollar may be earned as additional reimbursement based on performance in each region. This financial incentive structure will encourage further reduction in the total cost of care by conditioning additional payments on value and prompting effective provider behaviors.
B. Each Primary Care Medical Provider (PCMP) contracted to participate in the ACC
Program is also paid a PMPM amount for members who were assigned to or have identified that PCMP as their source of primary care.
14,071 20,535
27,588 37,415
45,797 51,991
75,294
90,701
108,384 111,733
124,339 125,651 132,227
0
25,000
50,000
75,000
100,000
125,000
150,000
ACC Enrollment by Month (June 2011 - June 2012)

LRFI 6 Page 7
• The total cost for all PCMPs in FY 2011-12 was $2,904,360. • Beginning in FY 2012-13, one dollar of the PMPM is set aside into an incentive
pool so that the PCMPs are paid $3.00 PMPM with the opportunity to earn the additional dollar based on performance in the region.
C. The Statewide Data and Analytics Contractor (SDAC) has a fixed-price contract based
on a competitive procurement for data and analytics services. • The total cost for SDAC services in FY 2011-12 was $2,700,000.
As the ACC Program expands, the enrolled population is incorporating a higher percentage of children. Due to this change in population mix, the Department worked collaboratively with the RCCOs to adjust the PMPM rate. The adjusted rate reflects a relative reduction in the care coordination and health care needs of enrolled clients and positions the program to successfully achieve savings. Effective November 1, 2012, the PMPM rate is $10.50 with adjustments made based on contract differences between RCCOs. This includes the additional dollar PMPM that can be earned by meeting performance targets. 3. Program Impact Extensive analysis of the program’s performance demonstrates: 1) reduced utilization rates for ER visits, hospital readmissions, and high-cost imaging services; 2) lower rates of exacerbated chronic health conditions such as asthma and diabetes; and 3) reduced total cost of care for clients enrolled in the ACC Program. Additionally, the Department recognizes that there are program impacts that cannot be measured with only Medicaid claims data. Improved client satisfaction is one such impact. The Department expects improved health outcomes will generate positive results in other areas as well. For example, lower child absenteeism due to illness can improve classroom performance. Because results such as these are realistic expectations of improved health outcomes, the impact presented in this report should be treated as the minimum of what the program achieved.
Key Performance Indicators (KPIs) The Department identified three key performance indicators (KPIs) to target initial improvement efforts and gauge the program’s impact on promoting cost-effective and clinically appropriate utilization of services. The KPIs for both the ACC-enrolled population and the control group of clients not enrolled in the ACC Program are compared to identify change.
• Inpatient Hospital Readmissions • Emergency Room (ER) Visits • High-cost Imaging Services
These metrics were adopted because they are strongly correlated with the total cost of care and may be measured using existing claims data. In addition, appropriate utilization of these services may be directly influenced through care coordination and care management practices. Both the PCMPs and the RCCOs have access to a Web portal that details the KPIs of their enrolled members. They are able to monitor and improve their own performance and identify members who may need additional assistance and care.
LRFI 6 Page 8
Key performance indicators are specific points along the continuum of care that can be used to better understand the impact of the ACC Program. However, because the KPIs measure changes in utilization of only certain services, they are unable to capture the full effect of the ACC Program. For example, reduced ER utilization generates savings, but it is not clear from the ER utilization indicator alone whether the reduction was the result of improved client health status or care being accessed in more appropriate settings. When client health status is improved, they need fewer health care services. They might use fewer medications, visit the urgent care less often, or have fewer inpatient hospitalizations. Improved KPIs are a necessary component of demonstrating program effectiveness but cannot account for all influencing factors. Inpatient Hospital Readmissions Re-hospitalizations within thirty days are costly and can often be prevented through coordination between the inpatient and outpatient systems and comprehensive follow up care. This KPI measures the hospital readmissions that occur within 30 days of a member being discharged from an inpatient hospital stay. The ACC Program has demonstrated strong performance in reducing inpatient hospital readmissions. Both Medicaid clients enrolled in the ACC Program and those not enrolled in the program experienced fewer readmissions since the program was implemented. However, ACC members experienced an additional 8.6 percentage point reduction in readmissions compared to the non-enrolled group. Emergency Room Utilization A previous evaluation of Emergency Room (ER) utilization suggested that some Colorado Medicaid clients may be utilizing the ER as a substitute for primary care services. Timely access to primary care can help reduce unnecessary and expensive ER visits by promoting prevention and management of health needs, by engaging clients and families in a familiar provider relationship, and by educating clients on the benefits of continuity of care. The ACC Program’s ability to influence emergency room utilization is heavily reliant upon change in member behaviors when seeking services and is less directly tied to medical management by providers. While many care coordination efforts in the ACC Program include motivational interviewing and client education strategies, health and care seeking behaviors can be deeply ingrained and may be heavily determined by social and environmental factors. Metrics that are more dependent on client behavior change, as opposed to provider practice change, are generally less quickly influenced and the full impact will not be realized in a one year time frame. Although ER utilization rates have been increasing statewide, utilization by ACC enrollees increased to a lesser degree than utilization by non-enrollees. Specifically, the impact of the program on this metric was a diminished increase in utilization of 1.2 percentage points less than the increase shown in the control group.
One RCCO reported having an enrollee who visited the emergency department 32 times in one year. The RCCO assisted the client in establishing a primary care provider and since then the client has only visited the ER once.
LRFI 6 Page 9
The RCCO region with the highest ER utilization prior to implementation of the ACC Program exhibited the greatest decrease: enrollees experienced a decrease in utilization of 14 percentage points compared to non-enrollees in this region. Such significant impact on ER utilization in the first full program year indicates an opportunity to replicate similar achievement statewide. The Department is supporting cross-RCCO collaboration so that the regions may share successful strategies. Anecdotally, one RCCO reported that one of their ACC members visited the ER 20 times in one month with vague medical complaints such as stomach pain. After developing a relationship with the client, the care coordinator determined that the client was primarily suffering from anxiety and helped connect the client to mental health services. The member’s ER utilization has dramatically decreased and she reports feeling much better. High-Cost Imaging High-tech imaging tools, such as MRIs and CT scans, are commonly used diagnostic services that in recent years have developed into one of the fastest growing areas of medical spending. However, more cost effective alternatives are frequently available without compromising clinical efficacy and quality of care for clients. This high-cost imaging key performance indicator exemplifies the Department’s efforts to move away from a volume-driven to a value-based system of care. In FY 2011-12, the utilization rates of high-cost imaging services declined for both the ACC-enrolled population and the non-ACC enrolled population. However, the decrease for ACC enrollees was 3 percentage points greater than the decrease of the non-ACC-enrolled population. The additional decrease suggests program effectiveness and the promotion of more clinically appropriate and cost effective diagnostics. At the regional level, the ACC-enrolled population’s use of high-cost imaging services differed relative to the control population ranging from a 7.7% decrease to a 1.8% increase, with six of the seven RCCOs showing decreases in utilization. Chronic Disease Management Chronic diseases are significant drivers of cost in the health care system and a major cause of death and disability. An examination of metrics related to asthma, diabetes, and prescription drug therapies for hypertension demonstrates how the ACC Program is contributing to the prevention of avoidable services while simultaneously promoting cost-effective and efficacious treatments.
LRFI 6 Page 10
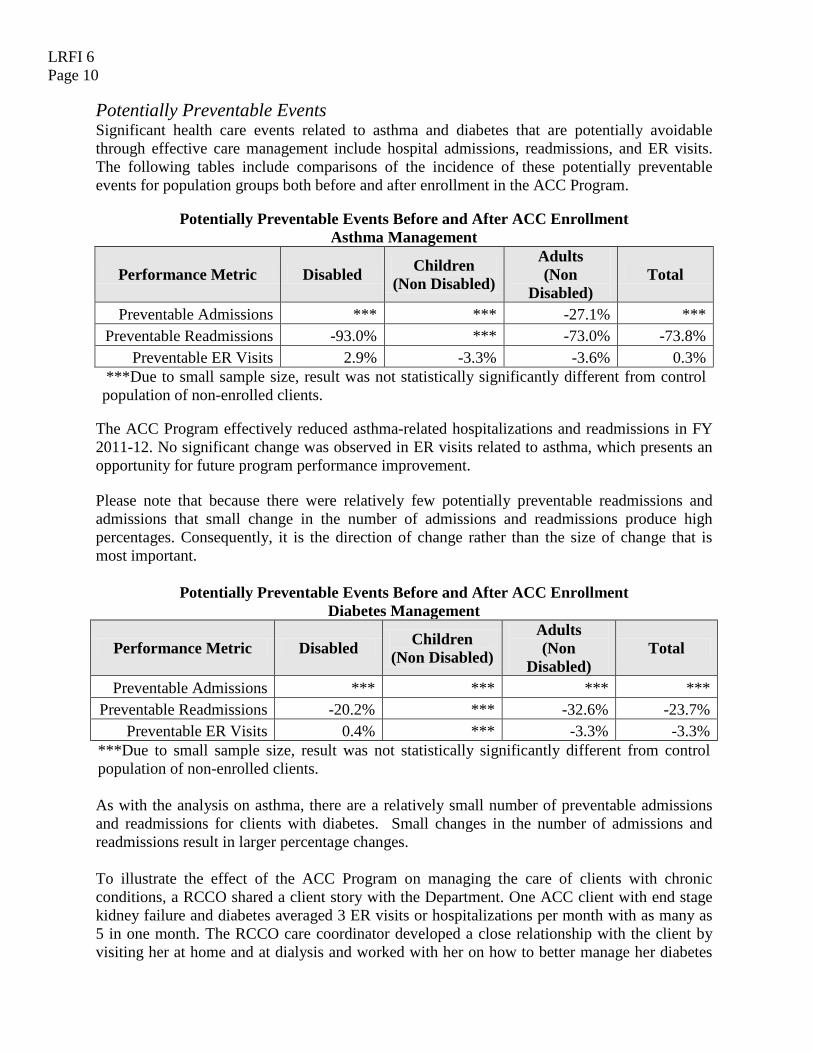
Potentially Preventable Events Significant health care events related to asthma and diabetes that are potentially avoidable through effective care management include hospital admissions, readmissions, and ER visits. The following tables include comparisons of the incidence of these potentially preventable events for population groups both before and after enrollment in the ACC Program.
Potentially Preventable Events Before and After ACC Enrollment
Asthma Management
Performance Metric Disabled Children (Non Disabled)
Adults (Non
Disabled) Total
Preventable Admissions *** *** -27.1% *** Preventable Readmissions -93.0% *** -73.0% -73.8%
Preventable ER Visits 2.9% -3.3% -3.6% 0.3% ***Due to small sample size, result was not statistically significantly different from control population of non-enrolled clients.
The ACC Program effectively reduced asthma-related hospitalizations and readmissions in FY 2011-12. No significant change was observed in ER visits related to asthma, which presents an opportunity for future program performance improvement. Please note that because there were relatively few potentially preventable readmissions and admissions that small change in the number of admissions and readmissions produce high percentages. Consequently, it is the direction of change rather than the size of change that is most important.
Potentially Preventable Events Before and After ACC Enrollment
Diabetes Management
Performance Metric Disabled Children (Non Disabled)
Adults (Non
Disabled) Total
Preventable Admissions *** *** *** *** Preventable Readmissions -20.2% *** -32.6% -23.7%
Preventable ER Visits 0.4% *** -3.3% -3.3% ***Due to small sample size, result was not statistically significantly different from control population of non-enrolled clients. As with the analysis on asthma, there are a relatively small number of preventable admissions and readmissions for clients with diabetes. Small changes in the number of admissions and readmissions result in larger percentage changes. To illustrate the effect of the ACC Program on managing the care of clients with chronic conditions, a RCCO shared a client story with the Department. One ACC client with end stage kidney failure and diabetes averaged 3 ER visits or hospitalizations per month with as many as 5 in one month. The RCCO care coordinator developed a close relationship with the client by visiting her at home and at dialysis and worked with her on how to better manage her diabetes
LRFI 6 Page 11
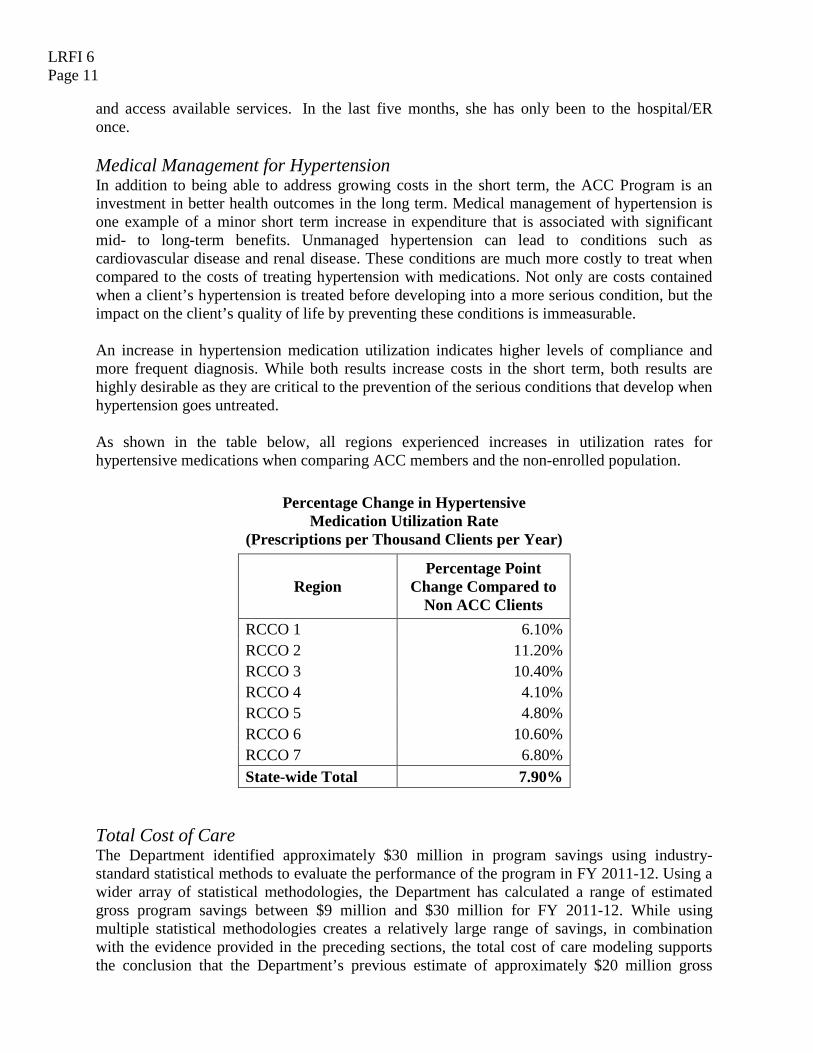
and access available services. In the last five months, she has only been to the hospital/ER once. Medical Management for Hypertension In addition to being able to address growing costs in the short term, the ACC Program is an investment in better health outcomes in the long term. Medical management of hypertension is one example of a minor short term increase in expenditure that is associated with significant mid- to long-term benefits. Unmanaged hypertension can lead to conditions such as cardiovascular disease and renal disease. These conditions are much more costly to treat when compared to the costs of treating hypertension with medications. Not only are costs contained when a client’s hypertension is treated before developing into a more serious condition, but the impact on the client’s quality of life by preventing these conditions is immeasurable. An increase in hypertension medication utilization indicates higher levels of compliance and more frequent diagnosis. While both results increase costs in the short term, both results are highly desirable as they are critical to the prevention of the serious conditions that develop when hypertension goes untreated. As shown in the table below, all regions experienced increases in utilization rates for hypertensive medications when comparing ACC members and the non-enrolled population.
Percentage Change in Hypertensive
Medication Utilization Rate (Prescriptions per Thousand Clients per Year)
Region Percentage Point
Change Compared to Non ACC Clients
RCCO 1 6.10% RCCO 2 11.20% RCCO 3 10.40% RCCO 4 4.10% RCCO 5 4.80% RCCO 6 10.60% RCCO 7 6.80% State-wide Total 7.90%
Total Cost of Care The Department identified approximately $30 million in program savings using industry-standard statistical methods to evaluate the performance of the program in FY 2011-12. Using a wider array of statistical methodologies, the Department has calculated a range of estimated gross program savings between $9 million and $30 million for FY 2011-12. While using multiple statistical methodologies creates a relatively large range of savings, in combination with the evidence provided in the preceding sections, the total cost of care modeling supports the conclusion that the Department’s previous estimate of approximately $20 million gross

LRFI 6 Page 12
savings is still a reasonable estimate of the program’s impact in FY 2011-12. (See Appendix B for details regarding total cost of care modeling and differences in assumptions between models). The metrics in this report frequently use non-ACC clients as a control group. However, non-ACC clients who are receiving care from practices enrolled as PCMPs in the program may also receive some of the program’s benefits because the ACC Program is designed to transform the delivery system at the practice level. The potential for positively influencing results for clients in the control group may in turn negatively skew the program’s performance results. It is therefore possible that the positive results reported here underestimate an even greater positive program impact. Conclusion All indications show that the ACC Program is both reducing costs for clients enrolled in the program and improving client outcomes. As the program continues to expand, the Department will utilize lessons learned and best practices identified to further improve the program; the program is iterative and there remain opportunities for improvement. Additionally, because evidence supports the conclusion that the program produced results even during the enrollment ramp-up phase of the program, during which the access to claims data, provider network infrastructure, and care coordination activities were still being developed, the Department expects that the ACC Program will continue to see positive results in future years of operation. Lastly, by improving client outcomes, the ACC Program has effects that go well beyond the health care arena. For example, there are impacts in the Judicial, Education, and Health and Human Services Systems that are not captured in this report but are reasonable results to expect from the ACC Program. The Department will continue to evaluate, grow, and improve the ACC Program to maximize the benefits within the health care sphere and the externalities it generates.

LRFI 6 - Appendix Page 1
Appendix A – Overview of the ACC Program Program Background The Department implemented the Accountable Care Collaborative (ACC) Program in May 2011 as the predominant Medicaid system reform. The ACC Program represents a committed effort to transform the Medicaid Program into an integrated system of better care for all its members and to lower costs for the State of Colorado. In the early 2000s, a number of managed care plans withdrew from Medicaid, leaving 80% of the Colorado Medicaid population in a fee-for-service payment system. Fee-for-service reimbursement has been shown to be an inefficient and ineffective payment method for health care. After seeing an increase in the number of Medicaid enrollees and the resulting rising costs, the Department took the initiative to develop a plan for achieving greater efficiency. The Department developed a Colorado-specific solution, the ACC Program, in collaboration with stakeholders. In 2009, the legislature passed a budget action authorizing the Medicaid Value-Based Care Coordination Initiative, now known as the ACC Program. Stakeholders have been vital to the design, implementation, and ongoing evolution of the ACC Program, and ongoing stakeholder engagement is continuously achieved through a robust advisory committee process. Higher quality and lower cost health care can be accomplished, but changing a system as large as the state’s Medicaid Program necessitates progressive evolution rather than overnight metamorphosis. The Department has outlined four goals for the ACC Program. The program will:
1. Ensure access to a focal point of care or medical home; 2. Coordinate medical care and non-medical care; 3. Improve member and provider experiences; and 4. Provide the necessary data to support these goals.
The ACC Program is a short-term solution to improving care and reducing costs as well as a long-term investment in better health futures and savings for Colorado’s population. The program design includes an immediate focus on cost- and clinically-effective utilization of services. Coordination of care and an enhanced emphasis on wellness and prevention is expected to result in better health and reduced costs across the lifespan of current members. Program Design The three core components of the ACC Program include:
• Regional Care Collaborative Organizations (RCCOs), to ensure cost and quality outcomes for their Medicaid members;
• Primary Care Medical Providers (PCMPs), to serve as the focal point of care for each member;
• Statewide Data and Analytics Contractor (SDAC), to provide actionable data at both the population and client level.

LRFI 6 - Appendix Page 2
Regional Care Collaborative Organizations For the purpose of the ACC Program, the state is geographically divided into seven regions, each having one Regional Care Collaborative Organization (RCCO) responsible for all of the ACC members in that region. The program was designed this way to promote collaboration and avoid a scenario in which multiple entities compete for Medicaid clients. The seven RCCO contracts were awarded in late 2010 and early 2011 through a competitive procurement process. The RCCOs’ four main responsibilities are:
• Network Development: Develop a formal contracted network of primary care providers and an informal network of specialists and ancillary providers. This addresses the core program goal of ensuring access to primary care.
• Provider Support: Support the PCMPs in providing efficient, high quality care through activities such as providing clinical tools, client materials, administrative support, practice redesign, etc. This responsibility ties to the core program goal of ensuring a positive provider experience.
• Medical Management and Care Coordination: The RCCOs must ensure that every client receives an appropriate level of medical management and care coordination. This links to the program goal of ensuring a positive provider experience as well as a positive member experience. RCCOs can assist providers with addressing the non-medical needs of their clients that they may not have the in-house capacity to address.
• Accountability and Reporting: the RCCOs are responsible for reporting to the state on the region’s progress.
Primary Care Medical Providers The role of PCMPs is to serve as a focal point of care or medical home for ACC clients. Every member should be linked with a PCMP as his or her central point of care. PCMPs are directly responsible for ensuring timely access to primary care, one of the core goals of the ACC program. Currently, PCMPs must be a physician, advanced practice nurse, or physician assistant with a focus on primary care, general practice, internal medicine, pediatrics, geriatrics, or obstetrics and gynecology. This primary relationship is essential to building an integrated care system. The system must grow around the client, and establishing a strong connection to the system will ensure that right services may appropriately form around the client’s needs. The number of PCMPs in the program has steadily increased since program inception1
. The following chart depicts the number of practice locations and rendering providers. Note that a total provider count will not be equal to the sum of the regions because some providers participate in multiple regions.
1 The number of individual practitioners reported last year was inaccurate due to providers participating in multiple regions. Last November, there were just over 1,000 individual practitioners.

LRFI 6 - Appendix Page 3
Practice
Locations Rendering
Practitioners RCCO 1 59 287 RCCO 2 74 761 RCCO 3 115 1026 RCCO 4 60 181 RCCO 5 125 1130 RCCO 6 75 291 RCCO 7 27 100
Clients in the ACC Program are enrolled with both a RCCO and a PCMP in the Medicaid Management Information System (MMIS). Clients are assigned to a PCMP at the time of enrollment if they have a clear pattern of use with that provider. Clients with a clear pattern of use with a provider who is not in the ACC Program are not enrolled, so existing provider/client relationships are not broken. Clients with no claims history with a provider are only enrolled in the RCCO, and the RCCO is responsible for connecting them with a PMCP. Approximately 72% of enrolled clients are linked with a PCMP. This prospective enrollment allows providers to know who they are responsible for and to implement proactive strategies for ensuring that clients are receiving the care that they need. Medicaid providers contracted as PCMPs have been integral to developing and improving the ACC Program. The Department continues to receive feedback from the practice level around the positive impacts to members, especially those with high needs and non-medical needs that affect health outcomes. These successes continue to generate positive enthusiasm, engagement, and commitment to the improvement and realization of a better Medicaid program. Statewide Data and Analytics Contractor The Statewide Data and Analytics Contractor (SDAC) is responsible for providing the Department, RCCOs, and PCMPs with actionable data at both the population and client level. Population level data is used to evaluate and improve the program, individual RCCOs, and individual PCMPs. Client level data supports care management activities. The data is provided to the Department, RCCOs, and PCMPs via an online portal with secure, role-based access. Currently, only paid claims data are included. The online Web portal was launched in January of 2012. The SDAC tracks three Key Performance Indicators (KPIs). The KPIs include:
• Inpatient Hospital Readmissions; • ER Visits; and • High-cost Imaging Services.
These KPI metrics were identified because they strongly correlate with the total cost of care, may be measured using existing claims data, and represent opportunity for providers to impact care delivery. In addition, appropriate utilization of these services may be influenced through care coordination and care management practices. Both the PCMPs and the RCCOs have access

LRFI 6 - Appendix Page 4
to a Web portal that details the KPIs of their enrolled members. They are able to monitor and improve their own performance and identify members who may need additional assistance. The KPI metrics are tracked for each RCCO and PCMP. The metrics are calculated based on the clients attributed to each RCCO and PCMP. The Department is able to compare RCCOs and PCMPs by comparing their KPI metrics. Beginning in FY 2012-13, one dollar of the administrative PMPM is being withheld from both the RCCOs and PCMPs. Both entities are eligible to earn the one dollar back if they meet utilization reduction targets for each KPI. The SDAC is responsible for dissemination of best practices across the ACC Program. By scheduling regular training sessions with RCCOs and PCMPs, the SDAC can share methods of using data to create actionable care plans for ACC-enrolled patients.

LRFI 6 - Appendix Page 5
Appendix B – Technical Documentation Estimation Methodology Overview Two primary estimation methods were used to evaluate the impact of the ACC Program on total cost of care:
1. Counterfactual estimation 2. Difference-in-difference estimation
The counterfactual method attempts to estimate the cost that ACC enrolled members would have incurred if they had not been enrolled in the ACC program. Difference-in-difference estimation compares the cost of ACC-enrolled members to a similar cohort of clients who were eligible but who were not enrolled. Both methods have their own specific strengths and weaknesses. Counterfactual The counterfactual estimate is the industry standard methodology for calculating the impact of a care management program on total cost of care. However, the counterfactual method relies heavily on risk-adjustment techniques to normalize disparities in health status in order to predict health care costs for the enrolled population. Time invariant factors such as patient preferences for where they receive treatment or cultural norms that impact care patterns could contribute to different pre-period costs for the enrolled and non-enrolled groups. Because the counterfactual method does not control for time invariant factors beyond health status, it is possible that differences in pre-period costs were calculated as savings. Difference-in-difference The difference-in-difference method removes time invariant factors for both enrolled and non-enrolled groups, effectively removing this potential source of bias. Due to the potential bias in cost estimates using the industry standard model, the difference-in-difference method produces a more conservative estimate of the impact of the ACC Program on cost.
LRFI 6 - Appendix Page 6
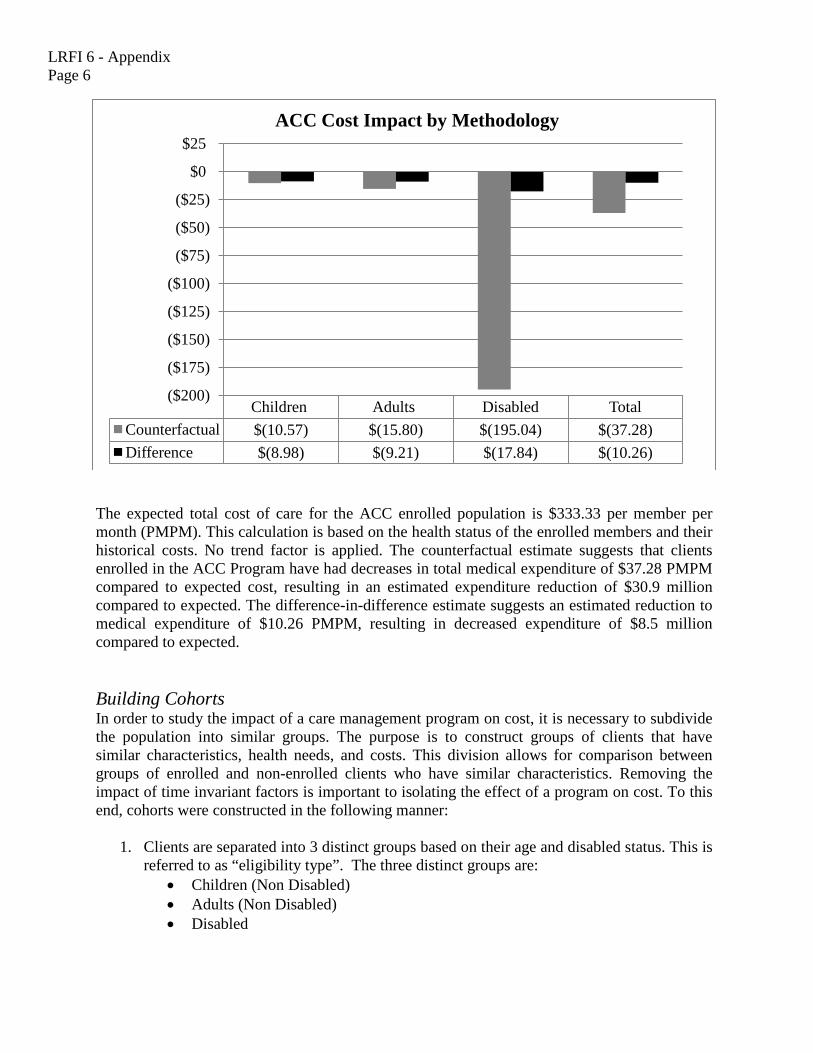
The expected total cost of care for the ACC enrolled population is $333.33 per member per month (PMPM). This calculation is based on the health status of the enrolled members and their historical costs. No trend factor is applied. The counterfactual estimate suggests that clients enrolled in the ACC Program have had decreases in total medical expenditure of $37.28 PMPM compared to expected cost, resulting in an estimated expenditure reduction of $30.9 million compared to expected. The difference-in-difference estimate suggests an estimated reduction to medical expenditure of $10.26 PMPM, resulting in decreased expenditure of $8.5 million compared to expected. Building Cohorts In order to study the impact of a care management program on cost, it is necessary to subdivide the population into similar groups. The purpose is to construct groups of clients that have similar characteristics, health needs, and costs. This division allows for comparison between groups of enrolled and non-enrolled clients who have similar characteristics. Removing the impact of time invariant factors is important to isolating the effect of a program on cost. To this end, cohorts were constructed in the following manner:
1. Clients are separated into 3 distinct groups based on their age and disabled status. This is
referred to as “eligibility type”. The three distinct groups are: • Children (Non Disabled) • Adults (Non Disabled) • Disabled
Children Adults Disabled Total Counterfactual $(10.57) $(15.80) $(195.04) $(37.28) Difference $(8.98) $(9.21) $(17.84) $(10.26)
($200)
($175)
($150)
($125)
($100)
($75)
($50)
($25)
$0
$25 ACC Cost Impact by Methodology
LRFI 6 - Appendix Page 7
2. Clients are separated into 7 distinct groups based on the region in which they reside. RCCO regions are based on county of residence. Each of the 3 eligibility types from above is separated into 7 distinct groups, one for each region.
3. Clients are separated into groups based on the month they were enrolled in the ACC Program. Clients are enrolled on the first of each month. The months during FY 2011-12 are considered for this analysis. For each of the 21 distinct groups above (3 eligibility and 7 region within each eligibility type), clients are separated into enrolled or non-enrolled groups for each of the 12 months during FY 2011-12.
The separation of clients into cohorts with similar characteristics allows for the comparison of enrolled and non-enrolled members who have similar characteristics and expected medical costs. Risk Adjustment The advantage of establishing groups of clients with very similar diagnoses and severity of illness is that the clients in each group will share similar health and cost expectations for the future. Risk adjustment allows for the comparison of different groups of clients by normalizing for differences in health status. A certain group of clients may be more expensive than another group, but the first group may also be less healthy and require more health care services. A risk score is a measurement of the relative health status of a group of clients compared to the health status of the entire population. The risk score for the entire population is set to 1.0 and is based on the average cost of the entire population. The risk score for a group of clients is established by summing the total cost PMPM for the group and dividing by the total cost PMPM for the entire population. This method relies on the assumption that sicker clients require more expensive care on average. In general, differences in health status are normalized by dividing the total average cost for a group of clients by the average risk score for the group. Once risk has been normalized it is possible to consider which group was more expensive on average, without potentially confounding factors like differences in health status. The risk adjustment methodology used to control for differences in health status is Clinical Risk Groups (CRGs) developed by 3M. This methodology groups clients into similar subpopulations based on diagnosis codes and procedure codes. Further refinement of each group is accomplished by considering the relative severity of illness and risk of mortality for each of the members in a given subpopulation. Risk scores are calculated using 3 years of historical claims data. Scores are calculated separately for disabled and non-disabled populations. Counterfactual Estimation The counterfactual estimation methodology relies heavily on risk adjustment using Clinical Risk Groups (CRGs). The counterfactual methodology estimates expected costs for the enrolled population by using the costs of the non-enrolled population and then adjusting those costs for relative health status differences through the use of the CRGs. No costs outside the program
LRFI 6 - Appendix Page 8
period, FY 2011-12, are considered. The counterfactual method assumes the non-enrolled population represents a characteristically similar group of clients with different levels of health status. After adjusting for differences in health status, the costs of the non-enrolled population are assumed to provide a good approximation for the cost of the enrolled population. The actual cost of the enrolled population is then compared to the counterfactual estimate to determine the impact of the ACC Program on total cost of care. The counterfactual methodology is the industry standard actuarial measurement methodology for impact analysis. The primary reason for its wide adoption is that many health care programs or changes to delivery system are adopted for all members, meaning there is no control group to measure performance against. As a result, the cost information from the pre-period is not useful for comparison, since all clients are enrolled. However, the rollout of the ACC Program established a control group of characteristically similar clients. The cost impact estimates based on the counterfactual methodology are shown in the table below. Estimates are of similar order of magnitude to the difference-in-difference method for both children and adult categories. However, the disabled population experiences a nearly ten-fold increase in the estimated cost savings under the counterfactual method compared to the difference-in-difference estimates. Two factors could contribute to the magnitude of the disabled estimate. The first factor is related to the structure of the counterfactual methodology. The counterfactual method does not consider pre-period costs as a baseline measurement, whereas the difference-in-difference method does. Significantly lower pre-period costs that are not reflected in the counterfactual method could bias results. The second factor is related to reliance on risk adjustment as a predictor of cost during the post-period. If risk adjustment techniques fail to accurately reflect differences in expected health care costs between the enrolled and non-enrolled populations, the counterfactual estimates will be biased. Both of the factors explained above are also relevant for the adult and children categories. However, the magnitude and direction of the estimates for the adult and children categories were consistent with the estimates from the difference-in-difference method.

LRFI 6 - Appendix Page 9
Counterfactual Cost Impact Estimates
Month Disabled Children (Non Disabled)
Adults (Non Disabled) Total
July 2011 ($6,502,527) ($774,222) ($459,298) ($7,736,047) August 2011 ($2,412,341) ($352,951) ($736,314) ($3,501,606) September 2011 ($2,601,870) $38,959 ($1,469,195) ($4,032,106) October 2011 ($1,209,895) ($237,259) ($817,624) ($2,264,778) November 2011 ($43,011) ($77,415) ($934,841) ($1,055,267) December 2011 ($2,175,514) ($774,033) ($1,054,135) ($4,003,682) January 2012 ($682,490) ($507,972) ($350,403) ($1,540,866) February 2012 ($3,271,352) ($194,909) ($536,721) ($4,002,983) March 2012 ($508,796) $25,930 ($240,463) ($723,329) April 2012 ($1,470,209) ($548,679) ($28,184) ($2,047,072) May 2012 ($293,325) $48,283 $369,204 $124,163 June 2012 ($60,712) ($18,987) ($105,712) ($185,412) Total ($21,232,042) ($3,373,255) ($6,363,688) ($30,968,985)
Difference-in-difference Estimation The difference-in-difference estimation compares two populations (ACC enrolled vs. non-enrolled) across two time periods (pre-enrolled vs. post-enrolled). The non-enrolled population serves as a control group to compare the enrolled group against. The control group is made up of ACC eligible clients that were not selected for enrollment. As explained above, establishing a control group with similar characteristics to the enrolled group allows for a more balanced comparison of medical costs between the two groups. This method removes potentially confounding unobservable time invariant factors, such as differences in client preferences that contribute to variation in medical expenditure. The non-enrolled group serves as a baseline measurement for cost. For instance, if cost in the control group increases during the program period but the cost of enrolled members does not change, the difference-in-difference estimate would report a favorable effect of the ACC Program on cost. Enrolled and non-enrolled cohorts were compared for each program month, for each eligibility type, as shown in the table below.

LRFI 6 - Appendix Page 10
Difference-in-Difference Cost Impact Estimates
Month Disabled Children (non-disabled)
Adults (non-disabled) Total
July 2011 $898,451 ($696,407) ($577,493) ($375,449) August 2011 ($745,729) ($303,094) ($480,562) ($1,529,386) September 2011 ($498,621) $99,634 ($362,862) ($761,849) October 2011 ($580,167) ($152,096) ($593,929) ($1,326,191) November 2011 $282,413 ($83,596) ($348,237) ($149,420) December 2011 ($213,295) ($429,400) ($1,124,512) ($1,767,207) January 2012 ($276,105) ($500,176) $69,258 ($707,023) February 2012 ($14,081) ($185,616) ($479,816) ($679,514) March 2012 ($248,294) ($58,047) $4,650 ($301,690) April 2012 ($446,469) ($484,546) $155,729 ($775,286) May 2012 ($185,300) ($24,932) $122,153 ($88,080) June 2012 $84,658 ($48,546) ($94,946) ($58,834) Total ($1,942,539) ($2,866,821) ($3,710,569) ($8,519,929)
The difference-in-difference estimation methodology is limited in that it does not control for pre-existing trends in cost for the enrolled and non-enrolled populations. If cost trends were different for enrolled and non-enrolled groups prior to FY 2011-12, the difference-in-difference estimates would not be accurate. While some difference in cost trend is almost certain, by comparing enrolled members with non-enrolled clients who are characteristically similar, the assumption that cost trends between the two groups are similar is likely to be valid. Clients are enrolled in the ACC Program if they are eligible and they can be attributed to an ACC-contracted doctor based on their claims history. If a client has no prior claims they may be enrolled in the ACC Program but not assigned a primary care doctor. Because not every Medicaid participating doctor is ACC-contracted, not every ACC-eligible patient is enrolled. These clients form the control group for the analysis. The difference-in-difference estimation methodology is limited by its inability to control for selection bias between the enrolled group and non-enrolled control group. The methodology cannot control for differences between the doctors that choose to participate and those that do not. ACC contracted doctors may be more committed to Medicaid patients than non-contracted doctors and as a result provide better care for the same condition than non-contracted doctors. It is also possible that clients who are not enrolled in the ACC Program have experienced a reduction in cost by virtue of their PCMP being an ACC-contracted doctor. Although members are attributed to ACC-contracted doctors, the entire patient panel may not be attributed. Some clients in the panel may not meet ACC eligibility criteria. In addition, some clients may not be enrolled because of the program’s size constraints (i.e., limited number of allowable enrollments). As a result, additional financial resources provided by the program’s administrative payments to doctors may indirectly benefit clients who are not enrolled. The
LRFI 6 - Appendix Page 11
extent that this effect is reducing costs for non-enrolled clients is not accounted for in the difference-in-difference model, and may understate the true savings of the program. The cost estimates calculated by both the difference-in-difference and counterfactual methods provide a conservative estimate and an industry standard actuarial estimate, respectively, of the impact of the ACC Program on total cost of care. Estimates were consistent for the children and adult populations in terms of both direction and magnitude. The disabled population had a much wider range of cost savings estimates. Key Performance Indicators (KPIs) The Department selected three performance metrics to monitor the performance of RCCOs and participating primary care doctors. These metrics represent areas of opportunity that are readily impacted by care management. Prior to the ACC Program, many clients were navigating an unmanaged fee-for-service health care environment. Additional care coordination provided by the program should reduce duplicative and unnecessary services and help ensure that clients receive care in the most efficient setting. As a result the Department expects the following key performance indicators (KPIs) to be favorably impacted by the ACC Program:
• emergency room visits; • high-cost imaging services; and • hospital readmissions.
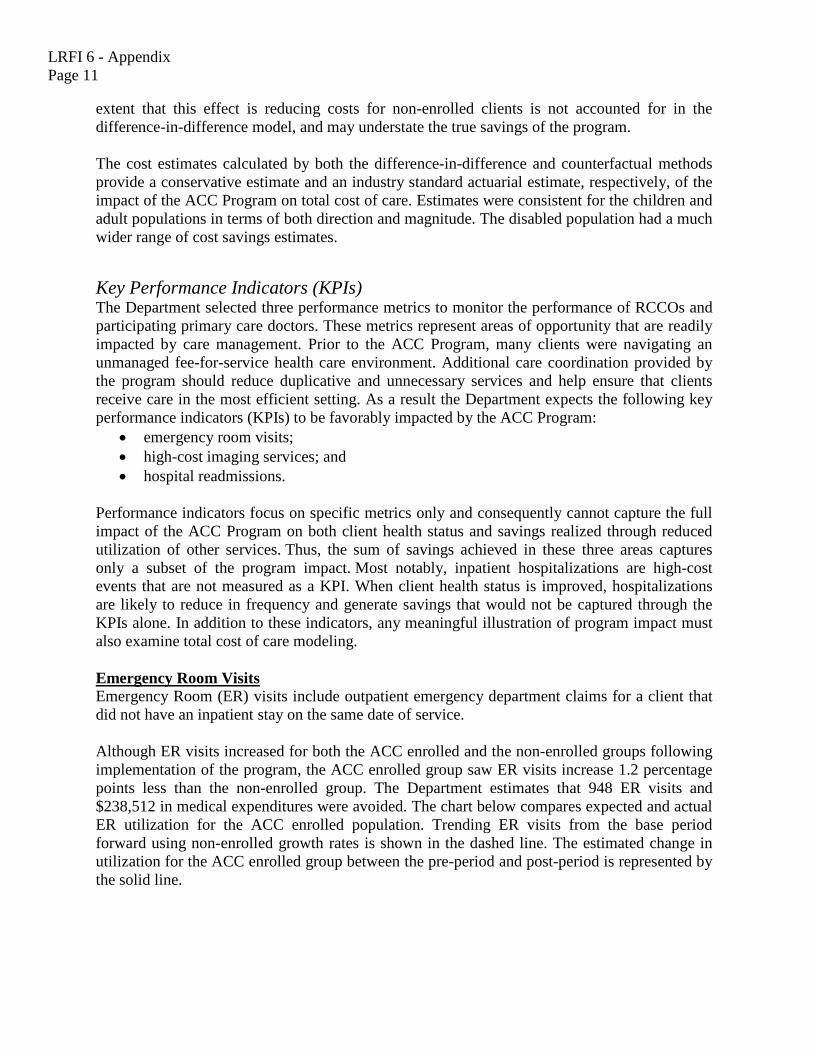
Performance indicators focus on specific metrics only and consequently cannot capture the full impact of the ACC Program on both client health status and savings realized through reduced utilization of other services. Thus, the sum of savings achieved in these three areas captures only a subset of the program impact. Most notably, inpatient hospitalizations are high-cost events that are not measured as a KPI. When client health status is improved, hospitalizations are likely to reduce in frequency and generate savings that would not be captured through the KPIs alone. In addition to these indicators, any meaningful illustration of program impact must also examine total cost of care modeling. Emergency Room Visits Emergency Room (ER) visits include outpatient emergency department claims for a client that did not have an inpatient stay on the same date of service. Although ER visits increased for both the ACC enrolled and the non-enrolled groups following implementation of the program, the ACC enrolled group saw ER visits increase 1.2 percentage points less than the non-enrolled group. The Department estimates that 948 ER visits and $238,512 in medical expenditures were avoided. The chart below compares expected and actual ER utilization for the ACC enrolled population. Trending ER visits from the base period forward using non-enrolled growth rates is shown in the dashed line. The estimated change in utilization for the ACC enrolled group between the pre-period and post-period is represented by the solid line.
LRFI 6 - Appendix Page 12
The chart below compares ER utilization for both the enrolled and the non-enrolled groups across the pre-period and post-period on a per thousand per year (PKPY) basis. Measuring statistics on a PKPY basis allows for comparison across time periods or between different groups that may have very different unadjusted statistics. While ER visits for the enrolled population increased from 837 PKPY to 839 PKPY, the non-enrolled population increased from 818 PKPY to 830 PKPY. The substantial increase in the non-enrolled population compared to the enrolled population suggests that the ACC Program had a favorable impact on ER utilization compared to the control group.
FY 2010-11 FY 2011-12 Expected 76,453 77,575 Actual 76,453 76,627
76,000
76,250
76,500
76,750
77,000
77,250
77,500
77,750
78,000
ACC Enrolled Trend in ER Visits
948 Visits

LRFI 6 - Appendix Page 13
High-cost Imaging Services High-cost Imaging (HCI) Services include CT scans and MRIs. High-cost imaging (HCI) utilization trended lower for both the ACC enrolled and the non-enrolled groups. The ACC enrolled group experienced a decrease in HCI utilization of 3.3 percentage points as compared to the non-enrolled group. The Department estimates that this resulted in 778 avoided HCI services and a reduction of $208,027 in medical expenditure. The chart below shows the difference between expected and actual utilization of HCI services for the ACC enrolled group. The dashed line represents the expected number of HCI services for the ACC enrolled population, and the solid line represents actual HCI service utilization.
The chart below shows the difference in HCI services between enrolled and non-enrolled groups for both pre and post periods on a PKPY basis. The Department estimates that HCI service
805
810
815
820
825
830
835
840
845
FY 2010-11 FY 2011-12
Annual ER Visit Rates Per Thousand Members
Enrolled Non-enrolled
FY 2010-11 FY 2011-12 Expected 23,533 20,949 Actual 23,533 20,171
19,000 19,500 20,000 20,500 21,000 21,500 22,000 22,500 23,000 23,500 24,000
Services
ACC Enrolled Trend in High-cost Imaging Services
778 Services

LRFI 6 - Appendix Page 14
utilization decreased 37 units to 221 PKPY for the enrolled group, as compared to a decrease of 29 units to 231 PKPY for the non-enrolled cohort. Based on this analysis, the ACC Program appears to have a favorable impact on the utilization of unnecessary HCI services.
Hospital Readmissions Thirty (30) Day All-Cause Readmissions are defined as any inpatient admission that occurred within a 30-day time period following an inpatient discharge of an individual member. Once an episode is identified as an initial admission, it cannot also be tagged as a readmission. Hospital readmissions trended lower for both the enrolled and non-enrolled groups. Relative to the non-enrolled control group, the enrolled group saw hospital readmissions decline 8.6 percentage points, estimated as 81 avoidable readmissions and $549,745 in avoided medical expenditure. The chart below compares expected hospital readmissions to actual readmissions for the ACC enrolled group. The dashed line represents the expected cost based on the trend in hospital readmissions from the non-enrolled group. The solid line represents actual readmissions for the enrolled group for both the pre and post periods.
200
220
240
260
280
FY 2010-11 FY 2011-12
High-cost Imaging Service Rates Per Thousand Members
Enrolled Non-enrolled

LRFI 6 - Appendix Page 15
FY 2010-11 FY 2011-12 Expected 948 829 Actual 948 748
500
600
700
800
900
1,000 ACC Enrolled Trend in Hospital Readmissions
81 Readmissions