Accountability in Higher Education: Exploring Impacts on ...
27
JPART 22:675–700 doi:10.1093/jopart/mur069 Advance Access publication on February 29, 2012 © The Author 2012. Published by Oxford University Press on behalf of the Journal of Public Administration Research and Theory, Inc. All rights reserved. For permissions, please e-mail: [email protected] Accountability in Higher Education: Exploring Impacts on State Budgets and Institutional Spending Patterns Thomas M. Rabovsky University of Oklahoma ABSTRACT In recent years, performance-based accountability regimes have become increasingly prevalent throughout government. One area where this has received considerable attention in recent years is higher education, where many states have adopted funding policies that seek to tie institutional funding to objective measures of performance. To what extent have these policies been effective tools for restructuring financial incentives and exerting influence over administrative behavior? Using data from the Integrated Postsecondary Education Data System, this article finds that performance-funding policies have not had substantial impacts on state budgets but that they have had some limited influence on institutional spending priorities. Furthermore, effects on institutional spending were found to be greater on public research universities than other public colleges. Research on the increased use of performance information in the public sector has been a dominant theme in the management literature over the past decade and a half. Proponents argue that performance-based accountability structures make it easier for political leaders and the general public to evaluate public agency outputs and to impose sanctions when agencies fail to produce desired results. Critics claim such policies are often short sighted, blind to the practical realities that many public managers deal with, and are implemented in ways that distort agency missions and result in unintended consequences that negatively impact service delivery. Implicit in this debate is the assumption that performance-based mechanisms of accountability will, in some way, reform state budgets and change service delivery. One area where this discussion has become salient is higher education. In recent years, there have been several initiatives, at both the state and the federal levels, to directly link performance to funding (Aldeman and Carey 2009; Burke 2002; Zumeta 2001). Although there have been a few attempts to uncover the impacts associated with these higher edu- cation performance-funding policies (Volkwein and Tandberg 2008), our knowledge about them has thus far largely been based on anecdotal evidence and limited case studies (Banta, The author would like to thank Joseph Ripberger, Alisa Hicklin Fryar, Matthew Nowlin, Thaddieus Conner, and the anonymous referees for their helpful comments on the manuscript. Address correspondence to the author at [email protected].
Transcript of Accountability in Higher Education: Exploring Impacts on ...

JPART 22:675–700
doi:10.1093/jopart/mur069Advance Access publication on February 29, 2012© The Author 2012. Published by Oxford University Press on behalf of the Journal of Public Administration Research and Theory, Inc. All rights reserved. For permissions, please e-mail: [email protected]
Accountability in Higher Education:Exploring Impacts on State Budgets andInstitutional Spending Patterns
Thomas M. RabovskyUniversity of Oklahoma
ABSTRACT
In recent years, performance-based accountability regimes have become increasingly
prevalent throughout government. One area where this has received considerable attention
in recent years is higher education, where many states have adopted funding policies that
seek to tie institutional funding to objective measures of performance. To what extent have
these policies been effective tools for restructuring financial incentives and exerting
influence over administrative behavior? Using data from the Integrated Postsecondary
Education Data System, this article finds that performance-funding policies have not had
substantial impacts on state budgets but that they have had some limited influence on
institutional spending priorities. Furthermore, effects on institutional spending were found to
be greater on public research universities than other public colleges.
Research on the increased use of performance information in the public sector has been
a dominant theme in the management literature over the past decade and a half. Proponents
argue that performance-based accountability structures make it easier for political leaders
and the general public to evaluate public agency outputs and to impose sanctions when
agencies fail to produce desired results. Critics claim such policies are often short sighted,
blind to the practical realities that many public managers deal with, and are implemented in
ways that distort agency missions and result in unintended consequences that negatively
impact service delivery. Implicit in this debate is the assumption that performance-based
mechanisms of accountability will, in some way, reform state budgets and change service
delivery.
One area where this discussion has become salient is higher education. In recent years,
there have been several initiatives, at both the state and the federal levels, to directly link
performance to funding (Aldeman and Carey 2009; Burke 2002; Zumeta 2001). Although
there have been a few attempts to uncover the impacts associated with these higher edu-
cation performance-funding policies (Volkwein and Tandberg 2008), our knowledge about
them has thus far largely been based on anecdotal evidence and limited case studies (Banta,
The author would like to thank Joseph Ripberger, Alisa Hicklin Fryar, Matthew Nowlin, Thaddieus Conner, and the
anonymous referees for their helpful comments on the manuscript. Address correspondence to the author at
doi:10.1093/jopart/mur069
ª The Author 2012. Published by Oxford University Press on behalf of the Journal of Public Administration Researchand Theory, Inc. All rights reserved. For permissions, please e-mail: [email protected]

Journal of Public Administration Research and Theory 676
Rudolph, Dyke, and Fisher 1996; Doyle and Noland 2006; Sanford and Hunter 2010). As
such, there remain serious gaps in our empirical knowledge about the extent to which these
policies are having substantive impacts on budgetary processes at the state level and on
service delivery at the organizational level. This article uses institutional-level data from
public colleges and universities in all 50 states to determine whether the adoption of
performance-funding policies corresponds with a better link between student outcomes
(graduation rates, retention, and bachelor’s degrees produced) and state appropriations and
whether these policies have any noticeable effects on the way that public universities
prioritize activities related to research and instruction.
ACCOUNTABILITY AND THE PERFORMANCE MOVEMENT
Critics have long complained that public organizations tend to be inefficient and unrespon-
sive to external stakeholder groups relative to their private counterparts (Chubb and Moe
1990; Osborne and Gaebler 1992; Wilson 1989). Many observers blame this apparent
dysfunction on the prevalence of incrementalism in the budgetary process and argue that
reform efforts aimed at greater utilization of information regarding organizational perfor-
mance can make budgets less political and more merit based, which will in turn boost cost
efficiency gains within the public sector (Moynihan 2008; Radin 2006). By rewarding or-
ganizations that perform well and sanctioning those that perform poorly, policymakers can
provide strong incentives for public agencies to reduce or eliminate wasteful activities and
to employ entrepreneurial strategies in developing new technologies and methods to
improve service delivery. Furthermore, by holding public agencies accountable for perfor-
mance, policymakers are able to get more ‘‘bang for the buck’’ by spending less money on
programs that do not work and more on those that do.
Although performance budgeting has become ubiquitous at all levels of government in
America over the last 15 years (Kettl 2000; Melkers and Willoughby 1998; Moynihan
2008), empirical research has generally found only limited evidence that performance in-
formation has a meaningful impact on budget decisions, particularly at the state and federal
levels of government (Gilmour and Lewis 2006a, 2006b; Joyce 1999; Long and Franklin
2004; Moynihan 2008; Radin 2000). Why have policymakers been so apt to adopt perfor-
mance mechanisms if they do not use the information that these systems generate?
Moynihan (2008) argues that performance policies are often symbolic in nature and that
many times there is little commitment to true reform on the part of political actors.
Even if reform efforts represent a sincere effort to change government, there are
several factors that can limit the influence of performance information in the budgetary
process. As Moynihan (2008) highlights, performance information is rarely, if ever, used
in a completely neutral or rational way. Performance must be given meaning by human
decision makers, which makes it inherently political and subjective. For instance, there
is often times significant disagreement within the policy community about the legitimacy
of various indicators. This inhibits information use because many actors view the data that
performance regimes generate with distrust and are thus unlikely to engage in meaningful
learning (Moynihan 2008; Radin 2006).
Second, as both Gilmour and Lewis (2006b) and Moynihan (2008) point out, it can be
unclear whether poor performance should be met with reduced or increased funding. Some
observers may interpret poor performance as evidence that an organization needs additional
resources in order to accomplish important tasks and thus push for more funding. For
2 Journal of Public Administration Research and Theory
example, many critics of K-12 accountability policies, such as No Child Left Behind
(NCLB), contend that these regimes are likely to create negative feedback loops that make
it virtually impossible for schools serving vulnerable and at-risk populations to close
achievement gaps or improve student outcomes (Neill 2003).
Finally, given the potential for budgetary reforms to create new sets of winners and
losers, it is reasonable to expect that affected agencies will seek to influence policy design
in a way that protects their interests (Moynihan 2008). As such, organizations with resource
advantages, particularly in terms of political influence, are more likely to secure perfor-
mance regimes that emphasize indicators they will score satisfactorily on, and as a result,
performance budgeting would be unlikely to dramatically change the funding landscape.
Regardless of their impact on budgetary actors, performance-funding policies
ultimately aim to influence public sector service delivery. Proponents argue that public
administrators will react to performance-based incentives by adopting management strat-
egies that increase efficiency and improve performance. Furthermore, some argue that
performance-based systems, when properly designed and implemented, have the potential
to promote organizational learning by helping managers to identify problems and to more
systematically assess the strengths and weaknesses of programs (Behn 2003; Moynihan
2008).
Critics, however, warn that performance systems, particularly when they are imposed
in a top-down manner with little differentiation to account for important variation in terms
of task difficulty or resource availability, can lead to perverse incentives that harm client
populations (Radin 2006; Smith 1990). In some cases, administrators may respond to un-
realistic accountability requirements by ‘‘gaming the system’’ to manipulate data such that
indicators are no longer valid measures of performance (Booher-Jennings 2005; Figlio and
Getzler 2002; Heilig and Darling-Hammond 2008; Jacob 2005; Jacob and Levitt 2003). In
other cases, administrators focus more heavily on tasks that boost scores in the short term, at
the expense of developing a long-term strategic plan to improve outcomes (Abernathy
2007). Finally, administrators may react to performance regimes they perceive as illegit-
imate and unreasonable by adopting a strategy of resistance where they change little, if
anything in terms of service delivery, and then attempt to undermine or marginalize
the role of performance information in program assessment (Radin 2006). Since many per-
formance reform efforts have historically proven to be short lived and primarily symbolic in
nature, public managers often rightly perceive that they can simply wait things out without
exerting much time or energy to redesign program activities.
PERFORMANCE FUNDING IN HIGHER EDUCATION
Within the area of higher education, performance-based accountability has become an
area of significant attention in the past decade (Huisman and Currie 2004; King 2007;
McLendon, Hearn, and Deaton 2006). In an era that has seen tuition rates skyrocket
and increased pressure from the international arena, American universities have struggled
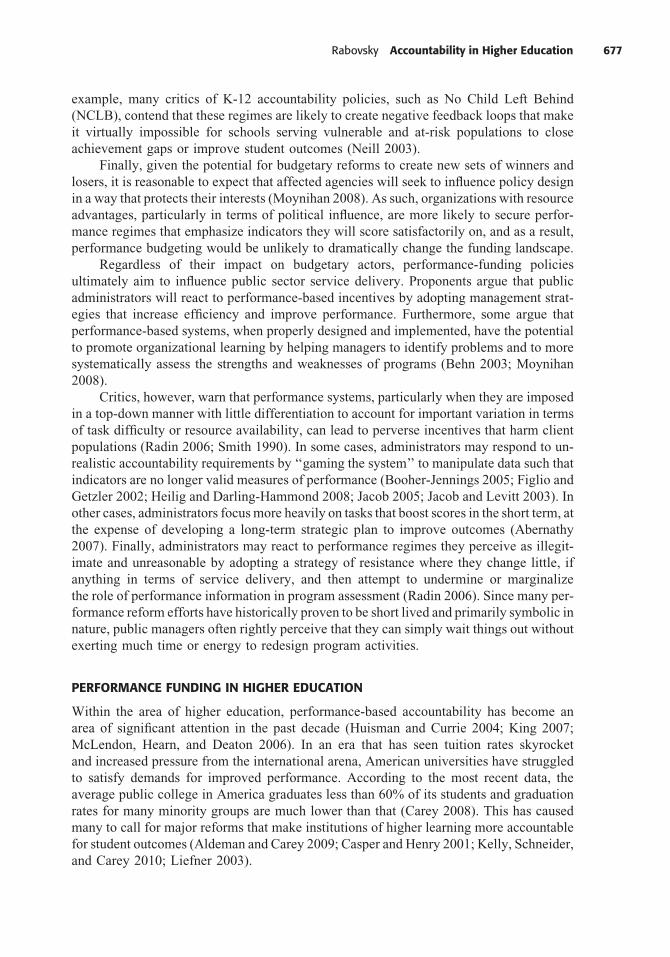
to satisfy demands for improved performance. According to the most recent data, the
average public college in America graduates less than 60% of its students and graduation
rates for many minority groups are much lower than that (Carey 2008). This has caused
many to call for major reforms that make institutions of higher learning more accountable
for student outcomes (Aldeman and Carey 2009; Casper and Henry 2001; Kelly, Schneider,
and Carey 2010; Liefner 2003).
Rabovsky Accountability in Higher Education 3
Rabovsky Accountability in Higher Education 677
Rudolph, Dyke, and Fisher 1996; Doyle and Noland 2006; Sanford and Hunter 2010). As
such, there remain serious gaps in our empirical knowledge about the extent to which these
policies are having substantive impacts on budgetary processes at the state level and on
service delivery at the organizational level. This article uses institutional-level data from
public colleges and universities in all 50 states to determine whether the adoption of
performance-funding policies corresponds with a better link between student outcomes
(graduation rates, retention, and bachelor’s degrees produced) and state appropriations and
whether these policies have any noticeable effects on the way that public universities
prioritize activities related to research and instruction.
ACCOUNTABILITY AND THE PERFORMANCE MOVEMENT
Critics have long complained that public organizations tend to be inefficient and unrespon-
sive to external stakeholder groups relative to their private counterparts (Chubb and Moe
1990; Osborne and Gaebler 1992; Wilson 1989). Many observers blame this apparent
dysfunction on the prevalence of incrementalism in the budgetary process and argue that
reform efforts aimed at greater utilization of information regarding organizational perfor-
mance can make budgets less political and more merit based, which will in turn boost cost
efficiency gains within the public sector (Moynihan 2008; Radin 2006). By rewarding or-
ganizations that perform well and sanctioning those that perform poorly, policymakers can
provide strong incentives for public agencies to reduce or eliminate wasteful activities and
to employ entrepreneurial strategies in developing new technologies and methods to
improve service delivery. Furthermore, by holding public agencies accountable for perfor-
mance, policymakers are able to get more ‘‘bang for the buck’’ by spending less money on
programs that do not work and more on those that do.
Although performance budgeting has become ubiquitous at all levels of government in
America over the last 15 years (Kettl 2000; Melkers and Willoughby 1998; Moynihan
2008), empirical research has generally found only limited evidence that performance in-
formation has a meaningful impact on budget decisions, particularly at the state and federal
levels of government (Gilmour and Lewis 2006a, 2006b; Joyce 1999; Long and Franklin
2004; Moynihan 2008; Radin 2000). Why have policymakers been so apt to adopt perfor-
mance mechanisms if they do not use the information that these systems generate?
Moynihan (2008) argues that performance policies are often symbolic in nature and that
many times there is little commitment to true reform on the part of political actors.
Even if reform efforts represent a sincere effort to change government, there are
several factors that can limit the influence of performance information in the budgetary
process. As Moynihan (2008) highlights, performance information is rarely, if ever, used
in a completely neutral or rational way. Performance must be given meaning by human
decision makers, which makes it inherently political and subjective. For instance, there
is often times significant disagreement within the policy community about the legitimacy
of various indicators. This inhibits information use because many actors view the data that
performance regimes generate with distrust and are thus unlikely to engage in meaningful
learning (Moynihan 2008; Radin 2006).
Second, as both Gilmour and Lewis (2006b) and Moynihan (2008) point out, it can be
unclear whether poor performance should be met with reduced or increased funding. Some
observers may interpret poor performance as evidence that an organization needs additional
resources in order to accomplish important tasks and thus push for more funding. For
2 Journal of Public Administration Research and Theory
example, many critics of K-12 accountability policies, such as No Child Left Behind
(NCLB), contend that these regimes are likely to create negative feedback loops that make
it virtually impossible for schools serving vulnerable and at-risk populations to close
achievement gaps or improve student outcomes (Neill 2003).
Finally, given the potential for budgetary reforms to create new sets of winners and
losers, it is reasonable to expect that affected agencies will seek to influence policy design
in a way that protects their interests (Moynihan 2008). As such, organizations with resource
advantages, particularly in terms of political influence, are more likely to secure perfor-
mance regimes that emphasize indicators they will score satisfactorily on, and as a result,
performance budgeting would be unlikely to dramatically change the funding landscape.
Regardless of their impact on budgetary actors, performance-funding policies
ultimately aim to influence public sector service delivery. Proponents argue that public
administrators will react to performance-based incentives by adopting management strat-
egies that increase efficiency and improve performance. Furthermore, some argue that
performance-based systems, when properly designed and implemented, have the potential
to promote organizational learning by helping managers to identify problems and to more
systematically assess the strengths and weaknesses of programs (Behn 2003; Moynihan
2008).
Critics, however, warn that performance systems, particularly when they are imposed
in a top-down manner with little differentiation to account for important variation in terms
of task difficulty or resource availability, can lead to perverse incentives that harm client
populations (Radin 2006; Smith 1990). In some cases, administrators may respond to un-
realistic accountability requirements by ‘‘gaming the system’’ to manipulate data such that
indicators are no longer valid measures of performance (Booher-Jennings 2005; Figlio and
Getzler 2002; Heilig and Darling-Hammond 2008; Jacob 2005; Jacob and Levitt 2003). In
other cases, administrators focus more heavily on tasks that boost scores in the short term, at
the expense of developing a long-term strategic plan to improve outcomes (Abernathy
2007). Finally, administrators may react to performance regimes they perceive as illegit-
imate and unreasonable by adopting a strategy of resistance where they change little, if
anything in terms of service delivery, and then attempt to undermine or marginalize
the role of performance information in program assessment (Radin 2006). Since many per-
formance reform efforts have historically proven to be short lived and primarily symbolic in
nature, public managers often rightly perceive that they can simply wait things out without
exerting much time or energy to redesign program activities.
PERFORMANCE FUNDING IN HIGHER EDUCATION
Within the area of higher education, performance-based accountability has become an
area of significant attention in the past decade (Huisman and Currie 2004; King 2007;
McLendon, Hearn, and Deaton 2006). In an era that has seen tuition rates skyrocket
and increased pressure from the international arena, American universities have struggled
to satisfy demands for improved performance. According to the most recent data, the
average public college in America graduates less than 60% of its students and graduation
rates for many minority groups are much lower than that (Carey 2008). This has caused
many to call for major reforms that make institutions of higher learning more accountable
for student outcomes (Aldeman and Carey 2009; Casper and Henry 2001; Kelly, Schneider,
and Carey 2010; Liefner 2003).
Rabovsky Accountability in Higher Education 3
Journal of Public Administration Research and Theory 678
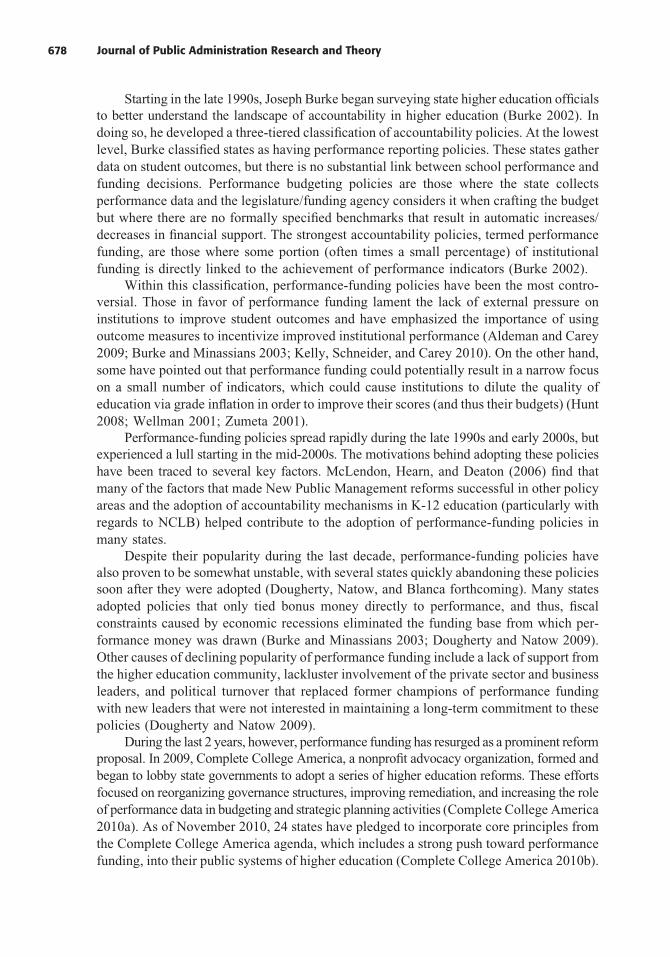
Starting in the late 1990s, Joseph Burke began surveying state higher education officials
to better understand the landscape of accountability in higher education (Burke 2002). In
doing so, he developed a three-tiered classification of accountability policies. At the lowest
level, Burke classified states as having performance reporting policies. These states gather
data on student outcomes, but there is no substantial link between school performance and
funding decisions. Performance budgeting policies are those where the state collects
performance data and the legislature/funding agency considers it when crafting the budget
but where there are no formally specified benchmarks that result in automatic increases/
decreases in financial support. The strongest accountability policies, termed performance
funding, are those where some portion (often times a small percentage) of institutional
funding is directly linked to the achievement of performance indicators (Burke 2002).
Within this classification, performance-funding policies have been the most contro-
versial. Those in favor of performance funding lament the lack of external pressure on
institutions to improve student outcomes and have emphasized the importance of using
outcome measures to incentivize improved institutional performance (Aldeman and Carey
2009; Burke and Minassians 2003; Kelly, Schneider, and Carey 2010). On the other hand,
some have pointed out that performance funding could potentially result in a narrow focus
on a small number of indicators, which could cause institutions to dilute the quality of
education via grade inflation in order to improve their scores (and thus their budgets) (Hunt
2008; Wellman 2001; Zumeta 2001).
Performance-funding policies spread rapidly during the late 1990s and early 2000s, but
experienced a lull starting in the mid-2000s. The motivations behind adopting these policies
have been traced to several key factors. McLendon, Hearn, and Deaton (2006) find that
many of the factors that made New Public Management reforms successful in other policy
areas and the adoption of accountability mechanisms in K-12 education (particularly with
regards to NCLB) helped contribute to the adoption of performance-funding policies in
many states.
Despite their popularity during the last decade, performance-funding policies have
also proven to be somewhat unstable, with several states quickly abandoning these policies
soon after they were adopted (Dougherty, Natow, and Blanca forthcoming). Many states
adopted policies that only tied bonus money directly to performance, and thus, fiscal
constraints caused by economic recessions eliminated the funding base from which per-
formance money was drawn (Burke and Minassians 2003; Dougherty and Natow 2009).
Other causes of declining popularity of performance funding include a lack of support from
the higher education community, lackluster involvement of the private sector and business
leaders, and political turnover that replaced former champions of performance funding
with new leaders that were not interested in maintaining a long-term commitment to these
policies (Dougherty and Natow 2009).
During the last 2 years, however, performance funding has resurged as a prominent reform
proposal. In 2009, Complete College America, a nonprofit advocacy organization, formed and
began to lobby state governments to adopt a series of higher education reforms. These efforts
focused on reorganizing governance structures, improving remediation, and increasing the role
of performance data in budgeting and strategic planning activities (Complete College America
2010a). As of November 2010, 24 states have pledged to incorporate core principles from
the Complete College America agenda, which includes a strong push toward performance
funding, into their public systems of higher education (Complete College America 2010b).
4 Journal of Public Administration Research and Theory
This article empirically examines two aspects of the debate about performance
funding in higher education that have currently received little attention in the literature.
First, how effective have performance-funding policies been at reforming state budgets?
Underlying the causal logic behind performance funding is the belief that organizations will
respond to changes in the funding environment by adopting new strategies and techniques
to improve performance. If this assumption is correct, then performance-funding policies
must have a meaningful impact on the level of support that institutions receive from state
governments, not of other influences (such as the health of the economy or other factors that
limit the amount of money that states have to spend on higher education). This article
explores whether the adoption of performance funding strengthens the link between student
outcomes and state appropriations, as proponents suggest, or whether these policies have
been more symbolic with regards to budgetary impacts.
Second, this article seeks to understand whether stronger accountability mechanisms
influence the way that institutions allocate resources. In recent years, many universities
have sought to expand their capacity to conduct research, partly because doing so increases
their ability to secure attractive funding but also because research output is often times
associated with higher levels of prestige and reputation (Archibald and Feldman 2008;
Gansemer-Topf and Schuh 2006; Grunig 1997; Robst 2001; Ryan 2004). Those concerned
about student outcomes and cost containment, however, argue that overly focusing on re-
search at the expense of instructional activities is problematic because often times these
research endeavors do not actively involve or affect undergraduate education (Weisbrod,
Ballou, and Asch 2008). Thus, some see research as a distraction that public institutions,
particularly those with low student achievement, should focus on less heavily. If account-
ability policies are successful in altering the focus of institutions away from certain activ-
ities (such as research) and toward others (such as instruction), then we ought to observe
differences in university expenditures on these activities when comparing schools in states
with funding policies versus those in states without them.
The causal logic that underlies performance accountability mechanisms (figure 1) im-
plies that incentives will be restructured in a way that results in changes in management that
are geared toward improving performance with respect to client outcomes. Unfortunately,
much of the research that examines the impacts of these policies, particularly in the area of
higher education, skips the intermediate links in the causal chain and focuses exclusively on
whether the adoption of performance policies result in improved student success. As a re-
sult, we have some limited information about whether accountability policies were success-
ful in bringing about improved performance (Volkwein and Tandberg 2008), but we have
very limited systematic analysis that can tell us why (or why not). If we are to understand
anything about why these policies work or do not work, we must begin by understanding
whether they are successful in changing the incentive structures that public managers face.
If they are unsuccessful in doing so, then the causal logic of performance management
breaks down and the desired impacts are unlikely to be realized.
Figure 1Causal Logic of Performance Funding Policies
Rabovsky Accountability in Higher Education 5

Rabovsky Accountability in Higher Education 679
Starting in the late 1990s, Joseph Burke began surveying state higher education officials
to better understand the landscape of accountability in higher education (Burke 2002). In
doing so, he developed a three-tiered classification of accountability policies. At the lowest
level, Burke classified states as having performance reporting policies. These states gather
data on student outcomes, but there is no substantial link between school performance and
funding decisions. Performance budgeting policies are those where the state collects
performance data and the legislature/funding agency considers it when crafting the budget
but where there are no formally specified benchmarks that result in automatic increases/
decreases in financial support. The strongest accountability policies, termed performance
funding, are those where some portion (often times a small percentage) of institutional
funding is directly linked to the achievement of performance indicators (Burke 2002).
Within this classification, performance-funding policies have been the most contro-
versial. Those in favor of performance funding lament the lack of external pressure on
institutions to improve student outcomes and have emphasized the importance of using
outcome measures to incentivize improved institutional performance (Aldeman and Carey
2009; Burke and Minassians 2003; Kelly, Schneider, and Carey 2010). On the other hand,
some have pointed out that performance funding could potentially result in a narrow focus
on a small number of indicators, which could cause institutions to dilute the quality of
education via grade inflation in order to improve their scores (and thus their budgets) (Hunt
2008; Wellman 2001; Zumeta 2001).
Performance-funding policies spread rapidly during the late 1990s and early 2000s, but
experienced a lull starting in the mid-2000s. The motivations behind adopting these policies
have been traced to several key factors. McLendon, Hearn, and Deaton (2006) find that
many of the factors that made New Public Management reforms successful in other policy
areas and the adoption of accountability mechanisms in K-12 education (particularly with
regards to NCLB) helped contribute to the adoption of performance-funding policies in
many states.
Despite their popularity during the last decade, performance-funding policies have
also proven to be somewhat unstable, with several states quickly abandoning these policies
soon after they were adopted (Dougherty, Natow, and Blanca forthcoming). Many states
adopted policies that only tied bonus money directly to performance, and thus, fiscal
constraints caused by economic recessions eliminated the funding base from which per-
formance money was drawn (Burke and Minassians 2003; Dougherty and Natow 2009).
Other causes of declining popularity of performance funding include a lack of support from
the higher education community, lackluster involvement of the private sector and business
leaders, and political turnover that replaced former champions of performance funding
with new leaders that were not interested in maintaining a long-term commitment to these
policies (Dougherty and Natow 2009).
During the last 2 years, however, performance funding has resurged as a prominent reform
proposal. In 2009, Complete College America, a nonprofit advocacy organization, formed and
began to lobby state governments to adopt a series of higher education reforms. These efforts
focused on reorganizing governance structures, improving remediation, and increasing the role
of performance data in budgeting and strategic planning activities (Complete College America
2010a). As of November 2010, 24 states have pledged to incorporate core principles from
the Complete College America agenda, which includes a strong push toward performance
funding, into their public systems of higher education (Complete College America 2010b).
4 Journal of Public Administration Research and Theory
This article empirically examines two aspects of the debate about performance
funding in higher education that have currently received little attention in the literature.
First, how effective have performance-funding policies been at reforming state budgets?
Underlying the causal logic behind performance funding is the belief that organizations will
respond to changes in the funding environment by adopting new strategies and techniques
to improve performance. If this assumption is correct, then performance-funding policies
must have a meaningful impact on the level of support that institutions receive from state
governments, not of other influences (such as the health of the economy or other factors that
limit the amount of money that states have to spend on higher education). This article
explores whether the adoption of performance funding strengthens the link between student
outcomes and state appropriations, as proponents suggest, or whether these policies have
been more symbolic with regards to budgetary impacts.
Second, this article seeks to understand whether stronger accountability mechanisms
influence the way that institutions allocate resources. In recent years, many universities
have sought to expand their capacity to conduct research, partly because doing so increases
their ability to secure attractive funding but also because research output is often times
associated with higher levels of prestige and reputation (Archibald and Feldman 2008;
Gansemer-Topf and Schuh 2006; Grunig 1997; Robst 2001; Ryan 2004). Those concerned
about student outcomes and cost containment, however, argue that overly focusing on re-
search at the expense of instructional activities is problematic because often times these
research endeavors do not actively involve or affect undergraduate education (Weisbrod,
Ballou, and Asch 2008). Thus, some see research as a distraction that public institutions,
particularly those with low student achievement, should focus on less heavily. If account-
ability policies are successful in altering the focus of institutions away from certain activ-
ities (such as research) and toward others (such as instruction), then we ought to observe
differences in university expenditures on these activities when comparing schools in states
with funding policies versus those in states without them.
The causal logic that underlies performance accountability mechanisms (figure 1) im-
plies that incentives will be restructured in a way that results in changes in management that
are geared toward improving performance with respect to client outcomes. Unfortunately,
much of the research that examines the impacts of these policies, particularly in the area of
higher education, skips the intermediate links in the causal chain and focuses exclusively on
whether the adoption of performance policies result in improved student success. As a re-
sult, we have some limited information about whether accountability policies were success-
ful in bringing about improved performance (Volkwein and Tandberg 2008), but we have
very limited systematic analysis that can tell us why (or why not). If we are to understand
anything about why these policies work or do not work, we must begin by understanding
whether they are successful in changing the incentive structures that public managers face.
If they are unsuccessful in doing so, then the causal logic of performance management
breaks down and the desired impacts are unlikely to be realized.
Figure 1Causal Logic of Performance Funding Policies
Rabovsky Accountability in Higher Education 5
Journal of Public Administration Research and Theory 680
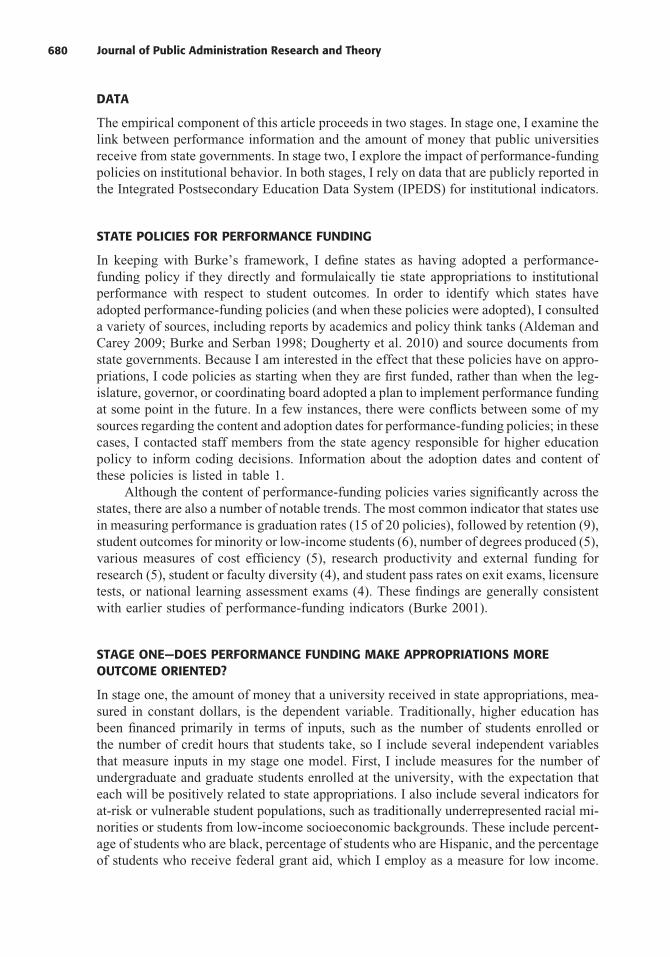
DATA
The empirical component of this article proceeds in two stages. In stage one, I examine the
link between performance information and the amount of money that public universities
receive from state governments. In stage two, I explore the impact of performance-funding
policies on institutional behavior. In both stages, I rely on data that are publicly reported in
the Integrated Postsecondary Education Data System (IPEDS) for institutional indicators.
STATE POLICIES FOR PERFORMANCE FUNDING
In keeping with Burke’s framework, I define states as having adopted a performance-
funding policy if they directly and formulaically tie state appropriations to institutional
performance with respect to student outcomes. In order to identify which states have
adopted performance-funding policies (and when these policies were adopted), I consulted
a variety of sources, including reports by academics and policy think tanks (Aldeman and
Carey 2009; Burke and Serban 1998; Dougherty et al. 2010) and source documents from
state governments. Because I am interested in the effect that these policies have on appro-
priations, I code policies as starting when they are first funded, rather than when the leg-
islature, governor, or coordinating board adopted a plan to implement performance funding
at some point in the future. In a few instances, there were conflicts between some of my
sources regarding the content and adoption dates for performance-funding policies; in these
cases, I contacted staff members from the state agency responsible for higher education
policy to inform coding decisions. Information about the adoption dates and content of
these policies is listed in table 1.
Although the content of performance-funding policies varies significantly across the
states, there are also a number of notable trends. The most common indicator that states use
in measuring performance is graduation rates (15 of 20 policies), followed by retention (9),
student outcomes for minority or low-income students (6), number of degrees produced (5),
various measures of cost efficiency (5), research productivity and external funding for
research (5), student or faculty diversity (4), and student pass rates on exit exams, licensure
tests, or national learning assessment exams (4). These findings are generally consistent
with earlier studies of performance-funding indicators (Burke 2001).
STAGE ONE—DOES PERFORMANCE FUNDING MAKE APPROPRIATIONS MOREOUTCOME ORIENTED?
In stage one, the amount of money that a university received in state appropriations, mea-
sured in constant dollars, is the dependent variable. Traditionally, higher education has
been financed primarily in terms of inputs, such as the number of students enrolled or
the number of credit hours that students take, so I include several independent variables
that measure inputs in my stage one model. First, I include measures for the number of
undergraduate and graduate students enrolled at the university, with the expectation that
each will be positively related to state appropriations. I also include several indicators for
at-risk or vulnerable student populations, such as traditionally underrepresented racial mi-
norities or students from low-income socioeconomic backgrounds. These include percent-
age of students who are black, percentage of students who are Hispanic, and the percentage
of students who receive federal grant aid, which I employ as a measure for low income.
6 Journal of Public Administration Research and Theory
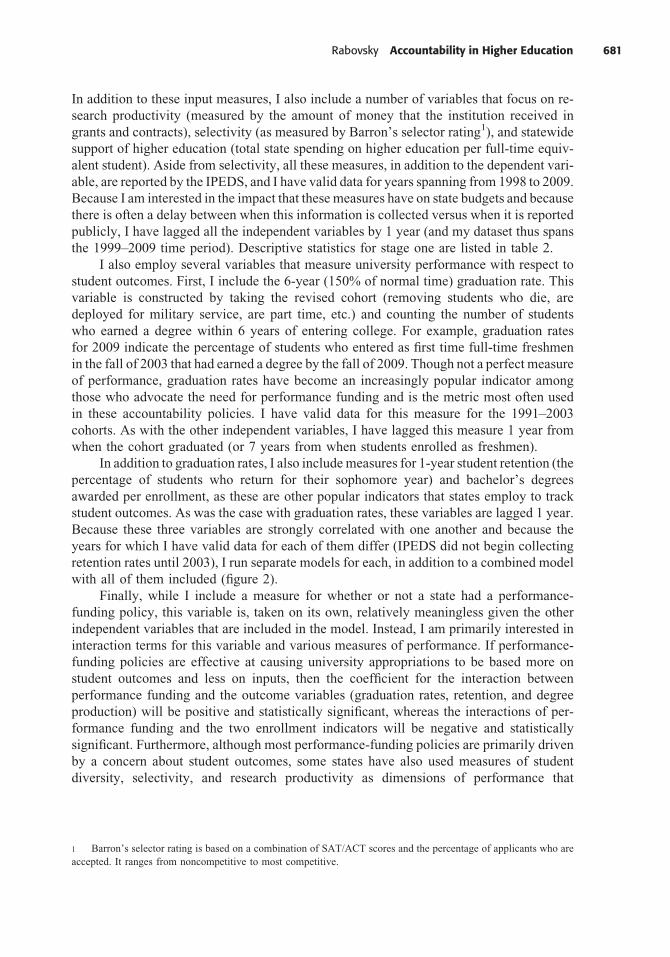
In addition to these input measures, I also include a number of variables that focus on re-
search productivity (measured by the amount of money that the institution received in
grants and contracts), selectivity (as measured by Barron’s selector rating1), and statewide
support of higher education (total state spending on higher education per full-time equiv-
alent student). Aside from selectivity, all these measures, in addition to the dependent vari-
able, are reported by the IPEDS, and I have valid data for years spanning from 1998 to 2009.
Because I am interested in the impact that these measures have on state budgets and because
there is often a delay between when this information is collected versus when it is reported
publicly, I have lagged all the independent variables by 1 year (and my dataset thus spans
the 1999–2009 time period). Descriptive statistics for stage one are listed in table 2.
I also employ several variables that measure university performance with respect to
student outcomes. First, I include the 6-year (150% of normal time) graduation rate. This
variable is constructed by taking the revised cohort (removing students who die, are
deployed for military service, are part time, etc.) and counting the number of students
who earned a degree within 6 years of entering college. For example, graduation rates
for 2009 indicate the percentage of students who entered as first time full-time freshmen
in the fall of 2003 that had earned a degree by the fall of 2009. Though not a perfect measure
of performance, graduation rates have become an increasingly popular indicator among
those who advocate the need for performance funding and is the metric most often used
in these accountability policies. I have valid data for this measure for the 1991–2003
cohorts. As with the other independent variables, I have lagged this measure 1 year from
when the cohort graduated (or 7 years from when students enrolled as freshmen).
Table 2Summary Statistics (Stage One)
MeanStandardDeviation Minimum Maximum
State appropriations (in $ millions) 101.8 114.5 3.11 696.0
State higher education spending per full-time equivalent
student (constant $1,000s)
6.83 1.44 2.95 13.7
Noncompetitive (Barron’s) 0.091 0.29 0 1
Less competitive (Barron’s) 0.17 0.38 0 1
Competitive (Barron’s) 0.48 0.50 0 1
Very competitive (Barron’s) 0.19 0.39 0 1
Highly competitive (Barron’s) 0.06 0.24 0 1
Most competitive (Barron’s) 0.012 0.11 0 1
Gifts, grants, and contracts per enrollment (constant $1,000s) 6.77 8.01 0.59 71.5
Undergraduate enrollment (1,000s) 11.2 7.87 0.77 53.3
Graduate enrollment (1,000s) 2.60 2.64 0 15.0
Percent receiving federal aid 31.1 14.8 2 90
Percent black students 12.7 19.3 0.14 97.8
Percent Hispanic students 6.25 10.6 0 88.5
Graduation rates (latest available information) 46.9 16.0 2.53 100
Retention rate 74.3 10.2 16 97
Bachelor’s degrees produced per enrollment 0.17 0.043 0.023 0.30
Performance funding 0.21 0.41 0 1
1 Barron’s selector rating is based on a combination of SAT/ACT scores and the percentage of applicants who are
accepted. It ranges from noncompetitive to most competitive.
Rabovsky Accountability in Higher Education 9
In addition to graduation rates, I also include measures for 1-year student retention (the
percentage of students who return for their sophomore year) and bachelor’s degrees
awarded per enrollment, as these are other popular indicators that states employ to track
student outcomes. As was the case with graduation rates, these variables are lagged 1 year.
Because these three variables are strongly correlated with one another and because the
years for which I have valid data for each of them differ (IPEDS did not begin collecting
retention rates until 2003), I run separate models for each, in addition to a combined model
with all of them included (figure 2).
Finally, while I include a measure for whether or not a state had a performance-
funding policy, this variable is, taken on its own, relatively meaningless given the other
independent variables that are included in the model. Instead, I am primarily interested in
interaction terms for this variable and various measures of performance. If performance-
funding policies are effective at causing university appropriations to be based more on
student outcomes and less on inputs, then the coefficient for the interaction between
performance funding and the outcome variables (graduation rates, retention, and degree
production) will be positive and statistically significant, whereas the interactions of per-
formance funding and the two enrollment indicators will be negative and statistically
significant. Furthermore, although most performance-funding policies are primarily driven
by a concern about student outcomes, some states have also used measures of student
diversity, selectivity, and research productivity as dimensions of performance that
Figure 2Correlation Matrix for Stage One
10 Journal of Public Administration Research and Theory
Rabovsky Accountability in Higher Education 681
DATA
The empirical component of this article proceeds in two stages. In stage one, I examine the
link between performance information and the amount of money that public universities
receive from state governments. In stage two, I explore the impact of performance-funding
policies on institutional behavior. In both stages, I rely on data that are publicly reported in
the Integrated Postsecondary Education Data System (IPEDS) for institutional indicators.
STATE POLICIES FOR PERFORMANCE FUNDING
In keeping with Burke’s framework, I define states as having adopted a performance-
funding policy if they directly and formulaically tie state appropriations to institutional
performance with respect to student outcomes. In order to identify which states have
adopted performance-funding policies (and when these policies were adopted), I consulted
a variety of sources, including reports by academics and policy think tanks (Aldeman and
Carey 2009; Burke and Serban 1998; Dougherty et al. 2010) and source documents from
state governments. Because I am interested in the effect that these policies have on appro-
priations, I code policies as starting when they are first funded, rather than when the leg-
islature, governor, or coordinating board adopted a plan to implement performance funding
at some point in the future. In a few instances, there were conflicts between some of my
sources regarding the content and adoption dates for performance-funding policies; in these
cases, I contacted staff members from the state agency responsible for higher education
policy to inform coding decisions. Information about the adoption dates and content of
these policies is listed in table 1.
Although the content of performance-funding policies varies significantly across the
states, there are also a number of notable trends. The most common indicator that states use
in measuring performance is graduation rates (15 of 20 policies), followed by retention (9),
student outcomes for minority or low-income students (6), number of degrees produced (5),
various measures of cost efficiency (5), research productivity and external funding for
research (5), student or faculty diversity (4), and student pass rates on exit exams, licensure
tests, or national learning assessment exams (4). These findings are generally consistent
with earlier studies of performance-funding indicators (Burke 2001).
STAGE ONE—DOES PERFORMANCE FUNDING MAKE APPROPRIATIONS MOREOUTCOME ORIENTED?
In stage one, the amount of money that a university received in state appropriations, mea-
sured in constant dollars, is the dependent variable. Traditionally, higher education has
been financed primarily in terms of inputs, such as the number of students enrolled or
the number of credit hours that students take, so I include several independent variables
that measure inputs in my stage one model. First, I include measures for the number of
undergraduate and graduate students enrolled at the university, with the expectation that
each will be positively related to state appropriations. I also include several indicators for
at-risk or vulnerable student populations, such as traditionally underrepresented racial mi-
norities or students from low-income socioeconomic backgrounds. These include percent-
age of students who are black, percentage of students who are Hispanic, and the percentage
of students who receive federal grant aid, which I employ as a measure for low income.
6 Journal of Public Administration Research and Theory
In addition to these input measures, I also include a number of variables that focus on re-
search productivity (measured by the amount of money that the institution received in
grants and contracts), selectivity (as measured by Barron’s selector rating1), and statewide
support of higher education (total state spending on higher education per full-time equiv-
alent student). Aside from selectivity, all these measures, in addition to the dependent vari-
able, are reported by the IPEDS, and I have valid data for years spanning from 1998 to 2009.
Because I am interested in the impact that these measures have on state budgets and because
there is often a delay between when this information is collected versus when it is reported
publicly, I have lagged all the independent variables by 1 year (and my dataset thus spans
the 1999–2009 time period). Descriptive statistics for stage one are listed in table 2.
I also employ several variables that measure university performance with respect to
student outcomes. First, I include the 6-year (150% of normal time) graduation rate. This
variable is constructed by taking the revised cohort (removing students who die, are
deployed for military service, are part time, etc.) and counting the number of students
who earned a degree within 6 years of entering college. For example, graduation rates
for 2009 indicate the percentage of students who entered as first time full-time freshmen
in the fall of 2003 that had earned a degree by the fall of 2009. Though not a perfect measure
of performance, graduation rates have become an increasingly popular indicator among
those who advocate the need for performance funding and is the metric most often used
in these accountability policies. I have valid data for this measure for the 1991–2003
cohorts. As with the other independent variables, I have lagged this measure 1 year from
when the cohort graduated (or 7 years from when students enrolled as freshmen).
Table 2Summary Statistics (Stage One)
MeanStandardDeviation Minimum Maximum
State appropriations (in $ millions) 101.8 114.5 3.11 696.0
State higher education spending per full-time equivalent
student (constant $1,000s)
6.83 1.44 2.95 13.7
Noncompetitive (Barron’s) 0.091 0.29 0 1
Less competitive (Barron’s) 0.17 0.38 0 1
Competitive (Barron’s) 0.48 0.50 0 1
Very competitive (Barron’s) 0.19 0.39 0 1
Highly competitive (Barron’s) 0.06 0.24 0 1
Most competitive (Barron’s) 0.012 0.11 0 1
Gifts, grants, and contracts per enrollment (constant $1,000s) 6.77 8.01 0.59 71.5
Undergraduate enrollment (1,000s) 11.2 7.87 0.77 53.3
Graduate enrollment (1,000s) 2.60 2.64 0 15.0
Percent receiving federal aid 31.1 14.8 2 90
Percent black students 12.7 19.3 0.14 97.8
Percent Hispanic students 6.25 10.6 0 88.5
Graduation rates (latest available information) 46.9 16.0 2.53 100
Retention rate 74.3 10.2 16 97
Bachelor’s degrees produced per enrollment 0.17 0.043 0.023 0.30
Performance funding 0.21 0.41 0 1
1 Barron’s selector rating is based on a combination of SAT/ACT scores and the percentage of applicants who are
accepted. It ranges from noncompetitive to most competitive.
Rabovsky Accountability in Higher Education 9
In addition to graduation rates, I also include measures for 1-year student retention (the
percentage of students who return for their sophomore year) and bachelor’s degrees
awarded per enrollment, as these are other popular indicators that states employ to track
student outcomes. As was the case with graduation rates, these variables are lagged 1 year.
Because these three variables are strongly correlated with one another and because the
years for which I have valid data for each of them differ (IPEDS did not begin collecting
retention rates until 2003), I run separate models for each, in addition to a combined model
with all of them included (figure 2).
Finally, while I include a measure for whether or not a state had a performance-
funding policy, this variable is, taken on its own, relatively meaningless given the other
independent variables that are included in the model. Instead, I am primarily interested in
interaction terms for this variable and various measures of performance. If performance-
funding policies are effective at causing university appropriations to be based more on
student outcomes and less on inputs, then the coefficient for the interaction between
performance funding and the outcome variables (graduation rates, retention, and degree
production) will be positive and statistically significant, whereas the interactions of per-
formance funding and the two enrollment indicators will be negative and statistically
significant. Furthermore, although most performance-funding policies are primarily driven
by a concern about student outcomes, some states have also used measures of student
diversity, selectivity, and research productivity as dimensions of performance that
Figure 2Correlation Matrix for Stage One
10 Journal of Public Administration Research and Theory

Journal of Public Administration Research and Theory 682
Table
1Summary
ofPerform
ance-FundingPoliciesandPerform
ance
Indicators
State
Years
Policy
Was
inEffect
Perform
ance
Indicators
Arkansas
1994–1996(firstfunded
in1995)
Graduationrates,retention,m
inoritygraduationrates,minorityretention,licensurepass
rates,exitexam
s,administrativecosts,facultyteachingload,studentbodydiversity,
facultydiversity,alumni,andem
ployer
surveys
Arkansas
2008–Present
Number
credithours
enrolled
atthebeginningoftheterm
,number
ofcourse
completions
Colorado
1993–Present(firstfunded
in1994)
Graduationrates,retention,minority
studentsuccess,passratesofgraduates
on
technical
exam
s,institutional
support/administrativeexpendituresper
full-tim
e
student,classsize,number
ofcreditsrequired
fordegree,
facultyinstructional
workload,andtwoinstitution-specificmeasures
Indiana
2007–Present
Graduationrates,bachelor’sdegrees
produced,degreecompletionforlow-income
students,research
productivity
Kansas
1999–Present
Indicatorsarespecificto
each
institution(andarelargelyselected
bytheinstitutions),
includes
thingssuch
asgraduationrates,retention,studentbodydiversity,graduates’
scoresonlearningassessmentexam
s,minority
studentoutcomes,participationin
studyabroad
programs,facultycredentials,andexternal
research
grants
Kentucky
1996–1997
Graduationrates,retention
Kentucky
2007(suspended
after
1yeardueto
budget
cuts)
Degreeproductionperfull-tim
eequivalentstudent,minoritystudentdegreeproduction,
oneindicatorofchoice
(includes
graduationrates,studentlearningassessments,transfer
credits,andother
indicators)
Louisiana
2008–Present
Number
ofdegreecompleters,minority
studentdegreecompleters,number
of
completers
inscience,technology,engineering,andmathfields
Minnesota
1995–1997(firstfunded
in1996)
Graduationrates,retention,rankingofincomingfreshmen,m
inoritystudentenrollment
Missouri
1991–2002(firstfunded
in1993)
Graduationrates,bachelor’sdegrees
produced,bachelor’sdegrees
producedfor
minority
students,scoresofgraduates
onnational
exam
s
New
Jersey
1999–2002
Graduationrates,cost
efficiency,anddiversificationofrevenues
New
Mexico
2005–Present(firstfunded
in2007)
Graduationrates,retention,andresearch
productivity(forresearch
universities
only)
Continued
7
Table
1(continued)
Summary
ofPerform
ance-FundingPoliciesandPerform
ance
Indicators
State
Years
Policy
Was
inEffect
Perform
ance
Indicators
Ohio
1998–Present
Primarilyfocusedonexternal
research
grants
awarded
andtuition,butalso
contains
indicators
fortimeto
degree,
anddegreecompletionam
ongat-riskstudents
Oklahoma
1997–Present(suspended
for1year
in2001dueto
lack
offunds)
Graduationratesandretention
Pennsylvania
(Pennsylvania
State
System
of
Higher
Educationonly)
2000–Present
Indicators
broken
into
fourcategories:(1)studentachievem
entandsuccess,
(2)university
andsystem
excellence,(3)commonwealthservice,
(4)resource
developmentandstew
ardship.Indicators
includegraduationrates,retention,
bachelor’sdegrees
awarded,facultydiversity,facultyproductivity,studenttofaculty
ratio,andcost
per
FTEstudent
South
Carolina
1996–2004
Totalof37indicators,broken
into
ninecategories:(1)graduate’sachievem
ents,
(2)qualityoffaculty,(3)instructional
quality,(4)institutional
cooperationand
collaboration,(5)administrativeefficiency,(6)entrance
requirem
ents,(7)mission
focus,(8)userfriendliness,and(9)research
funding.Indicators
includegraduation
rates,facultyteachingandresearch
credentials,studentto
teacher
ratios,
administrativecostefficiency,SAT/ACTscoresofenteringfreshmen,andexternal
research
grants
awarded
Tennessee
1979–Present
Severalindicatorsseparated
intofourmajorcategories:(1)studentlearningandaccess,
(2)student,alumni,andem
ployer
surveys,(3)Achievem
entofstatemasterplan
priorities,and(4)assessmentoutcomes.Indicatorsandbenchmarksareupdated
and
revised
on5-yearcycles.Graduationrates,retention,minority
studentenrollment,
andscoresonlearningassessmenttestsaregenerally
amongthemajorindicators
Texas
1999–2003
Number
ofstudentsdefined
asunprepared
forcollegewhosuccessfullycomplete
remedialcoursew
ork
Virginia
2005–Present
Retention,access
forunderprivileged
populations,tuition,external
research
grants,
contributionto
economic
development
Washington
1997–1998
Graduationrates,retention,undergraduateefficiency
(ratio
ofcreditstaken
tocredits
needed
tograduate),facultyproductivity,plusoneuniqueindicatorforeach
university
8

Rabovsky Accountability in Higher Education 683
Table
1Summary
ofPerform
ance-FundingPoliciesandPerform
ance
Indicators
State
Years
Policy
Was
inEffect
Perform
ance
Indicators
Arkansas
1994–1996(firstfunded
in1995)
Graduationrates,retention,m
inoritygraduationrates,minorityretention,licensurepass
rates,exitexam
s,administrativecosts,facultyteachingload,studentbodydiversity,
facultydiversity,alumni,andem
ployer
surveys
Arkansas
2008–Present
Number
credithours
enrolled
atthebeginningoftheterm
,number
ofcourse
completions
Colorado
1993–Present(firstfunded
in1994)
Graduationrates,retention,minority
studentsuccess,passratesofgraduates
on
technical
exam
s,institutional
support/administrativeexpendituresper
full-tim
e
student,classsize,number
ofcreditsrequired
fordegree,
facultyinstructional
workload,andtwoinstitution-specificmeasures
Indiana
2007–Present
Graduationrates,bachelor’sdegrees
produced,degreecompletionforlow-income
students,research
productivity
Kansas
1999–Present
Indicatorsarespecificto
each
institution(andarelargelyselected
bytheinstitutions),
includes
thingssuch
asgraduationrates,retention,studentbodydiversity,graduates’
scoresonlearningassessmentexam
s,minority
studentoutcomes,participationin
studyabroad
programs,facultycredentials,andexternal
research
grants
Kentucky
1996–1997
Graduationrates,retention
Kentucky
2007(suspended
after
1yeardueto
budget
cuts)
Degreeproductionperfull-tim
eequivalentstudent,minoritystudentdegreeproduction,
oneindicatorofchoice
(includes
graduationrates,studentlearningassessments,transfer
credits,andother
indicators)
Louisiana
2008–Present
Number
ofdegreecompleters,minority
studentdegreecompleters,number
of
completers
inscience,technology,engineering,andmathfields
Minnesota
1995–1997(firstfunded
in1996)
Graduationrates,retention,rankingofincomingfreshmen,m
inoritystudentenrollment
Missouri
1991–2002(firstfunded
in1993)
Graduationrates,bachelor’sdegrees
produced,bachelor’sdegrees
producedfor
minority
students,scoresofgraduates
onnational
exam
s
New
Jersey
1999–2002
Graduationrates,cost
efficiency,anddiversificationofrevenues
New
Mexico
2005–Present(firstfunded
in2007)
Graduationrates,retention,andresearch
productivity(forresearch
universities
only)
Continued
7
Table
1(continued)
Summary
ofPerform
ance-FundingPoliciesandPerform
ance
Indicators
State
Years
Policy
Was
inEffect
Perform
ance
Indicators
Ohio
1998–Present
Primarilyfocusedonexternal
research
grants
awarded
andtuition,butalso
contains
indicators
fortimeto
degree,
anddegreecompletionam
ongat-riskstudents
Oklahoma
1997–Present(suspended
for1year
in2001dueto
lack
offunds)
Graduationratesandretention
Pennsylvania
(Pennsylvania
State
System
of
Higher
Educationonly)
2000–Present
Indicators
broken
into
fourcategories:(1)studentachievem
entandsuccess,
(2)university
andsystem
excellence,(3)commonwealthservice,
(4)resource
developmentandstew
ardship.Indicators
includegraduationrates,retention,
bachelor’sdegrees
awarded,facultydiversity,facultyproductivity,studenttofaculty
ratio,andcost
per
FTEstudent
South
Carolina
1996–2004
Totalof37indicators,broken
into
ninecategories:(1)graduate’sachievem
ents,
(2)qualityoffaculty,(3)instructional
quality,(4)institutional
cooperationand
collaboration,(5)administrativeefficiency,(6)entrance
requirem
ents,(7)mission
focus,(8)userfriendliness,and(9)research
funding.Indicators
includegraduation
rates,facultyteachingandresearch
credentials,studentto
teacher
ratios,
administrativecostefficiency,SAT/ACTscoresofenteringfreshmen,andexternal
research
grants
awarded
Tennessee
1979–Present
Severalindicatorsseparated
intofourmajorcategories:(1)studentlearningandaccess,
(2)student,alumni,andem
ployer
surveys,(3)Achievem
entofstatemasterplan
priorities,and(4)assessmentoutcomes.Indicatorsandbenchmarksareupdated
and
revised
on5-yearcycles.Graduationrates,retention,minority
studentenrollment,
andscoresonlearningassessmenttestsaregenerally
amongthemajorindicators
Texas
1999–2003
Number
ofstudentsdefined
asunprepared
forcollegewhosuccessfullycomplete
remedialcoursew
ork
Virginia
2005–Present
Retention,access
forunderprivileged
populations,tuition,external
research
grants,
contributionto
economic
development
Washington
1997–1998
Graduationrates,retention,undergraduateefficiency
(ratio
ofcreditstaken
tocredits
needed
tograduate),facultyproductivity,plusoneuniqueindicatorforeach
university
8

Journal of Public Administration Research and Theory 684
institutions are rewarded for improving, so I also include interactions for performance
funding with these variables.
My dataset includes all public 4-year degree-granting institutions with a Carnegie
classification of bachelor’s or higher (excludingmilitary academies and universities located
in Washington, DC), with data from multiple years for each university. When dealing with
data that have both cross-sectional and time-series components such as these, one must be
careful to address potential problems with serial autocorrelation and heteroskedasticity
between panels (Greene 2003; Wooldridge 2002). Thus, in both stages, I follow the
advice of Beck and Katz (1995) and employ panel-corrected standard errors (PCSEs) with
panel-specific corrections for AR1 autocorrelation.
The stage one model can be written as:
Yit5a1ßStateSpendingst1ßSelectivityit�11ßResearchit�11ßUndergradit�1
1ßGraduateit�11ßPercBlackit�11ßPercHispanicit�11ßPercAidit�11ßGradRateit�1
1ßRetentionit�11ßDegreesit�11ßPFundingit1ßPFunding� Performanceit�11eit;
where Yit is the amount of funding that an institution received in appropriations at time t, ais the constant, StateSpendingst is the amount of money that a state appropriated for higher
education in year t, Selectivityit-1 is a set of variables to reflect institutional
competitiveness, PFunding � Performance represents a vector for the interaction terms
for performance funding and each dimension of performance, and eit is the error term.
STAGE ONE—FINDINGS
Figure 3 provides an exploratory look at the variation that exists among the states when it
comes to the relationship between funding and performance. Each dot represents an indi-
vidual institution within a given state, and the lines show bivariate regression slopes of
graduation rates on state appropriations. Observations in years where states have adopted
performance funding are gray, whereas those in years without performance funding are
black. Although one should be cautious about drawing overly strong conclusions from this
display alone, particularly given the lack of controls for confounding variables, there does
not seem to be a very strong pattern in terms of performance-funding states having mark-
edly closer connections between student outcomes (at least in terms of graduation rates) and
appropriations. Furthermore, in many cases where states had a policy for some of the years
but not all of them, there appears to be almost no difference in the strength of the relation-
ship between performance and institutional funding. With this in mind, I now turn to more
sophisticated multivariate analysis of my stage one model in order to better understand the
factors that shape state appropriations.
Results for stage one are listed in table 3, and there are several important findings. As
stated earlier, I ran four models in total (one for each student outcome variable separately
and one combined model with all the outcome variables). In terms of the nonstudent out-
come-related variables, the findings are generally consistent across all four models; how-
ever, because these models incorporate different time spans and because some of the
student outcome variables are highly correlated with each other, some of the effects in
the first three models are no longer statistically significant in model 4.
First, in terms of performance information, there is a positive and statistically signif-
icant relationship between the latest information on each measure of student outcomes and
Rabovsky Accountability in Higher Education 11
In addition to these input measures, I also include a number of variables that focus on re-
search productivity (measured by the amount of money that the institution received in
grants and contracts), selectivity (as measured by Barron’s selector rating1), and statewide
support of higher education (total state spending on higher education per full-time equiv-
alent student). Aside from selectivity, all these measures, in addition to the dependent vari-
able, are reported by the IPEDS, and I have valid data for years spanning from 1998 to 2009.
Because I am interested in the impact that these measures have on state budgets and because
there is often a delay between when this information is collected versus when it is reported
publicly, I have lagged all the independent variables by 1 year (and my dataset thus spans
the 1999–2009 time period). Descriptive statistics for stage one are listed in table 2.
I also employ several variables that measure university performance with respect to
student outcomes. First, I include the 6-year (150% of normal time) graduation rate. This
variable is constructed by taking the revised cohort (removing students who die, are
deployed for military service, are part time, etc.) and counting the number of students
who earned a degree within 6 years of entering college. For example, graduation rates
for 2009 indicate the percentage of students who entered as first time full-time freshmen
in the fall of 2003 that had earned a degree by the fall of 2009. Though not a perfect measure
of performance, graduation rates have become an increasingly popular indicator among
those who advocate the need for performance funding and is the metric most often used
in these accountability policies. I have valid data for this measure for the 1991–2003
cohorts. As with the other independent variables, I have lagged this measure 1 year from
when the cohort graduated (or 7 years from when students enrolled as freshmen).
Table 2Summary Statistics (Stage One)
MeanStandardDeviation Minimum Maximum
State appropriations (in $ millions) 101.8 114.5 3.11 696.0
State higher education spending per full-time equivalent
student (constant $1,000s)
6.83 1.44 2.95 13.7
Noncompetitive (Barron’s) 0.091 0.29 0 1
Less competitive (Barron’s) 0.17 0.38 0 1
Competitive (Barron’s) 0.48 0.50 0 1
Very competitive (Barron’s) 0.19 0.39 0 1
Highly competitive (Barron’s) 0.06 0.24 0 1
Most competitive (Barron’s) 0.012 0.11 0 1
Gifts, grants, and contracts per enrollment (constant $1,000s) 6.77 8.01 0.59 71.5
Undergraduate enrollment (1,000s) 11.2 7.87 0.77 53.3
Graduate enrollment (1,000s) 2.60 2.64 0 15.0
Percent receiving federal aid 31.1 14.8 2 90
Percent black students 12.7 19.3 0.14 97.8
Percent Hispanic students 6.25 10.6 0 88.5
Graduation rates (latest available information) 46.9 16.0 2.53 100
Retention rate 74.3 10.2 16 97
Bachelor’s degrees produced per enrollment 0.17 0.043 0.023 0.30
Performance funding 0.21 0.41 0 1
1 Barron’s selector rating is based on a combination of SAT/ACT scores and the percentage of applicants who are
accepted. It ranges from noncompetitive to most competitive.
Rabovsky Accountability in Higher Education 9
In addition to graduation rates, I also include measures for 1-year student retention (the
percentage of students who return for their sophomore year) and bachelor’s degrees
awarded per enrollment, as these are other popular indicators that states employ to track
student outcomes. As was the case with graduation rates, these variables are lagged 1 year.
Because these three variables are strongly correlated with one another and because the
years for which I have valid data for each of them differ (IPEDS did not begin collecting
retention rates until 2003), I run separate models for each, in addition to a combined model
with all of them included (figure 2).
Finally, while I include a measure for whether or not a state had a performance-
funding policy, this variable is, taken on its own, relatively meaningless given the other
independent variables that are included in the model. Instead, I am primarily interested in
interaction terms for this variable and various measures of performance. If performance-
funding policies are effective at causing university appropriations to be based more on
student outcomes and less on inputs, then the coefficient for the interaction between
performance funding and the outcome variables (graduation rates, retention, and degree
production) will be positive and statistically significant, whereas the interactions of per-
formance funding and the two enrollment indicators will be negative and statistically
significant. Furthermore, although most performance-funding policies are primarily driven
by a concern about student outcomes, some states have also used measures of student
diversity, selectivity, and research productivity as dimensions of performance that
Figure 2Correlation Matrix for Stage One
10 Journal of Public Administration Research and Theory

Rabovsky Accountability in Higher Education 685
institutions are rewarded for improving, so I also include interactions for performance
funding with these variables.
My dataset includes all public 4-year degree-granting institutions with a Carnegie
classification of bachelor’s or higher (excludingmilitary academies and universities located
in Washington, DC), with data from multiple years for each university. When dealing with
data that have both cross-sectional and time-series components such as these, one must be
careful to address potential problems with serial autocorrelation and heteroskedasticity
between panels (Greene 2003; Wooldridge 2002). Thus, in both stages, I follow the
advice of Beck and Katz (1995) and employ panel-corrected standard errors (PCSEs) with
panel-specific corrections for AR1 autocorrelation.
The stage one model can be written as:
Yit5a1ßStateSpendingst1ßSelectivityit�11ßResearchit�11ßUndergradit�1
1ßGraduateit�11ßPercBlackit�11ßPercHispanicit�11ßPercAidit�11ßGradRateit�1
1ßRetentionit�11ßDegreesit�11ßPFundingit1ßPFunding� Performanceit�11eit;
where Yit is the amount of funding that an institution received in appropriations at time t, ais the constant, StateSpendingst is the amount of money that a state appropriated for higher
education in year t, Selectivityit-1 is a set of variables to reflect institutional
competitiveness, PFunding � Performance represents a vector for the interaction terms
for performance funding and each dimension of performance, and eit is the error term.
STAGE ONE—FINDINGS
Figure 3 provides an exploratory look at the variation that exists among the states when it
comes to the relationship between funding and performance. Each dot represents an indi-
vidual institution within a given state, and the lines show bivariate regression slopes of
graduation rates on state appropriations. Observations in years where states have adopted
performance funding are gray, whereas those in years without performance funding are
black. Although one should be cautious about drawing overly strong conclusions from this
display alone, particularly given the lack of controls for confounding variables, there does
not seem to be a very strong pattern in terms of performance-funding states having mark-
edly closer connections between student outcomes (at least in terms of graduation rates) and
appropriations. Furthermore, in many cases where states had a policy for some of the years
but not all of them, there appears to be almost no difference in the strength of the relation-
ship between performance and institutional funding. With this in mind, I now turn to more
sophisticated multivariate analysis of my stage one model in order to better understand the
factors that shape state appropriations.
Results for stage one are listed in table 3, and there are several important findings. As
stated earlier, I ran four models in total (one for each student outcome variable separately
and one combined model with all the outcome variables). In terms of the nonstudent out-
come-related variables, the findings are generally consistent across all four models; how-
ever, because these models incorporate different time spans and because some of the
student outcome variables are highly correlated with each other, some of the effects in
the first three models are no longer statistically significant in model 4.
First, in terms of performance information, there is a positive and statistically signif-
icant relationship between the latest information on each measure of student outcomes and
Rabovsky Accountability in Higher Education 11
In addition to these input measures, I also include a number of variables that focus on re-
search productivity (measured by the amount of money that the institution received in
grants and contracts), selectivity (as measured by Barron’s selector rating1), and statewide
support of higher education (total state spending on higher education per full-time equiv-
alent student). Aside from selectivity, all these measures, in addition to the dependent vari-
able, are reported by the IPEDS, and I have valid data for years spanning from 1998 to 2009.
Because I am interested in the impact that these measures have on state budgets and because
there is often a delay between when this information is collected versus when it is reported
publicly, I have lagged all the independent variables by 1 year (and my dataset thus spans
the 1999–2009 time period). Descriptive statistics for stage one are listed in table 2.
I also employ several variables that measure university performance with respect to
student outcomes. First, I include the 6-year (150% of normal time) graduation rate. This
variable is constructed by taking the revised cohort (removing students who die, are
deployed for military service, are part time, etc.) and counting the number of students
who earned a degree within 6 years of entering college. For example, graduation rates
for 2009 indicate the percentage of students who entered as first time full-time freshmen
in the fall of 2003 that had earned a degree by the fall of 2009. Though not a perfect measure
of performance, graduation rates have become an increasingly popular indicator among
those who advocate the need for performance funding and is the metric most often used
in these accountability policies. I have valid data for this measure for the 1991–2003
cohorts. As with the other independent variables, I have lagged this measure 1 year from
when the cohort graduated (or 7 years from when students enrolled as freshmen).
Table 2Summary Statistics (Stage One)
MeanStandardDeviation Minimum Maximum
State appropriations (in $ millions) 101.8 114.5 3.11 696.0
State higher education spending per full-time equivalent
student (constant $1,000s)
6.83 1.44 2.95 13.7
Noncompetitive (Barron’s) 0.091 0.29 0 1
Less competitive (Barron’s) 0.17 0.38 0 1
Competitive (Barron’s) 0.48 0.50 0 1
Very competitive (Barron’s) 0.19 0.39 0 1
Highly competitive (Barron’s) 0.06 0.24 0 1
Most competitive (Barron’s) 0.012 0.11 0 1
Gifts, grants, and contracts per enrollment (constant $1,000s) 6.77 8.01 0.59 71.5
Undergraduate enrollment (1,000s) 11.2 7.87 0.77 53.3
Graduate enrollment (1,000s) 2.60 2.64 0 15.0
Percent receiving federal aid 31.1 14.8 2 90
Percent black students 12.7 19.3 0.14 97.8
Percent Hispanic students 6.25 10.6 0 88.5
Graduation rates (latest available information) 46.9 16.0 2.53 100
Retention rate 74.3 10.2 16 97
Bachelor’s degrees produced per enrollment 0.17 0.043 0.023 0.30
Performance funding 0.21 0.41 0 1
1 Barron’s selector rating is based on a combination of SAT/ACT scores and the percentage of applicants who are
accepted. It ranges from noncompetitive to most competitive.
Rabovsky Accountability in Higher Education 9
In addition to graduation rates, I also include measures for 1-year student retention (the
percentage of students who return for their sophomore year) and bachelor’s degrees
awarded per enrollment, as these are other popular indicators that states employ to track
student outcomes. As was the case with graduation rates, these variables are lagged 1 year.
Because these three variables are strongly correlated with one another and because the
years for which I have valid data for each of them differ (IPEDS did not begin collecting
retention rates until 2003), I run separate models for each, in addition to a combined model
with all of them included (figure 2).
Finally, while I include a measure for whether or not a state had a performance-
funding policy, this variable is, taken on its own, relatively meaningless given the other
independent variables that are included in the model. Instead, I am primarily interested in
interaction terms for this variable and various measures of performance. If performance-
funding policies are effective at causing university appropriations to be based more on
student outcomes and less on inputs, then the coefficient for the interaction between
performance funding and the outcome variables (graduation rates, retention, and degree
production) will be positive and statistically significant, whereas the interactions of per-
formance funding and the two enrollment indicators will be negative and statistically
significant. Furthermore, although most performance-funding policies are primarily driven
by a concern about student outcomes, some states have also used measures of student
diversity, selectivity, and research productivity as dimensions of performance that
Figure 2Correlation Matrix for Stage One
10 Journal of Public Administration Research and Theory

Journal of Public Administration Research and Theory 686
Table
3StageOneResu
lts(D
ependentVariable,State
Appropriations,
inConstant$Millions)
(1)
(2)
(3)
(4)
State
higher
educationspendingper
full-tim
eequivalentstudent(constant$1,000s)
9.159***
10.479***
9.264***
10.179***
(0.44)
(0.69)
(0.45)
(0.60)
Undergraduateenrollment(1,000s)
7.382***
7.315***
7.519***
7.004***
(0.34)
(0.38)
(0.36)
(0.37)
Graduateenrollment(1,000s)
8.666***
7.542***
8.601***
7.703***
(0.96)
(1.12)
(1.02)
(1.05)
Lesscompetitive(Barron’s)
1.526
5.285**
1.611
1.970
(1.60)
(2.01)
(1.55)
(2.04)
Competitive(Barron’s)
23.821*
22.119
22.472
25.253*
(1.69)
(2.15)
(1.58)
(2.32)
Verycompetitive(Barron’s)
6.069*
6.715*
7.421**
2.247
(2.67)
(3.28)
(2.45)
(3.36)
Highly
competitive(Barron’s)
13.632**
7.898
15.309***
2.704
(4.93)
(6.28)
(4.63)
(6.15)
Most
competitive(Barron’s)
54.003**
79.143***
59.715***
70.847***
(18.67)
(19.37)
(17.65)
(19.55)
Gifts,grants,andcontracts
per
enrollment(constant$1,000s)
4.721***
5.072***
4.781***
4.918***
(0.28)
(0.34)
(0.26)
(0.34)
Percentreceivingfederal
aid
0.090*
0.110*
0.084*
0.198***
(0.04)
(0.05)
(0.04)
(0.05)
Percentblack
students
20.121***
20.132***
20.104***
20.098**
(0.03)
(0.04)
(0.03)
(0.03)
PercentHispanic
students
20.583***
20.721***
20.667***
20.695***
(0.06)
(0.07)
(0.06)
(0.07)
Graduationrates(latestavailable
inform
ation)
0.365***
——
0.257***
(0.06)
——
(0.07)
Retentionrate
—0.229**
20.037
—(0.07)
(0.06)
Bachelor’sdegrees
producedper
enrollment
——
131.567***
125.882***
Continued
13
Table
3(continued)
StageOneResu
lts(D
ependentVariable,State
Appropriations,
inConstant$Millions)
(1)
(2)
(3)
(4)
——
(18.36)
(17.63)
Perform
ance
funding
8.5741
8.107
9.9841
8.176
(4.49)
(10.59)
(5.96)
(9.95)
Perform
ance
funding�
undergraduateenrollment
1.322***
1.183*
1.331***
0.9711
(0.38)
(0.50)
(0.39)
(0.50)
Perform
ance
funding�
graduateenrollment
22.5061
22.093
22.4971
21.790
(1.28)
(1.86)
(1.34)
(1.89)
Perform
ance
funding�
gifts,grants,andcontracts
21.115*
21.3721
21.235**
21.195
(0.48)
(0.70)
(0.46)
(0.73)
Perform
ance
funding�
less
competitive
1.918
3.798
1.646
2.335
(2.56)
(2.98)
(2.51)
(3.02)
Perform
ance
funding�
competitive
7.332**
10.393**
5.3441
9.139**
(2.82)
(3.28)
(2.78)
(3.45)
Perform
ance
funding�
verycompetitive
4.274
3.034
1.538
5.447
(4.39)
(4.81)
(4.37)
(4.86)
Perform
ance
funding�
highly
competitive
25.417
28.895
28.905
20.061
(7.69)
(10.89)
(7.72)
(10.27)
Perform
ance
funding�
most
competitive
222.411
271.766*
220.922
275.237*
(27.99)
(32.13)
(25.72)
(33.36)
Perform
ance
funding�
percentreceivingfederal
aid
20.134*
20.096
20.128*
20.185*
(0.05)
(0.08)
(0.05)
(0.08)
Perform
ance
funding�
percentblack
0.172***
0.088
0.177***
0.092
(0.05)
(0.06)
(0.05)
(0.07)
Perform
ance
funding�
percenthispanic
0.226***
0.248**
0.293***
0.291***
(0.06)
(0.08)
(0.06)
(0.08)
Perform
ance
funding�
graduationrate
20.307***
——
20.2111
(0.08)
——
(0.12)
Perform
ance
funding�
retentionrate
—20.186
—0.046
—(0.16)
—(0.14)
Continued
14

Rabovsky Accountability in Higher Education 687
Table
3StageOneResu
lts(D
ependentVariable,State
Appropriations,
inConstant$Millions)
(1)
(2)
(3)
(4)
State
higher
educationspendingper
full-tim
eequivalentstudent(constant$1,000s)
9.159***
10.479***
9.264***
10.179***
(0.44)
(0.69)
(0.45)
(0.60)
Undergraduateenrollment(1,000s)
7.382***
7.315***
7.519***
7.004***
(0.34)
(0.38)
(0.36)
(0.37)
Graduateenrollment(1,000s)
8.666***
7.542***
8.601***
7.703***
(0.96)
(1.12)
(1.02)
(1.05)
Lesscompetitive(Barron’s)
1.526
5.285**
1.611
1.970
(1.60)
(2.01)
(1.55)
(2.04)
Competitive(Barron’s)
23.821*
22.119
22.472
25.253*
(1.69)
(2.15)
(1.58)
(2.32)
Verycompetitive(Barron’s)
6.069*
6.715*
7.421**
2.247
(2.67)
(3.28)
(2.45)
(3.36)
Highly
competitive(Barron’s)
13.632**
7.898
15.309***
2.704
(4.93)
(6.28)
(4.63)
(6.15)
Most
competitive(Barron’s)
54.003**
79.143***
59.715***
70.847***
(18.67)
(19.37)
(17.65)
(19.55)
Gifts,grants,andcontracts
per
enrollment(constant$1,000s)
4.721***
5.072***
4.781***
4.918***
(0.28)
(0.34)
(0.26)
(0.34)
Percentreceivingfederal
aid
0.090*
0.110*
0.084*
0.198***
(0.04)
(0.05)
(0.04)
(0.05)
Percentblack
students
20.121***
20.132***
20.104***
20.098**
(0.03)
(0.04)
(0.03)
(0.03)
PercentHispanic
students
20.583***
20.721***
20.667***
20.695***
(0.06)
(0.07)
(0.06)
(0.07)
Graduationrates(latestavailable
inform
ation)
0.365***
——
0.257***
(0.06)
——
(0.07)
Retentionrate
—0.229**
20.037
—(0.07)
(0.06)
Bachelor’sdegrees
producedper
enrollment
——
131.567***
125.882***
Continued
13
Table
3(continued)
StageOneResu
lts(D
ependentVariable,State
Appropriations,
inConstant$Millions)
(1)
(2)
(3)
(4)
——
(18.36)
(17.63)
Perform
ance
funding
8.5741
8.107
9.9841
8.176
(4.49)
(10.59)
(5.96)
(9.95)
Perform
ance
funding�
undergraduateenrollment
1.322***
1.183*
1.331***
0.9711
(0.38)
(0.50)
(0.39)
(0.50)
Perform
ance
funding�
graduateenrollment
22.5061
22.093
22.4971
21.790
(1.28)
(1.86)
(1.34)
(1.89)
Perform
ance
funding�
gifts,grants,andcontracts
21.115*
21.3721
21.235**
21.195
(0.48)
(0.70)
(0.46)
(0.73)
Perform
ance
funding�
less
competitive
1.918
3.798
1.646
2.335
(2.56)
(2.98)
(2.51)
(3.02)
Perform
ance
funding�
competitive
7.332**
10.393**
5.3441
9.139**
(2.82)
(3.28)
(2.78)
(3.45)
Perform
ance
funding�
verycompetitive
4.274
3.034
1.538
5.447
(4.39)
(4.81)
(4.37)
(4.86)
Perform
ance
funding�
highly
competitive
25.417
28.895
28.905
20.061
(7.69)
(10.89)
(7.72)
(10.27)
Perform
ance
funding�
most
competitive
222.411
271.766*
220.922
275.237*
(27.99)
(32.13)
(25.72)
(33.36)
Perform
ance
funding�
percentreceivingfederal
aid
20.134*
20.096
20.128*
20.185*
(0.05)
(0.08)
(0.05)
(0.08)
Perform
ance
funding�
percentblack
0.172***
0.088
0.177***
0.092
(0.05)
(0.06)
(0.05)
(0.07)
Perform
ance
funding�
percenthispanic
0.226***
0.248**
0.293***
0.291***
(0.06)
(0.08)
(0.06)
(0.08)
Perform
ance
funding�
graduationrate
20.307***
——
20.2111
(0.08)
——
(0.12)
Perform
ance
funding�
retentionrate
—20.186
—0.046
—(0.16)
—(0.14)
Continued
14
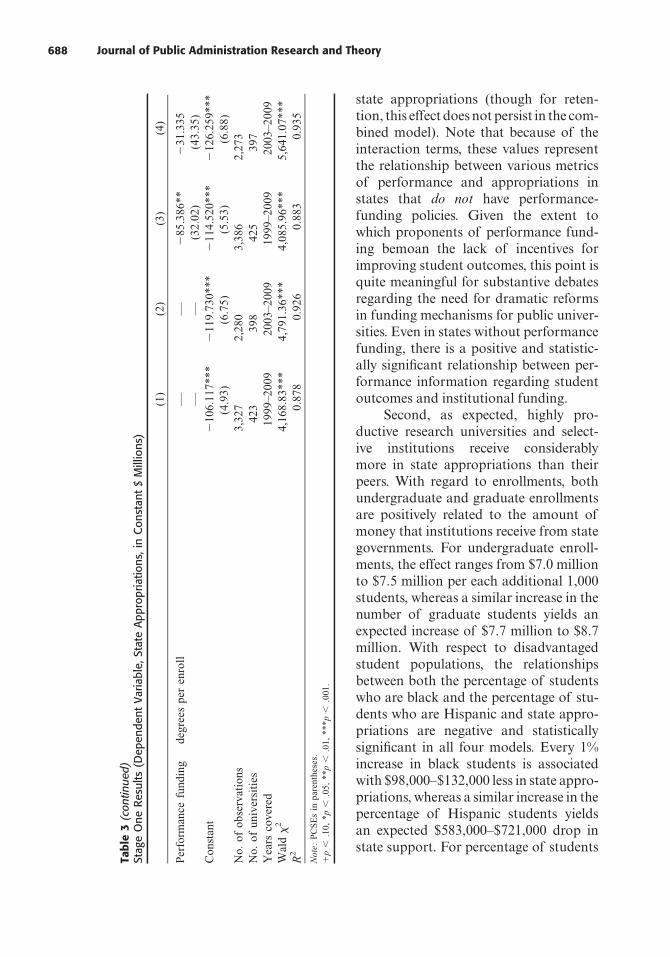
Journal of Public Administration Research and Theory 688
Table
3(continued)
StageOneResu
lts(D
ependentVariable,State
Appropriations,
inConstant$Millions)
(1)
(2)
(3)
(4)
Perform
ance
funding�
degrees
per
enroll
——
285.386**
231.335
——
(32.02)
(43.35)
Constant
2106.117***
2119.730***
2114.520***
2126.259***
(4.93)
(6.75)
(5.53)
(6.88)
No.ofobservations
3,327
2,280
3,386
2,273
No.ofuniversities
423
398
425
397
Years
covered
1999–2009
2003–2009
1999–2009
2003–2009
Waldx2
4,168.83***
4,791.36***
4,085.96***
5,641.07***
R2
0.878
0.926
0.883
0.935
Note:PCSEsin
parentheses.
1p,
.10,*p,
.05,**p,
.01,***p,
.001.
15
state appropriations (though for retention, this effect does not persist in the combined
model). Note that because of the interaction terms, these values represent the relationship
between various metrics of performance and appropriations in states that do not have
performance-funding policies. Given the extent to which proponents of performance funding
bemoan the lack of incentives for improving student outcomes, this point is quite meaningful
for substantive debates regarding the need for dramatic reforms in funding mechanisms
for public universities. Even in states without performance funding, there is a positive and
statistically significant relationship between performance information regarding student
outcomes and institutional funding.
Second, as expected, highly productive research universities and selective institutions
receive considerably more in state appropriations than their peers. With regard to enroll-
ments, both undergraduate and graduate enrollments are positively related to the amount of
money that institutions receive from state governments. For undergraduate enrollments, the
effect ranges from $7.0 million to $7.5 million per each additional 1,000 students, whereas
a similar increase in the number of graduate students yields an expected increase of $7.7
million to $8.7 million. With respect to disadvantaged student populations, the relation-
ships between both the percentage of students who are black and the percentage of students
who are Hispanic and state appropriations are negative and statistically significant in all
four models. Every 1% increase in black students is associated with $98,000–$132,000 less
in state appropriations, whereas a similar increase in the percentage of Hispanic students
yields an expected $583,000–$721,000 drop in state support. For percentage of students
Figure 3Exploring the Relationship between Performance and Funding by State
12 Journal of Public Administration Research and Theory
state appropriations (though for reten-tion, this effect does not persist in the com-bined model). Note that because of the interaction terms, these values represent the relationship between various metrics of performance and appropriations in states that do not have performance-funding policies. Given the extent to which proponents of performance fund-ing bemoan the lack of incentives for improving student outcomes, this point is quite meaningful for substantive debates regarding the need for dramatic reforms in funding mechanisms for public univer-sities. Even in states without performance funding, there is a positive and statistic-ally significant relationship between per-formance information regarding student outcomes and institutional funding.
Second, as expected, highly pro-ductive research universities and select-ive institutions receive considerably more in state appropriations than their peers. With regard to enrollments, both undergraduate and graduate enrollments are positively related to the amount of money that institutions receive from state governments. For undergraduate enroll-ments, the effect ranges from $7.0 million to $7.5 million per each additional 1,000 students, whereas a similar increase in the number of graduate students yields an expected increase of $7.7 million to $8.7 million. With respect to disadvantaged student populations, the relationships between both the percentage of students who are black and the percentage of stu-dents who are Hispanic and state appro-priations are negative and statistically significant in all four models. Every 1% increase in black students is associated with $98,000–$132,000 less in state appro-priations, whereas a similar increase in the percentage of Hispanic students yields an expected $583,000–$721,000 drop in state support. For percentage of students
receiving financial aid, however, the coefficient is positive and statistically significant in all
four models.
Turning now to the interaction terms, there are some conflicting results. The interac-
tion for performance undergraduate enrollment is positive and significant in all four
models, whereas the term for performance funding and graduate enrollment is negative
statistically significant in two of the models (models 1 and 3). As expected, this implies
that states with performance funding actually place greater emphasis on undergraduate
enrollments than nonperformance states when allocating resources to public universities.
Similarly, the interaction terms for percent black and percent Hispanic are also positive and
generally significant, which implies that performance-funding states are indeed providing
some rewards to institutions that increase student diversity.
With respect to other metrics of performance, however, my findings suggest that
performance-funding policies have generally been ineffective. First, note that the interac-
tion for performance funding and research revenues are negative and statistically significant
in three of the four models, indicating that many of the states with these policies are less
likely to reward highly productive research institutions than their peers. With regards to
performance funding and institutional selectivity, there is a positive interaction for schools
that are classified as competitive (the midpoint on Barron’s selectivity scale); the effect is
reversed with those that are most selective. Finally, the interaction terms for graduation
rates, retention, and degree production and performance funding are all either insignificant
or significant and negative, which suggests that, contrary to what proponents argue, states
with performance funding actually have a somewhat weaker link between student outcomes
and institutional funding.
The negative and statistically significant coefficients for the interactions between
performance funding and graduation rates bachelor’s degree production are particularly
surprising given the amount of attention that these policies have received from those
who favor outcome-based accountability. One possible explanation for this unexpected
result is that states adopt these policies when they perceive that public revenues are not
being utilized appropriately but that the policies themselves are ineffective in terms of dra-
matically changing the budget process.
Another possibility is that less formal mechanisms may be more powerful in shaping
state budgets. A closer examination of the relationship between state legislators, particu-
larly those who sit on committees responsible for allocating resources to higher education
and university campuses, may be a useful starting place to gain leverage on this topic. For
example, McLendon, Hearn, and Mokher (2009) find a positive link between appropria-
tions to research universities within a state and the number of alumni from these institutions
that are members of the state legislature. They argue that legislators tend to ‘‘privilege’’
institutions that they have close ties to, and it may be the case that performance-funding
policies are simply unable to overcome these political biases. Regardless of the reasons for
their ineffectiveness, it appears that performance-funding policies have not been successful
in transforming state budgets when it comes to higher education.
STAGE TWO—DO PERFORMANCE-FUNDING POLICIES INFLUENCE UNIVERSITYPRIORITIES?
In stage two, I move from considering the impacts of performance funding on state policy-
makers to understanding how they influence individual institutions. To do so, I rely on a set
16 Journal of Public Administration Research and Theory

Rabovsky Accountability in Higher Education 689
state appropriations (though for retention, this effect does not persist in the combined
model). Note that because of the interaction terms, these values represent the relationship
between various metrics of performance and appropriations in states that do not have
performance-funding policies. Given the extent to which proponents of performance funding
bemoan the lack of incentives for improving student outcomes, this point is quite meaningful
for substantive debates regarding the need for dramatic reforms in funding mechanisms
for public universities. Even in states without performance funding, there is a positive and
statistically significant relationship between performance information regarding student
outcomes and institutional funding.
Second, as expected, highly productive research universities and selective institutions
receive considerably more in state appropriations than their peers. With regard to enroll-
ments, both undergraduate and graduate enrollments are positively related to the amount of
money that institutions receive from state governments. For undergraduate enrollments, the
effect ranges from $7.0 million to $7.5 million per each additional 1,000 students, whereas
a similar increase in the number of graduate students yields an expected increase of $7.7
million to $8.7 million. With respect to disadvantaged student populations, the relation-
ships between both the percentage of students who are black and the percentage of students
who are Hispanic and state appropriations are negative and statistically significant in all
four models. Every 1% increase in black students is associated with $98,000–$132,000 less
in state appropriations, whereas a similar increase in the percentage of Hispanic students
yields an expected $583,000–$721,000 drop in state support. For percentage of students
Figure 3Exploring the Relationship between Performance and Funding by State
12 Journal of Public Administration Research and Theory
receiving financial aid, however, the coefficient is positive and statistically significant in all
four models.
Turning now to the interaction terms, there are some conflicting results. The interac-
tion for performance undergraduate enrollment is positive and significant in all four
models, whereas the term for performance funding and graduate enrollment is negative
statistically significant in two of the models (models 1 and 3). As expected, this implies
that states with performance funding actually place greater emphasis on undergraduate
enrollments than nonperformance states when allocating resources to public universities.
Similarly, the interaction terms for percent black and percent Hispanic are also positive and
generally significant, which implies that performance-funding states are indeed providing
some rewards to institutions that increase student diversity.
With respect to other metrics of performance, however, my findings suggest that
performance-funding policies have generally been ineffective. First, note that the interac-
tion for performance funding and research revenues are negative and statistically significant
in three of the four models, indicating that many of the states with these policies are less
likely to reward highly productive research institutions than their peers. With regards to
performance funding and institutional selectivity, there is a positive interaction for schools
that are classified as competitive (the midpoint on Barron’s selectivity scale); the effect is
reversed with those that are most selective. Finally, the interaction terms for graduation
rates, retention, and degree production and performance funding are all either insignificant
or significant and negative, which suggests that, contrary to what proponents argue, states
with performance funding actually have a somewhat weaker link between student outcomes
and institutional funding.
The negative and statistically significant coefficients for the interactions between
performance funding and graduation rates bachelor’s degree production are particularly
surprising given the amount of attention that these policies have received from those
who favor outcome-based accountability. One possible explanation for this unexpected
result is that states adopt these policies when they perceive that public revenues are not
being utilized appropriately but that the policies themselves are ineffective in terms of dra-
matically changing the budget process.
Another possibility is that less formal mechanisms may be more powerful in shaping
state budgets. A closer examination of the relationship between state legislators, particu-
larly those who sit on committees responsible for allocating resources to higher education
and university campuses, may be a useful starting place to gain leverage on this topic. For
example, McLendon, Hearn, and Mokher (2009) find a positive link between appropria-
tions to research universities within a state and the number of alumni from these institutions
that are members of the state legislature. They argue that legislators tend to ‘‘privilege’’
institutions that they have close ties to, and it may be the case that performance-funding
policies are simply unable to overcome these political biases. Regardless of the reasons for
their ineffectiveness, it appears that performance-funding policies have not been successful
in transforming state budgets when it comes to higher education.
STAGE TWO—DO PERFORMANCE-FUNDING POLICIES INFLUENCE UNIVERSITYPRIORITIES?
In stage two, I move from considering the impacts of performance funding on state policy-
makers to understanding how they influence individual institutions. To do so, I rely on a set
16 Journal of Public Administration Research and Theory
Journal of Public Administration Research and Theory 690
receiving financial aid, however, the coefficient is positive and statistically significant in all
four models.
Turning now to the interaction terms, there are some conflicting results. The interac-
tion for performance undergraduate enrollment is positive and significant in all four
models, whereas the term for performance funding and graduate enrollment is negative
statistically significant in two of the models (models 1 and 3). As expected, this implies
that states with performance funding actually place greater emphasis on undergraduate
enrollments than nonperformance states when allocating resources to public universities.
Similarly, the interaction terms for percent black and percent Hispanic are also positive and
generally significant, which implies that performance-funding states are indeed providing
some rewards to institutions that increase student diversity.
With respect to other metrics of performance, however, my findings suggest that
performance-funding policies have generally been ineffective. First, note that the interac-
tion for performance funding and research revenues are negative and statistically significant
in three of the four models, indicating that many of the states with these policies are less
likely to reward highly productive research institutions than their peers. With regards to
performance funding and institutional selectivity, there is a positive interaction for schools
that are classified as competitive (the midpoint on Barron’s selectivity scale); the effect is
reversed with those that are most selective. Finally, the interaction terms for graduation
rates, retention, and degree production and performance funding are all either insignificant
or significant and negative, which suggests that, contrary to what proponents argue, states
with performance funding actually have a somewhat weaker link between student outcomes
and institutional funding.
The negative and statistically significant coefficients for the interactions between
performance funding and graduation rates bachelor’s degree production are particularly
surprising given the amount of attention that these policies have received from those
who favor outcome-based accountability. One possible explanation for this unexpected
result is that states adopt these policies when they perceive that public revenues are not
being utilized appropriately but that the policies themselves are ineffective in terms of dra-
matically changing the budget process.
Another possibility is that less formal mechanisms may be more powerful in shaping
state budgets. A closer examination of the relationship between state legislators, particu-
larly those who sit on committees responsible for allocating resources to higher education
and university campuses, may be a useful starting place to gain leverage on this topic. For
example, McLendon, Hearn, and Mokher (2009) find a positive link between appropria-
tions to research universities within a state and the number of alumni from these institutions
that are members of the state legislature. They argue that legislators tend to ‘‘privilege’’
institutions that they have close ties to, and it may be the case that performance-funding
policies are simply unable to overcome these political biases. Regardless of the reasons for
their ineffectiveness, it appears that performance-funding policies have not been successful
in transforming state budgets when it comes to higher education.
STAGE TWO—DO PERFORMANCE-FUNDING POLICIES INFLUENCE UNIVERSITYPRIORITIES?
In stage two, I move from considering the impacts of performance funding on state policy-
makers to understanding how they influence individual institutions. To do so, I rely on a set
16 Journal of Public Administration Research and Theory
of measures that indicate the percentage of education-related expenditures2 that are allo-
cated to research and instruction. As previously discussed, some observers have argued that
research and undergraduate instruction are competing tasks, and many worry that height-
ened emphasis on research will have negative impacts for student outcomes. Given the fact
that student outcomes (graduation rates in particular) play a central role in virtually every
performance-funding scheme, one might expect that universities located in performance-
funding states will spend less on research and more on instruction than they otherwise
would. On the other hand, despite much of the strong rhetoric that has often pitted research
against instruction, some performance-funding states actually adopted policies that encour-
age research productivity in addition to undergraduate education (though the findings
from stage one indicate that they have not effectively done so). This would suggest that
performance-funding policies might lead institutions to shift more resources to research.
Finally, given the multitude of other factors that influence institutional budgets, it may be
the case that performance-funding policies have little to no effect on institutional spending
in either direction. Descriptive statistics for stage two are listed in table 4.
I use several independent variables to predict the amount of money that institutions
spend on research and instruction. First, I includemeasures for both total enrollment and the
percentage of students who are enrolled as undergraduates. Because graduate education is
often geared toward the production of research, with many students working as research
assistants, while undergraduate education is primarily focused on teaching and instruction,
I expect that universities with a larger percentage of undergraduate students will expend
more money on instruction and less on research.
I also include a set of measures for institutional selectivity (the same Barron’s selec-
tivity measure that was employed in stage one) and mission (as measured by Carnegie
Table 4Summary Statistics (Stage Two)
Mean Standard Deviation Minimum Maximum
% Expenditures on research 7.44 10.34 0 74.48
% Expenditures on instruction 45.11 8.09 1.55 93.87
Noncompetitive (Barron’s) 0.11 0.31 0 1
Less competitive (Barron’s) 0.21 0.40 0 1
Competitive (Barron’s) 0.46 0.50 0 1
Very competitive (Barron’s) 0.15 0.35 0 1
Highly competitive (Barron’s) 0.05 0.21 0 1
Most competitive (Barron’s) 0.01 0.09 0 1
Bachelor’s (Carnegie) 0.23 0.42 0 1
Master’s (Carnegie) 0.47 0.50 0 1
Research (Carnegie) 0.30 0.46 0 1
Total enrollment (1,000s) 11 9.80 0.18 68.06
% Undergraduate 85.19 11.27 0.07 100
% Students receiving federal aid 33.94 16.33 0 100
% Students who are part time 24 15.72 0.13 96.80
% Full-time faculty 65.45 18.24 0.66 100
Performance funding 0.15 0.36 0 1
2 Total education-related expenditures include money allocated to the following activities: instruction, research,
academic support, student services, public service, institutional support, and expenditures for scholarships and grants.
Rabovsky Accountability in Higher Education 17
classification), with the expectation that more selective institutions and those that are clas-
sified as research universities will spend a larger percentage of their resources on research
activities, whereas teaching institutions (those classified as either Bachelor’s degree grant-
ing or Master’s degree granting) will spend more on instruction. Furthermore, I include
measures for the percentage of students who are part time and the percentage who receive
federal aid. Because these students are generally the most vulnerable, in terms of their risk
to drop out of school before they complete a degree, I expect that these variables will be
positively related to institutional expenditures on instruction. Finally, in addition to student
demographics, I also include a measure for the percentage of faculty who are full-time
employees with 9/10-month equated contracts, with the expectation that a higher percent-
age of faculty members who are full time will be positively related to research and neg-
atively related to instruction (figure 4).
As was the case with stage one, I use PCSEs with panel-specific AR1 terms to correct
for autocorrelation within panels and heteroskedasticity between panels. My stage two
models can be written as:
Yit5a1ßSelectivityit1ßMissionit1ßEnrollmentit1ßPercUndergradit1ßPercAidit1ßPercPartTStudentsit1ßPercFullTFacit1ßPFundingit1eit;
where Yit is the percentage of expenditures on instruction or research for an institution at
time t, a is the constant term, Selectivityit is a set of variables to reflect institutional
Figure 4Correlation Matrix for Stage Two
18 Journal of Public Administration Research and Theory
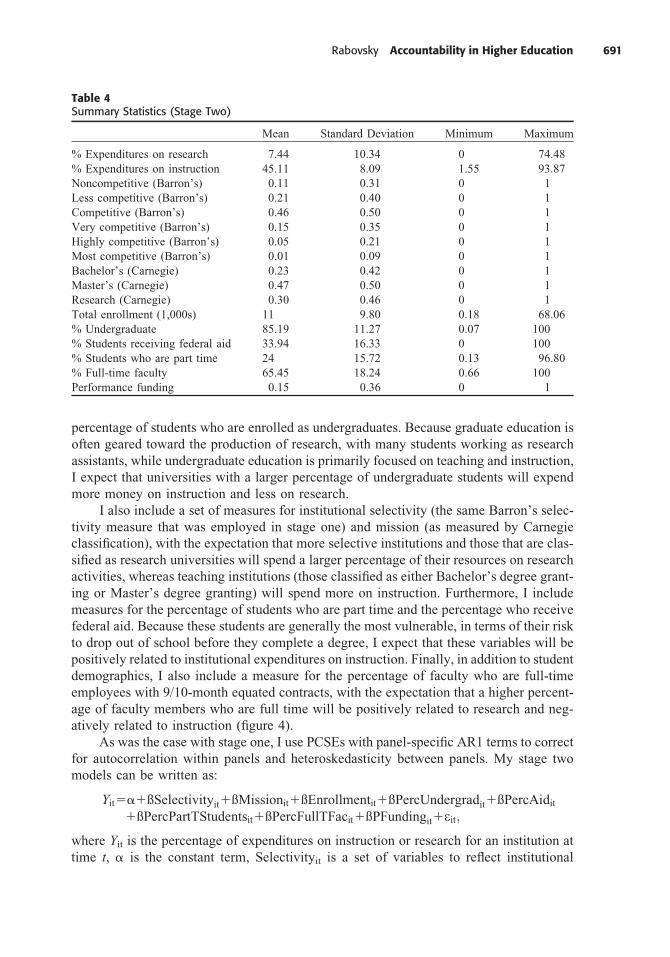
Rabovsky Accountability in Higher Education 691
receiving financial aid, however, the coefficient is positive and statistically significant in all
four models.
Turning now to the interaction terms, there are some conflicting results. The interac-
tion for performance undergraduate enrollment is positive and significant in all four
models, whereas the term for performance funding and graduate enrollment is negative
statistically significant in two of the models (models 1 and 3). As expected, this implies
that states with performance funding actually place greater emphasis on undergraduate
enrollments than nonperformance states when allocating resources to public universities.
Similarly, the interaction terms for percent black and percent Hispanic are also positive and
generally significant, which implies that performance-funding states are indeed providing
some rewards to institutions that increase student diversity.
With respect to other metrics of performance, however, my findings suggest that
performance-funding policies have generally been ineffective. First, note that the interac-
tion for performance funding and research revenues are negative and statistically significant
in three of the four models, indicating that many of the states with these policies are less
likely to reward highly productive research institutions than their peers. With regards to
performance funding and institutional selectivity, there is a positive interaction for schools
that are classified as competitive (the midpoint on Barron’s selectivity scale); the effect is
reversed with those that are most selective. Finally, the interaction terms for graduation
rates, retention, and degree production and performance funding are all either insignificant
or significant and negative, which suggests that, contrary to what proponents argue, states
with performance funding actually have a somewhat weaker link between student outcomes
and institutional funding.
The negative and statistically significant coefficients for the interactions between
performance funding and graduation rates bachelor’s degree production are particularly
surprising given the amount of attention that these policies have received from those
who favor outcome-based accountability. One possible explanation for this unexpected
result is that states adopt these policies when they perceive that public revenues are not
being utilized appropriately but that the policies themselves are ineffective in terms of dra-
matically changing the budget process.
Another possibility is that less formal mechanisms may be more powerful in shaping
state budgets. A closer examination of the relationship between state legislators, particu-
larly those who sit on committees responsible for allocating resources to higher education
and university campuses, may be a useful starting place to gain leverage on this topic. For
example, McLendon, Hearn, and Mokher (2009) find a positive link between appropria-
tions to research universities within a state and the number of alumni from these institutions
that are members of the state legislature. They argue that legislators tend to ‘‘privilege’’
institutions that they have close ties to, and it may be the case that performance-funding
policies are simply unable to overcome these political biases. Regardless of the reasons for
their ineffectiveness, it appears that performance-funding policies have not been successful
in transforming state budgets when it comes to higher education.
STAGE TWO—DO PERFORMANCE-FUNDING POLICIES INFLUENCE UNIVERSITYPRIORITIES?
In stage two, I move from considering the impacts of performance funding on state policy-
makers to understanding how they influence individual institutions. To do so, I rely on a set
16 Journal of Public Administration Research and Theory
of measures that indicate the percentage of education-related expenditures2 that are allo-
cated to research and instruction. As previously discussed, some observers have argued that
research and undergraduate instruction are competing tasks, and many worry that height-
ened emphasis on research will have negative impacts for student outcomes. Given the fact
that student outcomes (graduation rates in particular) play a central role in virtually every
performance-funding scheme, one might expect that universities located in performance-
funding states will spend less on research and more on instruction than they otherwise
would. On the other hand, despite much of the strong rhetoric that has often pitted research
against instruction, some performance-funding states actually adopted policies that encour-
age research productivity in addition to undergraduate education (though the findings
from stage one indicate that they have not effectively done so). This would suggest that
performance-funding policies might lead institutions to shift more resources to research.
Finally, given the multitude of other factors that influence institutional budgets, it may be
the case that performance-funding policies have little to no effect on institutional spending
in either direction. Descriptive statistics for stage two are listed in table 4.
I use several independent variables to predict the amount of money that institutions
spend on research and instruction. First, I includemeasures for both total enrollment and the
percentage of students who are enrolled as undergraduates. Because graduate education is
often geared toward the production of research, with many students working as research
assistants, while undergraduate education is primarily focused on teaching and instruction,
I expect that universities with a larger percentage of undergraduate students will expend
more money on instruction and less on research.
I also include a set of measures for institutional selectivity (the same Barron’s selec-
tivity measure that was employed in stage one) and mission (as measured by Carnegie
Table 4Summary Statistics (Stage Two)
Mean Standard Deviation Minimum Maximum
% Expenditures on research 7.44 10.34 0 74.48
% Expenditures on instruction 45.11 8.09 1.55 93.87
Noncompetitive (Barron’s) 0.11 0.31 0 1
Less competitive (Barron’s) 0.21 0.40 0 1
Competitive (Barron’s) 0.46 0.50 0 1
Very competitive (Barron’s) 0.15 0.35 0 1
Highly competitive (Barron’s) 0.05 0.21 0 1
Most competitive (Barron’s) 0.01 0.09 0 1
Bachelor’s (Carnegie) 0.23 0.42 0 1
Master’s (Carnegie) 0.47 0.50 0 1
Research (Carnegie) 0.30 0.46 0 1
Total enrollment (1,000s) 11 9.80 0.18 68.06
% Undergraduate 85.19 11.27 0.07 100
% Students receiving federal aid 33.94 16.33 0 100
% Students who are part time 24 15.72 0.13 96.80
% Full-time faculty 65.45 18.24 0.66 100
Performance funding 0.15 0.36 0 1
2 Total education-related expenditures include money allocated to the following activities: instruction, research,
academic support, student services, public service, institutional support, and expenditures for scholarships and grants.
Rabovsky Accountability in Higher Education 17
of measures that indicate the percentage of education-related expenditures2 that are allo-
cated to research and instruction. As previously discussed, some observers have argued that
research and undergraduate instruction are competing tasks, and many worry that height-
ened emphasis on research will have negative impacts for student outcomes. Given the fact
that student outcomes (graduation rates in particular) play a central role in virtually every
performance-funding scheme, one might expect that universities located in performance-
funding states will spend less on research and more on instruction than they otherwise
would. On the other hand, despite much of the strong rhetoric that has often pitted research
against instruction, some performance-funding states actually adopted policies that encour-
age research productivity in addition to undergraduate education (though the findings
from stage one indicate that they have not effectively done so). This would suggest that
performance-funding policies might lead institutions to shift more resources to research.
Finally, given the multitude of other factors that influence institutional budgets, it may be
the case that performance-funding policies have little to no effect on institutional spending
in either direction. Descriptive statistics for stage two are listed in table 4.
I use several independent variables to predict the amount of money that institutions
spend on research and instruction. First, I includemeasures for both total enrollment and the
percentage of students who are enrolled as undergraduates. Because graduate education is
often geared toward the production of research, with many students working as research
assistants, while undergraduate education is primarily focused on teaching and instruction,
I expect that universities with a larger percentage of undergraduate students will expend
more money on instruction and less on research.
I also include a set of measures for institutional selectivity (the same Barron’s selec-
tivity measure that was employed in stage one) and mission (as measured by Carnegie
Table 4Summary Statistics (Stage Two)
Mean Standard Deviation Minimum Maximum
% Expenditures on research 7.44 10.34 0 74.48
% Expenditures on instruction 45.11 8.09 1.55 93.87
Noncompetitive (Barron’s) 0.11 0.31 0 1
Less competitive (Barron’s) 0.21 0.40 0 1
Competitive (Barron’s) 0.46 0.50 0 1
Very competitive (Barron’s) 0.15 0.35 0 1
Highly competitive (Barron’s) 0.05 0.21 0 1
Most competitive (Barron’s) 0.01 0.09 0 1
Bachelor’s (Carnegie) 0.23 0.42 0 1
Master’s (Carnegie) 0.47 0.50 0 1
Research (Carnegie) 0.30 0.46 0 1
Total enrollment (1,000s) 11 9.80 0.18 68.06
% Undergraduate 85.19 11.27 0.07 100
% Students receiving federal aid 33.94 16.33 0 100
% Students who are part time 24 15.72 0.13 96.80
% Full-time faculty 65.45 18.24 0.66 100
Performance funding 0.15 0.36 0 1
2 Total education-related expenditures include money allocated to the following activities: instruction, research,
academic support, student services, public service, institutional support, and expenditures for scholarships and grants.
Rabovsky Accountability in Higher Education 17
of measures that indicate the percentage of education-related expenditures2 that are allo-
cated to research and instruction. As previously discussed, some observers have argued that
research and undergraduate instruction are competing tasks, and many worry that height-
ened emphasis on research will have negative impacts for student outcomes. Given the fact
that student outcomes (graduation rates in particular) play a central role in virtually every
performance-funding scheme, one might expect that universities located in performance-
funding states will spend less on research and more on instruction than they otherwise
would. On the other hand, despite much of the strong rhetoric that has often pitted research
against instruction, some performance-funding states actually adopted policies that encour-
age research productivity in addition to undergraduate education (though the findings
from stage one indicate that they have not effectively done so). This would suggest that
performance-funding policies might lead institutions to shift more resources to research.
Finally, given the multitude of other factors that influence institutional budgets, it may be
the case that performance-funding policies have little to no effect on institutional spending
in either direction. Descriptive statistics for stage two are listed in table 4.
I use several independent variables to predict the amount of money that institutions
spend on research and instruction. First, I includemeasures for both total enrollment and the
percentage of students who are enrolled as undergraduates. Because graduate education is
often geared toward the production of research, with many students working as research
assistants, while undergraduate education is primarily focused on teaching and instruction,
I expect that universities with a larger percentage of undergraduate students will expend
more money on instruction and less on research.
I also include a set of measures for institutional selectivity (the same Barron’s selec-
tivity measure that was employed in stage one) and mission (as measured by Carnegie
Table 4Summary Statistics (Stage Two)
Mean Standard Deviation Minimum Maximum
% Expenditures on research 7.44 10.34 0 74.48
% Expenditures on instruction 45.11 8.09 1.55 93.87
Noncompetitive (Barron’s) 0.11 0.31 0 1
Less competitive (Barron’s) 0.21 0.40 0 1
Competitive (Barron’s) 0.46 0.50 0 1
Very competitive (Barron’s) 0.15 0.35 0 1
Highly competitive (Barron’s) 0.05 0.21 0 1
Most competitive (Barron’s) 0.01 0.09 0 1
Bachelor’s (Carnegie) 0.23 0.42 0 1
Master’s (Carnegie) 0.47 0.50 0 1
Research (Carnegie) 0.30 0.46 0 1
Total enrollment (1,000s) 11 9.80 0.18 68.06
% Undergraduate 85.19 11.27 0.07 100
% Students receiving federal aid 33.94 16.33 0 100
% Students who are part time 24 15.72 0.13 96.80
% Full-time faculty 65.45 18.24 0.66 100
Performance funding 0.15 0.36 0 1
2 Total education-related expenditures include money allocated to the following activities: instruction, research,
academic support, student services, public service, institutional support, and expenditures for scholarships and grants.
Rabovsky Accountability in Higher Education 17
of measures that indicate the percentage of education-related expenditures2 that are allo-
cated to research and instruction. As previously discussed, some observers have argued that
research and undergraduate instruction are competing tasks, and many worry that height-
ened emphasis on research will have negative impacts for student outcomes. Given the fact
that student outcomes (graduation rates in particular) play a central role in virtually every
performance-funding scheme, one might expect that universities located in performance-
funding states will spend less on research and more on instruction than they otherwise
would. On the other hand, despite much of the strong rhetoric that has often pitted research
against instruction, some performance-funding states actually adopted policies that encour-
age research productivity in addition to undergraduate education (though the findings
from stage one indicate that they have not effectively done so). This would suggest that
performance-funding policies might lead institutions to shift more resources to research.
Finally, given the multitude of other factors that influence institutional budgets, it may be
the case that performance-funding policies have little to no effect on institutional spending
in either direction. Descriptive statistics for stage two are listed in table 4.
I use several independent variables to predict the amount of money that institutions
spend on research and instruction. First, I includemeasures for both total enrollment and the
percentage of students who are enrolled as undergraduates. Because graduate education is
often geared toward the production of research, with many students working as research
assistants, while undergraduate education is primarily focused on teaching and instruction,
I expect that universities with a larger percentage of undergraduate students will expend
more money on instruction and less on research.
I also include a set of measures for institutional selectivity (the same Barron’s selec-
tivity measure that was employed in stage one) and mission (as measured by Carnegie
Table 4Summary Statistics (Stage Two)
Mean Standard Deviation Minimum Maximum
% Expenditures on research 7.44 10.34 0 74.48
% Expenditures on instruction 45.11 8.09 1.55 93.87
Noncompetitive (Barron’s) 0.11 0.31 0 1
Less competitive (Barron’s) 0.21 0.40 0 1
Competitive (Barron’s) 0.46 0.50 0 1
Very competitive (Barron’s) 0.15 0.35 0 1
Highly competitive (Barron’s) 0.05 0.21 0 1
Most competitive (Barron’s) 0.01 0.09 0 1
Bachelor’s (Carnegie) 0.23 0.42 0 1
Master’s (Carnegie) 0.47 0.50 0 1
Research (Carnegie) 0.30 0.46 0 1
Total enrollment (1,000s) 11 9.80 0.18 68.06
% Undergraduate 85.19 11.27 0.07 100
% Students receiving federal aid 33.94 16.33 0 100
% Students who are part time 24 15.72 0.13 96.80
% Full-time faculty 65.45 18.24 0.66 100
Performance funding 0.15 0.36 0 1
2 Total education-related expenditures include money allocated to the following activities: instruction, research,
academic support, student services, public service, institutional support, and expenditures for scholarships and grants.
Rabovsky Accountability in Higher Education 17
classification), with the expectation that more selective institutions and those that are clas-
sified as research universities will spend a larger percentage of their resources on research
activities, whereas teaching institutions (those classified as either Bachelor’s degree grant-
ing or Master’s degree granting) will spend more on instruction. Furthermore, I include
measures for the percentage of students who are part time and the percentage who receive
federal aid. Because these students are generally the most vulnerable, in terms of their risk
to drop out of school before they complete a degree, I expect that these variables will be
positively related to institutional expenditures on instruction. Finally, in addition to student
demographics, I also include a measure for the percentage of faculty who are full-time
employees with 9/10-month equated contracts, with the expectation that a higher percent-
age of faculty members who are full time will be positively related to research and neg-
atively related to instruction (figure 4).
As was the case with stage one, I use PCSEs with panel-specific AR1 terms to correct
for autocorrelation within panels and heteroskedasticity between panels. My stage two
models can be written as:
Yit5a1ßSelectivityit1ßMissionit1ßEnrollmentit1ßPercUndergradit1ßPercAidit1ßPercPartTStudentsit1ßPercFullTFacit1ßPFundingit1eit;
where Yit is the percentage of expenditures on instruction or research for an institution at
time t, a is the constant term, Selectivityit is a set of variables to reflect institutional
Figure 4Correlation Matrix for Stage Two
18 Journal of Public Administration Research and Theory
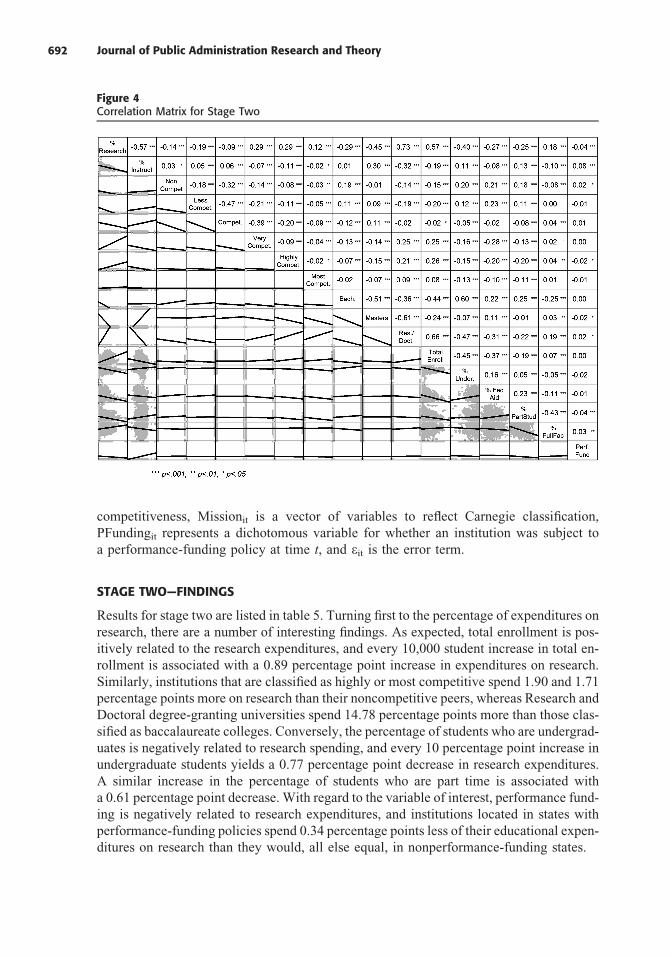
Journal of Public Administration Research and Theory 692
classification), with the expectation that more selective institutions and those that are clas-
sified as research universities will spend a larger percentage of their resources on research
activities, whereas teaching institutions (those classified as either Bachelor’s degree grant-
ing or Master’s degree granting) will spend more on instruction. Furthermore, I include
measures for the percentage of students who are part time and the percentage who receive
federal aid. Because these students are generally the most vulnerable, in terms of their risk
to drop out of school before they complete a degree, I expect that these variables will be
positively related to institutional expenditures on instruction. Finally, in addition to student
demographics, I also include a measure for the percentage of faculty who are full-time
employees with 9/10-month equated contracts, with the expectation that a higher percent-
age of faculty members who are full time will be positively related to research and neg-
atively related to instruction (figure 4).
As was the case with stage one, I use PCSEs with panel-specific AR1 terms to correct
for autocorrelation within panels and heteroskedasticity between panels. My stage two
models can be written as:
Yit5a1ßSelectivityit1ßMissionit1ßEnrollmentit1ßPercUndergradit1ßPercAidit1ßPercPartTStudentsit1ßPercFullTFacit1ßPFundingit1eit;
where Yit is the percentage of expenditures on instruction or research for an institution at
time t, a is the constant term, Selectivityit is a set of variables to reflect institutional
Figure 4Correlation Matrix for Stage Two
18 Journal of Public Administration Research and Theory
competitiveness, Missionit is a vector of variables to reflect Carnegie classification,
PFundingit represents a dichotomous variable for whether an institution was subject to
a performance-funding policy at time t, and eit is the error term.
STAGE TWO—FINDINGS
Results for stage two are listed in table 5. Turning first to the percentage of expenditures on
research, there are a number of interesting findings. As expected, total enrollment is pos-
itively related to the research expenditures, and every 10,000 student increase in total en-
rollment is associated with a 0.89 percentage point increase in expenditures on research.
Similarly, institutions that are classified as highly or most competitive spend 1.90 and 1.71
percentage points more on research than their noncompetitive peers, whereas Research and
Doctoral degree-granting universities spend 14.78 percentage points more than those clas-
sified as baccalaureate colleges. Conversely, the percentage of students who are undergrad-
uates is negatively related to research spending, and every 10 percentage point increase in
undergraduate students yields a 0.77 percentage point decrease in research expenditures.
A similar increase in the percentage of students who are part time is associated with
a 0.61 percentage point decrease. With regard to the variable of interest, performance fund-
ing is negatively related to research expenditures, and institutions located in states with
performance-funding policies spend 0.34 percentage points less of their educational expen-
ditures on research than they would, all else equal, in nonperformance-funding states.
In terms of instructional expenditures, similar patterns emerge. Somewhat surpris-
ingly, competitive and very competitive institutions spend more on instruction than do
those on either end of the selectivity scale. Research and Doctoral degree-granting univer-
sities spend 4.13 percentage points less on instruction than do other schools, whereas insti-
tutions classified as Master’s degree granting spend 2.18 percentage points more on
instruction than do Bachelor’s degree only granting schools. Similarly, as the percentage
of faculty who are full time and the percentage of students who receive federal financial aid
increase, expenditures on instruction decrease. Finally, performance funding is positively
related to the proportion of expenditures that are allocated to instruction, with institutions in
performance-funding states spending about 0.89 percentage points more on instruction than
those in nonperformance states, all else equal.
Although performance-funding policies appear to work in the desired direction for
both expenditures and instruction, the effects are minimal. In both instances, the differences
between institutions with performance funding versus those without are less than 1 per-
centage point. Given the previously discussed findings that indicate little effect of account-
ability policies on state budgets (and thus institutional incentives), it is perhaps unsurprising
that we observe such minimal effects when examining institutional priorities. As state gov-
ernments are increasingly incapable of subsidizing higher education in the same capacity as
has traditionally been the case (Mumper 2003; Weerts and Ronca 2006), public universities
have come to rely more and more on private sources of revenue (including competition for
research funding). Nevertheless, given that current performance-funding efforts have
largely been ineffective at reshaping state budgets, the fact that these policies have had
even minimal impacts on institutional spending is a notable and somewhat surprising find-
ing. These results leave open the potential for these policies to have considerable effects on
administrative behavior if policymakers could more effectively tie larger incentives to
institutional performance.
Rabovsky Accountability in Higher Education 19
One important question that remains about the influence of performance-funding
policies on institutional behavior is whether or not there are differential impacts. Given
that large research universities are often times considerably more visible than nonresearch
universities, one might speculate that performance-funding policies would have a greater
impact on their priorities. On the other hand, these institutions have greater access to out-
side revenues and are often times portrayed as less reliant on state funding than other insti-
tutions in their state (Ehrenberg 2006). Thus, performance-funding policies on spending
priorities could also conceivably be less influential for research universities than other
institutions.
In order to test whether the influence of performance funding was different based on
institutional mission, I reran the analysis from stage two separately for research institutions
Table 5Stage Two Results
% Expenditure on Research % Expenditure on Instruction
Less competitive (Barron’s) 20.178 0.429
(0.17) (0.29)
Competitive (Barron’s) 20.158 0.688*
(0.17) (0.27)
Very competitive (Barron’s) 0.283 1.040**
(0.25) (0.33)
Highly competitive (Barron’s) 1.904*** 0.364
(0.40) (0.58)
Most competitive (Barron’s) 1.710** 0.097
(0.61) (0.73)
Master’s (Carnegie) 21.426*** 2.183***
(0.36) (0.47)
Research (Carnegie) 14.779*** 24.134***
(0.62) (0.80)
Total enrollment (1,000s) 0.089*** 20.028
(0.02) (0.03)
% Undergraduate 20.077*** 20.011
(0.01) (0.02)
% Students receiving federal aid 0.003 20.041***
(0.00) (0.01)
% Students who are part time 20.061*** 0.007
(0.01) (0.01)
% Full-time faculty 20.006 20.0121
(0.00) (0.01)
Performance funding 20.342** 0.890***
(0.12) (0.21)
Constant 11.062*** 47.393***
(1.47) (2.07)
No. of observations 5,490 5,490
No. of universities 490 490
Years covered 1998–2009 1998–2009
Wald x2 6,673.57*** 688.64***
R2 0.786 0.943
Note: PCSEs in parentheses.
1p , .10, *p , .05, **p , .01, ***p , .001.
20 Journal of Public Administration Research and Theory

Rabovsky Accountability in Higher Education 693
classification), with the expectation that more selective institutions and those that are clas-
sified as research universities will spend a larger percentage of their resources on research
activities, whereas teaching institutions (those classified as either Bachelor’s degree grant-
ing or Master’s degree granting) will spend more on instruction. Furthermore, I include
measures for the percentage of students who are part time and the percentage who receive
federal aid. Because these students are generally the most vulnerable, in terms of their risk
to drop out of school before they complete a degree, I expect that these variables will be
positively related to institutional expenditures on instruction. Finally, in addition to student
demographics, I also include a measure for the percentage of faculty who are full-time
employees with 9/10-month equated contracts, with the expectation that a higher percent-
age of faculty members who are full time will be positively related to research and neg-
atively related to instruction (figure 4).
As was the case with stage one, I use PCSEs with panel-specific AR1 terms to correct
for autocorrelation within panels and heteroskedasticity between panels. My stage two
models can be written as:
Yit5a1ßSelectivityit1ßMissionit1ßEnrollmentit1ßPercUndergradit1ßPercAidit1ßPercPartTStudentsit1ßPercFullTFacit1ßPFundingit1eit;
where Yit is the percentage of expenditures on instruction or research for an institution at
time t, a is the constant term, Selectivityit is a set of variables to reflect institutional
Figure 4Correlation Matrix for Stage Two
18 Journal of Public Administration Research and Theory
competitiveness, Missionit is a vector of variables to reflect Carnegie classification,
PFundingit represents a dichotomous variable for whether an institution was subject to
a performance-funding policy at time t, and eit is the error term.
STAGE TWO—FINDINGS
Results for stage two are listed in table 5. Turning first to the percentage of expenditures on
research, there are a number of interesting findings. As expected, total enrollment is pos-
itively related to the research expenditures, and every 10,000 student increase in total en-
rollment is associated with a 0.89 percentage point increase in expenditures on research.
Similarly, institutions that are classified as highly or most competitive spend 1.90 and 1.71
percentage points more on research than their noncompetitive peers, whereas Research and
Doctoral degree-granting universities spend 14.78 percentage points more than those clas-
sified as baccalaureate colleges. Conversely, the percentage of students who are undergrad-
uates is negatively related to research spending, and every 10 percentage point increase in
undergraduate students yields a 0.77 percentage point decrease in research expenditures.
A similar increase in the percentage of students who are part time is associated with
a 0.61 percentage point decrease. With regard to the variable of interest, performance fund-
ing is negatively related to research expenditures, and institutions located in states with
performance-funding policies spend 0.34 percentage points less of their educational expen-
ditures on research than they would, all else equal, in nonperformance-funding states.
In terms of instructional expenditures, similar patterns emerge. Somewhat surpris-
ingly, competitive and very competitive institutions spend more on instruction than do
those on either end of the selectivity scale. Research and Doctoral degree-granting univer-
sities spend 4.13 percentage points less on instruction than do other schools, whereas insti-
tutions classified as Master’s degree granting spend 2.18 percentage points more on
instruction than do Bachelor’s degree only granting schools. Similarly, as the percentage
of faculty who are full time and the percentage of students who receive federal financial aid
increase, expenditures on instruction decrease. Finally, performance funding is positively
related to the proportion of expenditures that are allocated to instruction, with institutions in
performance-funding states spending about 0.89 percentage points more on instruction than
those in nonperformance states, all else equal.
Although performance-funding policies appear to work in the desired direction for
both expenditures and instruction, the effects are minimal. In both instances, the differences
between institutions with performance funding versus those without are less than 1 per-
centage point. Given the previously discussed findings that indicate little effect of account-
ability policies on state budgets (and thus institutional incentives), it is perhaps unsurprising
that we observe such minimal effects when examining institutional priorities. As state gov-
ernments are increasingly incapable of subsidizing higher education in the same capacity as
has traditionally been the case (Mumper 2003; Weerts and Ronca 2006), public universities
have come to rely more and more on private sources of revenue (including competition for
research funding). Nevertheless, given that current performance-funding efforts have
largely been ineffective at reshaping state budgets, the fact that these policies have had
even minimal impacts on institutional spending is a notable and somewhat surprising find-
ing. These results leave open the potential for these policies to have considerable effects on
administrative behavior if policymakers could more effectively tie larger incentives to
institutional performance.
Rabovsky Accountability in Higher Education 19
competitiveness, Missionit is a vector of variables to reflect Carnegie classification,
PFundingit represents a dichotomous variable for whether an institution was subject to
a performance-funding policy at time t, and eit is the error term.
STAGE TWO—FINDINGS
Results for stage two are listed in table 5. Turning first to the percentage of expenditures on
research, there are a number of interesting findings. As expected, total enrollment is pos-
itively related to the research expenditures, and every 10,000 student increase in total en-
rollment is associated with a 0.89 percentage point increase in expenditures on research.
Similarly, institutions that are classified as highly or most competitive spend 1.90 and 1.71
percentage points more on research than their noncompetitive peers, whereas Research and
Doctoral degree-granting universities spend 14.78 percentage points more than those clas-
sified as baccalaureate colleges. Conversely, the percentage of students who are undergrad-
uates is negatively related to research spending, and every 10 percentage point increase in
undergraduate students yields a 0.77 percentage point decrease in research expenditures.
A similar increase in the percentage of students who are part time is associated with
a 0.61 percentage point decrease. With regard to the variable of interest, performance fund-
ing is negatively related to research expenditures, and institutions located in states with
performance-funding policies spend 0.34 percentage points less of their educational expen-
ditures on research than they would, all else equal, in nonperformance-funding states.
In terms of instructional expenditures, similar patterns emerge. Somewhat surpris-
ingly, competitive and very competitive institutions spend more on instruction than do
those on either end of the selectivity scale. Research and Doctoral degree-granting univer-
sities spend 4.13 percentage points less on instruction than do other schools, whereas insti-
tutions classified as Master’s degree granting spend 2.18 percentage points more on
instruction than do Bachelor’s degree only granting schools. Similarly, as the percentage
of faculty who are full time and the percentage of students who receive federal financial aid
increase, expenditures on instruction decrease. Finally, performance funding is positively
related to the proportion of expenditures that are allocated to instruction, with institutions in
performance-funding states spending about 0.89 percentage points more on instruction than
those in nonperformance states, all else equal.
Although performance-funding policies appear to work in the desired direction for
both expenditures and instruction, the effects are minimal. In both instances, the differences
between institutions with performance funding versus those without are less than 1 per-
centage point. Given the previously discussed findings that indicate little effect of account-
ability policies on state budgets (and thus institutional incentives), it is perhaps unsurprising
that we observe such minimal effects when examining institutional priorities. As state gov-
ernments are increasingly incapable of subsidizing higher education in the same capacity as
has traditionally been the case (Mumper 2003; Weerts and Ronca 2006), public universities
have come to rely more and more on private sources of revenue (including competition for
research funding). Nevertheless, given that current performance-funding efforts have
largely been ineffective at reshaping state budgets, the fact that these policies have had
even minimal impacts on institutional spending is a notable and somewhat surprising find-
ing. These results leave open the potential for these policies to have considerable effects on
administrative behavior if policymakers could more effectively tie larger incentives to
institutional performance.
Rabovsky Accountability in Higher Education 19
One important question that remains about the influence of performance-funding
policies on institutional behavior is whether or not there are differential impacts. Given
that large research universities are often times considerably more visible than nonresearch
universities, one might speculate that performance-funding policies would have a greater
impact on their priorities. On the other hand, these institutions have greater access to out-
side revenues and are often times portrayed as less reliant on state funding than other insti-
tutions in their state (Ehrenberg 2006). Thus, performance-funding policies on spending
priorities could also conceivably be less influential for research universities than other
institutions.
In order to test whether the influence of performance funding was different based on
institutional mission, I reran the analysis from stage two separately for research institutions
Table 5Stage Two Results
% Expenditure on Research % Expenditure on Instruction
Less competitive (Barron’s) 20.178 0.429
(0.17) (0.29)
Competitive (Barron’s) 20.158 0.688*
(0.17) (0.27)
Very competitive (Barron’s) 0.283 1.040**
(0.25) (0.33)
Highly competitive (Barron’s) 1.904*** 0.364
(0.40) (0.58)
Most competitive (Barron’s) 1.710** 0.097
(0.61) (0.73)
Master’s (Carnegie) 21.426*** 2.183***
(0.36) (0.47)
Research (Carnegie) 14.779*** 24.134***
(0.62) (0.80)
Total enrollment (1,000s) 0.089*** 20.028
(0.02) (0.03)
% Undergraduate 20.077*** 20.011
(0.01) (0.02)
% Students receiving federal aid 0.003 20.041***
(0.00) (0.01)
% Students who are part time 20.061*** 0.007
(0.01) (0.01)
% Full-time faculty 20.006 20.0121
(0.00) (0.01)
Performance funding 20.342** 0.890***
(0.12) (0.21)
Constant 11.062*** 47.393***
(1.47) (2.07)
No. of observations 5,490 5,490
No. of universities 490 490
Years covered 1998–2009 1998–2009
Wald x2 6,673.57*** 688.64***
R2 0.786 0.943
Note: PCSEs in parentheses.
1p , .10, *p , .05, **p , .01, ***p , .001.
20 Journal of Public Administration Research and Theory

Journal of Public Administration Research and Theory 694
One important question that remains about the influence of performance-funding
policies on institutional behavior is whether or not there are differential impacts. Given
that large research universities are often times considerably more visible than nonresearch
universities, one might speculate that performance-funding policies would have a greater
impact on their priorities. On the other hand, these institutions have greater access to out-
side revenues and are often times portrayed as less reliant on state funding than other insti-
tutions in their state (Ehrenberg 2006). Thus, performance-funding policies on spending
priorities could also conceivably be less influential for research universities than other
institutions.
In order to test whether the influence of performance funding was different based on
institutional mission, I reran the analysis from stage two separately for research institutions
Table 5Stage Two Results
% Expenditure on Research % Expenditure on Instruction
Less competitive (Barron’s) 20.178 0.429
(0.17) (0.29)
Competitive (Barron’s) 20.158 0.688*
(0.17) (0.27)
Very competitive (Barron’s) 0.283 1.040**
(0.25) (0.33)
Highly competitive (Barron’s) 1.904*** 0.364
(0.40) (0.58)
Most competitive (Barron’s) 1.710** 0.097
(0.61) (0.73)
Master’s (Carnegie) 21.426*** 2.183***
(0.36) (0.47)
Research (Carnegie) 14.779*** 24.134***
(0.62) (0.80)
Total enrollment (1,000s) 0.089*** 20.028
(0.02) (0.03)
% Undergraduate 20.077*** 20.011
(0.01) (0.02)
% Students receiving federal aid 0.003 20.041***
(0.00) (0.01)
% Students who are part time 20.061*** 0.007
(0.01) (0.01)
% Full-time faculty 20.006 20.0121
(0.00) (0.01)
Performance funding 20.342** 0.890***
(0.12) (0.21)
Constant 11.062*** 47.393***
(1.47) (2.07)
No. of observations 5,490 5,490
No. of universities 490 490
Years covered 1998–2009 1998–2009
Wald x2 6,673.57*** 688.64***
R2 0.786 0.943
Note: PCSEs in parentheses.
1p , .10, *p , .05, **p , .01, ***p , .001.
20 Journal of Public Administration Research and Theory
versus nonresearch institutions (tables 6 and 7). In both cases, it appears that the effect of
performance-funding policies is greater for research universities than it is for nonresearch
universities. In the case of expenditures on research, performance-funding policies have
a negative and statistically significant influence on institutional spending, but they are
not significant in the model for nonresearch universities. For instruction, performance-
funding policies are positive and statistically significant in both cases, but the magnitude
of the effect for research universities is more than double that for nonresearch institutions
(1.34 versus 0.59). Although performance-funding policies are generally aimed at all public
institutions in a state, it appears that they may be more influential on research universities.
CONCLUSION AND DISCUSSION
Overall, the results from both stage one and stage two failed to find any substantial evidence
that performance-funding policies have had significant impacts on state budgets or
Table 6Differential Impacts of Performance Funding on Percentage of Expenditures on Research: Researchversus Nonresearch Universities
Nonresearch Universities Research Universities
Less competitive (Barron’s) 20.258 21.251**
(0.20) (0.44)
Competitive (Barron’s) 20.3821 20.106
(0.20) (0.40)
Very competitive (Barron’s) 20.5681 0.602
(0.32) (0.43)
Highly competitive (Barron’s) 20.356 2.169***
(0.54) (0.56)
Most competitive (Barron’s) 0.817 1.3031
(0.81) (0.78)
Total enrollment (1,000s) 20.036* 0.151***
(0.02) (0.03)
% Undergraduate 20.058*** 20.148***
(0.01) (0.04)
% Students receiving federal aid 0.010** 20.027***
(0.00) (0.01)
% Students who are part time 20.025*** 20.201***
(0.01) (0.02)
% Full-time faculty 0.0071 20.0161
(0.00) (0.01)
Performance funding 0.042 20.852**
(0.12) (0.30)
Constant 7.824*** 33.417***
(1.15) (3.65)
No. of observations 3,599 1,891
No. of universities 327 163
Years covered 1998–2009 1998–2009
Wald x2 125.30*** 448.86***
R2 0.202 0.804
Note: PCSEs in parentheses. Dependent Variable, % expenditures on research.
1p , .10, *p , .05, **p , .01, ***p , .001.
Rabovsky Accountability in Higher Education 21
competitiveness, Missionit is a vector of variables to reflect Carnegie classification,
PFundingit represents a dichotomous variable for whether an institution was subject to
a performance-funding policy at time t, and eit is the error term.
STAGE TWO—FINDINGS
Results for stage two are listed in table 5. Turning first to the percentage of expenditures on
research, there are a number of interesting findings. As expected, total enrollment is pos-
itively related to the research expenditures, and every 10,000 student increase in total en-
rollment is associated with a 0.89 percentage point increase in expenditures on research.
Similarly, institutions that are classified as highly or most competitive spend 1.90 and 1.71
percentage points more on research than their noncompetitive peers, whereas Research and
Doctoral degree-granting universities spend 14.78 percentage points more than those clas-
sified as baccalaureate colleges. Conversely, the percentage of students who are undergrad-
uates is negatively related to research spending, and every 10 percentage point increase in
undergraduate students yields a 0.77 percentage point decrease in research expenditures.
A similar increase in the percentage of students who are part time is associated with
a 0.61 percentage point decrease. With regard to the variable of interest, performance fund-
ing is negatively related to research expenditures, and institutions located in states with
performance-funding policies spend 0.34 percentage points less of their educational expen-
ditures on research than they would, all else equal, in nonperformance-funding states.
In terms of instructional expenditures, similar patterns emerge. Somewhat surpris-
ingly, competitive and very competitive institutions spend more on instruction than do
those on either end of the selectivity scale. Research and Doctoral degree-granting univer-
sities spend 4.13 percentage points less on instruction than do other schools, whereas insti-
tutions classified as Master’s degree granting spend 2.18 percentage points more on
instruction than do Bachelor’s degree only granting schools. Similarly, as the percentage
of faculty who are full time and the percentage of students who receive federal financial aid
increase, expenditures on instruction decrease. Finally, performance funding is positively
related to the proportion of expenditures that are allocated to instruction, with institutions in
performance-funding states spending about 0.89 percentage points more on instruction than
those in nonperformance states, all else equal.
Although performance-funding policies appear to work in the desired direction for
both expenditures and instruction, the effects are minimal. In both instances, the differences
between institutions with performance funding versus those without are less than 1 per-
centage point. Given the previously discussed findings that indicate little effect of account-
ability policies on state budgets (and thus institutional incentives), it is perhaps unsurprising
that we observe such minimal effects when examining institutional priorities. As state gov-
ernments are increasingly incapable of subsidizing higher education in the same capacity as
has traditionally been the case (Mumper 2003; Weerts and Ronca 2006), public universities
have come to rely more and more on private sources of revenue (including competition for
research funding). Nevertheless, given that current performance-funding efforts have
largely been ineffective at reshaping state budgets, the fact that these policies have had
even minimal impacts on institutional spending is a notable and somewhat surprising find-
ing. These results leave open the potential for these policies to have considerable effects on
administrative behavior if policymakers could more effectively tie larger incentives to
institutional performance.
Rabovsky Accountability in Higher Education 19
versus nonresearch institutions (tables 6 and 7). In both cases, it appears that the effect of
performance-funding policies is greater for research universities than it is for nonresearch
universities. In the case of expenditures on research, performance-funding policies have
a negative and statistically significant influence on institutional spending, but they are
not significant in the model for nonresearch universities. For instruction, performance-
funding policies are positive and statistically significant in both cases, but the magnitude
of the effect for research universities is more than double that for nonresearch institutions
(1.34 versus 0.59). Although performance-funding policies are generally aimed at all public
institutions in a state, it appears that they may be more influential on research universities.
CONCLUSION AND DISCUSSION
Overall, the results from both stage one and stage two failed to find any substantial evidence
that performance-funding policies have had significant impacts on state budgets or
Table 6Differential Impacts of Performance Funding on Percentage of Expenditures on Research: Researchversus Nonresearch Universities
Nonresearch Universities Research Universities
Less competitive (Barron’s) 20.258 21.251**
(0.20) (0.44)
Competitive (Barron’s) 20.3821 20.106
(0.20) (0.40)
Very competitive (Barron’s) 20.5681 0.602
(0.32) (0.43)
Highly competitive (Barron’s) 20.356 2.169***
(0.54) (0.56)
Most competitive (Barron’s) 0.817 1.3031
(0.81) (0.78)
Total enrollment (1,000s) 20.036* 0.151***
(0.02) (0.03)
% Undergraduate 20.058*** 20.148***
(0.01) (0.04)
% Students receiving federal aid 0.010** 20.027***
(0.00) (0.01)
% Students who are part time 20.025*** 20.201***
(0.01) (0.02)
% Full-time faculty 0.0071 20.0161
(0.00) (0.01)
Performance funding 0.042 20.852**
(0.12) (0.30)
Constant 7.824*** 33.417***
(1.15) (3.65)
No. of observations 3,599 1,891
No. of universities 327 163
Years covered 1998–2009 1998–2009
Wald x2 125.30*** 448.86***
R2 0.202 0.804
Note: PCSEs in parentheses. Dependent Variable, % expenditures on research.
1p , .10, *p , .05, **p , .01, ***p , .001.
Rabovsky Accountability in Higher Education 21
institutional priorities. One interesting finding that has implications for both the perfor-
mance management literature and the broader literature on performance and public
organizations is that the link between performance information and funding may already
bemore substantial thanmany observers are currently aware. Performance-funding policies
are largely based on the premise that university administrators do not currently place
enough emphasis on student outcomes because they have few incentives to do so. This
analysis finds that institutions do face meaningful financial incentives for improving
performance and that performance-funding policies have done little (if anything) to make
these incentives any more powerful than they already are.
Moreover, Zhang (2009) found that state appropriations have a positive impact on
institutional graduation rates, so it may be the case that most institutions are already highly
concerned with student outcomes and that they simply need more resources from state
governments in order to produce results. If this is the case, then a shift toward funding
Table 7Differential Impacts of Performance Funding on Percentage of Expenditures on Instruction: Researchversus Nonresearch Universities
Nonresearch Universities Research Universities
Less competitive (Barron’s) 0.702* 20.7151
(0.36) (0.43)
Competitive (Barron’s) 0.848* 20.093
(0.34) (0.38)
Very competitive (Barron’s) 1.949*** 20.179
(0.43) (0.45)
Highly competitive (Barron’s) 2.182** 21.043
(0.82) (0.74)
Most competitive (Barron’s) 1.750 21.308
(1.72) (0.84)
Total enrollment (1,000s) 0.200*** 20.154**
(0.03) (0.05)
% Undergraduate 0.003 20.0801
(0.02) (0.04)
% Students receiving federal aid 20.053*** 20.002
(0.01) (0.01)
% Students who are part time 20.0211 0.020
(0.01) (0.03)
% Full-time faculty 0.002 20.017
(0.01) (0.01)
Performance funding 0.586* 1.343***
(0.24) (0.33)
Constant 45.928*** 51.694***
(1.71) (4.66)
No. of observations 3,599 1,891
No. of universities 327 163
Years covered 1998–2009 1998–2009
Wald x2 227.75*** 99.35***
R2 0.946 0.931
Note: PCSEs in parentheses. Dependent Variable, % expenditures on instruction.
1p , .10, *p , .05., **p , .01, ***p , .001.
22 Journal of Public Administration Research and Theory
policies that effectively punish those institutions that are underperforming may actually
work to undercut progress toward improving student outcomes and alleviating achievement
gaps. Rather than responding with desired shifts in administrative priorities (i.e., smaller
class sizes and more full-time faculty who are heavily involved in undergraduate educa-
tion), institutions may instead react to these policies by simply raising admissions criteria
and reducing access for at-risk students (Fryar 2011).
Second, although performance-funding policies do not appear to have dramatically
altered institutional spending priorities, it is interesting to note that they had some minimal
influence. If these policies do not effectively restructure financial incentives (as the findings
from stage one indicate), why do institutions respond to them at all? One explanation
may be that university administrators perceive that accountability policies will potentially
have a major impact on their institutions at some point in the near future, even if they are not
very effective right now. Given the highly charged political rhetoric that has surrounded
these policies, universities may feel that they need to at least give an appearance of
doing something proactive, lest their political principals get even more upset and adopt
an aggressive accountability policy in the years ahead. This may also help explain the dif-
ferential impacts of performance funding across institutional types. Research universities
are often the most visible institutions in the state, and thus, they may feel greater pressure
from state policymakers to demonstrate a renewed commitment to undergraduate educa-
tion. Additionally, the fact that these policies have indeed impacted institutional priorities
despite their limited scope suggests that future performance-funding efforts might have
substantial effects on administrative behavior if policymakers are able to connect more
meaningful incentives to various metrics of performance.
Finally, there are considerable variations in the nature and content of the performance-
funding policies that states have adopted. For example, some states such as Tennessee and
Pennsylvania have developed performance-funding structures that have been lauded as en-
couraging excellence while maintaining differentiation between institutions with varied
missions and student populations. By comparison, other states, like South Carolina, have
been criticized for adopting benchmarks that are so easily attainable as to pose no real threat
to university budgets (Aldeman and Carey 2009; Zumeta 2001). Understanding the ways in
which these differences matter is beyond the scope of the current article but remains a task
that warrants considerable attention in the future. As we move forward, these differences in
policy design are likely to play a central role in the debate regarding accountability reform
and performance funding.
Performance-based accountability is predicated on a causal logic that requires
administrators and institutions to alter behavior and activities in ways that improve
student outcomes. Although there has been considerable attention paid to the potential
implications of these policies and to the ways in which they represent a shift in oversight
relationships between higher education and state governments, there has been little
empirical work to investigate the impacts that these policies have on either management
or student outcomes. This articlemarks an initial step toward building a better understanding
of the ways that these policies impact management and institutions. The findings,
which suggest that performance-funding policies have generally been ineffective in
their attempts to influence either state budget arrangements or institutional spending pref-
erences, highlight the need to better understand the mechanisms by which accountability
operates.
Rabovsky Accountability in Higher Education 23

Rabovsky Accountability in Higher Education 695
One important question that remains about the influence of performance-funding
policies on institutional behavior is whether or not there are differential impacts. Given
that large research universities are often times considerably more visible than nonresearch
universities, one might speculate that performance-funding policies would have a greater
impact on their priorities. On the other hand, these institutions have greater access to out-
side revenues and are often times portrayed as less reliant on state funding than other insti-
tutions in their state (Ehrenberg 2006). Thus, performance-funding policies on spending
priorities could also conceivably be less influential for research universities than other
institutions.
In order to test whether the influence of performance funding was different based on
institutional mission, I reran the analysis from stage two separately for research institutions
Table 5Stage Two Results
% Expenditure on Research % Expenditure on Instruction
Less competitive (Barron’s) 20.178 0.429
(0.17) (0.29)
Competitive (Barron’s) 20.158 0.688*
(0.17) (0.27)
Very competitive (Barron’s) 0.283 1.040**
(0.25) (0.33)
Highly competitive (Barron’s) 1.904*** 0.364
(0.40) (0.58)
Most competitive (Barron’s) 1.710** 0.097
(0.61) (0.73)
Master’s (Carnegie) 21.426*** 2.183***
(0.36) (0.47)
Research (Carnegie) 14.779*** 24.134***
(0.62) (0.80)
Total enrollment (1,000s) 0.089*** 20.028
(0.02) (0.03)
% Undergraduate 20.077*** 20.011
(0.01) (0.02)
% Students receiving federal aid 0.003 20.041***
(0.00) (0.01)
% Students who are part time 20.061*** 0.007
(0.01) (0.01)
% Full-time faculty 20.006 20.0121
(0.00) (0.01)
Performance funding 20.342** 0.890***
(0.12) (0.21)
Constant 11.062*** 47.393***
(1.47) (2.07)
No. of observations 5,490 5,490
No. of universities 490 490
Years covered 1998–2009 1998–2009
Wald x2 6,673.57*** 688.64***
R2 0.786 0.943
Note: PCSEs in parentheses.
1p , .10, *p , .05, **p , .01, ***p , .001.
20 Journal of Public Administration Research and Theory
versus nonresearch institutions (tables 6 and 7). In both cases, it appears that the effect of
performance-funding policies is greater for research universities than it is for nonresearch
universities. In the case of expenditures on research, performance-funding policies have
a negative and statistically significant influence on institutional spending, but they are
not significant in the model for nonresearch universities. For instruction, performance-
funding policies are positive and statistically significant in both cases, but the magnitude
of the effect for research universities is more than double that for nonresearch institutions
(1.34 versus 0.59). Although performance-funding policies are generally aimed at all public
institutions in a state, it appears that they may be more influential on research universities.
CONCLUSION AND DISCUSSION
Overall, the results from both stage one and stage two failed to find any substantial evidence
that performance-funding policies have had significant impacts on state budgets or
Table 6Differential Impacts of Performance Funding on Percentage of Expenditures on Research: Researchversus Nonresearch Universities
Nonresearch Universities Research Universities
Less competitive (Barron’s) 20.258 21.251**
(0.20) (0.44)
Competitive (Barron’s) 20.3821 20.106
(0.20) (0.40)
Very competitive (Barron’s) 20.5681 0.602
(0.32) (0.43)
Highly competitive (Barron’s) 20.356 2.169***
(0.54) (0.56)
Most competitive (Barron’s) 0.817 1.3031
(0.81) (0.78)
Total enrollment (1,000s) 20.036* 0.151***
(0.02) (0.03)
% Undergraduate 20.058*** 20.148***
(0.01) (0.04)
% Students receiving federal aid 0.010** 20.027***
(0.00) (0.01)
% Students who are part time 20.025*** 20.201***
(0.01) (0.02)
% Full-time faculty 0.0071 20.0161
(0.00) (0.01)
Performance funding 0.042 20.852**
(0.12) (0.30)
Constant 7.824*** 33.417***
(1.15) (3.65)
No. of observations 3,599 1,891
No. of universities 327 163
Years covered 1998–2009 1998–2009
Wald x2 125.30*** 448.86***
R2 0.202 0.804
Note: PCSEs in parentheses. Dependent Variable, % expenditures on research.
1p , .10, *p , .05, **p , .01, ***p , .001.
Rabovsky Accountability in Higher Education 21
competitiveness, Missionit is a vector of variables to reflect Carnegie classification,
PFundingit represents a dichotomous variable for whether an institution was subject to
a performance-funding policy at time t, and eit is the error term.
STAGE TWO—FINDINGS
Results for stage two are listed in table 5. Turning first to the percentage of expenditures on
research, there are a number of interesting findings. As expected, total enrollment is pos-
itively related to the research expenditures, and every 10,000 student increase in total en-
rollment is associated with a 0.89 percentage point increase in expenditures on research.
Similarly, institutions that are classified as highly or most competitive spend 1.90 and 1.71
percentage points more on research than their noncompetitive peers, whereas Research and
Doctoral degree-granting universities spend 14.78 percentage points more than those clas-
sified as baccalaureate colleges. Conversely, the percentage of students who are undergrad-
uates is negatively related to research spending, and every 10 percentage point increase in
undergraduate students yields a 0.77 percentage point decrease in research expenditures.
A similar increase in the percentage of students who are part time is associated with
a 0.61 percentage point decrease. With regard to the variable of interest, performance fund-
ing is negatively related to research expenditures, and institutions located in states with
performance-funding policies spend 0.34 percentage points less of their educational expen-
ditures on research than they would, all else equal, in nonperformance-funding states.
In terms of instructional expenditures, similar patterns emerge. Somewhat surpris-
ingly, competitive and very competitive institutions spend more on instruction than do
those on either end of the selectivity scale. Research and Doctoral degree-granting univer-
sities spend 4.13 percentage points less on instruction than do other schools, whereas insti-
tutions classified as Master’s degree granting spend 2.18 percentage points more on
instruction than do Bachelor’s degree only granting schools. Similarly, as the percentage
of faculty who are full time and the percentage of students who receive federal financial aid
increase, expenditures on instruction decrease. Finally, performance funding is positively
related to the proportion of expenditures that are allocated to instruction, with institutions in
performance-funding states spending about 0.89 percentage points more on instruction than
those in nonperformance states, all else equal.
Although performance-funding policies appear to work in the desired direction for
both expenditures and instruction, the effects are minimal. In both instances, the differences
between institutions with performance funding versus those without are less than 1 per-
centage point. Given the previously discussed findings that indicate little effect of account-
ability policies on state budgets (and thus institutional incentives), it is perhaps unsurprising
that we observe such minimal effects when examining institutional priorities. As state gov-
ernments are increasingly incapable of subsidizing higher education in the same capacity as
has traditionally been the case (Mumper 2003; Weerts and Ronca 2006), public universities
have come to rely more and more on private sources of revenue (including competition for
research funding). Nevertheless, given that current performance-funding efforts have
largely been ineffective at reshaping state budgets, the fact that these policies have had
even minimal impacts on institutional spending is a notable and somewhat surprising find-
ing. These results leave open the potential for these policies to have considerable effects on
administrative behavior if policymakers could more effectively tie larger incentives to
institutional performance.
Rabovsky Accountability in Higher Education 19
versus nonresearch institutions (tables 6 and 7). In both cases, it appears that the effect of
performance-funding policies is greater for research universities than it is for nonresearch
universities. In the case of expenditures on research, performance-funding policies have
a negative and statistically significant influence on institutional spending, but they are
not significant in the model for nonresearch universities. For instruction, performance-
funding policies are positive and statistically significant in both cases, but the magnitude
of the effect for research universities is more than double that for nonresearch institutions
(1.34 versus 0.59). Although performance-funding policies are generally aimed at all public
institutions in a state, it appears that they may be more influential on research universities.
CONCLUSION AND DISCUSSION
Overall, the results from both stage one and stage two failed to find any substantial evidence
that performance-funding policies have had significant impacts on state budgets or
Table 6Differential Impacts of Performance Funding on Percentage of Expenditures on Research: Researchversus Nonresearch Universities
Nonresearch Universities Research Universities
Less competitive (Barron’s) 20.258 21.251**
(0.20) (0.44)
Competitive (Barron’s) 20.3821 20.106
(0.20) (0.40)
Very competitive (Barron’s) 20.5681 0.602
(0.32) (0.43)
Highly competitive (Barron’s) 20.356 2.169***
(0.54) (0.56)
Most competitive (Barron’s) 0.817 1.3031
(0.81) (0.78)
Total enrollment (1,000s) 20.036* 0.151***
(0.02) (0.03)
% Undergraduate 20.058*** 20.148***
(0.01) (0.04)
% Students receiving federal aid 0.010** 20.027***
(0.00) (0.01)
% Students who are part time 20.025*** 20.201***
(0.01) (0.02)
% Full-time faculty 0.0071 20.0161
(0.00) (0.01)
Performance funding 0.042 20.852**
(0.12) (0.30)
Constant 7.824*** 33.417***
(1.15) (3.65)
No. of observations 3,599 1,891
No. of universities 327 163
Years covered 1998–2009 1998–2009
Wald x2 125.30*** 448.86***
R2 0.202 0.804
Note: PCSEs in parentheses. Dependent Variable, % expenditures on research.
1p , .10, *p , .05, **p , .01, ***p , .001.
Rabovsky Accountability in Higher Education 21
institutional priorities. One interesting finding that has implications for both the perfor-
mance management literature and the broader literature on performance and public
organizations is that the link between performance information and funding may already
bemore substantial thanmany observers are currently aware. Performance-funding policies
are largely based on the premise that university administrators do not currently place
enough emphasis on student outcomes because they have few incentives to do so. This
analysis finds that institutions do face meaningful financial incentives for improving
performance and that performance-funding policies have done little (if anything) to make
these incentives any more powerful than they already are.
Moreover, Zhang (2009) found that state appropriations have a positive impact on
institutional graduation rates, so it may be the case that most institutions are already highly
concerned with student outcomes and that they simply need more resources from state
governments in order to produce results. If this is the case, then a shift toward funding
Table 7Differential Impacts of Performance Funding on Percentage of Expenditures on Instruction: Researchversus Nonresearch Universities
Nonresearch Universities Research Universities
Less competitive (Barron’s) 0.702* 20.7151
(0.36) (0.43)
Competitive (Barron’s) 0.848* 20.093
(0.34) (0.38)
Very competitive (Barron’s) 1.949*** 20.179
(0.43) (0.45)
Highly competitive (Barron’s) 2.182** 21.043
(0.82) (0.74)
Most competitive (Barron’s) 1.750 21.308
(1.72) (0.84)
Total enrollment (1,000s) 0.200*** 20.154**
(0.03) (0.05)
% Undergraduate 0.003 20.0801
(0.02) (0.04)
% Students receiving federal aid 20.053*** 20.002
(0.01) (0.01)
% Students who are part time 20.0211 0.020
(0.01) (0.03)
% Full-time faculty 0.002 20.017
(0.01) (0.01)
Performance funding 0.586* 1.343***
(0.24) (0.33)
Constant 45.928*** 51.694***
(1.71) (4.66)
No. of observations 3,599 1,891
No. of universities 327 163
Years covered 1998–2009 1998–2009
Wald x2 227.75*** 99.35***
R2 0.946 0.931
Note: PCSEs in parentheses. Dependent Variable, % expenditures on instruction.
1p , .10, *p , .05., **p , .01, ***p , .001.
22 Journal of Public Administration Research and Theory
institutional priorities. One interesting finding that has implications for both the perfor-
mance management literature and the broader literature on performance and public
organizations is that the link between performance information and funding may already
bemore substantial thanmany observers are currently aware. Performance-funding policies
are largely based on the premise that university administrators do not currently place
enough emphasis on student outcomes because they have few incentives to do so. This
analysis finds that institutions do face meaningful financial incentives for improving
performance and that performance-funding policies have done little (if anything) to make
these incentives any more powerful than they already are.
Moreover, Zhang (2009) found that state appropriations have a positive impact on
institutional graduation rates, so it may be the case that most institutions are already highly
concerned with student outcomes and that they simply need more resources from state
governments in order to produce results. If this is the case, then a shift toward funding
Table 7Differential Impacts of Performance Funding on Percentage of Expenditures on Instruction: Researchversus Nonresearch Universities
Nonresearch Universities Research Universities
Less competitive (Barron’s) 0.702* 20.7151
(0.36) (0.43)
Competitive (Barron’s) 0.848* 20.093
(0.34) (0.38)
Very competitive (Barron’s) 1.949*** 20.179
(0.43) (0.45)
Highly competitive (Barron’s) 2.182** 21.043
(0.82) (0.74)
Most competitive (Barron’s) 1.750 21.308
(1.72) (0.84)
Total enrollment (1,000s) 0.200*** 20.154**
(0.03) (0.05)
% Undergraduate 0.003 20.0801
(0.02) (0.04)
% Students receiving federal aid 20.053*** 20.002
(0.01) (0.01)
% Students who are part time 20.0211 0.020
(0.01) (0.03)
% Full-time faculty 0.002 20.017
(0.01) (0.01)
Performance funding 0.586* 1.343***
(0.24) (0.33)
Constant 45.928*** 51.694***
(1.71) (4.66)
No. of observations 3,599 1,891
No. of universities 327 163
Years covered 1998–2009 1998–2009
Wald x2 227.75*** 99.35***
R2 0.946 0.931
Note: PCSEs in parentheses. Dependent Variable, % expenditures on instruction.
1p , .10, *p , .05., **p , .01, ***p , .001.
22 Journal of Public Administration Research and Theory
policies that effectively punish those institutions that are underperforming may actually
work to undercut progress toward improving student outcomes and alleviating achievement
gaps. Rather than responding with desired shifts in administrative priorities (i.e., smaller
class sizes and more full-time faculty who are heavily involved in undergraduate educa-
tion), institutions may instead react to these policies by simply raising admissions criteria
and reducing access for at-risk students (Fryar 2011).
Second, although performance-funding policies do not appear to have dramatically
altered institutional spending priorities, it is interesting to note that they had some minimal
influence. If these policies do not effectively restructure financial incentives (as the findings
from stage one indicate), why do institutions respond to them at all? One explanation
may be that university administrators perceive that accountability policies will potentially
have a major impact on their institutions at some point in the near future, even if they are not
very effective right now. Given the highly charged political rhetoric that has surrounded
these policies, universities may feel that they need to at least give an appearance of
doing something proactive, lest their political principals get even more upset and adopt
an aggressive accountability policy in the years ahead. This may also help explain the dif-
ferential impacts of performance funding across institutional types. Research universities
are often the most visible institutions in the state, and thus, they may feel greater pressure
from state policymakers to demonstrate a renewed commitment to undergraduate educa-
tion. Additionally, the fact that these policies have indeed impacted institutional priorities
despite their limited scope suggests that future performance-funding efforts might have
substantial effects on administrative behavior if policymakers are able to connect more
meaningful incentives to various metrics of performance.
Finally, there are considerable variations in the nature and content of the performance-
funding policies that states have adopted. For example, some states such as Tennessee and
Pennsylvania have developed performance-funding structures that have been lauded as en-
couraging excellence while maintaining differentiation between institutions with varied
missions and student populations. By comparison, other states, like South Carolina, have
been criticized for adopting benchmarks that are so easily attainable as to pose no real threat
to university budgets (Aldeman and Carey 2009; Zumeta 2001). Understanding the ways in
which these differences matter is beyond the scope of the current article but remains a task
that warrants considerable attention in the future. As we move forward, these differences in
policy design are likely to play a central role in the debate regarding accountability reform
and performance funding.
Performance-based accountability is predicated on a causal logic that requires
administrators and institutions to alter behavior and activities in ways that improve
student outcomes. Although there has been considerable attention paid to the potential
implications of these policies and to the ways in which they represent a shift in oversight
relationships between higher education and state governments, there has been little
empirical work to investigate the impacts that these policies have on either management
or student outcomes. This articlemarks an initial step toward building a better understanding
of the ways that these policies impact management and institutions. The findings,
which suggest that performance-funding policies have generally been ineffective in
their attempts to influence either state budget arrangements or institutional spending pref-
erences, highlight the need to better understand the mechanisms by which accountability
operates.
Rabovsky Accountability in Higher Education 23

Journal of Public Administration Research and Theory 696
institutional priorities. One interesting finding that has implications for both the perfor-
mance management literature and the broader literature on performance and public
organizations is that the link between performance information and funding may already
bemore substantial thanmany observers are currently aware. Performance-funding policies
are largely based on the premise that university administrators do not currently place
enough emphasis on student outcomes because they have few incentives to do so. This
analysis finds that institutions do face meaningful financial incentives for improving
performance and that performance-funding policies have done little (if anything) to make
these incentives any more powerful than they already are.
Moreover, Zhang (2009) found that state appropriations have a positive impact on
institutional graduation rates, so it may be the case that most institutions are already highly
concerned with student outcomes and that they simply need more resources from state
governments in order to produce results. If this is the case, then a shift toward funding
Table 7Differential Impacts of Performance Funding on Percentage of Expenditures on Instruction: Researchversus Nonresearch Universities
Nonresearch Universities Research Universities
Less competitive (Barron’s) 0.702* 20.7151
(0.36) (0.43)
Competitive (Barron’s) 0.848* 20.093
(0.34) (0.38)
Very competitive (Barron’s) 1.949*** 20.179
(0.43) (0.45)
Highly competitive (Barron’s) 2.182** 21.043
(0.82) (0.74)
Most competitive (Barron’s) 1.750 21.308
(1.72) (0.84)
Total enrollment (1,000s) 0.200*** 20.154**
(0.03) (0.05)
% Undergraduate 0.003 20.0801
(0.02) (0.04)
% Students receiving federal aid 20.053*** 20.002
(0.01) (0.01)
% Students who are part time 20.0211 0.020
(0.01) (0.03)
% Full-time faculty 0.002 20.017
(0.01) (0.01)
Performance funding 0.586* 1.343***
(0.24) (0.33)
Constant 45.928*** 51.694***
(1.71) (4.66)
No. of observations 3,599 1,891
No. of universities 327 163
Years covered 1998–2009 1998–2009
Wald x2 227.75*** 99.35***
R2 0.946 0.931
Note: PCSEs in parentheses. Dependent Variable, % expenditures on instruction.
1p , .10, *p , .05., **p , .01, ***p , .001.
22 Journal of Public Administration Research and Theory
policies that effectively punish those institutions that are underperforming may actually
work to undercut progress toward improving student outcomes and alleviating achievement
gaps. Rather than responding with desired shifts in administrative priorities (i.e., smaller
class sizes and more full-time faculty who are heavily involved in undergraduate educa-
tion), institutions may instead react to these policies by simply raising admissions criteria
and reducing access for at-risk students (Fryar 2011).
Second, although performance-funding policies do not appear to have dramatically
altered institutional spending priorities, it is interesting to note that they had some minimal
influence. If these policies do not effectively restructure financial incentives (as the findings
from stage one indicate), why do institutions respond to them at all? One explanation
may be that university administrators perceive that accountability policies will potentially
have a major impact on their institutions at some point in the near future, even if they are not
very effective right now. Given the highly charged political rhetoric that has surrounded
these policies, universities may feel that they need to at least give an appearance of
doing something proactive, lest their political principals get even more upset and adopt
an aggressive accountability policy in the years ahead. This may also help explain the dif-
ferential impacts of performance funding across institutional types. Research universities
are often the most visible institutions in the state, and thus, they may feel greater pressure
from state policymakers to demonstrate a renewed commitment to undergraduate educa-
tion. Additionally, the fact that these policies have indeed impacted institutional priorities
despite their limited scope suggests that future performance-funding efforts might have
substantial effects on administrative behavior if policymakers are able to connect more
meaningful incentives to various metrics of performance.
Finally, there are considerable variations in the nature and content of the performance-
funding policies that states have adopted. For example, some states such as Tennessee and
Pennsylvania have developed performance-funding structures that have been lauded as en-
couraging excellence while maintaining differentiation between institutions with varied
missions and student populations. By comparison, other states, like South Carolina, have
been criticized for adopting benchmarks that are so easily attainable as to pose no real threat
to university budgets (Aldeman and Carey 2009; Zumeta 2001). Understanding the ways in
which these differences matter is beyond the scope of the current article but remains a task
that warrants considerable attention in the future. As we move forward, these differences in
policy design are likely to play a central role in the debate regarding accountability reform
and performance funding.
Performance-based accountability is predicated on a causal logic that requires
administrators and institutions to alter behavior and activities in ways that improve
student outcomes. Although there has been considerable attention paid to the potential
implications of these policies and to the ways in which they represent a shift in oversight
relationships between higher education and state governments, there has been little
empirical work to investigate the impacts that these policies have on either management
or student outcomes. This articlemarks an initial step toward building a better understanding
of the ways that these policies impact management and institutions. The findings,
which suggest that performance-funding policies have generally been ineffective in
their attempts to influence either state budget arrangements or institutional spending pref-
erences, highlight the need to better understand the mechanisms by which accountability
operates.
Rabovsky Accountability in Higher Education 23
Ultimately, the goal behind performance initiatives is to improve the educational
experience for students so that they emerge from college with a degree that adequately
prepares them for the challenges of the modern economy. With this in mind, it is vitally
important that policymakers pay more attention to the causal linkages between policy de-
sign and administrative responses as they seek to devise improved accountability structures
and that scholars invest greater resources to empirically investigate these connections as
they seek to understand governance and organizational performance.
REFERENCES
Abernathy Scott Franklin. 2007. No child left behind and the public schools. Ann Arbor, MI: Univ. of
Michigan Press.
Aldeman, Chad, and Kevin Carey. 2009. Ready to assemble: Grading state higher education account-
ability systems. Washington, DC: Education Sector.
Archibald, Robert, and David Feldman. 2008. Explaining increases in higher education costs. The Journal
of Higher Education 79:268–95.
Banta, Trudy W., Linda B. Rudolph, Janice Van Dyke, and Homer S. Fisher. 1996. Performance funding
comes of age in tennessee. The Journal of Higher Education 67:23–45.
Beck, Nathaniel, and Jonathan N. Katz. 1995. What to do (and not to do) with time-series cross-section
data. The American Political Science Review 89:634–47.
Behn, Robert D. 2003. Why measure performance? Different purposes require different measures. Public
Administration Review 63:586–606.
Booher-Jennings, Jennifer. 2005. Below the bubble: ‘Educational Triage’ and the Texas accountability
system. American Educational Research Journal 42:231–68.
Burke, Joseph C. 2001. Paying for performance in public higher education. In Quicker, better, cheaper?
Managing performance in American government, ed. Dan Forsythe, 417–51. Albany, NY: Rock-
efeller Institute.
Burke, Joseph C. 2002. Funding public colleges and universities for performance: Popularity, problems,
and prospects. Albany, NY: Rockefeller Institute.
Burke, Joseph C., and Andreea M. Serban. 1998. State synopses of performance funding programs. New
Directions for Institutional Research 25:25–48.
Burke, Joseph C., and Henrik P. Minassians. 2003. Performance reporting: ‘‘Real’’ accountability or
accountability ‘‘lite’’? Albany, NY: Rockefeller Institute.
Carey, Kevin. 2008.Graduation rate watch: Making minority student success a priority. Washington, DC:
Education Sector.
Casper, Cheryl A., and Myron S. Henry. 2001. Developing performance-oriented models for university
resource allocation. Research in Higher Education 42:353–76.
Chubb, John E., and Terry M. Moe. 1990. Politics, markets, and America’s schools. Washington, DC:
Brookings Institution.
Complete College America. 2010a. The path forward. http://www.completecollege.org/path_forward/.
Complete College America. 2010b. The alliance of states. http://www.completecollege.org/alliance_of_
states/.
Dougherty, Kevin J., and Rebecca S. Natow. 2009. The demise of higher education performance funding
systems in three states. CCRC Working Paper No.17, Community College Research Center,
Teachers College, Columbia University. http://www.eric.ed.gov/ERICWebPortal/contentdelivery/
servlet/ERICServlet?accno5ED505707.
Dougherty, Kevin J., Rebecca S. Natow, Rachel J. Hare, and Blanca E. Vega. 2010. The political origins of
state-level performance funding for higher education: The cases of Florida, Illinois, Missouri, South
Carolina, Tennessee, and Washington. New York, NY: Community College Research Center,
Teachers College, Columbia Univ.
24 Journal of Public Administration Research and Theory

Rabovsky Accountability in Higher Education 697
institutional priorities. One interesting finding that has implications for both the perfor-
mance management literature and the broader literature on performance and public
organizations is that the link between performance information and funding may already
bemore substantial thanmany observers are currently aware. Performance-funding policies
are largely based on the premise that university administrators do not currently place
enough emphasis on student outcomes because they have few incentives to do so. This
analysis finds that institutions do face meaningful financial incentives for improving
performance and that performance-funding policies have done little (if anything) to make
these incentives any more powerful than they already are.
Moreover, Zhang (2009) found that state appropriations have a positive impact on
institutional graduation rates, so it may be the case that most institutions are already highly
concerned with student outcomes and that they simply need more resources from state
governments in order to produce results. If this is the case, then a shift toward funding
Table 7Differential Impacts of Performance Funding on Percentage of Expenditures on Instruction: Researchversus Nonresearch Universities
Nonresearch Universities Research Universities
Less competitive (Barron’s) 0.702* 20.7151
(0.36) (0.43)
Competitive (Barron’s) 0.848* 20.093
(0.34) (0.38)
Very competitive (Barron’s) 1.949*** 20.179
(0.43) (0.45)
Highly competitive (Barron’s) 2.182** 21.043
(0.82) (0.74)
Most competitive (Barron’s) 1.750 21.308
(1.72) (0.84)
Total enrollment (1,000s) 0.200*** 20.154**
(0.03) (0.05)
% Undergraduate 0.003 20.0801
(0.02) (0.04)
% Students receiving federal aid 20.053*** 20.002
(0.01) (0.01)
% Students who are part time 20.0211 0.020
(0.01) (0.03)
% Full-time faculty 0.002 20.017
(0.01) (0.01)
Performance funding 0.586* 1.343***
(0.24) (0.33)
Constant 45.928*** 51.694***
(1.71) (4.66)
No. of observations 3,599 1,891
No. of universities 327 163
Years covered 1998–2009 1998–2009
Wald x2 227.75*** 99.35***
R2 0.946 0.931
Note: PCSEs in parentheses. Dependent Variable, % expenditures on instruction.
1p , .10, *p , .05., **p , .01, ***p , .001.
22 Journal of Public Administration Research and Theory
policies that effectively punish those institutions that are underperforming may actually
work to undercut progress toward improving student outcomes and alleviating achievement
gaps. Rather than responding with desired shifts in administrative priorities (i.e., smaller
class sizes and more full-time faculty who are heavily involved in undergraduate educa-
tion), institutions may instead react to these policies by simply raising admissions criteria
and reducing access for at-risk students (Fryar 2011).
Second, although performance-funding policies do not appear to have dramatically
altered institutional spending priorities, it is interesting to note that they had some minimal
influence. If these policies do not effectively restructure financial incentives (as the findings
from stage one indicate), why do institutions respond to them at all? One explanation
may be that university administrators perceive that accountability policies will potentially
have a major impact on their institutions at some point in the near future, even if they are not
very effective right now. Given the highly charged political rhetoric that has surrounded
these policies, universities may feel that they need to at least give an appearance of
doing something proactive, lest their political principals get even more upset and adopt
an aggressive accountability policy in the years ahead. This may also help explain the dif-
ferential impacts of performance funding across institutional types. Research universities
are often the most visible institutions in the state, and thus, they may feel greater pressure
from state policymakers to demonstrate a renewed commitment to undergraduate educa-
tion. Additionally, the fact that these policies have indeed impacted institutional priorities
despite their limited scope suggests that future performance-funding efforts might have
substantial effects on administrative behavior if policymakers are able to connect more
meaningful incentives to various metrics of performance.
Finally, there are considerable variations in the nature and content of the performance-
funding policies that states have adopted. For example, some states such as Tennessee and
Pennsylvania have developed performance-funding structures that have been lauded as en-
couraging excellence while maintaining differentiation between institutions with varied
missions and student populations. By comparison, other states, like South Carolina, have
been criticized for adopting benchmarks that are so easily attainable as to pose no real threat
to university budgets (Aldeman and Carey 2009; Zumeta 2001). Understanding the ways in
which these differences matter is beyond the scope of the current article but remains a task
that warrants considerable attention in the future. As we move forward, these differences in
policy design are likely to play a central role in the debate regarding accountability reform
and performance funding.
Performance-based accountability is predicated on a causal logic that requires
administrators and institutions to alter behavior and activities in ways that improve
student outcomes. Although there has been considerable attention paid to the potential
implications of these policies and to the ways in which they represent a shift in oversight
relationships between higher education and state governments, there has been little
empirical work to investigate the impacts that these policies have on either management
or student outcomes. This articlemarks an initial step toward building a better understanding
of the ways that these policies impact management and institutions. The findings,
which suggest that performance-funding policies have generally been ineffective in
their attempts to influence either state budget arrangements or institutional spending pref-
erences, highlight the need to better understand the mechanisms by which accountability
operates.
Rabovsky Accountability in Higher Education 23
policies that effectively punish those institutions that are underperforming may actually
work to undercut progress toward improving student outcomes and alleviating achievement
gaps. Rather than responding with desired shifts in administrative priorities (i.e., smaller
class sizes and more full-time faculty who are heavily involved in undergraduate educa-
tion), institutions may instead react to these policies by simply raising admissions criteria
and reducing access for at-risk students (Fryar 2011).
Second, although performance-funding policies do not appear to have dramatically
altered institutional spending priorities, it is interesting to note that they had some minimal
influence. If these policies do not effectively restructure financial incentives (as the findings
from stage one indicate), why do institutions respond to them at all? One explanation
may be that university administrators perceive that accountability policies will potentially
have a major impact on their institutions at some point in the near future, even if they are not
very effective right now. Given the highly charged political rhetoric that has surrounded
these policies, universities may feel that they need to at least give an appearance of
doing something proactive, lest their political principals get even more upset and adopt
an aggressive accountability policy in the years ahead. This may also help explain the dif-
ferential impacts of performance funding across institutional types. Research universities
are often the most visible institutions in the state, and thus, they may feel greater pressure
from state policymakers to demonstrate a renewed commitment to undergraduate educa-
tion. Additionally, the fact that these policies have indeed impacted institutional priorities
despite their limited scope suggests that future performance-funding efforts might have
substantial effects on administrative behavior if policymakers are able to connect more
meaningful incentives to various metrics of performance.
Finally, there are considerable variations in the nature and content of the performance-
funding policies that states have adopted. For example, some states such as Tennessee and
Pennsylvania have developed performance-funding structures that have been lauded as en-
couraging excellence while maintaining differentiation between institutions with varied
missions and student populations. By comparison, other states, like South Carolina, have
been criticized for adopting benchmarks that are so easily attainable as to pose no real threat
to university budgets (Aldeman and Carey 2009; Zumeta 2001). Understanding the ways in
which these differences matter is beyond the scope of the current article but remains a task
that warrants considerable attention in the future. As we move forward, these differences in
policy design are likely to play a central role in the debate regarding accountability reform
and performance funding.
Performance-based accountability is predicated on a causal logic that requires
administrators and institutions to alter behavior and activities in ways that improve
student outcomes. Although there has been considerable attention paid to the potential
implications of these policies and to the ways in which they represent a shift in oversight
relationships between higher education and state governments, there has been little
empirical work to investigate the impacts that these policies have on either management
or student outcomes. This articlemarks an initial step toward building a better understanding
of the ways that these policies impact management and institutions. The findings,
which suggest that performance-funding policies have generally been ineffective in
their attempts to influence either state budget arrangements or institutional spending pref-
erences, highlight the need to better understand the mechanisms by which accountability
operates.
Rabovsky Accountability in Higher Education 23
Ultimately, the goal behind performance initiatives is to improve the educational
experience for students so that they emerge from college with a degree that adequately
prepares them for the challenges of the modern economy. With this in mind, it is vitally
important that policymakers pay more attention to the causal linkages between policy de-
sign and administrative responses as they seek to devise improved accountability structures
and that scholars invest greater resources to empirically investigate these connections as
they seek to understand governance and organizational performance.
REFERENCES
Abernathy Scott Franklin. 2007. No child left behind and the public schools. Ann Arbor, MI: Univ. of
Michigan Press.
Aldeman, Chad, and Kevin Carey. 2009. Ready to assemble: Grading state higher education account-
ability systems. Washington, DC: Education Sector.
Archibald, Robert, and David Feldman. 2008. Explaining increases in higher education costs. The Journal
of Higher Education 79:268–95.
Banta, Trudy W., Linda B. Rudolph, Janice Van Dyke, and Homer S. Fisher. 1996. Performance funding
comes of age in tennessee. The Journal of Higher Education 67:23–45.
Beck, Nathaniel, and Jonathan N. Katz. 1995. What to do (and not to do) with time-series cross-section
data. The American Political Science Review 89:634–47.
Behn, Robert D. 2003. Why measure performance? Different purposes require different measures. Public
Administration Review 63:586–606.
Booher-Jennings, Jennifer. 2005. Below the bubble: ‘Educational Triage’ and the Texas accountability
system. American Educational Research Journal 42:231–68.
Burke, Joseph C. 2001. Paying for performance in public higher education. In Quicker, better, cheaper?
Managing performance in American government, ed. Dan Forsythe, 417–51. Albany, NY: Rock-
efeller Institute.
Burke, Joseph C. 2002. Funding public colleges and universities for performance: Popularity, problems,
and prospects. Albany, NY: Rockefeller Institute.
Burke, Joseph C., and Andreea M. Serban. 1998. State synopses of performance funding programs. New
Directions for Institutional Research 25:25–48.
Burke, Joseph C., and Henrik P. Minassians. 2003. Performance reporting: ‘‘Real’’ accountability or
accountability ‘‘lite’’? Albany, NY: Rockefeller Institute.
Carey, Kevin. 2008.Graduation rate watch: Making minority student success a priority. Washington, DC:
Education Sector.
Casper, Cheryl A., and Myron S. Henry. 2001. Developing performance-oriented models for university
resource allocation. Research in Higher Education 42:353–76.
Chubb, John E., and Terry M. Moe. 1990. Politics, markets, and America’s schools. Washington, DC:
Brookings Institution.
Complete College America. 2010a. The path forward. http://www.completecollege.org/path_forward/.
Complete College America. 2010b. The alliance of states. http://www.completecollege.org/alliance_of_
states/.
Dougherty, Kevin J., and Rebecca S. Natow. 2009. The demise of higher education performance funding
systems in three states. CCRC Working Paper No.17, Community College Research Center,
Teachers College, Columbia University. http://www.eric.ed.gov/ERICWebPortal/contentdelivery/
servlet/ERICServlet?accno5ED505707.
Dougherty, Kevin J., Rebecca S. Natow, Rachel J. Hare, and Blanca E. Vega. 2010. The political origins of
state-level performance funding for higher education: The cases of Florida, Illinois, Missouri, South
Carolina, Tennessee, and Washington. New York, NY: Community College Research Center,
Teachers College, Columbia Univ.
24 Journal of Public Administration Research and Theory

Journal of Public Administration Research and Theory 698
Ultimately, the goal behind performance initiatives is to improve the educational
experience for students so that they emerge from college with a degree that adequately
prepares them for the challenges of the modern economy. With this in mind, it is vitally
important that policymakers pay more attention to the causal linkages between policy de-
sign and administrative responses as they seek to devise improved accountability structures
and that scholars invest greater resources to empirically investigate these connections as
they seek to understand governance and organizational performance.
REFERENCES
Abernathy Scott Franklin. 2007. No child left behind and the public schools. Ann Arbor, MI: Univ. of
Michigan Press.
Aldeman, Chad, and Kevin Carey. 2009. Ready to assemble: Grading state higher education account-
ability systems. Washington, DC: Education Sector.
Archibald, Robert, and David Feldman. 2008. Explaining increases in higher education costs. The Journal
of Higher Education 79:268–95.
Banta, Trudy W., Linda B. Rudolph, Janice Van Dyke, and Homer S. Fisher. 1996. Performance funding
comes of age in tennessee. The Journal of Higher Education 67:23–45.
Beck, Nathaniel, and Jonathan N. Katz. 1995. What to do (and not to do) with time-series cross-section
data. The American Political Science Review 89:634–47.
Behn, Robert D. 2003. Why measure performance? Different purposes require different measures. Public
Administration Review 63:586–606.
Booher-Jennings, Jennifer. 2005. Below the bubble: ‘Educational Triage’ and the Texas accountability
system. American Educational Research Journal 42:231–68.
Burke, Joseph C. 2001. Paying for performance in public higher education. In Quicker, better, cheaper?
Managing performance in American government, ed. Dan Forsythe, 417–51. Albany, NY: Rock-
efeller Institute.
Burke, Joseph C. 2002. Funding public colleges and universities for performance: Popularity, problems,
and prospects. Albany, NY: Rockefeller Institute.
Burke, Joseph C., and Andreea M. Serban. 1998. State synopses of performance funding programs. New
Directions for Institutional Research 25:25–48.
Burke, Joseph C., and Henrik P. Minassians. 2003. Performance reporting: ‘‘Real’’ accountability or
accountability ‘‘lite’’? Albany, NY: Rockefeller Institute.
Carey, Kevin. 2008.Graduation rate watch: Making minority student success a priority. Washington, DC:
Education Sector.
Casper, Cheryl A., and Myron S. Henry. 2001. Developing performance-oriented models for university
resource allocation. Research in Higher Education 42:353–76.
Chubb, John E., and Terry M. Moe. 1990. Politics, markets, and America’s schools. Washington, DC:
Brookings Institution.
Complete College America. 2010a. The path forward. http://www.completecollege.org/path_forward/.
Complete College America. 2010b. The alliance of states. http://www.completecollege.org/alliance_of_
states/.
Dougherty, Kevin J., and Rebecca S. Natow. 2009. The demise of higher education performance funding
systems in three states. CCRC Working Paper No.17, Community College Research Center,
Teachers College, Columbia University. http://www.eric.ed.gov/ERICWebPortal/contentdelivery/
servlet/ERICServlet?accno5ED505707.
Dougherty, Kevin J., Rebecca S. Natow, Rachel J. Hare, and Blanca E. Vega. 2010. The political origins of
state-level performance funding for higher education: The cases of Florida, Illinois, Missouri, South
Carolina, Tennessee, and Washington. New York, NY: Community College Research Center,
Teachers College, Columbia Univ.
24 Journal of Public Administration Research and Theory
Dougherty, Kevin J., Rebecca S. Natow, and Vega Blanca. Forthcoming. 2012. Popular but unstable:
Explaining why state performance funding systems in the United States often do not persist.
Teachers College Record 114. http://www.tcrecord.org/Content.asp?ContentId516313.
Doyle, William R., and Brian Noland. ‘‘Does Performance Funding Make a Difference for Students?’’
Paper presented at the Association for Institutional Research Annual Meeting, Chicago, IL, May
2006.
Ehrenberg, Ronald G. ed. 2006.What’s happening to public education?Westport, CT: Praeger Publishers.
Figlio, David N., and Lawrence S. Getzler. 2002. Accountability, ability and disability: Gaming the
system? NBER Working Paper.
Fryar, Alisa Hicklin. ‘‘The Disparate Impacts of Accountability—Searching for Causal Mechanisms.’’
Paper presented at the 11th Public Management Research Conference, Syracuse, NY, 2011. http://
www.maxwell.syr.edu/uploadedFiles/conferences/pmrc/Files/HicklinFryar_TheDisparateImpactsof
AccountabilitySearchingforCausalMechanisms.pdf.
Gansemer-Topf, Ann, and John Schuh. 2006. Institutional selectivity and institutional expenditures:
Examining organizational factors that contribute to retention and graduation. Research in Higher
Education 47:613–42.
Gilmour, John B., and David E. Lewis. 2006a. Assessing performance budgeting at OMB: The influence of
politics, performance, and program size. Journal of Public Administration Research and Theory
16:169–86.
Gilmour, John B., and David E. Lewis. 2006b. Does performance budgeting work? An examination
of the office of management and budget’s PART scores. Public Administration Review 66:742–52.
Greene, William H. 2003. Econometric analysis, 5th ed. Upper Saddle River, NJ: Prentice Hall.
Grunig, Stephen D. 1997. Research, reputation, and resources: The effect of research activity on per-
ceptions of undergraduate education and institutional resource acquisition. Journal of Higher
Education 68:17–52.
Heilig, Julian Vasquez., and Linda Darling-Hammond. 2008. Accountability Texas-style: The progress
and learning of urban minority students in a high-stakes testing context. Educational Evaluation and
Policy Analysis 30:75–110.
Huisman, Jeroen, and Jan Currie. 2004. Accountability in higher education: Bridge over troubled water?
Higher Education 48:529–51.
Hunt, Lester H. 2008. Grade inflation: Academic standards in higher education. New York, NY: State
Univ. of New York Press.
Jacob, Brian A. 2005. Accountability, incentives and behavior: The impact of high-stakes testing in the
Chicago public schools. Journal of Public Economics 89:761–96.
Jacob, Brian A., and Steven D. Levitt. 2003. Rotten apples: An investigation of the prevalence and
predictors of teacher cheating. Quarterly Journal of Economics 118:843–77.
Joyce, Phillip G. 1999. Performance-based budgeting. In Handbook of government budgeting, ed. Roy T.
Meyers, 597–619. San Francisco, CA: Jossey-Bass.
Kelly, Andrew P., Mark Schneider, and Kevin Carey. 2010. Rising to the challenge: Hispanic college
graduation rates as a national priority. Washington, DC: American Enterprise Institute for Public
Policy Research.
Kettl, Donald F. 2000. The global public management revolution: A report on the transformation of
governance. Washington, DC: Brookings Institution.
King, Roger. 2007. Governance and accountability in the higher education regulatory state. Higher
Education 53:411–30.
Liefner, Ingo. 2003. Funding, resource allocation, and performance in higher education systems. Higher
Education 46:469–89.
Long, Edward, and Aimee L. Franklin. 2004. The paradox of implementing the government performance
and results act: Top-down direction for bottom-up implementation. Public Administration Review
64:309–19.
McLendon, Michael K., James C. Hearn, and Christine G. Mokher. 2009. Partisans, professionals,
and power: The role of political factors in state higher education funding. The Journal of Higher
Education 80:686–713.
Rabovsky Accountability in Higher Education 25
McLendon, Michael K., James C. Hearn, and Steven B. Deaton. 2006. Called to account: Analyzing the
origins and spread of state performance-accountability policies for higher education. Educational
Evaluation and Policy Analysis 28:1–24.
Melkers, Julia E., and Katherine G. Willoughby. 1998. The state of the states: Performance-based
budgeting requirements in 47 out of 50. Public Administration Review 58:66–73.
Moynihan, Donald P. 2008. The dynamics of performance management. Washington, DC: Georgetown
Univ. Press.
Mumper, Michael. 2003. The future of college access: The declining role of public higher education in
promoting equal opportunity. The Annals of the American Academy of Political and Social Science
585:97–117.
Neill, Monty. 2003. Leaving children behind: How no child left behind will fail our children. The Phi Delta
Kappan 85:225–28.
Osborne, David E., and Ted Gaebler. 1992. Reinventing government: How the entrepreneurial spirit is
transforming the public sector. Reading, MA: Addison-Wesley Pub.
Radin, Beryl A. 2000. The government performance and results act and the tradition of federal man-
agement reform: Square pegs in round holes? Journal of Public Administration Research and
Theory 10:111–35.
Radin, Beryl A. 2006. Challenging the performance movement: Accountability, complexity, and demo-
cratic values. Washington, DC: Georgetown Univ. Press.
Robst, John. 2001. Cost efficiency in public higher education institutions. The Journal of Higher Edu-
cation 72:730–50.
Ryan, John F. 2004. The relationship between institutional expenditures and degree attainment at bac-
calaureate colleges. Research in Higher Education 45:97–114.
Sanford, Thomas, and James M. Hunter. ‘‘Impact of Performance on Retention and Graduation Rates.’’
Paper presented at the 2010 Association for the Study of Higher Education Conference, Indianapolis,
IN, November 2006.
Smith, Peter. 1990. The use of performance indicators in the public sector. Journal of the Royal Statistical
Society. Series A (Statistics in Society) 153:53–72.
Volkwein, J. Fredericks, and David Tandberg. 2008. Measuring up: Examining the connections among
state structural characteristics, regulatory practices, and performance. Research in Higher Education
49:180–97.
Weerts, David J., and Justin M. Ronca. 2006. Examining differences in state support for higher education:
A comparative study of state appropriations for research I universities. The Journal of Higher
Education 77:935–67.
Weisbrod, Burton A., Jeffrey P. Ballou, and Evelyn D. Asch. 2008.Mission and money: Understanding the
university, 1st ed. Cambridge, MA: Cambridge Univ. Press.
Wellman, Jane V. 2001. Assessing state accountability systems. Change 33:46–52.
Wilson, James Q. 1989. Bureaucracy: What government agencies do and why they do it. New York, NY:
Basic Books.
Wooldridge, JeffreyM. 2002. Econometric analysis of cross section and panel data. Cambridge, MA:MIT
Press.
Zhang, Liang. 2009. Does state funding affect graduation rates at public four-year colleges and
universities? Educational Policy 23:714–31.
Zumeta, William. 2001. Public policy and accountability in higher education: Lessons from the past and
present for the new millennium. In The states and public higher education policy: Affordability,
access, and accountability, ed. Donald E. Heller, 155–97. Baltimore, MD: Johns Hopkins Univ.
Press.
26 Journal of Public Administration Research and Theory

Rabovsky Accountability in Higher Education 699
Ultimately, the goal behind performance initiatives is to improve the educational
experience for students so that they emerge from college with a degree that adequately
prepares them for the challenges of the modern economy. With this in mind, it is vitally
important that policymakers pay more attention to the causal linkages between policy de-
sign and administrative responses as they seek to devise improved accountability structures
and that scholars invest greater resources to empirically investigate these connections as
they seek to understand governance and organizational performance.
REFERENCES
Abernathy Scott Franklin. 2007. No child left behind and the public schools. Ann Arbor, MI: Univ. of
Michigan Press.
Aldeman, Chad, and Kevin Carey. 2009. Ready to assemble: Grading state higher education account-
ability systems. Washington, DC: Education Sector.
Archibald, Robert, and David Feldman. 2008. Explaining increases in higher education costs. The Journal
of Higher Education 79:268–95.
Banta, Trudy W., Linda B. Rudolph, Janice Van Dyke, and Homer S. Fisher. 1996. Performance funding
comes of age in tennessee. The Journal of Higher Education 67:23–45.
Beck, Nathaniel, and Jonathan N. Katz. 1995. What to do (and not to do) with time-series cross-section
data. The American Political Science Review 89:634–47.
Behn, Robert D. 2003. Why measure performance? Different purposes require different measures. Public
Administration Review 63:586–606.
Booher-Jennings, Jennifer. 2005. Below the bubble: ‘Educational Triage’ and the Texas accountability
system. American Educational Research Journal 42:231–68.
Burke, Joseph C. 2001. Paying for performance in public higher education. In Quicker, better, cheaper?
Managing performance in American government, ed. Dan Forsythe, 417–51. Albany, NY: Rock-
efeller Institute.
Burke, Joseph C. 2002. Funding public colleges and universities for performance: Popularity, problems,
and prospects. Albany, NY: Rockefeller Institute.
Burke, Joseph C., and Andreea M. Serban. 1998. State synopses of performance funding programs. New
Directions for Institutional Research 25:25–48.
Burke, Joseph C., and Henrik P. Minassians. 2003. Performance reporting: ‘‘Real’’ accountability or
accountability ‘‘lite’’? Albany, NY: Rockefeller Institute.
Carey, Kevin. 2008.Graduation rate watch: Making minority student success a priority. Washington, DC:
Education Sector.
Casper, Cheryl A., and Myron S. Henry. 2001. Developing performance-oriented models for university
resource allocation. Research in Higher Education 42:353–76.
Chubb, John E., and Terry M. Moe. 1990. Politics, markets, and America’s schools. Washington, DC:
Brookings Institution.
Complete College America. 2010a. The path forward. http://www.completecollege.org/path_forward/.
Complete College America. 2010b. The alliance of states. http://www.completecollege.org/alliance_of_
states/.
Dougherty, Kevin J., and Rebecca S. Natow. 2009. The demise of higher education performance funding
systems in three states. CCRC Working Paper No.17, Community College Research Center,
Teachers College, Columbia University. http://www.eric.ed.gov/ERICWebPortal/contentdelivery/
servlet/ERICServlet?accno5ED505707.
Dougherty, Kevin J., Rebecca S. Natow, Rachel J. Hare, and Blanca E. Vega. 2010. The political origins of
state-level performance funding for higher education: The cases of Florida, Illinois, Missouri, South
Carolina, Tennessee, and Washington. New York, NY: Community College Research Center,
Teachers College, Columbia Univ.
24 Journal of Public Administration Research and Theory
Dougherty, Kevin J., Rebecca S. Natow, and Vega Blanca. Forthcoming. 2012. Popular but unstable:
Explaining why state performance funding systems in the United States often do not persist.
Teachers College Record 114. http://www.tcrecord.org/Content.asp?ContentId516313.
Doyle, William R., and Brian Noland. ‘‘Does Performance Funding Make a Difference for Students?’’
Paper presented at the Association for Institutional Research Annual Meeting, Chicago, IL, May
2006.
Ehrenberg, Ronald G. ed. 2006.What’s happening to public education?Westport, CT: Praeger Publishers.
Figlio, David N., and Lawrence S. Getzler. 2002. Accountability, ability and disability: Gaming the
system? NBER Working Paper.
Fryar, Alisa Hicklin. ‘‘The Disparate Impacts of Accountability—Searching for Causal Mechanisms.’’
Paper presented at the 11th Public Management Research Conference, Syracuse, NY, 2011. http://
www.maxwell.syr.edu/uploadedFiles/conferences/pmrc/Files/HicklinFryar_TheDisparateImpactsof
AccountabilitySearchingforCausalMechanisms.pdf.
Gansemer-Topf, Ann, and John Schuh. 2006. Institutional selectivity and institutional expenditures:
Examining organizational factors that contribute to retention and graduation. Research in Higher
Education 47:613–42.
Gilmour, John B., and David E. Lewis. 2006a. Assessing performance budgeting at OMB: The influence of
politics, performance, and program size. Journal of Public Administration Research and Theory
16:169–86.
Gilmour, John B., and David E. Lewis. 2006b. Does performance budgeting work? An examination
of the office of management and budget’s PART scores. Public Administration Review 66:742–52.
Greene, William H. 2003. Econometric analysis, 5th ed. Upper Saddle River, NJ: Prentice Hall.
Grunig, Stephen D. 1997. Research, reputation, and resources: The effect of research activity on per-
ceptions of undergraduate education and institutional resource acquisition. Journal of Higher
Education 68:17–52.
Heilig, Julian Vasquez., and Linda Darling-Hammond. 2008. Accountability Texas-style: The progress
and learning of urban minority students in a high-stakes testing context. Educational Evaluation and
Policy Analysis 30:75–110.
Huisman, Jeroen, and Jan Currie. 2004. Accountability in higher education: Bridge over troubled water?
Higher Education 48:529–51.
Hunt, Lester H. 2008. Grade inflation: Academic standards in higher education. New York, NY: State
Univ. of New York Press.
Jacob, Brian A. 2005. Accountability, incentives and behavior: The impact of high-stakes testing in the
Chicago public schools. Journal of Public Economics 89:761–96.
Jacob, Brian A., and Steven D. Levitt. 2003. Rotten apples: An investigation of the prevalence and
predictors of teacher cheating. Quarterly Journal of Economics 118:843–77.
Joyce, Phillip G. 1999. Performance-based budgeting. In Handbook of government budgeting, ed. Roy T.
Meyers, 597–619. San Francisco, CA: Jossey-Bass.
Kelly, Andrew P., Mark Schneider, and Kevin Carey. 2010. Rising to the challenge: Hispanic college
graduation rates as a national priority. Washington, DC: American Enterprise Institute for Public
Policy Research.
Kettl, Donald F. 2000. The global public management revolution: A report on the transformation of
governance. Washington, DC: Brookings Institution.
King, Roger. 2007. Governance and accountability in the higher education regulatory state. Higher
Education 53:411–30.
Liefner, Ingo. 2003. Funding, resource allocation, and performance in higher education systems. Higher
Education 46:469–89.
Long, Edward, and Aimee L. Franklin. 2004. The paradox of implementing the government performance
and results act: Top-down direction for bottom-up implementation. Public Administration Review
64:309–19.
McLendon, Michael K., James C. Hearn, and Christine G. Mokher. 2009. Partisans, professionals,
and power: The role of political factors in state higher education funding. The Journal of Higher
Education 80:686–713.
Rabovsky Accountability in Higher Education 25
Dougherty, Kevin J., Rebecca S. Natow, and Vega Blanca. Forthcoming. 2012. Popular but unstable:
Explaining why state performance funding systems in the United States often do not persist.
Teachers College Record 114. http://www.tcrecord.org/Content.asp?ContentId516313.
Doyle, William R., and Brian Noland. ‘‘Does Performance Funding Make a Difference for Students?’’
Paper presented at the Association for Institutional Research Annual Meeting, Chicago, IL, May
2006.
Ehrenberg, Ronald G. ed. 2006.What’s happening to public education?Westport, CT: Praeger Publishers.
Figlio, David N., and Lawrence S. Getzler. 2002. Accountability, ability and disability: Gaming the
system? NBER Working Paper.
Fryar, Alisa Hicklin. ‘‘The Disparate Impacts of Accountability—Searching for Causal Mechanisms.’’
Paper presented at the 11th Public Management Research Conference, Syracuse, NY, 2011. http://
www.maxwell.syr.edu/uploadedFiles/conferences/pmrc/Files/HicklinFryar_TheDisparateImpactsof
AccountabilitySearchingforCausalMechanisms.pdf.
Gansemer-Topf, Ann, and John Schuh. 2006. Institutional selectivity and institutional expenditures:
Examining organizational factors that contribute to retention and graduation. Research in Higher
Education 47:613–42.
Gilmour, John B., and David E. Lewis. 2006a. Assessing performance budgeting at OMB: The influence of
politics, performance, and program size. Journal of Public Administration Research and Theory
16:169–86.
Gilmour, John B., and David E. Lewis. 2006b. Does performance budgeting work? An examination
of the office of management and budget’s PART scores. Public Administration Review 66:742–52.
Greene, William H. 2003. Econometric analysis, 5th ed. Upper Saddle River, NJ: Prentice Hall.
Grunig, Stephen D. 1997. Research, reputation, and resources: The effect of research activity on per-
ceptions of undergraduate education and institutional resource acquisition. Journal of Higher
Education 68:17–52.
Heilig, Julian Vasquez., and Linda Darling-Hammond. 2008. Accountability Texas-style: The progress
and learning of urban minority students in a high-stakes testing context. Educational Evaluation and
Policy Analysis 30:75–110.
Huisman, Jeroen, and Jan Currie. 2004. Accountability in higher education: Bridge over troubled water?
Higher Education 48:529–51.
Hunt, Lester H. 2008. Grade inflation: Academic standards in higher education. New York, NY: State
Univ. of New York Press.
Jacob, Brian A. 2005. Accountability, incentives and behavior: The impact of high-stakes testing in the
Chicago public schools. Journal of Public Economics 89:761–96.
Jacob, Brian A., and Steven D. Levitt. 2003. Rotten apples: An investigation of the prevalence and
predictors of teacher cheating. Quarterly Journal of Economics 118:843–77.
Joyce, Phillip G. 1999. Performance-based budgeting. In Handbook of government budgeting, ed. Roy T.
Meyers, 597–619. San Francisco, CA: Jossey-Bass.
Kelly, Andrew P., Mark Schneider, and Kevin Carey. 2010. Rising to the challenge: Hispanic college
graduation rates as a national priority. Washington, DC: American Enterprise Institute for Public
Policy Research.
Kettl, Donald F. 2000. The global public management revolution: A report on the transformation of
governance. Washington, DC: Brookings Institution.
King, Roger. 2007. Governance and accountability in the higher education regulatory state. Higher
Education 53:411–30.
Liefner, Ingo. 2003. Funding, resource allocation, and performance in higher education systems. Higher
Education 46:469–89.
Long, Edward, and Aimee L. Franklin. 2004. The paradox of implementing the government performance
and results act: Top-down direction for bottom-up implementation. Public Administration Review
64:309–19.
McLendon, Michael K., James C. Hearn, and Christine G. Mokher. 2009. Partisans, professionals,
and power: The role of political factors in state higher education funding. The Journal of Higher
Education 80:686–713.
Rabovsky Accountability in Higher Education 25
McLendon, Michael K., James C. Hearn, and Steven B. Deaton. 2006. Called to account: Analyzing the
origins and spread of state performance-accountability policies for higher education. Educational
Evaluation and Policy Analysis 28:1–24.
Melkers, Julia E., and Katherine G. Willoughby. 1998. The state of the states: Performance-based
budgeting requirements in 47 out of 50. Public Administration Review 58:66–73.
Moynihan, Donald P. 2008. The dynamics of performance management. Washington, DC: Georgetown
Univ. Press.
Mumper, Michael. 2003. The future of college access: The declining role of public higher education in
promoting equal opportunity. The Annals of the American Academy of Political and Social Science
585:97–117.
Neill, Monty. 2003. Leaving children behind: How no child left behind will fail our children. The Phi Delta
Kappan 85:225–28.
Osborne, David E., and Ted Gaebler. 1992. Reinventing government: How the entrepreneurial spirit is
transforming the public sector. Reading, MA: Addison-Wesley Pub.
Radin, Beryl A. 2000. The government performance and results act and the tradition of federal man-
agement reform: Square pegs in round holes? Journal of Public Administration Research and
Theory 10:111–35.
Radin, Beryl A. 2006. Challenging the performance movement: Accountability, complexity, and demo-
cratic values. Washington, DC: Georgetown Univ. Press.
Robst, John. 2001. Cost efficiency in public higher education institutions. The Journal of Higher Edu-
cation 72:730–50.
Ryan, John F. 2004. The relationship between institutional expenditures and degree attainment at bac-
calaureate colleges. Research in Higher Education 45:97–114.
Sanford, Thomas, and James M. Hunter. ‘‘Impact of Performance on Retention and Graduation Rates.’’
Paper presented at the 2010 Association for the Study of Higher Education Conference, Indianapolis,
IN, November 2006.
Smith, Peter. 1990. The use of performance indicators in the public sector. Journal of the Royal Statistical
Society. Series A (Statistics in Society) 153:53–72.
Volkwein, J. Fredericks, and David Tandberg. 2008. Measuring up: Examining the connections among
state structural characteristics, regulatory practices, and performance. Research in Higher Education
49:180–97.
Weerts, David J., and Justin M. Ronca. 2006. Examining differences in state support for higher education:
A comparative study of state appropriations for research I universities. The Journal of Higher
Education 77:935–67.
Weisbrod, Burton A., Jeffrey P. Ballou, and Evelyn D. Asch. 2008.Mission and money: Understanding the
university, 1st ed. Cambridge, MA: Cambridge Univ. Press.
Wellman, Jane V. 2001. Assessing state accountability systems. Change 33:46–52.
Wilson, James Q. 1989. Bureaucracy: What government agencies do and why they do it. New York, NY:
Basic Books.
Wooldridge, JeffreyM. 2002. Econometric analysis of cross section and panel data. Cambridge, MA:MIT
Press.
Zhang, Liang. 2009. Does state funding affect graduation rates at public four-year colleges and
universities? Educational Policy 23:714–31.
Zumeta, William. 2001. Public policy and accountability in higher education: Lessons from the past and
present for the new millennium. In The states and public higher education policy: Affordability,
access, and accountability, ed. Donald E. Heller, 155–97. Baltimore, MD: Johns Hopkins Univ.
Press.
26 Journal of Public Administration Research and Theory

Journal of Public Administration Research and Theory 700
McLendon, Michael K., James C. Hearn, and Steven B. Deaton. 2006. Called to account: Analyzing the
origins and spread of state performance-accountability policies for higher education. Educational
Evaluation and Policy Analysis 28:1–24.
Melkers, Julia E., and Katherine G. Willoughby. 1998. The state of the states: Performance-based
budgeting requirements in 47 out of 50. Public Administration Review 58:66–73.
Moynihan, Donald P. 2008. The dynamics of performance management. Washington, DC: Georgetown
Univ. Press.
Mumper, Michael. 2003. The future of college access: The declining role of public higher education in
promoting equal opportunity. The Annals of the American Academy of Political and Social Science
585:97–117.
Neill, Monty. 2003. Leaving children behind: How no child left behind will fail our children. The Phi Delta
Kappan 85:225–28.
Osborne, David E., and Ted Gaebler. 1992. Reinventing government: How the entrepreneurial spirit is
transforming the public sector. Reading, MA: Addison-Wesley Pub.
Radin, Beryl A. 2000. The government performance and results act and the tradition of federal man-
agement reform: Square pegs in round holes? Journal of Public Administration Research and
Theory 10:111–35.
Radin, Beryl A. 2006. Challenging the performance movement: Accountability, complexity, and demo-
cratic values. Washington, DC: Georgetown Univ. Press.
Robst, John. 2001. Cost efficiency in public higher education institutions. The Journal of Higher Edu-
cation 72:730–50.
Ryan, John F. 2004. The relationship between institutional expenditures and degree attainment at bac-
calaureate colleges. Research in Higher Education 45:97–114.
Sanford, Thomas, and James M. Hunter. ‘‘Impact of Performance on Retention and Graduation Rates.’’
Paper presented at the 2010 Association for the Study of Higher Education Conference, Indianapolis,
IN, November 2006.
Smith, Peter. 1990. The use of performance indicators in the public sector. Journal of the Royal Statistical
Society. Series A (Statistics in Society) 153:53–72.
Volkwein, J. Fredericks, and David Tandberg. 2008. Measuring up: Examining the connections among
state structural characteristics, regulatory practices, and performance. Research in Higher Education
49:180–97.
Weerts, David J., and Justin M. Ronca. 2006. Examining differences in state support for higher education:
A comparative study of state appropriations for research I universities. The Journal of Higher
Education 77:935–67.
Weisbrod, Burton A., Jeffrey P. Ballou, and Evelyn D. Asch. 2008.Mission and money: Understanding the
university, 1st ed. Cambridge, MA: Cambridge Univ. Press.
Wellman, Jane V. 2001. Assessing state accountability systems. Change 33:46–52.
Wilson, James Q. 1989. Bureaucracy: What government agencies do and why they do it. New York, NY:
Basic Books.
Wooldridge, JeffreyM. 2002. Econometric analysis of cross section and panel data. Cambridge, MA:MIT
Press.
Zhang, Liang. 2009. Does state funding affect graduation rates at public four-year colleges and
universities? Educational Policy 23:714–31.
Zumeta, William. 2001. Public policy and accountability in higher education: Lessons from the past and
present for the new millennium. In The states and public higher education policy: Affordability,
access, and accountability, ed. Donald E. Heller, 155–97. Baltimore, MD: Johns Hopkins Univ.
Press.
26 Journal of Public Administration Research and Theory

Copyright of Journal of Public Administration Research & Theory is the property of Oxford University Press /
USA and its content may not be copied or emailed to multiple sites or posted to a listserv without the copyright
holder's express written permission. However, users may print, download, or email articles for individual use.