Account Profitability Discussion CBTG October 24, 2013.
23
Account Profitability Discussion CBTG October 24, 2013
-
Upload
owen-daniels -
Category
Documents
-
view
214 -
download
0
Transcript of Account Profitability Discussion CBTG October 24, 2013.

Account ProfitabilityDiscussion
CBTGOctober 24, 2013
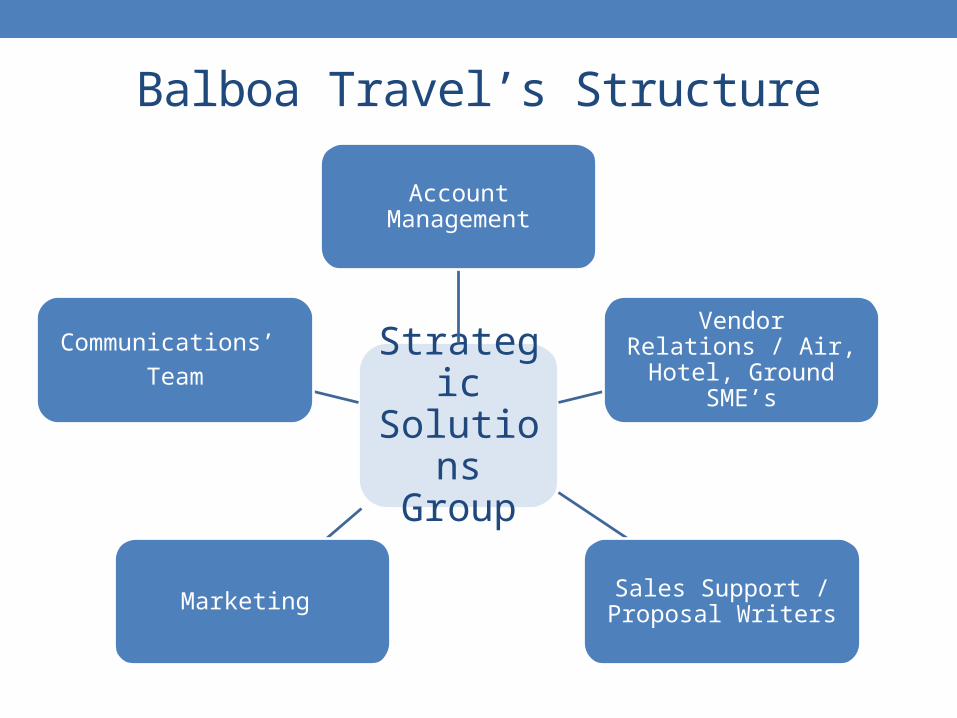
Balboa Travel’s Structure
Strategic Solutions
Group
Account Management
Vendor Relations / Air, Hotel, Ground SME’s
Sales Support / Proposal WritersMarketing
Communications’
Team
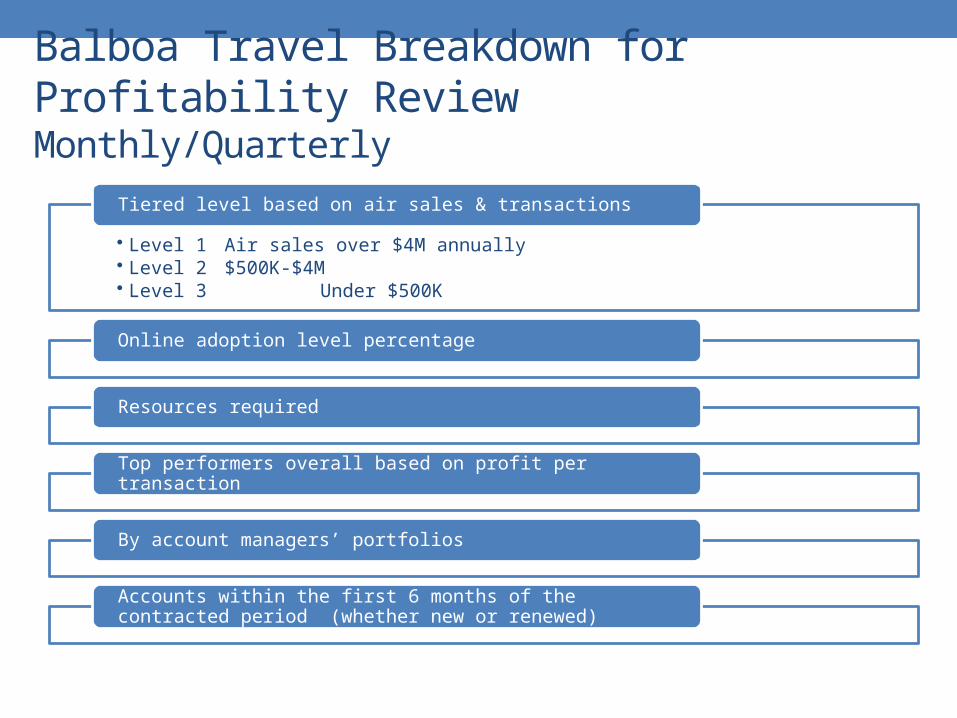
Balboa Travel Breakdown for Profitability Review Monthly/Quarterly
• Level 1 Air sales over $4M annually• Level 2 $500K-$4M• Level 3 Under $500K
Tiered level based on air sales & transactions
Online adoption level percentage
Resources required
Top performers overall based on profit per transaction
By account managers’ portfolios
Accounts within the first 6 months of the contracted period (whether new or renewed)
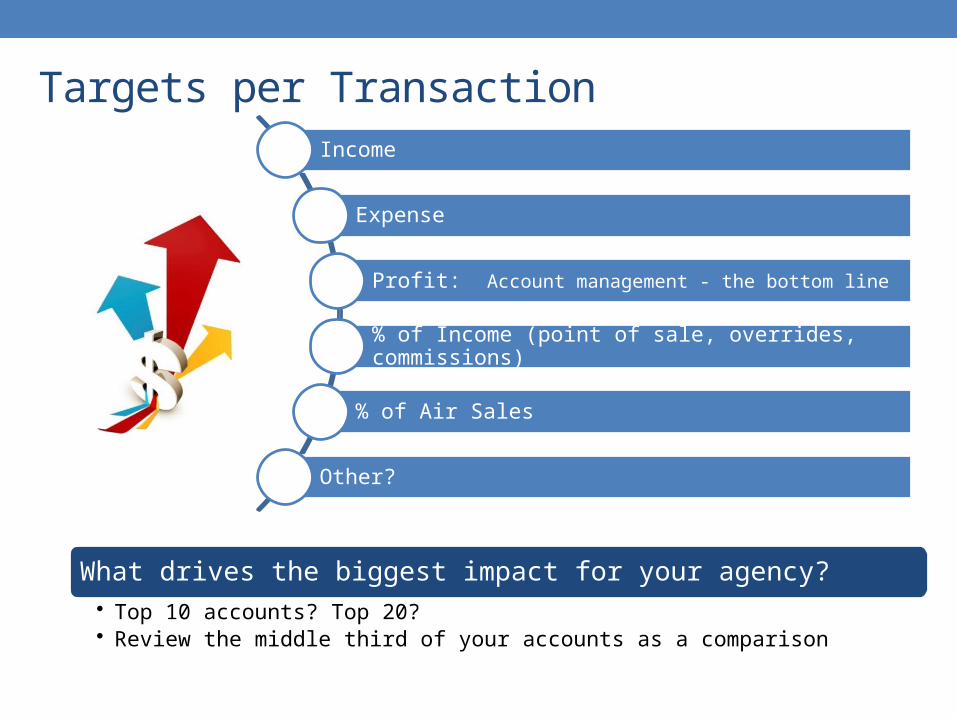
Targets per Transaction Income
Expense
Profit: Account management - the bottom line
% of Income (point of sale, overrides, commissions)
% of Air Sales
Other?
What drives the biggest impact for your agency? • Top 10 accounts? Top 20? • Review the middle third of your accounts as a comparison

ACCOUNT NETAMT NETTRX INCOME PER
TRX EXPENSE PER TRX
DIRECT MARGIN
DIRECT % OF INCOME
DIRECT % OF AIR SALES
DIRECT MARGIN /
TRX
GROSS MARGIN
% OF INCOME
% OF AIR
SALES
ADOPTION %
Short Form for high level analysis
Long Form for drill down Accuracy in allocations Problem areas or spikes / Impacts of new vendor programs Areas for future revenue opportunities Best practices / Upsell / Account management incentives
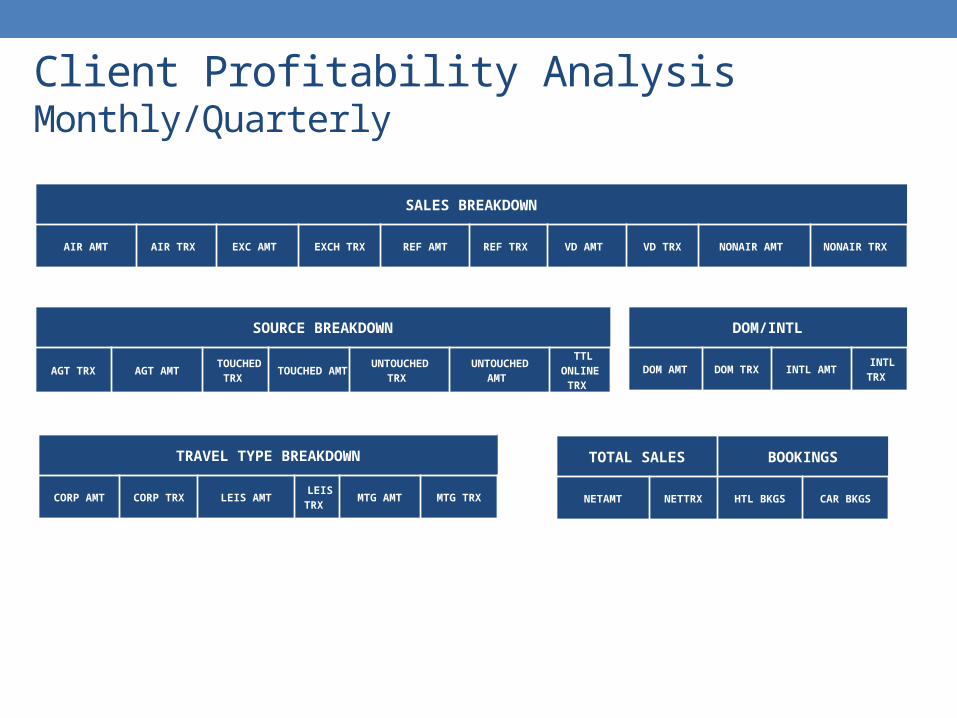
SALES BREAKDOWN
AIR AMT AIR TRX EXC AMT EXCH TRX REF AMT REF TRX VD AMT VD TRX NONAIR AMT NONAIR TRX
SOURCE BREAKDOWN
AGT TRX AGT AMT TOUCHED
TRX TOUCHED
AMT UNTOUCHED
TRX UNTOUCHED
AMT
TTL ONLINE
TRX
DOM/INTL
DOM AMT DOM TRX INTL AMT INTL TRX
TRAVEL TYPE BREAKDOWN
CORP AMT CORP TRX LEIS AMT LEIS TRX
MTG AMT MTG TRX
TOTAL SALES BOOKINGS
NETAMT NETTRX HTL BKGS CAR BKGS
Client Profitability AnalysisMonthly/Quarterly

PROFITABILITY
DIRECT MARGIN DIRECT % OF
INCOMEDIRECT % OF AIR
SALESDIRECT MARGIN /
TRX GROSS MARGIN % OF INCOME
% OF AIR SALES
ADOPTION %
EXPENSE BREAKDOWN
GDS EXP SB FEES 24HR SVC AGT LBR PRODUCT SOL TKTING / QUALITY
DATA SOL ACCT MGMT TOTAL
EXPENSE EXPENSE PER
TRX
INCOME BREAKDOWN
AIR COMM OTH COMM HTL COMM CAR COMM OVRD INCOME PER
TRX FEE INC SEG INC TTL INCOME
Client Profitability AnalysisMonthly/Quarterly

Long Term Clients
Considerations on Lower Profit Accounts
High Profile ClientsHigh Transaction
Clients Easy
Meeting & Group Travel
Right Vendor/GDS Mix
Right Geographical Area
Longer Contract Period
Incremental income vs. infrastructure

© 2013 Chambers Travel Group
Account ProfitabilityCBTG24 October 2013

© 2013 Chambers Travel Group
Name of who is presenting - Date
10
Senior Management Finance
Commercial Department
Business Management
Who, When, What & How
WHO

© 2013 Chambers Travel Group
Name of who is presenting - Date
11
• Finance, responsible for producing;− Daily Trading Figures
• Turnover / Volume / FE Income / Income per Transaction− Monthly Sales & Earnings Reports by Customer (Month & YTD
• Turnover / Volume / FE Income Fees, Comms & Markups− Produce monthly internal and Qtrly Client based Management Fee
Reconciliations• Senior Management, review
− Daily Figures on email• Week back view in Weekly Mgmt meeting
− Monthly review of Client Sales & Earnings lead by DOBM• Business Management, review
− Monthly Sales & Earnings by customer− Produce periodic Profitability Summary (Qtrly, Annually)− Present each month at SM meeting on portfolio
• Commercial− Advise on changes in supplier income and preferred suppliers
WHO

© 2013 Chambers Travel Group
Name of who is presenting - Date
Customer base
12
Preferred Suppliers
Opportunity
National/Multi-
National
Turnover & Volume
Strategic>£750K
SME<£750K
© 2013 Chambers Travel Group
Name of who is presenting - Date
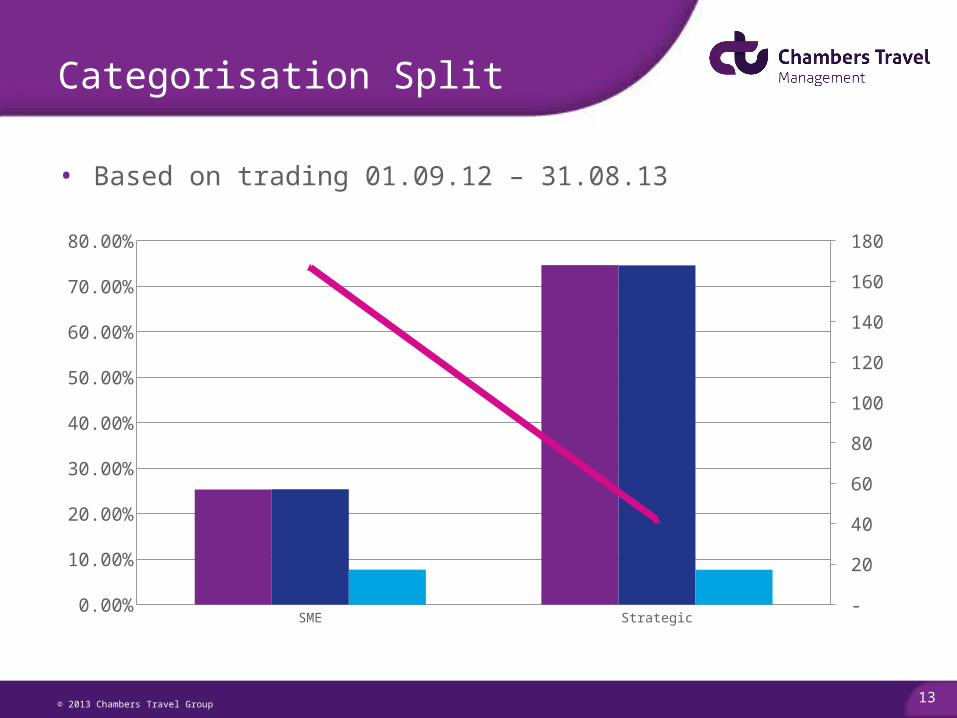
• Based on trading 01.09.12 – 31.08.13
Categorisation Split
13
SME Strategic SME Strategic
Sum of Full Year Trading
0.253288390162286 0.746711609837715
Sum Total In-come
0.253839038800887 0.746160961199113
Income as % of Turnover
0.0770273914304627 0.0768036180400272
# Clients 167 42
5.00%
25.00%
45.00%
65.00%
10
50
90
130
170

© 2013 Chambers Travel Group
Name of who is presenting - Date
Categorisation
14
Segment Turnover £ Categorisation
StrategicMulti-National AA>£2M A£751K - £2M B
SME
£501K - £750K C£251K - £500K D£50K - £250K E<£50K E-Touch

© 2013 Chambers Travel Group
Name of who is presenting - Date
15
Customer base - Split
<£50K per annum
£50K to £250k per
annum
£251K - £500K per
annum
£501K - £750K per
annum£751K - £2M per annum
>£2M per annum
MN Client
Customer Segmentation SME STRATEGICCategory Name E-Touch E D C B A AA
Number of Managed Customers 71 58 26 11 17 9 16% of Total Customers 34% 28% 13% 5% 8% 4% 8%
Apx Annualised Turnover of Category £1,724,331 £6,318,826 £8,447,538 £6,905,859 £20,198,464 £33,078,706 £15,895,686
% of Total Customer Turnover 2% 7% 9% 7% 22% 36% 17%Apx Annualised FE Income £111,633 £459,929 £584,740 £630,328 £1,631,441 £2,587,911 £1,159,489% of Total Customer Income 2% 6% 8% 9% 23% 36% 16%% Gross FE Income to Turnover 6.47% 7.28% 6.92% 9.13% 8.08% 7.82% 7.29%
80% Income comes from 20% of the Customer base

© 2013 Chambers Travel Group
Name of who is presenting - Date
16
AnnualRe-Price & Re-
Sign
Daily
Daily Figures
Quarterly
Reconciliation & Review
MonthlySales &
Earnings by Customers Rpt
Who, When, What & How
WHEN

© 2013 Chambers Travel Group
Name of who is presenting - Date
17
BE IncomeOverrides, GDS Sector Credits
FE IncomePOS Fees,
Mgmt Fee Inv, Comms, MarkUps
Profile
Mix and use of Preferred Suppliers
Who, When, What & How
WHAT

© 2013 Chambers Travel Group
Name of who is presenting - Date
18
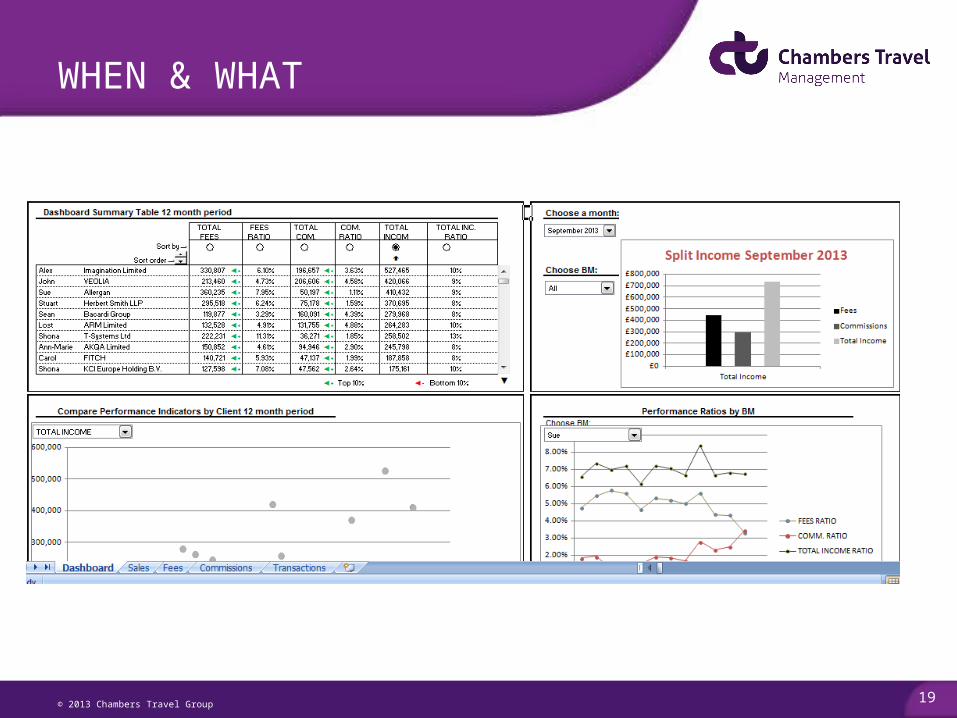
Monthly Sales & Earnings Report
© 2013 Chambers Travel Group
Name of who is presenting - Date
19
WHEN & WHAT
© 2013 Chambers Travel Group
Name of who is presenting - Date
20
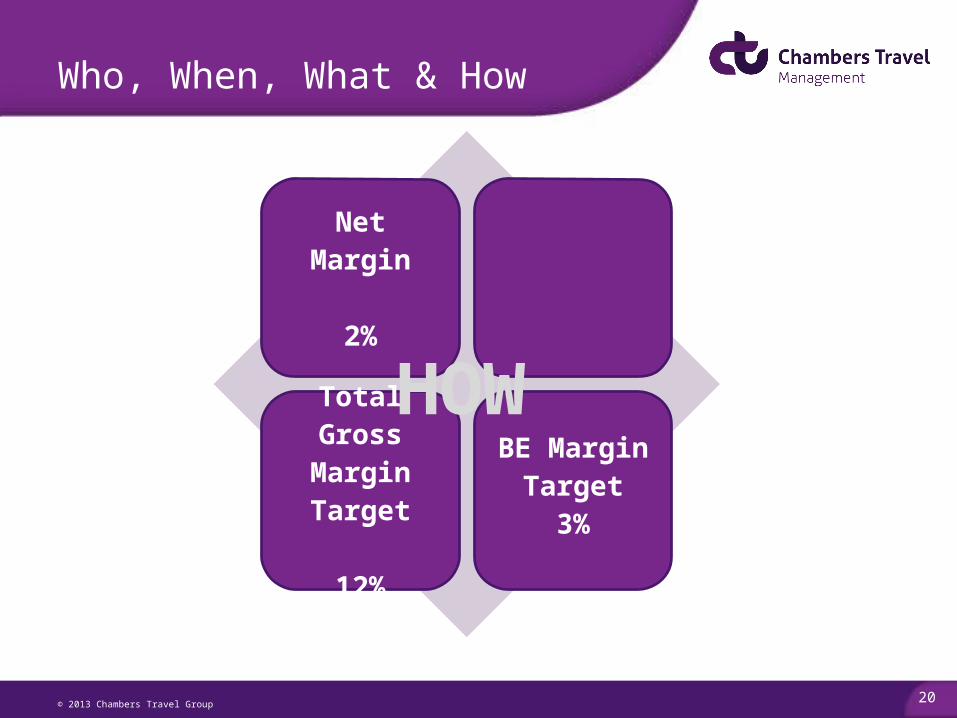
Net Margin
2%
Total Gross Margin Target
12%
BE MarginTarget
3%
Who, When, What & How
HOW
© 2013 Chambers Travel Group
Name of who is presenting - Date
21
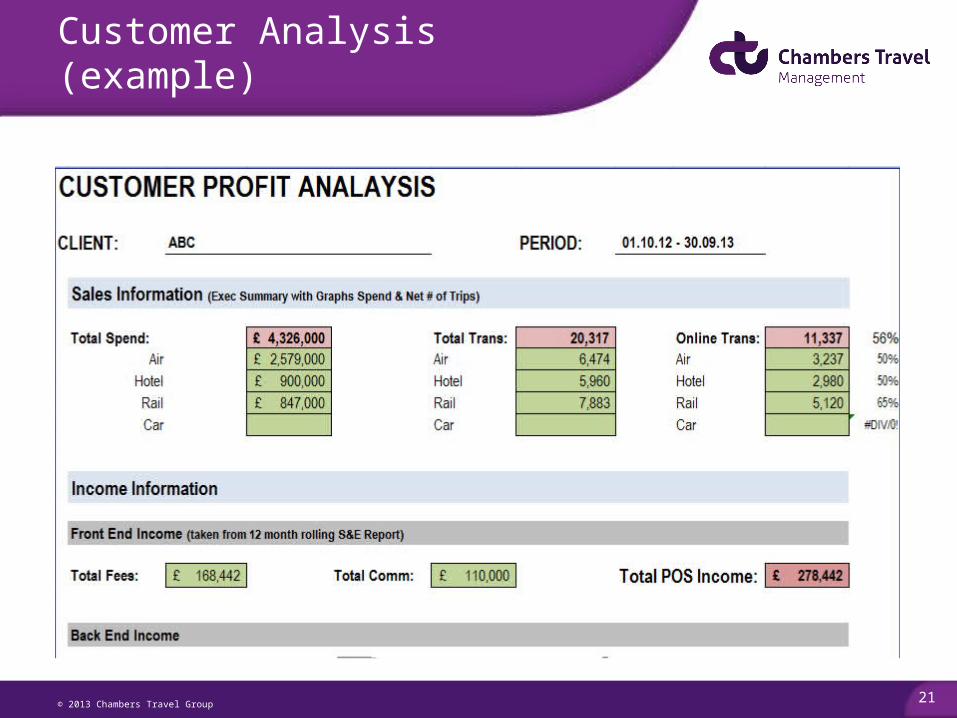
Customer Analysis (example)

© 2013 Chambers Travel Group
Name of who is presenting - Date
22
When the pain is OK
Long Term Clients
Brand / NameHigh Transaction
Clients Easy
Meeting & Group Travel
Supplier / GDS Mix
Right Geographical Area
Longer Contract Period
Incremental income vs. infrastructure

© 2013 Chambers Travel Group
Thank You


![Open Bridge CBTG Seattle February 2014. PROJECT OVERVIEW Supported By CBTG February Launch OPEN BOOKING PROBLEM Direct (Concur, Vendor [IHG/AVIS]) vs.](https://static.fdocuments.in/doc/165x107/5697c0301a28abf838cda759/open-bridge-cbtg-seattle-february-2014-project-overview-supported-by-cbtg.jpg)