Stephen Colbert's Federal Election Commission Advisory Opinion Request

EN EN
EUROPEAN COMMISSION
Brussels, 22.11.2017
SWD(2017) 511 final
COMMISSION STAFF WORKING DOCUMENT
Analysis of the draft budgetary plans of Belgium
Accompanying the document
COMMISSION OPINION
on the draft budgetary plan of Belgium
{C(2017) 8011 final}

1
COMMISSION STAFF WORKING DOCUMENT
Analysis of the draft budgetary plans of Belgium
Accompanying the document
COMMISSION OPINION
on the draft budgetary plan of Belgium
1. INTRODUCTION
Belgium submitted its Draft Budgetary Plan for 2018 (DBP) on 17 October 2017 in
compliance with Regulation (EU) No 473/2013 of the Two-Pack. Belgium is subject to the
preventive arm of the Stability and Growth Pact and should ensure sufficient progress towards
its medium-term budgetary objective (MTO) of a balanced budget in structural terms. As the
debt ratio was 105.7% of GDP in 2016 Belgium also needs to comply with the debt reduction
benchmark.
Section 2 of this document presents the macroeconomic outlook underlying the DBP and
provides an assessment based on the Commission 2017 autumn forecast. The following
section presents the recent and planned fiscal developments, according to the DBP, including
an analysis of risks to their achievement based on the Commission 2017 autumn forecast. In
particular, it also includes an assessment of the measures underpinning the DBP. Section 4
assesses the recent and planned fiscal developments in 2017-2018 (also taking into account
the risks to their achievement) against the obligations stemming from the Stability and
Growth Pact. Section 5 provides an analysis on the composition of public finances and on
fiscal-structural reforms in response to the latest country-specific recommendations adopted
by the Council in July 2017, including those to reduce the tax wedge. Section 6 summarises
the main conclusions of the present document.
2. MACROECONOMIC DEVELOPMENTS UNDERLYING THE DRAFT BUDGETARY PLAN
The DBP scenario projects the Belgian economy to grow by 1.7% in 2017 and to maintain
that growth rate next year. This pattern is stronger than what was envisaged in the Stability
Programme but broadly concurs with the Commission 2017 autumn forecast. The latter
expects growth of 1.7% and 1.8% in 2017 and 2018 respectively. Considering comparable
changes in GDP deflators in both projections, nominal growth projections are close as well.
As growth exceeds its estimated potential, the DBP expects the output gap to narrow to -0.2%
in 2017 and to turn positive next year, reaching 0.2%, in line with Commission projections.
Similar to 2017, economic growth is forecast to be driven by domestic demand in 2018, with
net exports reducing growth slightly. At 1.8%, household consumption would display the
highest growth rate since 2010, enabled by rising purchasing power as a result of increasing
wage growth, lower inflation and income tax cuts. Employment is projected to continue
growing at around 1% in both projections with the unemployment rate decreasing towards 7%
next year, a rate last seen in 2008.

2
Investment is also expected to maintain a robust growth pace in 2018. The DBP scenario
projects total investment to increase by 2.9%, somewhat lower than in the Commission 2017
autumn forecast. This reflects a continued investment push by companies given high capacity
utilisation, favourable financing conditions and strong profit margins. Public investment
growth is set to further accelerate in 2018 on the basis of the local investment cycle.
All in all, differences between the DBP scenario and the Commission 2017 autumn forecast
are small, both with respect to overall growth rate as to its composition. The DBP scenario is
therefore assessed to be plausible.
Table 1. Comparison of macroeconomic developments and forecasts
2016
COM SP DBP COM SP DBP COM
Real GDP (% change) 1.5 1.4 1.7 1.7 1.5 1.7 1.8
Private consumption (% change) 1.7 1.4 1.6 1.8 1.5 1.8 1.9
Gross fixed capital formation (% change) 3.6 2.8 3.7 4.1 3.0 2.9 3.2
Exports of goods and services (% change) 7.5 4.5 5.5 4.6 3.4 4.5 4.4
Imports of goods and services (% change) 8.4 4.6 5.7 4.8 3.6 4.8 4.6
Contributions to real GDP growth:
- Final domestic demand 1.8 1.4 1.8 2.0 1.6 1.8 1.9
- Change in inventories 0.2 0.0 -0.1 -0.1 0.0 0.0 0.0
- Net exports -0.6 0.0 0.0 -0.1 -0.1 -0.1 -0.1
Output gap1 -0.5 -0.4 -0.2 -0.3 -0.1 0.2 0.1
Employment (% change) 1.3 1.1 1.2 1.1 0.9 1.0 0.9
Unemployment rate (%) 7.8 7.6 7.4 7.3 7.5 7.1 7.0
Labour productivity (% change) 0.2 0.3 0.5 0.6 0.7 0.6 0.9
HICP inflation (%)2 1.8 2.2 2.1 2.2 1.6 1.2 1.4
GDP deflator (% change) 1.6 1.7 1.8 1.8 1.6 1.5 1.6
Comp. of employees (per head, % change) 0.1 1.9 1.7 1.3 1.8 1.9 1.9
Net lending/borrowing vis-à-vis the rest of
the world (% of GDP)0.2 0.9 n.a. -0.8 1.3 n.a. -1.0
Stability Programme 2017 (SP); Draft Budgetary Plan for 2018 (DBP); Commission 2017 autumn forecast
(COM); Commission calculations
Source:
1In percent of potential GDP, with potential GDP growth recalculated by the Commission on the basis of
the DBP scenario using the commonly agreed methodology.
2DBP refers to NICP.
Note:
2017 2018

3
Box 1: The macroeconomic forecast underpinning the Belgian DBP
The macroeconomic forecast underlying the DBP should either be prepared or endorsed by an
independent body as stipulated in the Two-Pack Regulation (EU) No 473/2013. In Belgium,
the National Accounts Institute is responsible for providing the 'economic budget' containing
the macroeconomic projections required to prepare the budgets of the federal government and
the regions and communities. The National Accounts Institute delegates this task by law to the
Federal Planning Bureau (FPB). The FPB is a well-established institution that is formally
attached to the government but positions itself as an independent body.
The DBP mentions that two different macroeconomic scenarios, both prepared by the FPB,
were used by the Belgian authorities for drafting their 2018 budgets. The first scenario,
published in June 2017, was used by the federal government when preparing its 2018 budget
in July. At the time, the government decided to modify the scenario by 'anticipating' an
upward revision of nominal GDP growth in 2018 by 0.2 percentage points. A new scenario
was published by the FPB in September 2017. It provided the sub-federal entities with the
macroeconomic framework for drafting their 2018 budgets. The September projections are
those officially reported in the DBP (see Table 1) and are referred to as 'DBP scenario' in
Section 2.
Breaking with past practice, the federal government did not update its draft budget on the
basis of the new September macroeconomic forecast. Instead, the DBP and the 'exposé
général' accompanying the budget state that the September projections confirm the
government's anticipated upward adjustment of nominal growth on the basis of a revision of
the cumulative real GDP growth rate in 2017 and 2018 by 0.2 percentage points. At the same
time, however, nominal GDP growth in 2018 was revised down by 0.1 percentage
pointsrelative to the June projections.
Therefore, it appears that the macroeconomic scenario underlying the 2018 DBP did not fully
use the most recently available independently produced macroeconomic forecasts. Indeed, the
2018 budget of the federal authorities is based on a modified version of an outdated forecast.
This raises questions regarding the realistic and unbiased nature of the overall macroeconomic
scenario underpinning the DBP and thus compliance with the Two-Pack Regulation
requirement to base DBPs on independent macroeconomic forecasts. Moreover, the way in
which the draft 2018 budget was prepared does not appear to be in line with Council Directive
(EU) No 85/2011 on requirements for budgetary frameworks of the Member States as Article
4(1) states that "Member States shall ensure that fiscal planning is based on realistic
macroeconomic and budgetary forecasts using the most up-to-date information".
3. RECENT AND PLANNED FISCAL DEVELOPMENTS
3.1. Deficit developments
2017
The DBP targets a general government deficit of 1.5% of GDP in 2017. Most of it is situated
at the federal level (including social security), which expects a deficit of 1.3% of GDP. In its
latest Stability Programme Belgium anticipated a deficit of 1.6% of GDP. The small
improvement stems from higher overall revenue projections, with an unchanged expenditure-

4
to-GDP ratio. The deficit reduction compared to 2016 is mostly expenditure-based. Primary
expenditure and interest payments decrease by 0.3 percentage points (pps) and 0.4 pps
respectively in 2017. The headline balance target in the DBP concurs with projections in the
Commission 2017 autumn forecast, which also expects a deficit of 1.5% of GDP in 2017. The
revenue and expenditure-to-GDP ratios are both projected 0.1 pps lower than in the DBP.
The structural balance1 in the DBP improves by 0.6% of GDP in 2017, compared to 1.0% in
the Stability Programme and 1.4% in the original budget. This means that the lower headline
deficit compared to the Programme does not result in a lower structural deficit. This reflects
higher one-off factors (0.2% of GDP) and, given a smaller output gap, a lower cyclical
correction (0.1% of GDP) compared to the Stability Programme. Lower interest payments
account for 0.4 pps of the improvement in the structural balance. The improvement of the
structural balance in the Commission 2017 autumn forecast is comparable to that in the DBP.
2018
The DBP plans a headline deficit of 1.1% of GDP in 2018. This represents a downward
revision by 0.4 pps compared to the latest Stability Programme; 0.5 pps when taking into
account the lower deficit projection in 2017. The revision is explained by the fact that the
Stability Programme premised a larger reduction of the expenditure-to-GDP ratio in 2017.
The deficit of the federal level narrows considerably in 2018, to 0.6% of GDP, while the sub-
federal entities see their deficit widening to 0.5% of GDP. This reflects to a large degree
temporary internal financing flows. The final determination of the 'autonomy factor'
established that transfers of personal income taxes from the federal to the regional level in
2015-2017 were around 0.4% of GDP too high. The settlement will take place in 2018,
involving a transitory improvement of the central government balance by 0.4% of GDP and a
symmetric deterioration of the regional balance.
According to the plans, the expenditure-to-GDP ratio should diminish by 0.7 pps in 2018
compared to 2017. A further decline in interest payments by 0.2% of GDP combines with a
general reduction of primary spending. The only expenditure item displaying a small increase
in 2018 is public investment. The declining revenue-to-GDP ratio in 2018 reflects to a large
extent the multiannual tax reform which, on the one hand, lowers personal income taxes and
employers' social security contributions and, on the other hand, increases non-labour taxes. In
2017, the tax reform was broadly neutral from a budgetary point of view, which is not the
case in 2018 (see Box 4). The budgetary impact of the tax reform came to the fore in the latest
report of the Monitoring Committee, which estimated the structural balance of the federal
level to deteriorate by 0.3% of GDP at unchanged policy in 20182.
The DBP targets an improvement in the (recalculated) structural balance of 0.3% of GDP in
2018. This compares to a planned improvement of 0.6% of GDP in the Stability Programme,
which aimed at reaching the MTO of a balanced budget in structural terms in 20193. The more
limited improvement reflects the above-mentioned deterioration at unchanged policy being
1 Cyclically adjusted balance net of one-off and temporary measures, recalculated by the Commission using
the commonly agreed methodology. 2 Monitoringcomité (2017), Actualisatie 2017 - raming 2018. Meerjarenraming 2019-2020.
3 The DBP makes no mention of the adjustment path beyond 2018 or the implications of the lower structural
adjustment in 2018 on the trajectory towards the MTO.

5
insufficiently offset by new measures. The contribution from the fall in interest expenditure
amounts to 0.2% of GDP in 2018.
Table 2. Composition of the budgetary adjustment
The Commission 2017 autumn forecast projects a headline deficit of 1.4% of GDP in 2018,
0.3 pps higher than the DBP. The difference with the DBP is situated at the revenue side as
certain measures were insufficiently specified to be (fully) taken into account in the
Commission 2017 autumn forecast or were assessed to yield less than put forward in the DBP
(see Section 3.3).
The difference in headline balance between the Commission 2017 autumn forecast and the
DBP reverberates in the estimated change in the structural balance in 2018. The DBP projects
a (recalculated) structural improvement of 0.3% of GDP whereas the Commission 2017
autumn forecast expects a slight deterioration. The assessment of compliance with the
required structural adjustment is covered in Section 4.2.
2016Change:
2016-2018
COM SP DBP COM SP DBP COM DBP
Revenue 50.7 50.9 51.0 50.9 50.6 50.7 50.3 0.0
of which:
- Taxes on production and imports 13.1 13.2 13.2 13.2 13.3 13.3 13.2 0.2
- Current taxes on income and wealth 16.2 16.3 16.3 16.5 16.0 16.1 16.2 -0.1
- Capital taxes 0.8 0.9 0.8 0.8 0.9 0.8 0.8 0.0
- Social contributions 15.9 15.9 16.0 15.8 15.8 15.8 15.6 -0.1
- Other (residual) 4.7 4.6 4.7 4.7 4.6 4.7 4.5 0.0
Expenditure 53.2 52.5 52.5 52.4 51.3 51.8 51.8 -1.4
of which:
- Primary expenditure 50.3 49.9 50.0 49.8 49.0 49.5 49.4 -0.8
of which:
Compensation of employees 12.4 12.2 12.1 12.3 11.8 11.9 12.2 -0.5
Intermediate consumption 4.0 4.0 3.8 3.9 3.9 3.8 3.9 -0.2
Social payments 25.2 25.1 25.2 25.2 24.8 25.1 25.0 -0.1
Subsidies 3.2 3.3 3.3 3.3 3.2 3.3 3.2 0.1
Gross fixed capital formation 2.2 2.3 2.2 2.2 2.5 2.3 2.3 0.1
Other (residual) 3.3 3.0 3.4 2.8 2.8 3.1 2.8 -0.2
- Interest expenditure 2.9 2.6 2.5 2.6 2.3 2.3 2.4 -0.6
General government balance (GGB) -2.5 -1.6 -1.5 -1.5 -0.7 -1.1 -1.4 1.4
Primary balance 0.4 1.0 1.0 1.1 1.6 1.2 0.9 0.8
One-off and other temporary measures 0.0 -0.1 0.1 0.1 0.0 0.0 0.0 0.0
GGB excl. one-offs -2.4 -1.5 -1.6 -1.6 -0.7 -1.1 -1.5 1.3
Output gap1
-0.5 -0.4 -0.2 -0.3 -0.1 0.2 0.1 0.7
Cyclically-adjusted balance1
-2.2 -1.4 -1.4 -1.4 -0.7 -1.2 -1.5 1.0
Structural balance (SB)2
-2.1 -1.3 -1.5 -1.5 -0.7 -1.2 -1.5 0.9
Structural primary balance2
0.7 1.3 1.0 1.1 1.6 1.1 0.8 0.4
Source:
Stability Programme 2017 (SP); Draft Budgetary Plan for 2018 (DBP); Commission 2017 autumn forecast (COM); Commission calculations
1Output gap (in % of potential GDP) and cyclically-adjusted balance according to the DBP/programme as recalculated by Commission on the
basis of the DBP/programme scenario using the commonly agreed methodology.
2Structural (primary) balance = cyclically-adjusted (primary) balance excluding one-off and other temporary measures.
Notes:
(% of GDP)2017 2018

6
Risks factors
The authorities aim for a budgetary-neutral reform of corporate income taxation (see Section
5). On the basis of information made public by the Belgian government since the finalisation
of the Commission 2017 autumn forecast4, the reform would be fully financed in 2018, even
without taking into account potential favourable second round effects. However, some of the
compensating financing measures are of a one-off nature as they merely move revenues
forward in time. That is for example the case with the envisaged shift to advance payments by
companies, similar to what has been taking place in 2017 (see below). As a consequence, the
structural adjustment risks being reduced by the reform.
Over the first nine months of 2017 advance payments by companies rose by 26% compared to
the same period in 2016. This increase corresponds to EUR 1.6 billion or 0.4% of GDP. The
authorities assume that EUR 250 million of the increase reflects the one-off effect of a shift in
the timing of tax collection, from ex post payments at the time of the assessment to in-year
payments, triggered by higher penalties in case companies make insufficient advance
payments. The Commission forecast includes the EUR 250 million. However, if this is an
underestimation of the actual shift that is taking place, the structural adjustment in 2018 will
be negatively impacted.
The 2018 DBP is associated with some other risk factors:
Achieving the 2018 target for underspending of allocated budget credits ('credit
underutilisation') could be complicated by the fact that the target is around 0.05% of
GDP above the historic average and by the reduction of credits for temporary spending
related to the influx of refugees as these constituted a sizeable part of unspent credits
in previous years.
Because of the improved economic outlook, the government did not include a buffer
to offset potential revenue shortfalls as was done in 2017, when a buffer of almost
0.2% of GDP was depleted by the time of the first budget review in March 2017.
The aggregate headline deficit of sub-federal entities of 0.55% of GDP in the DBP
does not seem to correspond to those entities' target of a stable structural balance.
Low interest rate environment
Euro area sovereign bond yields remain at historically low levels, with secondary market
reference rates for 10-year Belgian bonds currently at 0.59%5. As a consequence, total interest
payments by the general government have continued to decrease as a share of GDP. Based on
the information included in the DBP, interest expenditure would fall from 2.9% of GDP in
2016 to 2.5% in 2017 and to 2.3% in 2018, well below the 3.6% of GDP at the peak of the
euro area sovereign debt crisis in 2011-2012. The picture stemming from the DBP is broadly
confirmed by the Commission 2017 autumn forecast. Considering the decline in interest
expenditure, the projected improvement in the (recalculated) structural balance (0.6% and
4 The reform was not included in the Commission 2017 autumn forecast considering that insufficient
information was available at the cut-off date of the autumn projections. 5 10-year bond yields as of 6 November 2017. Source: Bloomberg.

7
0.3% of GDP in 2017 and 2018 respectively) is accompanied by a less pronounced
improvement in the structural primary balance (0.3% and 0.1% of GDP respectively).
Unusual event clause
The authorities indicated in the 2017 Stability Programme that the budgetary impact of the
security costs related to the terrorist threat is significant in 2017 and should be considered as
an unusual event outside the control of the government, as defined in Articles 5.1 and 6.3 of
Regulation (EC) No 1466/97. More specifically, the additional expenditure was estimated at
0.01% of GDP in 20176. In the present DBP the government slightly revised those
projections, to 0.04% of GDP. The Commission provisionally assessed Belgium to be eligible
for an allowance of 0.04% of GDP in relation to costs considered by the Commission to have
a clear and direct link to security. A final assessment, including on the eligible amounts, will
be made in spring 2018 on the basis of observed data as provided by the authorities.
3.2. Debt developments
Public debt peaked at 106.8% of GDP in 2014 and fell to 105.7% in 2016. The DBP projects a
continuation of this trend, to 104.1% and 102.7% of GDP in 2017 and 2018 respectively. The
larger debt reduction in 2017 compared to the Stability Programme reflects a stronger
downward snowball effect (lower interest payments combined with higher nominal GDP
growth) and a smaller upward stock-flow adjustment. The latter results from higher issuance
premiums and the partial sale of the Belgian State's share in BNP Paribas in May 2017, a
transaction representing 0.45% of GDP. The DBP makes no mention of future divestments in
the financial sector7.
The main upward stock-flow adjustments in 2017 concern regional loans linked to social
housing and corrections for cash versus accrual accounting. Both are expected to have a debt-
increasing impact in future years as well, though they are more than offset by a downward
snowball effect of around 1% of GDP and the projected achievement of primary surpluses.
Overall, this allows for a continued reduction of the debt ratio in 2017-2018. The Commission
2017 autumn forecast projects a comparable debt reduction8.
6 In addition to the 0.05% of GDP that was established for 2016.
7 Following the partial sale in May, the Belgian State retains a share in BNP Paribas of 7.8%. Belfius bank is
100% state-owned. 8 The DBP assumes a debt ratio of 106% of GDP in 2016. Since the publication of the DBP this ratio was
revised to 105.7%. When correcting for this, the debt ratio would be 103.8% of GDP in 2017 and 102.4% of
GDP in 2018, comparable to the Commission 2017 autumn forecast.

8
Table 3. Debt developments
3.3. Measures underpinning the draft budgetary plan
The consolidation effort of around 0.6% of GDP envisaged in the 2018 DBP entails 0.34% of
GDP in additional revenues and spending cuts of 0.23% of GDP9. On the spending side
mainly social payments are affected. Measures are for example to be taken to respect the
growth norm in health care (0.06% of GDP) and by means of data mining wrongly granted
benefits should be reduced (0.02% of GDP). Both were included in the Commission forecast.
Only partially included are certain smaller measures such as for example the savings expected
from an additional compensation to encourage older employees to continue working; the
envisaged savings are expected to be achieved over two years in the Commission 2017
autumn forecast. Savings from the reintegration of long-term ill and disabled people have not
been included in the Commission forecast considering the poor track record and the fact that
existing measures were already expected to generate additional savings in 2018.
On the revenue side, the 2018 budget includes targets for a total of 0.04% of GDP from the
fight against tax and social fraud. Those targets come on top of 0.05% of GDP from earlier
budgetary rounds with an impact in 2018. The Commission forecast includes only 0.03% of
GDP from the fight against fraud in 2018 given an apparent replication of targets and
underpinning measures that are generally hard to monitor. The evaluation to anti-fraud
measures thus explains part of the total difference in headline deficit between both
projections. The extra revenues that would ensue from specialised real estate investment funds
(0.02% of GDP) was not included in the Commission forecast as past objectives were missed
and given a lack of information whether the target for 2017 is on track to be met. The single
largest fiscal measure in the DBP, a new tax on securities accounts (0.06% of GDP) has been
9 These figures were deduced from the change in the revenue and expenditure ratios between 2017 and 2018 at
unchanged policy versus those after measures, as reported in the DBP.
SP DBP COM SP DBP COM
Gross debt ratio1
105.7 105.2 104.1 103.8 103.4 102.7 102.5
Change in the ratio -0.2 -0.5 -1.6 -1.9 -1.8 -1.4 -1.3
Contributions2
:
1. Primary balance -0.4 -1.0 -1.0 -1.1 -1.6 -1.2 -0.9
2. 'Snowball' effect -0.3 -0.7 -1.0 -1.0 -0.9 -0.9 -1.1
Of which:
Interest expenditure 2.9 2.6 2.5 2.6 2.3 2.3 2.4
Growth effect -1.5 -1.4 -1.7 -1.8 -1.5 -1.7 -1.8
Inflation effect -1.6 -1.8 -1.8 -1.9 -1.7 -1.5 -1.6
3. Stock-flow adjustment 0.4 1.2 0.5 0.2 0.7 0.7 0.7
Stability Programme 2017 (SP); Draft Budgetary Plan for 2018 (DBP); Commission 2017 autumn forecast
(COM); Commission calculations
Notes:
1 End of period.
Source:
2016
2 The snowball effect captures the impact of interest expenditure on accumulated debt, as well as the impact of
real GDP growth and inflation on the debt ratio (through the denominator). The stock-flow adjustment includes
differences in cash and accrual accounting, accumulation of financial assets and valuation and other residual
effects.
(% of GDP)2017 2018

9
assessed more prudent, namely at 0.04% of GDP, as it is unclear how exactly the budgeted
yield of this tax will be achieved. The precise allocation of the budgetary impact stemming
from the anticipation of an upward revision in nominal GDP growth (see Section 2, Box 1) is
not detailed in the DBP. The 2018 target for fiscal regularisation is unchanged from the 0.07%
of GDP in 2017. In the Commission 2017 autumn forecast 0.03% of GDP was included, the
same as for 2017.
The main new tax measures included in the Commission 2017 autumn forecast relate to a
broadening of the scope of the financial withholding tax, an increase in the stock exchange
tax, higher excise duties on tobacco and sweetened drinks, and the closing of loopholes in the
transparency tax. Together these measures amount to 0.07% of GDP. Aside from the 2018
part of the multiannual labour tax reform, the main revenue-reducing measures concern a
reduction in social security contributions for the construction sector (-0.02% of GDP), the
abolition of the television licence fee in Wallonia (-0.02% of GDP) and the revised energy
levy in Flanders (-0.07% of GDP).
Table 4. Main discretionary measures reported in the DBP
A. Discretionary measures taken by general government - revenue side
B. Discretionary measures taken by general government - expenditure side
2018
Taxes on production & imports 0.06
Current taxes on income & wealth 0.19
Capital taxes 0.02
Social contributions 0.02
Property income 0.04
Other 0.0
Total 0.34
The budgetary impact in the table is the aggregated impact of measures as
reported in the DBP, i.e. by the national authorities. A positive sign implies
that revenue increases as a consequence of this measure.
Budgetary impact (% GDP)
(as reported by the authorities)
Note:
Source: Draft Budgetary Plan for 2018
Components
2018
Compensation of employees -0.01
Intermediate consumption 0.00
Social payments -0.17
Interest expenditure 0.00
Subsidies -0.02
Gross fixed capital formation 0.00
Capital transfers 0.00
Other -0.02
Total -0.23
Components
Note:
Source: Draft Budgetary Plan for 2018
Budgetary impact (% GDP)
(as reported by the authorities)
The budgetary impact in the table is the aggregated impact of measures as
reported in the DBP, i.e. by the national authorities. A positive sign implies
that expenditure increases as a consequence of this measure.

10
4. COMPLIANCE WITH THE PROVISIONS OF THE STABILITY AND GROWTH PACT
Belgium is subject to the preventive arm of the Pact and should ensure sufficient progress
towards its MTO. Box 2 reports the latest country-specific recommendations in the area of
public finances. As the debt ratio was 105.7% of GDP in 2016, above the 60% Treaty
threshold, Belgium is also subject to the debt reduction benchmark.
Box 2. Council recommendations addressed to Belgium
On 11 July 2017, the Council addressed recommendations to Belgium in the context of the
European Semester10
. In particular, in the area of public finances the Council recommended
Belgium to "pursue a substantial fiscal effort in 2018 in line with the requirements of the
preventive arm of the Stability and Growth Pact, taking into account the need to strengthen
the ongoing recovery and to ensure the sustainability of Belgium’s public finances. Use
windfall gains, such as proceeds from asset sales, to accelerate the reduction of the general
government debt ratio".
The Council recalled that in 2018, in the light of its fiscal situation and in particular of its debt
level, Belgium is expected to further adjust towards its medium-term budgetary objective of a
balanced budgetary position in structural terms. According to the commonly agreed
adjustment matrix under the Stability and Growth Pact, that adjustment translates into a
requirement of a nominal growth rate of net primary government expenditure which does not
exceed 1.6 % in 2018. It would correspond to an annual structural adjustment of at least 0.6 %
of GDP.
4.1. Compliance with the debt criterion
As Belgium did not comply with the debt reduction benchmark in 2016, the Commission
prepared a report under Article 126(3) TFEU to examine up-close this prima facie risk of the
existence of an excessive deficit, taking into account all relevant factors. This report was
adopted on 22 May 2017 and included an assessment of all the relevant factors, notably (i) the
previously unfavourable but improving macroeconomic conditions, which makes them less of
a factor to explain Belgium's large gaps as regards compliance with the debt reduction
benchmark; (ii) the fact that, based on the Commission 2017 spring forecast, the deviations
from the required adjustment towards the MTO point to a risk of some deviation in 2016 and
2017 individually, but to a significant deviation in 2016 and 2017 together; and (iii) the
implementation of growth-enhancing structural reforms in recent years, several of which are
considered substantial and expected to help improve debt sustainability. On the basis of this
assessment, the report came to the conclusion that the debt criterion as defined in the Treaty
and in Regulation (EC) No 1467/1997 should be considered as complied with. At the same
time, Belgium was asked to ensure broad compliance with the adjustment path towards the
MTO in 2016 and 2017 together11
.
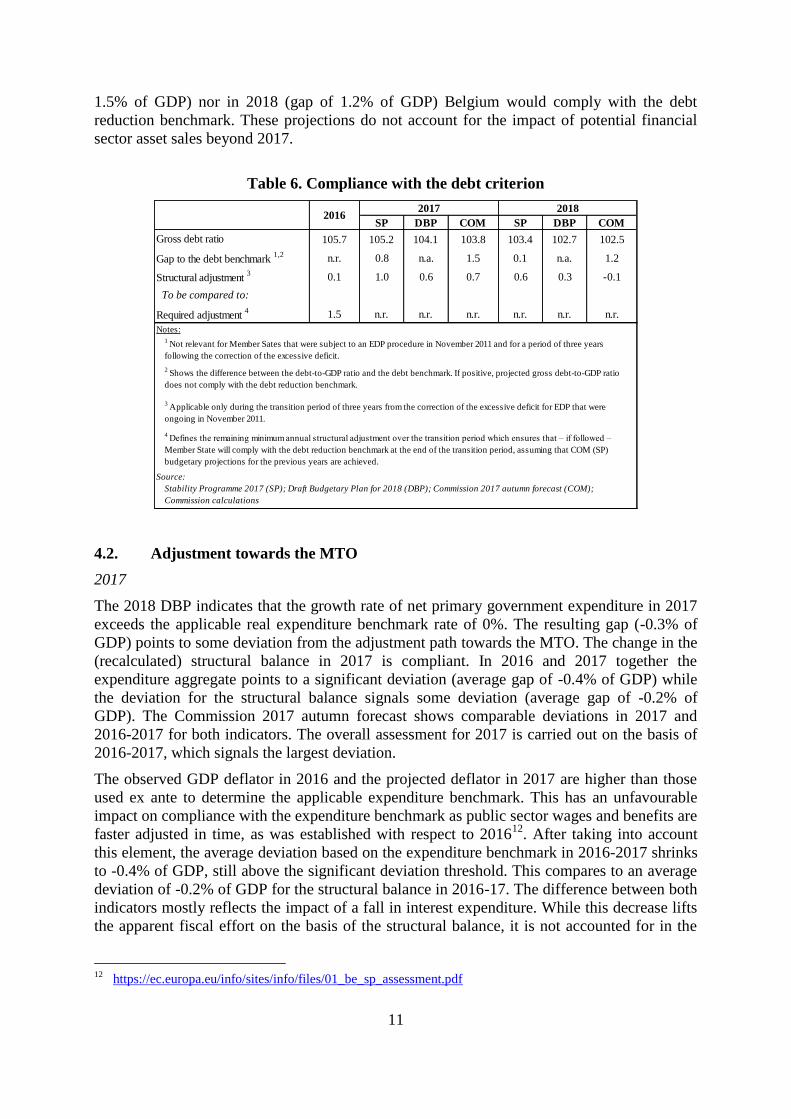
The DBP does not include sufficient information to assess compliance with the debt criterion
in 2017 and 2018. Based on the Commission 2017 autumn forecast, which projects
comparable debt developments in 2017-2018 to those in the DBP, neither in 2017 (gap of
10
OJ C 261/01, 11.7.2017. 11
https://ec.europa.eu/info/files/reportcommissionbelgium126-3-220517_en
11
1.5% of GDP) nor in 2018 (gap of 1.2% of GDP) Belgium would comply with the debt
reduction benchmark. These projections do not account for the impact of potential financial
sector asset sales beyond 2017.
Table 6. Compliance with the debt criterion
4.2. Adjustment towards the MTO
2017
The 2018 DBP indicates that the growth rate of net primary government expenditure in 2017
exceeds the applicable real expenditure benchmark rate of 0%. The resulting gap (-0.3% of
GDP) points to some deviation from the adjustment path towards the MTO. The change in the
(recalculated) structural balance in 2017 is compliant. In 2016 and 2017 together the
expenditure aggregate points to a significant deviation (average gap of -0.4% of GDP) while
the deviation for the structural balance signals some deviation (average gap of -0.2% of
GDP). The Commission 2017 autumn forecast shows comparable deviations in 2017 and
2016-2017 for both indicators. The overall assessment for 2017 is carried out on the basis of
2016-2017, which signals the largest deviation.
The observed GDP deflator in 2016 and the projected deflator in 2017 are higher than those
used ex ante to determine the applicable expenditure benchmark. This has an unfavourable
impact on compliance with the expenditure benchmark as public sector wages and benefits are
faster adjusted in time, as was established with respect to 201612
. After taking into account
this element, the average deviation based on the expenditure benchmark in 2016-2017 shrinks
to -0.4% of GDP, still above the significant deviation threshold. This compares to an average
deviation of -0.2% of GDP for the structural balance in 2016-17. The difference between both
indicators mostly reflects the impact of a fall in interest expenditure. While this decrease lifts
the apparent fiscal effort on the basis of the structural balance, it is not accounted for in the
12
https://ec.europa.eu/info/sites/info/files/01_be_sp_assessment.pdf
SP DBP COM SP DBP COM
105.7 105.2 104.1 103.8 103.4 102.7 102.5
n.r. 0.8 n.a. 1.5 0.1 n.a. 1.2
0.1 1.0 0.6 0.7 0.6 0.3 -0.1
1.5 n.r. n.r. n.r. n.r. n.r. n.r.
Notes:
2 Shows the difference between the debt-to-GDP ratio and the debt benchmark. If positive, projected gross debt-to-GDP ratio
does not comply with the debt reduction benchmark.
20162017 2018
Gap to the debt benchmark 1,2
Gross debt ratio
3 Applicable only during the transition period of three years from the correction of the excessive deficit for EDP that were
ongoing in November 2011.
4 Defines the remaining minimum annual structural adjustment over the transition period which ensures that – if followed –
Member State will comply with the debt reduction benchmark at the end of the transition period, assuming that COM (SP)
budgetary projections for the previous years are achieved.
Source:
Stability Programme 2017 (SP); Draft Budgetary Plan for 2018 (DBP); Commission 2017 autumn forecast (COM);
Commission calculations
Structural adjustment 3
To be compared to:
Required adjustment 4
1 Not relevant for Member Sates that were subject to an EDP procedure in November 2011 and for a period of three years
following the correction of the excessive deficit.

12
expenditure aggregate as it concerns a windfall outside the control of the authorities. As a
result, the overall assessment confirms the reading of the expenditure benchmark of a risk of
significant deviation from the recommended structural adjustment path towards the MTO in
2016-2017, both on the basis of the DBP and the Commission 2017 autumn forecast. That
conclusion would not change if the budgetary impact of the exceptional security-related
measures in 2017 were deducted from the requirement.
2018
According to the information provided in the DBP, the growth rate of net primary government
expenditure in 2018 is set to exceed the applicable nominal expenditure benchmark13
rate of
1.6%. The resulting gap (-0.5% of GDP) is on the verge of a significant deviation. Given an
improvement of 0.3% of GDP compared to a required adjustment of 0.6% of GDP, the
(recalculated) structural balance points to some deviation from the requirements. For 2017
and 2018 together the DBP signals a risk of significant deviation for the expenditure
aggregate (average gap of -0.5% of GDP) while the structural balance indicates a risk of some
deviation (average gap of -0.1% of GDP). The difference between both indicators stems
primarily from interest payments, which decrease by 0.3% of GDP on average in 2017-2018,
contributing to the improvement of the structural balance while not taken into account in the
expenditure benchmark. Without these interest windfalls, also the structural balance would
point to a significant deviation in 2017-2018. The overall assessment confirms thus the
reading of the expenditure benchmark and concludes there is a risk of significant deviation in
2018 on the basis of the DBP.
According to the Commission 2017 autumn forecast, the expenditure benchmark is deviated
from by -0.8% of GDP in 2018, pointing to a significant deviation. The structural balance
confirms this risk, with a deviation of -0.7% of GDP. Also for 2017 and 2018 together both
indicators point to a risk of significant deviation with gaps of -0.6% and -0.3% of GDP for the
expenditure and the structural pillar respectively.
Unlike the expenditure benchmark, the structural balance is projected to be impacted by
revenue shortfalls compared to standard elasticities in 2018. Conversely, the structural
balance benefits from diminishing interest payments, which are excluded from the
expenditure benchmark. Taking into account both elements aligns the deviation for the
structural balance with that of the expenditure benchmark. The risk of a signification
deviation for 2018 in isolation is thus confirmed by the overall assessment. After taking into
account the impact of higher-than-anticipated inflation in 2017 on the expenditure benchmark
as discussed above, it shows a deviation of -0.6% of GDP in 2017-2018, compared to -0.3%
of GDP for the structural balance. Once more, the difference between both pillars is
principally explained by interest payments. Therefore, the overall assessment confirms the
reading of the expenditure benchmark of a risk of significant deviation from the
recommended structural adjustment path towards the MTO for 2017 and 2018 together.
13
As part of the agreement on the EFC Opinion on "Improving the predictability and transparency the SGP: a
stronger focus on the expenditure benchmark in the preventive arm", which was adopted by the Economic
and Financial Committee on 29 November 2016, the expenditure benchmark, that is the maximum allowable
growth rate of expenditure net of discretionary revenue measures, is expressed in nominal terms as from
2018.

13
Table 7: Compliance with the requirements of the preventive arm
(% of GDP) 2016
Medium-term objective (MTO) 0.8
Structural balance2
(COM) -2.1
Structural balance based on freezing (COM) -2.1
Position vis-a -vis the MTO3 Not at MTO
2016
COM DBP COM DBP COM
Required adjustment4 0.6
Required adjustment corrected5 0.5
Change in structural balance6 0.1 0.6 0.7 0.3 -0.1
One-year deviation from the required
adjustment7 -0.4 0.0 0.1 -0.3 -0.7
Two-year average deviation from the required
adjustment7 -0.4 -0.2 -0.2 -0.1 -0.3
Applicable reference rate8 0.2
One-year deviation adjusted for one-offs9 -0.6 -0.3 -0.5 -0.5 -0.8
Two-year average deviation adjusted for one-
offs9 -0.3 -0.4 -0.5 -0.4 -0.6
PER MEMORIAM: One-year deviation10 -0.7 -0.2 -0.3 -0.5 -0.8
PER MEMORIAM: Two-year average
deviation10 -0.7 -0.4 -0.5 -0.4 -0.6
Conclusion over one yearOverall
assessment
Overall
assessment
Overall
assessment
Overall
assessment
Significant
deviation
Conclusion over two yearsSignificant
deviation
Overall
assessment
Overall
assessment
Overall
assessment
Significant
deviation
Source :
0.0 0.0
(% of GDP)2017 2018
Structural balance pillar
Draft Budgetary Plan for 2018 (DBP); Commission 2017 autumn forecast (COM); Commission calculations.
2017 2018
Initial position1
-1.5 -1.5
-1.5 -
Not at MTO Not at MTO
5 Required adjustment corrected for the clauses, the possible margin to the MTO and the allowed deviation in case of overachievers.
6 Change in the structural balance compared to year t-1. Ex post assessment (for 2016) was carried out on the basis of Commission 2017
spring forecast.
7 The difference of the change in the structural balance and the corrected required adjustment.
0.6 0.6
Expenditure benchmark pillar
0.0 1.6
Conclusion
10 Deviation of the growth rate of public expenditure net of discretionary revenue measures and revenue increases mandated by law from
the applicable reference rate in terms of the effect on the structural balance. The expenditure aggregate used for the expenditure
benchmark is obtained following the commonly agreed methodology. A negative sign implies that expenditure growth exceeds the
applicable reference rate.
9 Deviation of the growth rate of public expenditure net of discretionary revenue measures, revenue increases mandated by law and one-
offs from the applicable reference rate in terms of the effect on the structural balance. The expenditure aggregate used for the expenditure
benchmark is obtained following the commonly agreed methodology. A negative sign implies that expenditure growth exceeds the
applicable reference rate.
0.6 0.6
Notes
1 The most favourable level of the structural balance, measured as a percentage of GDP reached at the end of year t-1, between spring
forecast (t-1) and the latest forecast, determines whether there is a need to adjust towards the MTO or not in year t. A margin of 0.25
percentage points (p.p.) is allowed in order to be evaluated as having reached the MTO.
8 Reference medium-term rate of potential GDP growth. The (standard) reference rate applies from year t+1, if the country has reached its
MTO in year t. A corrected rate applies as long as the country is adjusting towards its MTO, including in year t.
2 Structural balance = cyclically-adjusted government balance excluding one-off measures.
3 Based on the relevant structural balance at year t-1.
4 Based on the position vis-à-vis the MTO, the cyclical position and the debt level (See European Commission:
Vade mecum on the Stability and Growth Pact, page 38.).

14
The Commission Communication on the 2017 European Semester of 22 May 201714
stated
that the Commission stands ready to use its margin of appreciation in cases where the impact
of a large fiscal adjustment on growth and employment is particularly significant. The
country-specific recommendations adopted by the Council on 11 July 2017 mentioned that the
assessment of the 2018 DBP and subsequent assessment of 2018 budget outcomes will need
to take due account of the goal of achieving a fiscal stance that contributes to both
strengthening the ongoing recovery and ensuring the sustainability of public finances.
Box 3 presents a qualitative assessment of the strength of the recovery in Belgium while
giving due consideration to its sustainability challenges. Overall, Belgium does not face short-
term sustainability challenges while in the medium term the risks to fiscal sustainability are
assessed as high. The recovery in Belgium does not appear fragile. As a result, no additional
elements in that regard need to be taken into account in the overall assessment.
Box 3. Assessment of the cyclical situation of Belgium
Belgium does not face short-term sustainability challenges. However, sustainability risks are
considered to be high in the medium term given that projected ageing costs add to an
unfavourable starting point due to the high public debt of around 104% of GDP in 2017.
The recovery in Belgium does not appear fragile. There is little indication of economic slack
with respect to either labour or capital. According to the Commission 2017 autumn forecast
the output gap is estimated at -0.3% in 2017. As the Belgian economy is projected to grow
faster than its estimated potential, the output gap would become positive in 2018. Over the
first nine months of 2017 core inflation averaged 1.6% with headline inflation at 2.3%. The
labour market has been performing relatively strong in recent years. There are no indications
that the crisis caused a hysteresis effect; the NAWRU barely changed over the past decade
and the comparatively low activity rate is rather a structural feature of the Belgian economy.
The unemployment rate never showed the sharp increase seen elsewhere in the euro area. It
has been on a downward path since 2015, approaching the pre-crisis level. Employment rose
by around 335.000 in the decade between 2007 and 2017. The steady decrease in average
hours worked per person over the same period is in line with the long-term trend observed in
the country. The share of people being involuntarily part-time employed is the lowest of all
Member States. The investment-to-GDP ratio has been markedly stable since 2007, at around
23%. This is above the pre-crisis average. Capacity utilisation in the manufacturing sector has
been close or above the long-term average since 2014. The same holds for economic
sentiment in the services sectors. Access to credit has generally not been a constraint for
Belgian companies.
14
https://ec.europa.eu/info/sites/info/files/2017-european-semester-country-specific-recommendations-
commission-recommendations-communication.pdf

15
5. COMPOSITION OF PUBLIC FINANCES AND IMPLEMENTATION OF FISCAL-
STRUCTURAL REFORMS
According to the DBP, the consolidation effort in 2018 increases the revenue-to-GDP ratio
from 50.4% at unchanged policy to 50.7% after measures. The expenditure-to-GDP ratio
decreases from 52% to 51.8%. Revenues thus represent around 60% of the overall fiscal
effort. This distribution between revenues and expenditure is quasi identical to the
composition of the cumulative fiscal effort between 2011 and 2017 as measured by the
Discretionary Fiscal Effort (see Graph 1). Declining interest expenditure accounts for 0.2 pps
of the total structural adjustment of 0.3% of GDP planned in 2018. This is less than is the case
in 2017 but around the same as the average contribution to the change in the structural
balance in 2011-2017 (see Graph 1). Government investment would rise from 2.2% of GDP
in 2017 to 2.3% in 2018 according to the DBP, which was the average public investment rate
in 2007-2016. The slight increase in 2018 can be related to the local investment cycle, which
traditionally peaks in election years – local elections will take place in October 2018.
Graph 1: Composition of the fiscal effort
(2011-2017), Belgium (%GDP)
Graph 2: Change in the share in total
expenditure of selected expenditure items
(2011-2017), Belgium (%change)
Source:
Draft Budgetary Plan 2018, Commission 2017 autumn forecast. The Discretionary Fiscal Effort (DFE)
combines a top-down approach on the expenditure side with a bottom-up or narrative approach on the revenue
side. In a nutshell, the DFE consists of the increase in primary expenditure net of cyclical components relative to
economic potential on the one hand and of discretionary revenue measures on the other hand. See European
Commission (2013): Measuring the fiscal effort, Report on Public Finances in EMU, part 3
http://ec.europa.eu/economy_finance/publications/european_economy/2013/pdf/ee-2013-4.pdf.
The 2017 Country Report for Belgium pointed to the existence of many tax exemptions,
deductions and disincentives which create economic distortions and lead to high statutory tax
rates. It was concluded that, aside from the reform to lower the tax pressure on labour (see
Box 4), opportunities to shift taxes to more growth-friendly bases had not been exploited.
Certain features of the corporate tax system were deemed to facilitate aggressive tax planning
by multinational groups, in particular the absence of anti-abuse rules (e.g. a lack of Controlled
foreign company rules) and the possibility to cascade deductions under the allowance for
corporate equity.

16
Box 4 – Addressing the tax burden on labour in the euro area
The tax burden on labour in the euro area is relatively high, which weighs on economic activity and
employment. Against this background, the Eurogroup has expressed a commitment to reduce the tax
burden on labour. On 12 September 2015, the Eurogroup agreed to benchmark euro area Member
States' tax burden on labour against the GDP-weighted EU average, relying in the first instance on
indicators measuring the tax wedge on labour for a single worker at the average wage and a single
worker at a low wage. It also agreed to relate these numbers to the OECD average for purposes of
broader comparability.
The tax wedge on labour measures the difference between the total labour costs to employ a worker
and the worker’s net earnings. It is made up of personal income taxes and employer and employee
social security contributions. The higher the tax wedge, the higher the disincentives to take up work or
hire new staff. The graphs below show the tax wedge in Belgium in 2016 for a single worker earning
respectively the average wage and a low wage (50% of the average) compared to the EU average.
The tax burden on labour in Belgium at the average wage and a low wage (2016)
Notes: no recent data is available for Cyprus. EU and EA averages are GDP-weighted. The OECD average is not weighted
Source: European Commission Tax and Benefit Indicator database based on OECD data
Benchmarking is only the first step in the process towards firm, country-specific policy conclusions.
The tax burden on labour interacts with a wide variety of other policy elements such as the benefit
system and the wage-setting system. A good employment performance indicates that the need to
reduce labour taxation may be less urgent while fiscal constraints can dictate that labour tax cuts
should be fully offset by other revenue-enhancing or expenditure-reducing measures. In-depth,
country-specific analysis is necessary before drawing policy conclusions.
In the context of the 2017 European Semester, Belgium was issued the recommendation to "remove
distortive tax expenditures". Aside from a reduction in employers' social security contribution in the
construction sector, the 2018 DBP does not include notable new measures that affect the tax wedge on
labour. However, Belgium is rolling out a multiannual tax reform with the aim of reducing the tax
burden on labour by lowering personal income taxes and employers' social security contributions. In
2018 reductions representing 0.5% of GDP are scheduled. According to estimations by the National
Bank of Belgium, the reform carries a financing gap of 0.3% of GDP in 2018, narrowing to 0.2% of
GDP when likely second round effects are taken into account15
. The underfinancing of the reform
contributed to the budgetary deviation observed in 2016. In 2017 the tax reform was broadly neutral
from a budgetary point of view.
The DBP mentions the intention to reform corporate income taxation (CIT). Plans in this
regard were approved by the Council of Ministers on 25 October 2017. The standard CIT rate
will be reduced from 33% to 29% in 2018 and to 25% in 2020. In addition the crisis
contribution goes from 3% to 2% in 2018 and will be abolished as of 2020. Following the
reform SMEs will pay a tariff of 20% on taxable profits below EUR 100 000 (currently 25%
15
National Bank of Belgium (2017), Incidence macroéconomique et budgétaire du scénario de tax shift révisé
par le cabinet du ministre des Finances et comparaison avec l’exercice de novembre 2015.

17
on profits below EUR 25 000). Other main changes are a temporary increase of the
investment deduction for SMEs and independents and a higher subsidy on employed
researchers. As of 2020 the possibility of fiscal consolidation by multinational companies
would be introduced.
According to the authorities, the reform involves a budgetary cost of 0.4% of GDP in 2018,
rising to 0.9% of GDP in 2020 and to 1.1% of GDP at cruising speed. The government plans
the reform to be budgetary-neutral, though, as in parallel the tax base will be broadened. In
2018 the main financing measures are the limitation of the allowance for corporate equity to
additional capital, the introduction of a minimum tax base, the taxation of capital gains and
the stimulation of advance payments by companies. Additional measures in 2020 comprise
the implementation of the Anti-Tax Avoidance Directive – including the introduction of
Controlled foreign company rules – which Member States should apply as from 1 January
2019 at the latest. The government has requested the National Bank of Belgium to provide an
estimation of the economic and budgetary implications of the CIT reform.
Aside from the CIT reform, the DBP provides no new information regarding fiscal-structural
aspects of the 2017 country-specific recommendations. A comprehensive assessment of
progress made in the implementation of the country-specific recommendations will be made
in the 2018 Country Report and in the context of the country-specific recommendations to be
proposed by the Commission in May 2018.
6. OVERALL CONCLUSION
Based on the Commission 2017 autumn forecast Belgium would not comply with the debt
reduction benchmark in 2017 and 2018. Following an overall assessment of the DBP, the
planned adjustment is considered to involve a risk of significant deviation from the
adjustment path towards the MTO in 2017 (based on the assessment of 2016 and 2017
together) as well as in 2018 (based on the assessment of 2017 and 2018 together). The overall
assessment based on the Commission 2017 autumn forecast confirms those risks. That
conclusion would not change if the budgetary impact of exceptional security measures in
2017 were deducted from the requirement.