Accommodating scenarios of climate change and management ... · Accommodating scenarios of climate...
13
Accommodating scenarios of climate change and management in modelling the distribution of the invasive tree Schinus molle in South Africa David M. Richardson, Donald M. Iponga, Nu ´ria Roura-Pascual, Rainer M. Krug, Suzanne J. Milton, Gregory O. Hughes and Wilfried Thuiller D. M. Richardson ([email protected]), D. M. Iponga, N. Roura-Pascual, R. M. Krug and S. J. Milton, Cent. for Invasion Biology, Dept Bot. and Zool., Stellenbosch Univ., P/Bag X1, Matieland 7602, South Africa. (Present address of N. R. P.: A ` rea de Biodiversitat, Centre Tecnolo `gic Forestal de Catalunya, Ctra. St. Llorenc ¸ de Morunys km 2, ES-25280 Solsona, Spain.) G. O. Hughes, ADAS Environment Group, Woodthorne, Wergs Road, Wolverhampton, WV6 8TQ, UK. W. Thuiller, Lab. d’Ecologie Alp., UMR CNRS 5553, Univ. Joseph Fourier, BP 53, FR-38041 Grenoble Cedex 9, France. Determining the potential range of invasive alien species under current conditions is important. However, we also need to consider future distributions under scenarios of climate change and different management interventions when formulating effective long-term intervention strategies. This paper combines niche modelling and fine-scale process- based modelling to define regions at high risk of invasion and simulate likely dynamics at the landscape scale. Our study species is Schinus molle (Peruvian pepper tree; Anacardiaceae), a native of central South America, introduced to South Africa in about 1850 where it was widely planted along roads. Localities of planted and naturalized trees were mapped along 5380 km of roads a transect that effectively samples a large part of western South Africa. Correlative modelling was used to produce profiles of present and future environmental conditions characterizing its planted and naturalized ranges. A cellular-automata simulation model was used to estimate the dynamics of S. molle under future climates and different management scenarios. The overall potential range of S. molle in the region is predicted to shrink progressively with predicted climate change. Some of the potential range of S. molle defined based on current conditions (including areas where it is currently highly invasive) is likely to become less favourable. The species could persist where it is well established long after conditions for recruitment have deteriorated. Some areas where the species is not widely naturalized now (notably the fynbos biome) are likely to become more favourable. Our modelling approach allows for the delineation of areas likely to be invaded in future by considering a range of factors at different scales that mediate the interplay of climatic variables and other drivers that define the dimensions of human intervention such as distance from planted trees and the density of planted plants, both of which affect propagule pressure. Successful invasion of an introduced plant species depends on many factors, including the climate and physical environment, features of the recipient ecosystem, life- history traits of the invader, and the availability and abundance of propagules (Richardson and Pys ˇek 2006). Management initiatives are underway around the world to tackle problems associated with invasive alien species. These range from local-scale efforts to eradicate particular species to systematic management programs at the scale of land- scapes or regions. Limited resources and the increasing extent of invasions make it essential to prioritize species and areas for management (Nel et al. 2004). For individual invasive species, a major challenge is to determine the potential range of suitable environmental conditions. This influences the importance attached to the species and its priority for management attention at different temporal and spatial scales (Rouget et al. 2004). A problem is that many invasive species have had short residence times and have had inadequate time to sample all potentially invasible habitats. Human factors are important mediators of the geographic ranges of invasive plant species (Thuiller et al. 2006). Sites of introduction in relation to the overall suitable range and propagule pressure are crucial determinants of invasive range (Wilson et al. 2007). Despite the realization of the importance of these factors, they are seldom considered when assessing the distribution limits of invasive species. One reason for this is that records of failed introductions are generally poor. Alien trees planted for Ecography 33: 113, 2010 doi: 10.1111/j.1600-0587.2010.06350.x # 2010 The Authors. Ecography # 2010 Ecography Subject Editor: Catherine Graham and Niklaus E. Zimmermann. Accepted 1 July 2010 1
Transcript of Accommodating scenarios of climate change and management ... · Accommodating scenarios of climate...

Accommodating scenarios of climate change and managementin modelling the distribution of the invasive tree Schinus mollein South Africa
David M. Richardson, Donald M. Iponga, Nuria Roura-Pascual, Rainer M. Krug,Suzanne J. Milton, Gregory O. Hughes and Wilfried Thuiller
D. M. Richardson ([email protected]), D. M. Iponga, N. Roura-Pascual, R. M. Krug and S. J. Milton, Cent. for Invasion Biology, Dept Bot. andZool., Stellenbosch Univ., P/Bag X1, Matieland 7602, South Africa. (Present address of N. R.�P.: Area de Biodiversitat, Centre TecnologicForestal de Catalunya, Ctra. St. Llorenc de Morunys km 2, ES-25280 Solsona, Spain.) � G. O. Hughes, ADAS Environment Group,Woodthorne, Wergs Road, Wolverhampton, WV6 8TQ, UK. � W. Thuiller, Lab. d’Ecologie Alp., UMR CNRS 5553, Univ. Joseph Fourier, BP53, FR-38041 Grenoble Cedex 9, France.
Determining the potential range of invasive alien species under current conditions is important. However, we also need toconsider future distributions under scenarios of climate change and different management interventions whenformulating effective long-term intervention strategies. This paper combines niche modelling and fine-scale process-based modelling to define regions at high risk of invasion and simulate likely dynamics at the landscape scale.
Our study species is Schinus molle (Peruvian pepper tree; Anacardiaceae), a native of central South America, introducedto South Africa in about 1850 where it was widely planted along roads.
Localities of planted and naturalized trees were mapped along 5380 km of roads � a transect that effectively samples alarge part of western South Africa. Correlative modelling was used to produce profiles of present and futureenvironmental conditions characterizing its planted and naturalized ranges. A cellular-automata simulation model wasused to estimate the dynamics of S. molle under future climates and different management scenarios.
The overall potential range of S. molle in the region is predicted to shrink progressively with predicted climate change.Some of the potential range of S. molle defined based on current conditions (including areas where it is currently highlyinvasive) is likely to become less favourable. The species could persist where it is well established long after conditions forrecruitment have deteriorated. Some areas where the species is not widely naturalized now (notably the fynbos biome) arelikely to become more favourable. Our modelling approach allows for the delineation of areas likely to be invaded infuture by considering a range of factors at different scales that mediate the interplay of climatic variables and other driversthat define the dimensions of human intervention such as distance from planted trees and the density of planted plants,both of which affect propagule pressure.
Successful invasion of an introduced plant species dependson many factors, including the climate and physicalenvironment, features of the recipient ecosystem, life-history traits of the invader, and the availability andabundance of propagules (Richardson and Pysek 2006).Management initiatives are underway around the world totackle problems associated with invasive alien species. Theserange from local-scale efforts to eradicate particular speciesto systematic management programs at the scale of land-scapes or regions. Limited resources and the increasingextent of invasions make it essential to prioritize species andareas for management (Nel et al. 2004).
For individual invasive species, a major challenge is todetermine the potential range of suitable environmental
conditions. This influences the importance attached to thespecies and its priority for management attention atdifferent temporal and spatial scales (Rouget et al. 2004).A problem is that many invasive species have had shortresidence times and have had inadequate time to sample allpotentially invasible habitats. Human factors are importantmediators of the geographic ranges of invasive plant species(Thuiller et al. 2006). Sites of introduction in relation tothe overall suitable range and propagule pressure are crucialdeterminants of invasive range (Wilson et al. 2007). Despitethe realization of the importance of these factors, they areseldom considered when assessing the distribution limits ofinvasive species. One reason for this is that records of failedintroductions are generally poor. Alien trees planted for
Ecography 33: 1�13, 2010
doi: 10.1111/j.1600-0587.2010.06350.x
# 2010 The Authors. Ecography # 2010 Ecography
Subject Editor: Catherine Graham and Niklaus E. Zimmermann. Accepted 1 July 2010
1
ornamentation and amenity purposes offer good opportu-nities for gaining insights regarding the role of humanactivities in shaping distribution range.
Potential distributions can be determined using species-distribution models (also called niche models); this involvescorrelating the presence/absence of a species with environ-mental conditions to determine its potential range (Guisanand Zimmermann 2000, Guisan and Thuiller 2005,Heikkinen et al. 2006). Niche modelling has severalinherent constraints, including difficulties in extrapolatingcurrent patterns onto new environments over which themodels have not been fitted. Also, models are static in spaceand time and are conceptually unable to deal with non-equilibrium situations, since they do not distinguishbetween the transient and equilibrium responses of speciesto a stochastically and dynamically changing environment(Guisan and Thuiller 2005). Consequently, they cannotaccommodate migration in a dynamic way. To address thislimitation, recent risk-assessment analyses for climate-change scenarios have commonly used two crude assump-tions about migration: no migration beyond a species’present site (‘‘zero migration’’ or ‘‘null migration’’) andperfect migration to all sites, or ‘‘full migration’’ (Petersonet al. 2002, Thuiller 2004). These approximations bracketthe most optimistic and pessimistic estimates of futurespecies range size, but have so far incorporated only thesimplest migration limitations � i.e. migration into con-tiguous elements of the modelled landscape (Peterson et al.2002) � to refine these estimates.
Several recent studies have shown that such modellingcan be made more realistic by linking niche models withmechanistic models that consider aspects of demographyand dispersal (Roura-Pascual et al. 2009). If concernedabout the fine-scale dynamics of a given species, e.g. withreference to potential management interventions, we mustknow the capacity of the species to disperse and tracksuitable conditions. To this end, one may utilize a modelwhich simulates the spread of a species based on its abilityand mode of dispersal, while using the niche model todetermine the general suitability of a region for the species �i.e. the likelihood of individuals establishing at differentlocations within the new region (Engler and Guisan 2009).This approach utilises non-spatial, species-specific attributesand spatially-explicit climatic attributes to predict thepotential spread of the target species in time and space.The distribution changes can then be used as inputs toobjective management plans for a recently introducedinvasive species.
In this paper we examine the distribution of plantedversus naturalized individuals of the alien tree Schinus molleover large parts of South Africa. Our aims are: 1) to produceaccurate profiles of environmental conditions (biophysicaland those related to human activities) that characterize thetwo types of range of this species: planted and naturalized(self-established individuals), by using correlates of distribu-tion via boosted regression trees (BRT); 2) to predictchanges in distribution of naturalized plants due to climatechange using BRTs based only on climate-related variables;and 3) assess effects of potential management strategies andchanges in climate using a simple cellular-automatasimulation model. Insights from these investigations are
needed to formulate long-term intervention strategies forthis species.
Materials and methods
Species occurrence and environmental data
Schinus molle (Peruvian pepper tree; Anacardiaceae) is along-lived and drought-tolerant evergreen dioecious treenative to the arid central region of South America. It canflower at any time of the year and female trees bear amixture unripe and ripe fruits most of the time makingtheir seeds available for dispersal throughout the year(Milton et al. 2007). Seeds are dispersed by birds,mammals, and in running water, and seedlings becomeestablished in washes, ravines, old fields, and rock outcrops(Howard and Minnich 1989). Growth is greatest in thewarm season until soil moisture is depleted (Nilsen andMuller 1980a, b). With continuous seed production andreliable dispersal the major barrier to establishment seems tobe germination and seedling survival. Saplings are hardyand survive nearly everywhere that they planted (Nilsen andMuller 1980, Howard and Minnich 1989). It was intro-duced to South Africa in about 1850, and since 1950 waswidely planted, especially as a shade tree at picnic sites alongmajor roads. In the last two decades it has become highlyinvasive in semi-arid savannas (Iponga et al. 2008b) and isnow listed as a major invader (Nel et al. 2004).
The range of the species was recorded during a surveyalong 5380 km of roads in regions of South Africa whereS. molle is known to be naturalized or invasive and occur athigh densities: mainly the Eastern Cape, Free State,Northern Cape and the Western Cape provinces (Fig. 1).The species also occurs in other provinces (Henderson2001), but at very low densities (unpubl.). We mapped allplanted and self-established (‘‘naturalized’’ sensu Pysek et al.2004) individuals along the roads using a GPS. Individualswere mapped as ‘‘planted’’ where their position in thelandscape clearly indicated planting by humans � e.g.regular pattern, proximity to picnic sites, roads, humansettlements. We also surveyed areas of radius 100 m aroundeach mapped planted and naturalized individual to searchfor self-sown plants (an initial survey revealed that almost allnaturalized plants were captured in surveys moving thisdistance from planted trees). Planted and naturalizedindividuals were recorded at 384 localities (2212 indivi-duals) and 317 localities (1575 individuals) respectively(Fig. 1; see also Supplementary material Fig. S1). Does thesampling strategy (exclusively along roads) bias the results ofthe modelling exercise? We believe not, since the roadtransects ensured excellent sampling of all major habitatsand bioclimatic regions, and was the most cost-effectivestrategy for thorough sampling.
Occurrence data were then correlated with variousenvironmental data using niche models to assess the suitablerange for both planted and naturalized individuals sepa-rately. We used climatic, topographic and land use variablesthat are known to influence the distribution of the plantspecies in South Africa (Thuiller et al. 2006, Wilson et al.2007), and variables related to history of the invasionto explain the distribution of naturalized individuals.
2
The climatic parameters used were: minimum temperatureof the coldest month (mtc), growing degree days (gdd10),mean annual precipitation (map), and mean annualpotential evapotranspiration (pet). The South African Atlasof Agrohydrology and Climatology climate-surface dataset(Schulze 1997) covering southern Africa at a resolution of1 minute by 1 minute (�1.6 km at this latitude) was usedto represent current climate, along with more recentlyconstructed rainfall surfaces (Lynch 2003). In addition,growing degree days (gdd10), a heat sum of averagetemperatures above 108C, was derived from the monthlyaverage climate surfaces. Distance to ‘‘main rivers’’ (driv;scale 1:500 000; Nel et al. 2007), ‘‘human footprint’’ (hfoot;
original resolution 1�1 km; Sanderson et al. 2002), andbiomes (biome; Mucina and Rutherford 2006) were alsoused in most analyses (Table 1). Distance to rivers wasdeemed useful since rivers provide ideal sites for theestablishment, growth and dispersal of this species (un-publ.). The human footprint represents the degree ofhuman-mediated modification of environments, throughagricultural practices, urbanization and other factors; thesefactors are known to influence the distribution of S. molle.Other variables were also generated to determine theimportance of history in naturalization of S. molle: distanceto the nearest planted individual (dsp), and a proxy forpropagule pressure (propres), computed by dividing pixels at
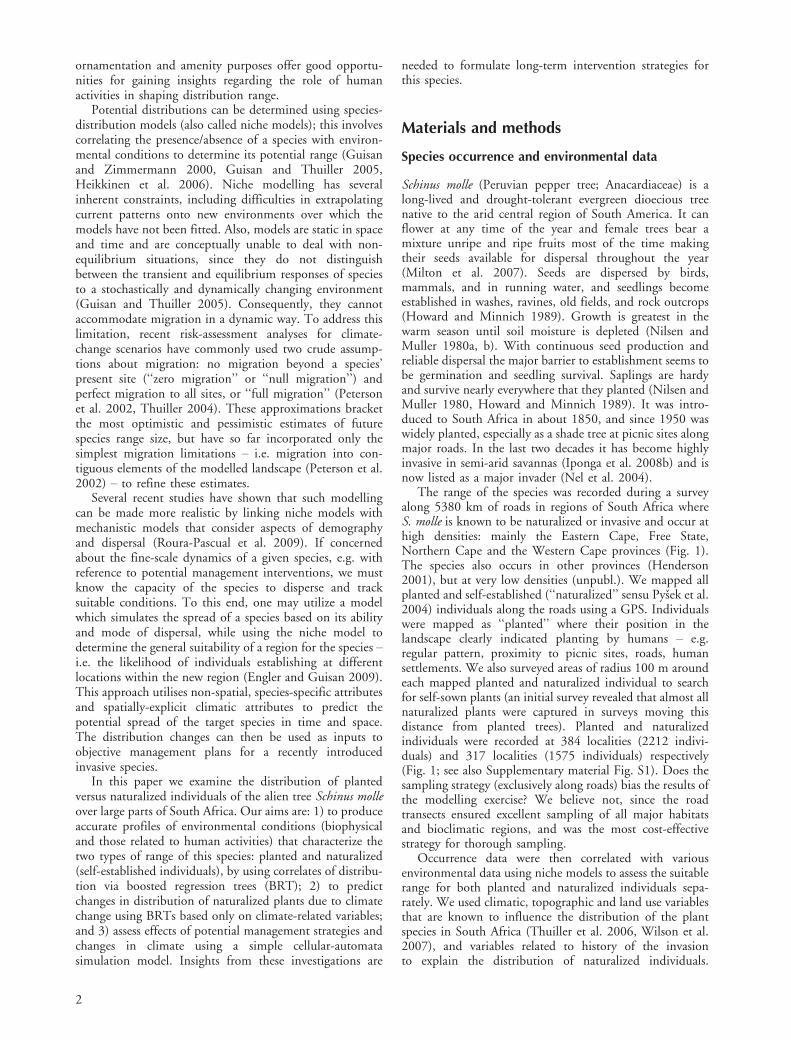
Figure 1. Roads surveyed for the presence of planted and naturalized individuals of Schinus molle in South Africa. The density of plantedand naturalized individuals is shown in Fig. 2. Shading shows major terrestrial biomes (Mucina and Rutherford 2006). The dashed lineencloses the study domain. Images show: trees planted along a road (a); self-sown individuals growing in Kimberley’s Big Hole (b); andnaturalized individuals along a river (c). Photos: D. M. Richardson (a), D. M. Iponga (b) and S. J. Milton (c). For separate maps showinglocalities of planted and naturalized individuals, see Supplementary material, Fig. S1.
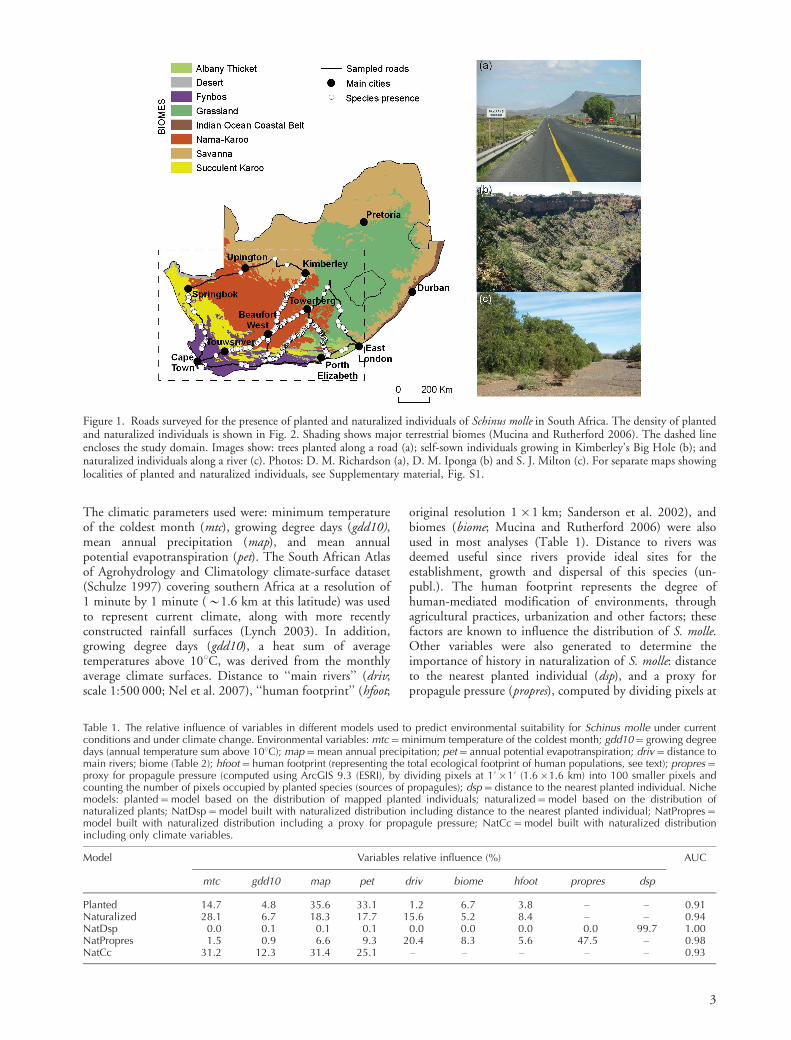
Table 1. The relative influence of variables in different models used to predict environmental suitability for Schinus molle under currentconditions and under climate change. Environmental variables: mtc�minimum temperature of the coldest month; gdd10�growing degreedays (annual temperature sum above 108C); map�mean annual precipitation; pet�annual potential evapotranspiration; driv�distance tomain rivers; biome (Table 2); hfoot�human footprint (representing the total ecological footprint of human populations, see text); propres�proxy for propagule pressure (computed using ArcGIS 9.3 (ESRI), by dividing pixels at 1?�1? (1.6�1.6 km) into 100 smaller pixels andcounting the number of pixels occupied by planted species (sources of propagules); dsp�distance to the nearest planted individual. Nichemodels: planted�model based on the distribution of mapped planted individuals; naturalized�model based on the distribution ofnaturalized plants; NatDsp�model built with naturalized distribution including distance to the nearest planted individual; NatPropres�model built with naturalized distribution including a proxy for propagule pressure; NatCc�model built with naturalized distributionincluding only climate variables.
Model Variables relative influence (%) AUC
mtc gdd10 map pet driv biome hfoot propres dsp
Planted 14.7 4.8 35.6 33.1 1.2 6.7 3.8 � � 0.91Naturalized 28.1 6.7 18.3 17.7 15.6 5.2 8.4 � � 0.94NatDsp 0.0 0.1 0.1 0.1 0.0 0.0 0.0 0.0 99.7 1.00NatPropres 1.5 0.9 6.6 9.3 20.4 8.3 5.6 47.5 � 0.98NatCc 31.2 12.3 31.4 25.1 � � � � � 0.93
3
1?�1? (i.e. 1.6�1.6 km) into 100 smaller pixels andcounting the number of GPS localities of planted indivi-duals. All variables were prepared at 1?�1? grid resolutionto match the climatic data set in ArcGIS 9.3 (ESRI); vectorvariables were directly rasterized at this resolution, whileraster variables (i.e. hfoot) were upscaled.
Potential distribution: planted vs naturalizedindividuals
We used boosted regression trees (BRTs; Ridgeway 1999,Friedman 2001, Friedman and Meulman 2003) to eluci-date ecological differences between planted and naturalizedindividuals of S. molle across its South African range. BRTuses an iterative method (the boosting algorithm) fordeveloping multiple regression trees and combining theminto an ensemble prediction (Friedman and Meulman2003). Regression trees are built by splitting the calibrationdata repeatedly, according to a simple rule based on a singleexplanatory variable. At each split, the data are partitionedinto two exclusive groups, each of which is as homogeneousas possible (Breiman et al. 1984). BRTs were used becausetheir predictive performance and reliable identification ofrelevant variables have been clearly demonstrated (Elithet al. 2008).
We first distinguished between occurrences correspond-ing to planted individuals (planted) and naturalizedindividuals (naturalized). Since absence data were notavailable, we generated random pseudo-absences at localitiesalong the surveyed roads without confirmed presence of thespecies and at a distance �100 m away from any planted ornaturalized individual. This could include a proportion offalse absences that do not necessarily represent areas that areenvironmentally unsuitable. Each occurrence dataset wasthen divided into training (70%) and testing (30%) sets tocalibrate and evaluate model performance, respectively. Toreduce uncertainty due to the re-sampling procedure, wecalibrated 10 replicate BRT models for each occurrencedataset by randomly creating 10 different sets of bothtraining and testing occurrences. Each set of 10 replicatepredictions were averaged at equal proportions to produce aunique ensemble estimate of the area suitable for S. molle.Additionally, BRTs also estimated the relative importanceof each environmental variable included into each replicatemodel by accounting for the rest of the variables (Thuilleret al. 2006). As in the final ensemble predictions, we alsocomputed the averaged influence of each environmentalvariable to understand their importance in explaining thepotential distribution of planted and naturalized popula-tions of S. molle separately.
Since naturalization of S. molle is also influenced byother non-environmental factors, we calibrated two extramodels to explore the importance of the history of theinvasion in explaining the current distribution of thenaturalized individuals of the species. The first model wascalibrated using all the previously mentioned environmentaldata as well as the distance to planted species and propagulepressure (NatDsp). The second model used only propagulepressure (NatPropres) (Table 1). The occurrence data usedto develop these two last models only included records ofnaturalized individuals.
Occurrence data not used in model development (30%)was used to calculate the area under the curve (AUC) of theReceiver Operator Characteristic (ROC), which evaluatesmodel performance independently of the arbitrary thresh-old of the prediction (Thuiller et al. 2006). Following thescale of Swets (1988), prediction was considered randomwhen it did not differ from 0.5, poor when it was in therange 0.5�0.7, and useful when in the range 0.7�0.9.Predictive accuracy �0.9 was considered good to excellent(1�perfect). AUC values under 0.5 reflect counterpredictions (omission and commission rates higher thancorrect prediction). Because of the incomplete sampling ineastern and north-eastern parts of the country, we restrictedour predictions to western South Africa (Fig. 1) to avoidprojecting the model into areas outside the range ofcalibration (Randin et al. 2006). We confirmed that therange of environmental conditions covered by the roadsampling was also representative of the rest of the region bycomparing the range of the environmental variables presentin the sampled roads with the range present at the overallregion.
Potential distribution of naturalized individualsof Schinus molle under climate change
To estimate changes in the potential distribution of S. mollewith climate change (step 2), we determined a niche modelbased on only naturalized occurrence data and using asmaller set of climatic variables for which data are availablefor both present and future conditions (NatCc) (Table 1).As described previously, we developed 10 replicate modelsand projected them onto present-day conditions (to test theperformance of the models) and two scenarios of futureclimate. Future climate predictions were produced byperturbing the current climatic data with anomalies derivedfrom climatic simulations produced by the HADCM3General Circulation Model (GCM) (Gordon et al. 2000)using the A2 and B2 IPCC SRES scenarios (Nakicenovicand Swart 2000), downloaded from the IPCC-DDC, inaccordance with guidelines for climate impact assessment(IPCC-TGCIA 1999, IPCC-TGICA 2007) using a tech-nique described by Hewitson (2003). Absolute anomalieswere used for the temperature variables while relativeanomalies were used for the rest. Potential evapotranspira-tion (pet) surfaces were calculated using the FAO 56Penman Monteith combination equation (Allen et al.1998). Hewitson (2003) considers this technique ofperturbing detailed current climate surfaces with coarserGCM anomaly surfaces appropriate for a range of scales,capturing the spatial differences of the existing climate whilemaintaining the large-scale response of the GCM. Wechose HADCM3 because it represents a fairly extremeprojection of future climate for the southern African region(Rousteenoja et al. 2003).
Spread of Schinus molle under different managementstrategies
Few studies have connected species spread with nichemodels for prediction of range expansion for a specieswith known level or density of invasion (Inglis et al. 2006).
4
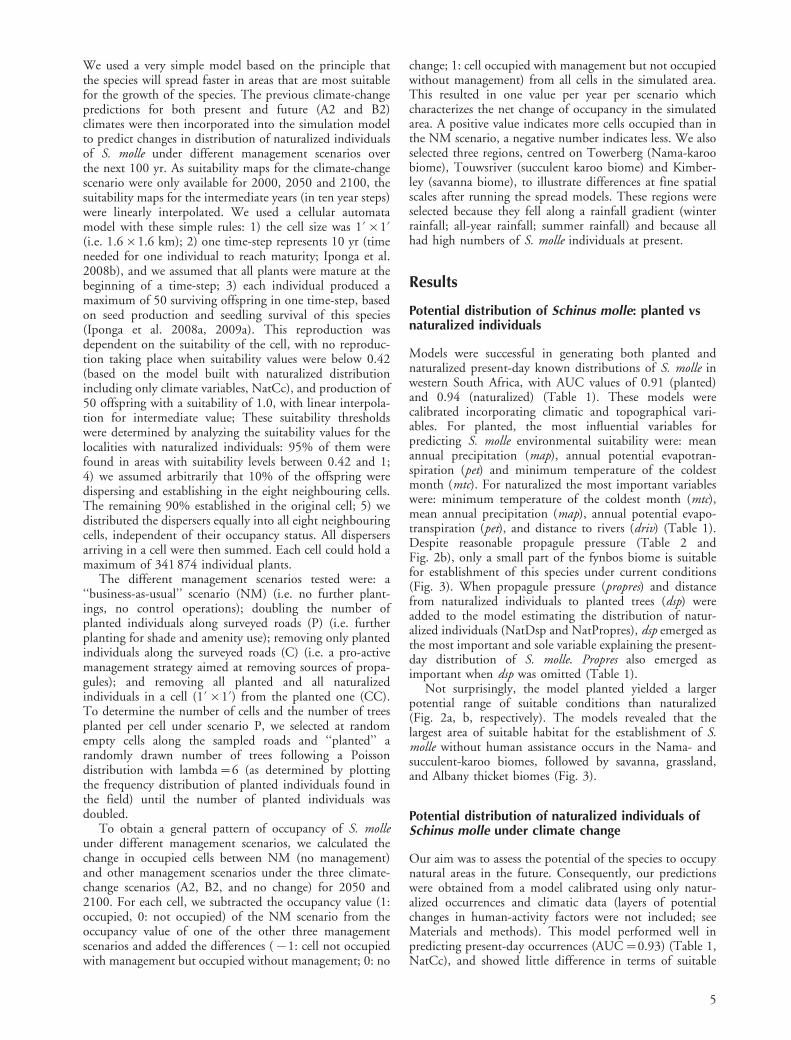
We used a very simple model based on the principle thatthe species will spread faster in areas that are most suitablefor the growth of the species. The previous climate-changepredictions for both present and future (A2 and B2)climates were then incorporated into the simulation modelto predict changes in distribution of naturalized individualsof S. molle under different management scenarios overthe next 100 yr. As suitability maps for the climate-changescenario were only available for 2000, 2050 and 2100, thesuitability maps for the intermediate years (in ten year steps)were linearly interpolated. We used a cellular automatamodel with these simple rules: 1) the cell size was 1?�1?(i.e. 1.6�1.6 km); 2) one time-step represents 10 yr (timeneeded for one individual to reach maturity; Iponga et al.2008b), and we assumed that all plants were mature at thebeginning of a time-step; 3) each individual produced amaximum of 50 surviving offspring in one time-step, basedon seed production and seedling survival of this species(Iponga et al. 2008a, 2009a). This reproduction wasdependent on the suitability of the cell, with no reproduc-tion taking place when suitability values were below 0.42(based on the model built with naturalized distributionincluding only climate variables, NatCc), and production of50 offspring with a suitability of 1.0, with linear interpola-tion for intermediate value; These suitability thresholdswere determined by analyzing the suitability values for thelocalities with naturalized individuals: 95% of them werefound in areas with suitability levels between 0.42 and 1;4) we assumed arbitrarily that 10% of the offspring weredispersing and establishing in the eight neighbouring cells.The remaining 90% established in the original cell; 5) wedistributed the dispersers equally into all eight neighbouringcells, independent of their occupancy status. All dispersersarriving in a cell were then summed. Each cell could hold amaximum of 341 874 individual plants.
The different management scenarios tested were: a‘‘business-as-usual’’ scenario (NM) (i.e. no further plant-ings, no control operations); doubling the number ofplanted individuals along surveyed roads (P) (i.e. furtherplanting for shade and amenity use); removing only plantedindividuals along the surveyed roads (C) (i.e. a pro-activemanagement strategy aimed at removing sources of propa-gules); and removing all planted and all naturalizedindividuals in a cell (1?�1?) from the planted one (CC).To determine the number of cells and the number of treesplanted per cell under scenario P, we selected at randomempty cells along the sampled roads and ‘‘planted’’ arandomly drawn number of trees following a Poissondistribution with lambda�6 (as determined by plottingthe frequency distribution of planted individuals found inthe field) until the number of planted individuals wasdoubled.
To obtain a general pattern of occupancy of S. molleunder different management scenarios, we calculated thechange in occupied cells between NM (no management)and other management scenarios under the three climate-change scenarios (A2, B2, and no change) for 2050 and2100. For each cell, we subtracted the occupancy value (1:occupied, 0: not occupied) of the NM scenario from theoccupancy value of one of the other three managementscenarios and added the differences (�1: cell not occupiedwith management but occupied without management; 0: no
change; 1: cell occupied with management but not occupiedwithout management) from all cells in the simulated area.This resulted in one value per year per scenario whichcharacterizes the net change of occupancy in the simulatedarea. A positive value indicates more cells occupied than inthe NM scenario, a negative number indicates less. We alsoselected three regions, centred on Towerberg (Nama-karoobiome), Touwsriver (succulent karoo biome) and Kimber-ley (savanna biome), to illustrate differences at fine spatialscales after running the spread models. These regions wereselected because they fell along a rainfall gradient (winterrainfall; all-year rainfall; summer rainfall) and because allhad high numbers of S. molle individuals at present.
Results
Potential distribution of Schinus molle: planted vsnaturalized individuals
Models were successful in generating both planted andnaturalized present-day known distributions of S. molle inwestern South Africa, with AUC values of 0.91 (planted)and 0.94 (naturalized) (Table 1). These models werecalibrated incorporating climatic and topographical vari-ables. For planted, the most influential variables forpredicting S. molle environmental suitability were: meanannual precipitation (map), annual potential evapotran-spiration (pet) and minimum temperature of the coldestmonth (mtc). For naturalized the most important variableswere: minimum temperature of the coldest month (mtc),mean annual precipitation (map), annual potential evapo-transpiration (pet), and distance to rivers (driv) (Table 1).Despite reasonable propagule pressure (Table 2 andFig. 2b), only a small part of the fynbos biome is suitablefor establishment of this species under current conditions(Fig. 3). When propagule pressure (propres) and distancefrom naturalized individuals to planted trees (dsp) wereadded to the model estimating the distribution of natur-alized individuals (NatDsp and NatPropres), dsp emerged asthe most important and sole variable explaining the present-day distribution of S. molle. Propres also emerged asimportant when dsp was omitted (Table 1).
Not surprisingly, the model planted yielded a largerpotential range of suitable conditions than naturalized(Fig. 2a, b, respectively). The models revealed that thelargest area of suitable habitat for the establishment of S.molle without human assistance occurs in the Nama- andsucculent-karoo biomes, followed by savanna, grassland,and Albany thicket biomes (Fig. 3).
Potential distribution of naturalized individuals ofSchinus molle under climate change
Our aim was to assess the potential of the species to occupynatural areas in the future. Consequently, our predictionswere obtained from a model calibrated using only natur-alized occurrences and climatic data (layers of potentialchanges in human-activity factors were not included; seeMaterials and methods). This model performed well inpredicting present-day occurrences (AUC�0.93) (Table 1,NatCc), and showed little difference in terms of suitable
5
areas compared to the model using a broad set ofenvironmental layers (Fig. 4 compared to Fig. 2, panelN2). As in this naturalized model, the most relevantvariables for predicting the climate suitability of S. mollewere: minimum temperature of the coldest month (mtc),mean annual precipitation (map), and annual potentialevapotranspiration (pet) (Table 1, NatCc).
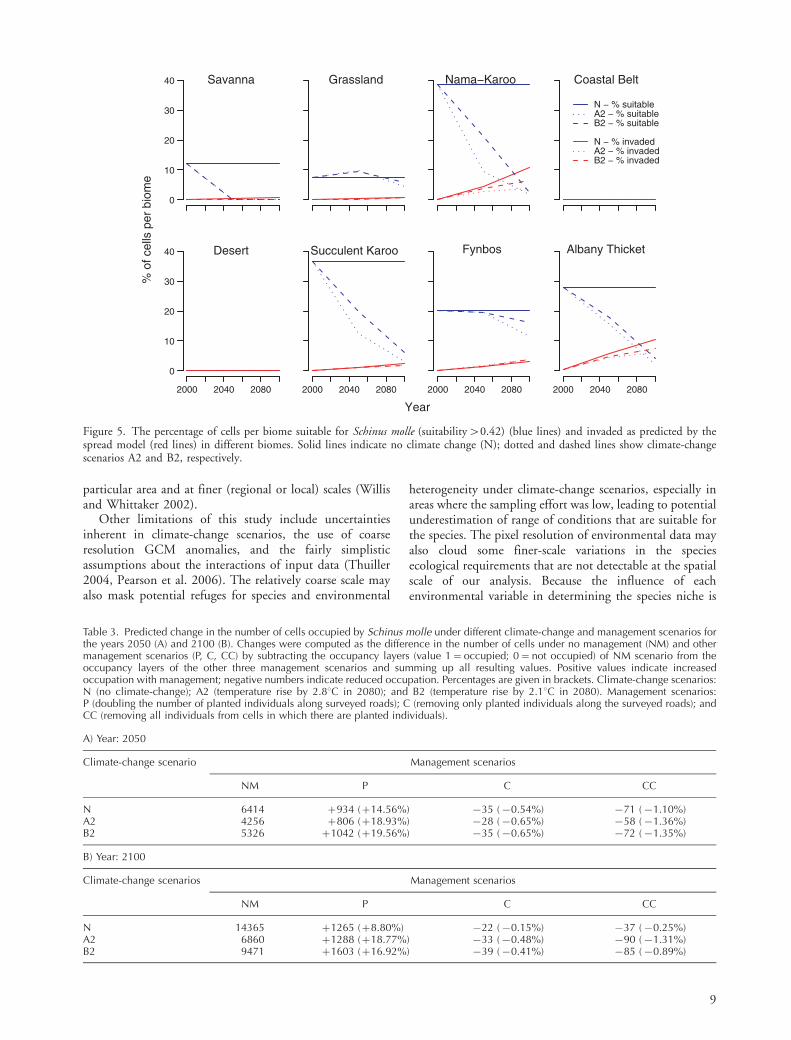
When projecting this model onto future scenarios A2and B2, the potential range of S. molle was generallypredicted to shrink progressively under both scenarios ofclimate change. The area predicted as suitable for thespecies now (32.4%) is expected to shrink considerably:16.7% suitable area under scenario A2 and 23.5% suitablearea under scenario B2 in 2050; and 6.4% and 8.4% underscenarios A2 and B2 respectively in 2100 (Fig. 4). Thisreduction in area suitable for S. molle is expected to affect allbiomes, but to be less pronounced in the grassland andfynbos biomes (Fig. 5, blue lines).
Spread of Schinus molle under different managementstrategies
According to the spread model, about 10% of Albanythicket and Nama-karoo respectively will be invaded underboth A2 and B2 climate change scenarios by 2100 (Fig. 5,red line). Less area (B5% of the total area of the respectivebiome) is predicted for the fynbos and succulent karoobiomes, while savanna and grassland biomes showed verylow potential spread (Fig. 5, red line).
Differences in the total number of occupied cells with nomanagement and under the three scenarios of activemanagement suggest that S. molle will increase its distribu-tion (more cells occupied) under all planting scenarios(Table 3). Not surprisingly, highest cell occupancy occurredunder management scenario P for all climate-changescenarios for both 2050 and 2100, while scenario CCgenerated the lowest cell occupancy (Table 3).
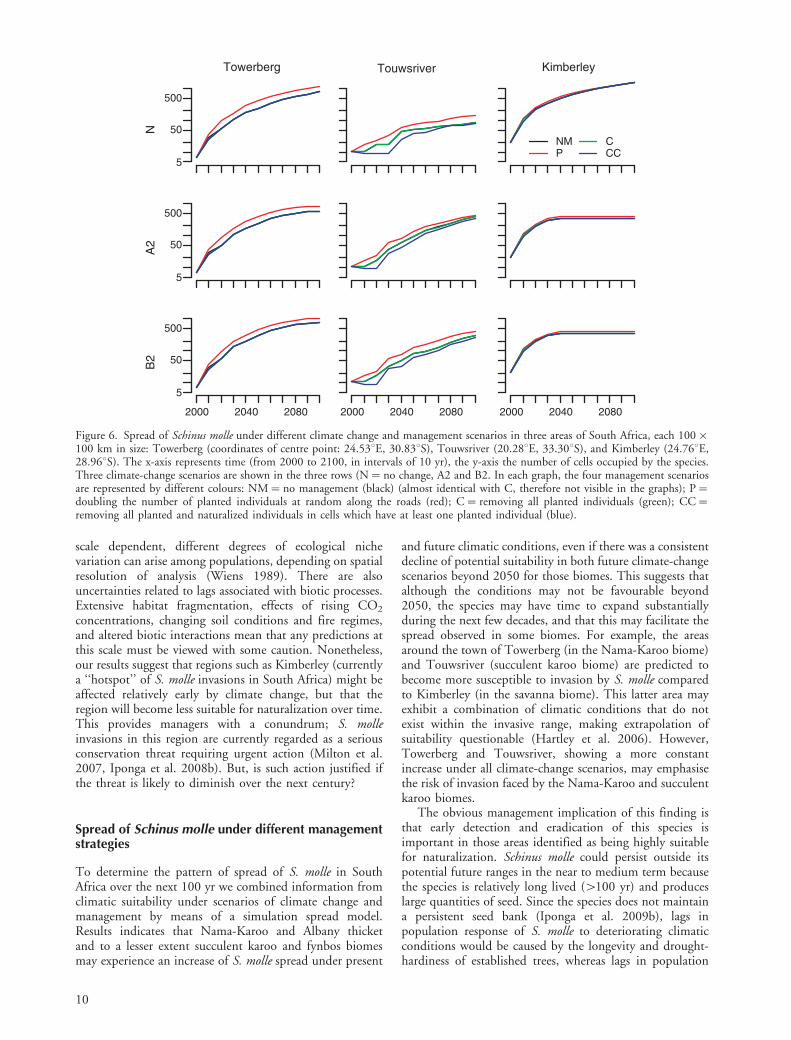
Different patterns were observed at local scales in thethree selected study areas (Fig. 6). The number of occupiedcells in the Kimberley area increases exponentially duringthe first 30 years under all management and climatescenarios, but then shows little increase of spread underboth A2 and B2 climate-change scenarios. The other twoareas show an increase in cell occupancy over time under allscenarios. However, while the rate of spread in Touwsriver
is maintained over time, that for Towerberg shows a slightdeceleration (Fig. 6). In any case, all areas show the highestlevels of occupancy under management scenario NM and P(Fig. 6).
Discussion
We first mapped two categories of distribution (planted andnaturalized) of an alien species S. molle in South Africa, thendetermined the bioclimatic features of the two distributionsin the major terrestrial biomes and finally assessed theclimate suitability of the species under different climatechanges scenarios. Additionally, we combined this informa-tion on future climatic suitability with various managementscenarios using a simulation spread model to identify areasthat may be most susceptible to invasion by S. molle inSouth Africa.
Potential distribution of Schinus molle: planted vsnaturalized individuals
A large part of western South Africa is potentially suitablefor growth and naturalization of S. molle. The area identifiedas suitable for growth of planted individuals is larger thanthe area identified as suitable for naturalization of thespecies. Differences in the two predicted ranges (Fig. 2c)are instructive. Areas suitable for growth of plantedindividuals but not naturalization represent areas whereenvironmental conditions are currently unfavourable forestablishment. Several studies have tested the value of nichemodelling for assessing the risk of plant species from otherregion invading a given area (Curnutt 2000, Richardson andThuiller 2007). The potential species distribution isprojected on the assumption that current niches reflectspecies environmental preferences, which is retained in theinvaded new areas (Beerling et al. 1995). The larger suitablearea for planted than naturalized plants (Fig. 2a vs b) isattributable to the role of nurturing by humans of plantedtrees (e.g. by watering, nutrient supplementation, andremoval of competing vegetation) which improves growthand survival (Iponga et al. 2008b). Areas shaded in red inFig. 2c are zones where (presumably largely abiotic) barrierspreclude invasion by thwarting recruitment. Previousstudies have shown that predicted potential distribution is
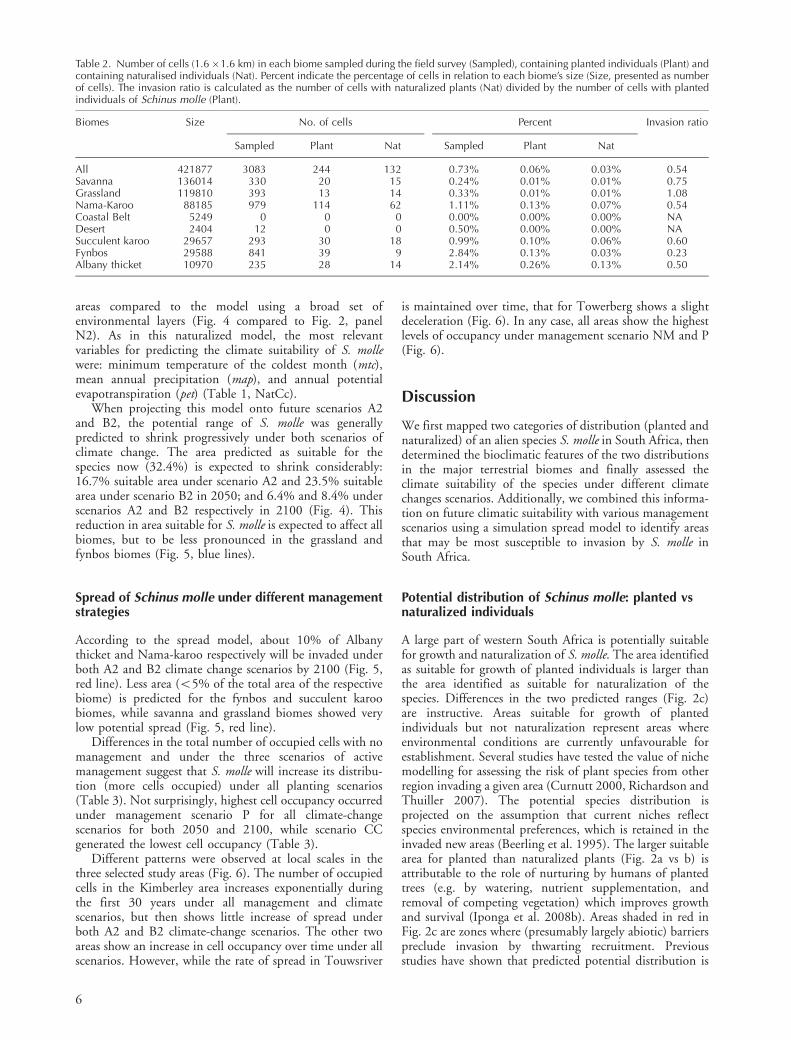
Table 2. Number of cells (1.6�1.6 km) in each biome sampled during the field survey (Sampled), containing planted individuals (Plant) andcontaining naturalised individuals (Nat). Percent indicate the percentage of cells in relation to each biome’s size (Size, presented as numberof cells). The invasion ratio is calculated as the number of cells with naturalized plants (Nat) divided by the number of cells with plantedindividuals of Schinus molle (Plant).
Biomes Size No. of cells Percent Invasion ratio
Sampled Plant Nat Sampled Plant Nat
All 421877 3083 244 132 0.73% 0.06% 0.03% 0.54Savanna 136014 330 20 15 0.24% 0.01% 0.01% 0.75Grassland 119810 393 13 14 0.33% 0.01% 0.01% 1.08Nama-Karoo 88185 979 114 62 1.11% 0.13% 0.07% 0.54Coastal Belt 5249 0 0 0 0.00% 0.00% 0.00% NADesert 2404 12 0 0 0.50% 0.00% 0.00% NASucculent karoo 29657 293 30 18 0.99% 0.10% 0.06% 0.60Fynbos 29588 841 39 9 2.84% 0.13% 0.03% 0.23Albany thicket 10970 235 28 14 2.14% 0.26% 0.13% 0.50
6

generally more extensive than actual distribution (Petersonet al. 2002, Pearson and Dawson 2003). The main focus ofthis study is on areas that are susceptible to invasion byS. molle � areas shaded in blue and black in Fig. 2c underprevailing climatic and management conditions. The deli-neation of these areas is influenced by the interplay ofclimatic variables with other factors that define the dimen-sions of human intervention such as distance from plantedtrees and the density of planted plants, both of which affectpropagule pressure (Rouget and Richardson 2003, Foxcroftet al. 2004). However, it may be hypothesized that human
activities resulting in intense propagule pressure and highlevels of disturbance are of overriding importance, biasingthe relationship between invasions and climate (Huntleyet al. 1989, Beerling et al. 1995).
At the biome level, our models show that the Nama- andsucculent karoo biomes are clearly most affected by S. mollenaturalization. Although S. molle has also been planted inthe fynbos biome, naturalization in this biome is sparse(Fig. 2b). Preliminary modelling by Rouget et al. (2004)also showed that arid areas were most vulnerable for furtherinvasion of this species. However, not all arid areas thatwere sampled face naturalization and invasion by S. molle;localised areas, mostly in the succulent- and Nama-Karoobiomes, are affected. These results are supported by studiesdemonstrating evolutionary conservation of ecologicalniches and phylogenetic inertia of species across time scales(Huntley et al. 1989, Beerling et al. 1995), because S. molleoccurs in similarly arid areas in its native ranges (Howardand Minnich 1989, Goldstein and Coleman 2004). Meanannual temperature of the coldest month (mtc), meanannual precipitation (map) potential evapotranspiration(pet) and proximity to rivers (driv) are most importantvariables explaining the naturalized distribution of S. mollein western South Africa. Proximity to rivers together withpropagule pressure explained local patterns. In the morearid areas, S. molle invades mostly along perennial andephemeral rivers. River beds probably act as conduits forseed dispersal via frugivorous birds and water and providemicrosites for seedling recruitment. Although establishmentand spread of alien plants are sometimes limited by animperfect climate match (Pysek et al. 2003), local-scaleinvasions of this species could continue with or withoutclimate change as long as riparian zones provide micrositesfor recruitment.
Schinus molle can spread in natural habitats withouthuman intervention and can infiltrate naturally-occurringdispersal networks (Milton et al. 2007, Iponga et al.2008b). All indications are that this species is still at anearly stage of invasion, and not at equilibrium withenvironmental conditions. Consequently, models calibratedusing this limited set of occurrence data probably under-estimate the potential naturalized distribution of S. molle inwestern South Africa and represent conservative predictionsof the real potential distribution of the species (although thenatural experiment of planting along roads has exposed thespecies to a very broad cross-section of potential sites thatexist in the region). The species is expected to expand itsrange when established individuals mature and act as newseed sources. This caveat must be kept in mind, whenreading this paper. Our broad-scale prediction of thepotential range of S. molle provides a first approximationfor this invasive species that otherwise would be unknownto us.
Potential distribution of naturalized individuals ofSchinus molle under climate change
It is widely thought that climate change will exacerbateproblems with invasive species (Dukes and Mooney 1999),but the many ways in which changes could affect the rangesof species, and the many complex interactions that could
Figure 2. Predicted environmental suitability for Schinus mollemodelled using locations of planted and naturalized individuals viaboosted regression trees (see text). Maps show the currentpredicted suitability for planted (a) and naturalized (b) individualsin each cell, and in panel (c) areas suitable only for planted (red),only for naturalized individuals (blue), and areas suitable for both(black).
7

potentially facilitate or hinder shifts, make accurate predic-tions very difficult (Thuiller et al. 2007). Also, the ways inwhich climatic variables will interact in the future may wellbe different from the current situation. Our models suggestthat under both climate-change scenarios examined the areasuitable for S. molle naturalization is predicted to shrinksubstantially in the Nama-karoo, succulent karoo andAlbany thicket biomes. Climate change will not only alterthe suitability for individual species, but is likely to reshufflespecies composition and possibly change ecosystem func-tioning. Such changes are certain to influence environ-mental suitability and invasibility in ways other than simplythrough altered climatic tolerance. Nonetheless, it is
unlikely that such changes will counter the overall dete-rioration of opportunities for recruitment and spread overthe next century. However, projections of potential futuredistributions also need to be interpreted with caution. Ourapproach is based on the assumption that climate is themajor driving factor of species distribution (Franklin 1998),and that analysis of the climatic preferences of species cantherefore be used to predict areas where the species couldoccur at regional, continental and global scales. Althoughclimate sets the broad limit of plant species ranges, otherfactors such as geology, soils, topography, hydrology,disturbance regime, competition and other biotic interac-tions determine the presence or absence of a species in a
Figure 3. The proportion of the total area of South Africa occupied by each biome, and the area predicted to be suitable for planted andnaturalized individuals of Schinus molle. Biomes: SV� savanna; GL�grassland; NK�Nama-Karoo; CB� Indian Ocean Coastal Belt;DT�desert; SK� succulent karoo; FB� fynbos; AT�Albany thicket (the distribution of biomes is shown in Fig. 1). Cell classified as‘‘suitable’’ if the suitability value is larger than a threshold suitability value (the value above which 95% of individuals occur). Thresholdsfor planted and naturalized trees are 0.2911517 and 0.4058979, respectively.
Figure 4. Predicted climatic suitability (for naturalization) of Schinus molle in South Africa under two scenarios of climate change (A2 andB2) for the years 2050 and 2100. Predictions were generated using only climatic variables as inputs (see Methods). The panel at top leftshows the current distribution of S. molle used to calibrate the model, and the surveyed roads without confirmed presence of the species.The panel at top right shows modelled climatic suitability using current climatic conditions.
8
particular area and at finer (regional or local) scales (Willisand Whittaker 2002).
Other limitations of this study include uncertaintiesinherent in climate-change scenarios, the use of coarseresolution GCM anomalies, and the fairly simplisticassumptions about the interactions of input data (Thuiller2004, Pearson et al. 2006). The relatively coarse scale mayalso mask potential refuges for species and environmental
heterogeneity under climate-change scenarios, especially inareas where the sampling effort was low, leading to potentialunderestimation of range of conditions that are suitable forthe species. The pixel resolution of environmental data mayalso cloud some finer-scale variations in the speciesecological requirements that are not detectable at the spatialscale of our analysis. Because the influence of eachenvironmental variable in determining the species niche is
Table 3. Predicted change in the number of cells occupied by Schinus molle under different climate-change and management scenarios forthe years 2050 (A) and 2100 (B). Changes were computed as the difference in the number of cells under no management (NM) and othermanagement scenarios (P, C, CC) by subtracting the occupancy layers (value 1�occupied; 0�not occupied) of NM scenario from theoccupancy layers of the other three management scenarios and summing up all resulting values. Positive values indicate increasedoccupation with management; negative numbers indicate reduced occupation. Percentages are given in brackets. Climate-change scenarios:N (no climate-change); A2 (temperature rise by 2.88C in 2080); and B2 (temperature rise by 2.18C in 2080). Management scenarios:P (doubling the number of planted individuals along surveyed roads); C (removing only planted individuals along the surveyed roads); andCC (removing all individuals from cells in which there are planted individuals).
A) Year: 2050
Climate-change scenario Management scenarios
NM P C CC
N 6414 �934 (�14.56%) �35 (�0.54%) �71 (�1.10%)A2 4256 �806 (�18.93%) �28 (�0.65%) �58 (�1.36%)B2 5326 �1042 (�19.56%) �35 (�0.65%) �72 (�1.35%)
B) Year: 2100
Climate-change scenarios Management scenarios
NM P C CC
N 14365 �1265 (�8.80%) �22 (�0.15%) �37 (�0.25%)A2 6860 �1288 (�18.77%) �33 (�0.48%) �90 (�1.31%)B2 9471 �1603 (�16.92%) �39 (�0.41%) �85 (�0.89%)
0
10
20
30
40 Savanna Grassland Nama−Karoo Coastal Belt
N − % suitableA2 − % suitableB2 − % suitable
N − % invadedA2 − % invadedB2 − % invaded
2000 2040 2080
0
10
20
30
40 Desert
2000 2040 2080
Succulent Karoo
2000 2040 2080
Fynbos
2000 2040 2080
Albany Thicket
% o
f cel
ls p
er b
iom
e
Year
Figure 5. The percentage of cells per biome suitable for Schinus molle (suitability�0.42) (blue lines) and invaded as predicted by thespread model (red lines) in different biomes. Solid lines indicate no climate change (N); dotted and dashed lines show climate-changescenarios A2 and B2, respectively.
9
scale dependent, different degrees of ecological nichevariation can arise among populations, depending on spatialresolution of analysis (Wiens 1989). There are alsouncertainties related to lags associated with biotic processes.Extensive habitat fragmentation, effects of rising CO2
concentrations, changing soil conditions and fire regimes,and altered biotic interactions mean that any predictions atthis scale must be viewed with some caution. Nonetheless,our results suggest that regions such as Kimberley (currentlya ‘‘hotspot’’ of S. molle invasions in South Africa) might beaffected relatively early by climate change, but that theregion will become less suitable for naturalization over time.This provides managers with a conundrum; S. molleinvasions in this region are currently regarded as a seriousconservation threat requiring urgent action (Milton et al.2007, Iponga et al. 2008b). But, is such action justified ifthe threat is likely to diminish over the next century?
Spread of Schinus molle under different managementstrategies
To determine the pattern of spread of S. molle in SouthAfrica over the next 100 yr we combined information fromclimatic suitability under scenarios of climate change andmanagement by means of a simulation spread model.Results indicates that Nama-Karoo and Albany thicketand to a lesser extent succulent karoo and fynbos biomesmay experience an increase of S. molle spread under present
and future climatic conditions, even if there was a consistentdecline of potential suitability in both future climate-changescenarios beyond 2050 for those biomes. This suggests thatalthough the conditions may not be favourable beyond2050, the species may have time to expand substantiallyduring the next few decades, and that this may facilitate thespread observed in some biomes. For example, the areasaround the town of Towerberg (in the Nama-Karoo biome)and Touwsriver (succulent karoo biome) are predicted tobecome more susceptible to invasion by S. molle comparedto Kimberley (in the savanna biome). This latter area mayexhibit a combination of climatic conditions that do notexist within the invasive range, making extrapolation ofsuitability questionable (Hartley et al. 2006). However,Towerberg and Touwsriver, showing a more constantincrease under all climate-change scenarios, may emphasisethe risk of invasion faced by the Nama-Karoo and succulentkaroo biomes.
The obvious management implication of this finding isthat early detection and eradication of this species isimportant in those areas identified as being highly suitablefor naturalization. Schinus molle could persist outside itspotential future ranges in the near to medium term becausethe species is relatively long lived (�100 yr) and produceslarge quantities of seed. Since the species does not maintaina persistent seed bank (Iponga et al. 2009b), lags inpopulation response of S. molle to deteriorating climaticconditions would be caused by the longevity and drought-hardiness of established trees, whereas lags in population
Towerberg Touwsriver Kimberley
NA
2B
2NMP
CCC
2000 2040 2080
5
50
500
5
50
500
5
50
500
2000 2040 2080 2000 2040 2080
Figure 6. Spread of Schinus molle under different climate change and management scenarios in three areas of South Africa, each 100�100 km in size: Towerberg (coordinates of centre point: 24.538E, 30.838S), Touwsriver (20.288E, 33.308S), and Kimberley (24.768E,28.968S). The x-axis represents time (from 2000 to 2100, in intervals of 10 yr), the y-axis the number of cells occupied by the species.Three climate-change scenarios are shown in the three rows (N�no change, A2 and B2. In each graph, the four management scenariosare represented by different colours: NM�no management (black) (almost identical with C, therefore not visible in the graphs); P�doubling the number of planted individuals at random along the roads (red); C� removing all planted individuals (green); CC�removing all planted and naturalized individuals in cells which have at least one planted individual (blue).
10

responses to improved climatic conditions would be drivenby local propagule pressure, plant maturaltion rate and theproximity of potential mates. Schinus molle may also bemore flexible with regard to its climatic constraints than hasbeen assumed in the spread model, and could persistoutside areas predicted to be suitable. The present studyconfirms the importance of climatic factors in explainingregional patterns of distribution in accordance with otherstudies at similar scales (Prentice et al. 1992, Franklin1998).
Problems arising from invasive plants that have value,e.g. as amenity or ornamental species, often leads toconflicts of interest between horticulturists, land owners,municipalities and conservationists (Foxcroft et al. 2008).Schinus molle is still widely used in South Africa as shadetree, especially along roads. Invasion potential coulddefinitely be reduced by promoting the use of localindigenous species as alternatives to alien species, thusreducing further plantings and propagule pressure. Removalof planted and naturalized individuals should start in theareas shown in this study as being at the highest risk ofinvasion with or without climate change and in areas withlarge propagule sources. High propagule loads generated bythe current invasive populations (e.g. in the Kimberely area)may allow the species to persist and even invade further,even under less ideal environmental conditions. Habitatsthat function as corridors or have high conservation value,as well as rivers and wetlands in arid areas, should bepriorities for clearing within areas currently invaded or athigh risk of future invasion as predicted by modelscalibrated under various climate change scenarios.
Conclusions
We have shown that combining niche modelling (whichallows us to define regions at high risk of invasions) and afine-scale process-based model (to simulate the spread of theinvasions at the landscape scale) can yield predictions thatare useful for management. Here we discuss some keyfindings that should inform management strategies forS. molle in South Africa. Firstly, removal of only someplants (e.g. large planted trees along roads) will have littleinfluence because the naturalized plants will soon becomeseed sources. Clearing of S. molle needs to be prioritized inthose areas where environmental suitability is predicted toincrease under climate change (Fig. 4). In areas wheredecreased environmental suitability is predicted, manage-ment could be limited to sensitive sites and areas whereinvasive stands are already having severe impacts onecosystems (see Iponga et al. 2008b for discussion). Schinusmolle has been widely considered a relatively ‘‘safe’’ alientree until recently. However, its ability to disrupt naturalecosystems has been clearly documented (Iponga et al.2008b). Despite the evidence provided in this paper whichsuggests that much of its current range in western SouthAfrica will become less favourable for the species underclimate change, the species is already well established overlarge areas. It may persist long after conditions forestablishment have deteriorated. Also, several areas wherethe species is currently not widely naturalized (notablyfynbos and grassland areas) are predicted to become more
favourable. Consequently, we recommend that the speciesshould be declared a category-1 invasive species in parts ofthat country, notably the Eastern Cape, Northern Cape andWestern Cape. Category-1 invasive species, according to theConservation of Agriculture Resources Act, are prohibitedon any land except in areas demarcated as reserves forbiological control agents; <www.nda.agric.za/docs/act43/Eng.htm>. The threats posed by the species, effectivemethods for removing stands and individuals, and goodalternatives (ideally native species) need to be publicized.
The approach presented in this study provides a goodplatform for predicting invasion potential that can beidentified and assessed before an invasion takes place andhas been used and implemented in invasive speciesmonitoring schemes for emerging invasive species atnational and state level in many other countries (Zalbaet al. 2000, Welk et al. 2002). The application of themethod to S. molle in South Africa has shown its utility, buthas also identified key areas of uncertainty that must beconsidered when interpreting the results. More realisticmodels of the impacts of climate change on S. molleenvironmental suitability and range shifts are needed toaddress the complex interactions between many factorsaffecting S. molle distribution other than climate, includingbiotic interactions, evolutionary change and dispersalcapacity. The issues highlighted in this paper will guidesuch work.
Acknowledgements � We acknowledge support from the DST-NRFCentre of Excellence for Invasion Biology. DMR and WT weresupported by the International Research Network (GDRI) project‘‘France South Africa � Dynamics of biodiversity in SouthernAfrican ecosystems and sustainable use in the context of globalchange: processes and mechanisms involved’’, and NR-P from theCatalan Agency for Management of Univ. and Research Grants(Generalitat de Catalunya) through Beatriu de Pinos PostdoctoralGrants 2006 BP-A 10124 and 2008 BP-B 00042. DMR acknowl-edges support from the Hans Sigrist Foundation.
References
Allen, R. G. et al. 1998. Crop evapotranspiration guidelines forcomputing crop water requirements. � Food and Agric. Org.UN, Rome, Italy.
Beerling, D. J. et al. 1995. Climate change and the distribution ofFallopia japonica: use of an introduced species to test thepredictive capacity of response surface. � J. Veg. Sci. 6: 269�282.
Breiman, L. et al. 1984. Classification and regression trees.� Chapman and Hall.
Curnutt, J. L. 2000. Host-area specific climatic matching:similarity breeds exotic. � Biol. Conserv. 94: 341�351.
Dukes, J. S. and Mooney, H. A. 1999. Does global changeincrease the success of biological invaders? � Trends Ecol. Evol.14: 135�139.
Elith, J. et al. 2008. A working guide to boosted regression trees.� J. Anim. Ecol. 77: 802�813.
Engler, R. and Guisan, A. 2009. MigClim: predicting plantdistribution and dispersal in a changing climate. � Divers.Distrib. 15: 590�601.
Foxcroft, L. C. et al. 2004. Reconstructing 50 years of Opuntiastricta invasion in Kruger National Park, South Africa:
11

environmental determinants and propagule pressure. � Divers.Distrib. 10: 427�437.
Foxcroft, L. C. et al. 2008. Ornamental plants as invasive aliens:problems and solutions in the Kruger National Park, SouthAfrica. � Environ. Manage. 41: 32�51.
Franklin, J. 1998. Predicting the distribution of shrub species insouthern California from climate and terrain-derived variables.� J. Veg. Sci. 9: 733�748.
Friedman, J. H. 2001. Greedy function approximation: a gradientboosting machine. � Ann. Stat. 29: 1189�1232.
Friedman, J. H. and Meulman, J. J. 2003. Prediction withmultiple additive regression trees with application in epide-miology. � Stat. Med. 22: 1365�1381.
Gordon, C. et al. 2000. The simulation of SST, sea ice extents andocean heat transports in a version of the Hadley Centrecoupled model without flux adjustments. � Clim. Dyn. 16:147�168.
Guisan, A. and Zimmermann, N. E. 2000. Predictive habitatdistribution models in ecology. � Ecol. Model. 135: 147�186.
Guisan, A. and Thuiller, W. 2005. Predicting species distribution:offering more than simple habitat models. � Ecol. Lett. 8:993�1009.
Goldstein, D. J. and Coleman, R. C. 2004. Schinus molle L.(Anacardiaceae) chicha production in central Andes. � Econ.Bot. 58: 523�529.
Hartley, S. et al. 2006. Quantifying uncertainty in the potentialdistribution of an invasive species: climate and the Argentineant. � Ecol. Lett. 9: 1068�1079.
Heikkinen, R. K. et al. 2006. Methods and uncertainties inbioclimatic envelope modelling under climate change. � Prog.Phys. Geogr. 30: 751�777.
Henderson, L. 2001. Alien weeds and invasive plants. � PlantProtection Research Inst. Handb. 12, Agric. Res. Coun.,Pretoria, South Africa.
Hewitson, B. 2003. Developing perturbations for climate changeimpact assessments. � EOS 84: 337�339.
Howard, L. F. and Minnich, R. A. 1989. The introduction andnaturalization of Schinus molle (pepper tree) in riverside,California. � Landscape Urban Plan. 18: 77�95.
Huntley, B. et al. 1989. Climatic control of the distribution andabundance of beech (Fagus L.) in Europe and North America.� J. Biogeogr. 16: 551�560.
Inglis, G. J. et al. 2006. Using habitat suitability index and particledispersion models for early detection of marine invaders.� Ecol. Appl. 16: 1377�1390.
IPCC-TGCIA 1999. Guidelines on the use of scenario data forclimate impact and adaptation assessment. Version 1.� Intergovernmental Panel on Climate Change, Task Groupon Scenarios for Climate Impact Assessment.
IPCC-TGICA 2007. General guidelines on the use of scenariodata for climate impact and adaptation assessment. Version 2.� Intergovernmental Panel on Climate Change, Task Groupon Data and Scenario Support for Impact and ClimateAssessment.
Iponga, D. M. et al. 2008a. Insect seed predation in Schinus molle(Peruvian pepper tree) differs with rainfall seasonality in SouthAfrica: implications for invasiveness. � Afr. Entomol. 16: 127�131.
Iponga, D. M. et al. 2008b. Superiority in competition for light: acrucial attribute of the invasive alien tree Schinus molle(Peruvian pepper tree) in shaping its impact in semi-aridSouth African savanna. � J. Arid Environ. 72: 612�623.
Iponga, D. M. et al. 2009a. Soil type, microsite, and herbivoryinfluence growth and survival of Schinus molle (Peruvianpepper tree) invading semi-arid African savanna. � Biol.Invasions. 11: 159�169.
Iponga, D. M. et al. 2009b. Reproductive potential and seedlingestablishment of the invasive alien tree Schinus molle (Anacar-diaceae) in South Africa. � Austral Ecol. 34: 678�687.
Lynch, S. D. 2003. Development of a raster database of annual,monthly and daily rainfall for southern Africa. � WRC ReportNo. 1156/1/03, School of Bioresources Engineering andEnvironmental Hydrology, Pietermaritzburg, South Africa.
Milton, S. J. et al. 2007. Invasive alien plants infiltrate bird-mediated shrub nucleation processes in arid savanna. � J. Ecol.95: 648�661.
Mucina, L. and Rutherford, M. C. 2006. The vegetation of SouthAfrica, Lesotho and Swaziland. Strelitzia 19. � South AfricanNational Biodiversity Inst., Pretoria, South Africa.
Nakicenovic, N. and Swart, R. 2000. Emissions scenarios. � Aspecial report of Working Group III of the IntergovernmentalPanel on Climate Change, Cambridge Univ. Press.
Nel, J. L. et al. 2004. A proposal classification of invasive alienplant species in South Africa: towards prioritizing species andareas for management action. � S. Afr. J. Sci. 100: 53�64.
Nel, J. L. et al. 2007. Rivers in peril inside and outside protectedareas: a systematic approach to conservation assessment of riverecosystems. � Divers. Distrib. 13: 341�352.
Nilsen and Muller 1980. Please provide further details.Nilsen and Muller 1980a. Please provide further details.Nilsen and Muller 1980b. Please provide further details.Pearson, R. G. and Dawson, T. E. 2003. Predicting the impacts of
climate change on distribution of species: are bioclimateenvelope models useful? � Global Ecol. Biogeogr. 12: 361�371.
Pearson, R. G. et al. 2006. Model-based uncertainty in species’range prediction. � J. Biogeogr. 33: 1704�1711.
Peterson, A. T. et al. 2002. Future projections for Mexican faunasunder global climate change scenarios. � Nature 416: 626�629.
Prentice, I. C. et al. 1992. A global biome model based on plantphysiology and dominance, soil properties and climate.� J. Biogeogr. 19: 117�134.
Pysek, P. et al. 2003. Inclusion of native and alien species intemperate nature reserves: an historical study from centralEurope. � Conserv. Biol. 17: 1414�1424.
Pysek, P. et al. 2004. Alien plants in checklists and floras: towardsbetter communication between taxonomists and ecologists.� Taxon 53: 131�143.
Randin, C. F. et al. 2006. Are niche-based species distributionmodels transferable in space? � J. Biogeogr. 33: 1689�1703.
Richardson, D. M. and Pysek, P. 2006. Plant invasions: mergingthe concepts of species invasiveness and community invasi-bility. � Prog. Phys. Geogr. 30: 409�431.
Richardson, D. M. and Thuiller, W. 2007. Home away fromhome � objective mapping of high-risk source areas for plantintroductions. � Divers. Distrib. 13: 299�323.
Ridgeway, G. 1999. The state of boosting. � Comp. Sci. Stat. 31:172�181.
Rouget, M. and Richardson, D. M. 2003. Understanding patternsof plant invasion at different spatial scales: quantifying theroles of environment and propagule pressure. � In: Child, L. E.et al. (eds), Plant invasions: ecological threats and managementsolutions. Backhuys Publ., pp. 3�15.
Rouget, M. et al. 2004. Mapping the potential ranges of majorplant invaders in South Africa, Lesotho and Swaziland usingclimatic suitability. � Divers. Distrib. 10: 475�484.
Roura-Pascual, N. et al. 2009. From introduction to equilibrium:reconstructing the invasive pathways of the Argentine ant in aMediterranean region. � Global Change Biol., doi: 10.1111/j.1365-2486.2009.01907.x.
12

Rousteenoja, K. et al. 2003. Future climate in world regions: anintercomparison of model-based projections for the new IPCCemissions scenarios. � Finnish Environment Inst., Helsinki,Finland.
Sanderson, E. W. et al. 2002. The human footprint and the last ofthe wild. � Bioscience 52: 891�904.
Schulze, R. E. 1997. South African Atlas of Agrohydrology andClimatology. � Water Research Commission, Pretoria, SouthAfrica.
Swets, J. A. 1988. Measuring the accuracy of diagnostic systems.� Science 240: 1285�1293.
Thuiller, W. 2004. Patterns and uncertainties of species range shiftunder climate change. � Global Change Biol. 10: 2020�2027.
Thuiller, W. et al. 2006. Interactions between environment,species traits and human uses describe patterns of plantinvasions. � Ecology 87: 1755�1769.
Thuiller, W. et al. 2007. Will climate change promote alien plantinvasions? � In: Nentwig, W. (ed.), Biological invasions.Springer, pp. 197�211.
Welk, E. et al. 2002. Present and potential distribution of invasivegarlic mustard (Alliaria petiolata) in North America. � Divers.Distrib. 8: 219�233.
Wiens, J. A. 1989. Spatial scaling in ecology. � Funct. Ecol. 3:385�397.
Willis, K. J. and Whittaker, R. J. 2002. Species diversity-scalematters. � Science 295: 1245�1248.
Wilson, J. R. U. et al. 2007. Residence time and potential range:crucial considerations in modelling plant invasions. � Divers.Distrib. 13: 11�22.
Zalba, S. M. et al. 2000. Using a habitat model to assess the risk ofinvasion by an exotic plant. � Biol. Conserv. 93: 203�208.
Download the Supplementary material as file E6350 from<www.oikos.ekol.lu.se/appendix>.
13