accountabilityandtesting.brevardschools.orgaccountabilityandtesting.brevardschools.o… · Web...
24
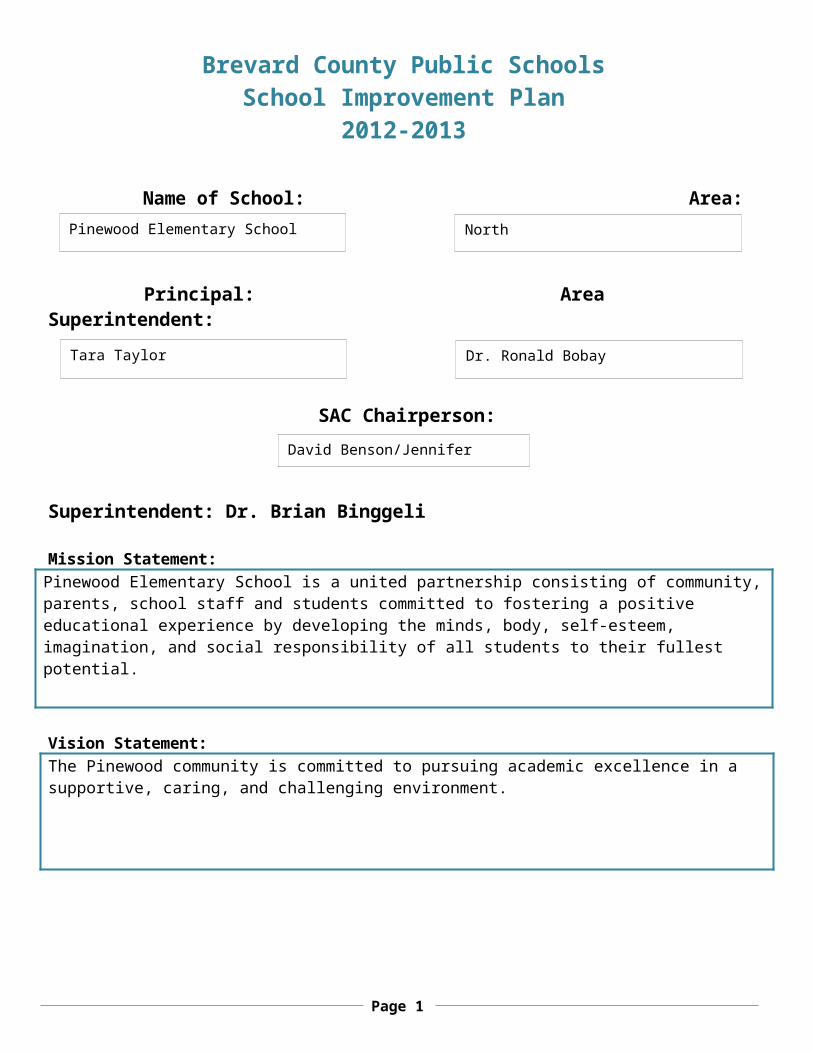
Brevard County Public Schools School Improvement Plan 2012-2013 Name of School: Area: Principal: Area Superintendent: SAC Chairperson: Superintendent: Dr. Brian Binggeli Mission Statement: Pinewood Elementary School is a united partnership consisting of community, parents, school staff and students committed to fostering a positive educational experience by developing the minds, body, self-esteem, imagination, and social responsibility of all students to their fullest potential. Vision Statement: The Pinewood community is committed to pursuing academic excellence in a supportive, caring, and challenging environment. Pinewood Elementary School North Tara Taylor Dr. Ronald Bobay David Benson/Jennifer Page 1
Transcript of accountabilityandtesting.brevardschools.orgaccountabilityandtesting.brevardschools.o… · Web...
Brevard County Public SchoolsSchool Improvement Plan
2012-2013
Name of School: Area:
Principal: Area Superintendent:
SAC Chairperson:
Superintendent: Dr. Brian Binggeli
Mission Statement: Pinewood Elementary School is a united partnership consisting of community, parents, school staff and students committed to fostering a positive educational experience by developing the minds, body, self-esteem, imagination, and social responsibility of all students to their fullest potential.
Vision Statement: The Pinewood community is committed to pursuing academic excellence in a supportive, caring, and challenging environment.
Pinewood Elementary School North
Tara Taylor Dr. Ronald Bobay
David Benson/Jennifer Evans
Page 1

Brevard County Public SchoolsSchool Improvement Plan
2012-2013RATIONAL – Continuous Improvement Cycle Process
Data Analysis from multiple data sources: (Needs assessment that supports the need for improvement)
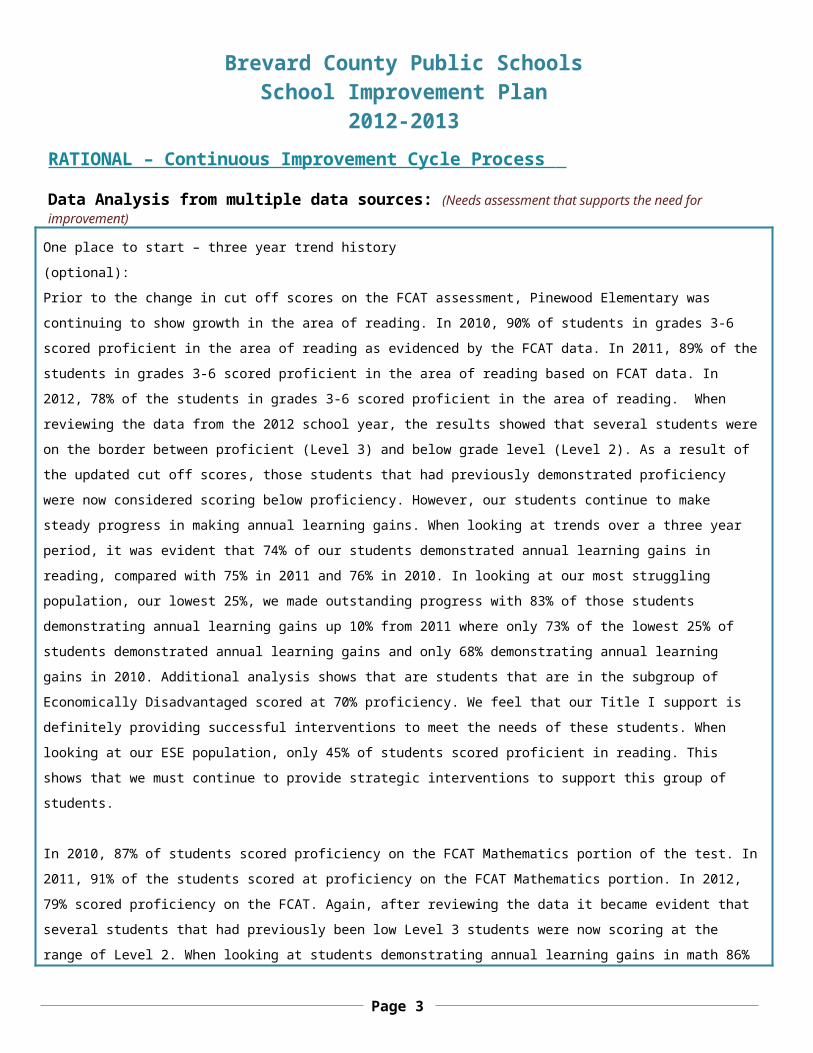
One place to start – three year trend history (optional):Prior to the change in cut off scores on the FCAT assessment, Pinewood Elementary was continuing to show growth in the area of reading. In 2010, 90% of students in grades 3-6 scored proficient in the area of reading as evidenced by the FCAT data. In 2011, 89% of the students in grades 3-6 scored proficient in the area of reading based on FCAT data. In 2012, 78% of the students in grades 3-6 scored proficient in the area of reading. When reviewing the data from the 2012 school year, the results showed that several students were on the border between proficient (Level 3) and below grade level (Level 2). As a result of the updated cut off scores, those students that had previously demonstrated proficiency were now considered scoring below proficiency. However, our students continue to make steady progress in making annual learning gains. When looking at trends over a three year period, it was evident that 74% of our students demonstrated annual learning gains in reading, compared with 75% in 2011 and 76% in 2010. In looking at our most struggling population, our lowest 25%, we made outstanding progress with 83% of those students demonstrating annual learning gains up 10% from 2011 where only 73% of the lowest 25% of students demonstrated annual learning gains and only 68% demonstrating annual learning gains in 2010. Additional analysis shows that are students that are in the subgroup of Economically Disadvantaged scored at 70% proficiency. We feel that our Title I support is definitely providing successful interventions to meet the needs of these students. When looking at our ESE population, only 45% of students scored proficient in reading. This shows that we must continue to provide strategic interventions to support this group of students.
In 2010, 87% of students scored proficiency on the FCAT Mathematics portion of the test. In 2011, 91% of the students scored at proficiency on the FCAT Mathematics portion. In 2012, 79% scored proficiency on the FCAT. Again, after reviewing the data it became evident that several students that had previously been low Level 3 students were now scoring at the range of Level 2. When looking at students demonstrating annual learning gains in math 86% of tested students showed annual learning gains compared with 86% in 2011 and 74% in 2010. Again, looking at the lowest 25% of students 83% demonstrated annual learning gains in 2012 compared with 86% in 2011 and 68% in 2010. Pinewood continues to show great progress in meeting the diverse needs of our population especially the gains demonstrated with our most struggling population of the lowest 25%. 72% of our Economically Disadvantaged subgroup scored proficiency in mathematics. While only 48% of our ESE subgroup scored at proficiency.
Page 2
In 2012, the writing scoring process was updated and the proficiency score was 3.0. 90% of our fourth graders scored at the proficiency level compared with 95% in 2011 and 93% in 2010. In reviewing the results, we continue to be proud of our results, but understand the need for increased instruction in grammar and spelling to show continuous improvement.
In science, 77% of the fifth graders scored at the proficiency level in 2012 compared with 84% in 2011 and 74% in 2010. We continue to analyze the standards addressed in each grade level to ensure that mastery of standards is occurring in each grade level.
Currently, for the first F.A.I.R. assessment window Kindergarten has 72% of students scoring at or above proficiency for Probability of Reading Success (PRS), 1st grade has 25% of students scoring at or above proficiency for PRS and Second Grade has 8% of students scoring at or proficient for PRS. Upon analysis of the past three years of primary F.A.I.R. Pinewood has shown steady increases in students performing at or above proficiency for Probability of Reading Success Scores (PRS) in Kindergarten and First Grade. Unfortunately, there has also been a disturbing trend of little to no growth in Second grade for those students scoring at or above proficiency in the PRS. For school years 2009/2010 Kindergarten demonstrated an 18 point gain, 1st grade demonstrated a 15 point gain, however 2nd grade only demonstrated a 2 point gain in those students scoring at or above proficiency in Probability of Reading Success. For school years 2010/2011 Kindergarten demonstrated a 17-point gain, 1st grade demonstrated a 19-point gain, however 2nd grade demonstrated a 10-point loss in students performing at or above proficiency. This trend continued into school year 2011/2012 with Kindergarten demonstrating a 20-point gain, 1st demonstrating a 17-point gain and once again 2nd grade demonstrating no change in students performing at or above proficiency. Upon further analysis of this declining trend in 2nd grade, a deficit in phonemic awareness is evident indicating a need for further skill building during and outside of our 90 minute reading block.
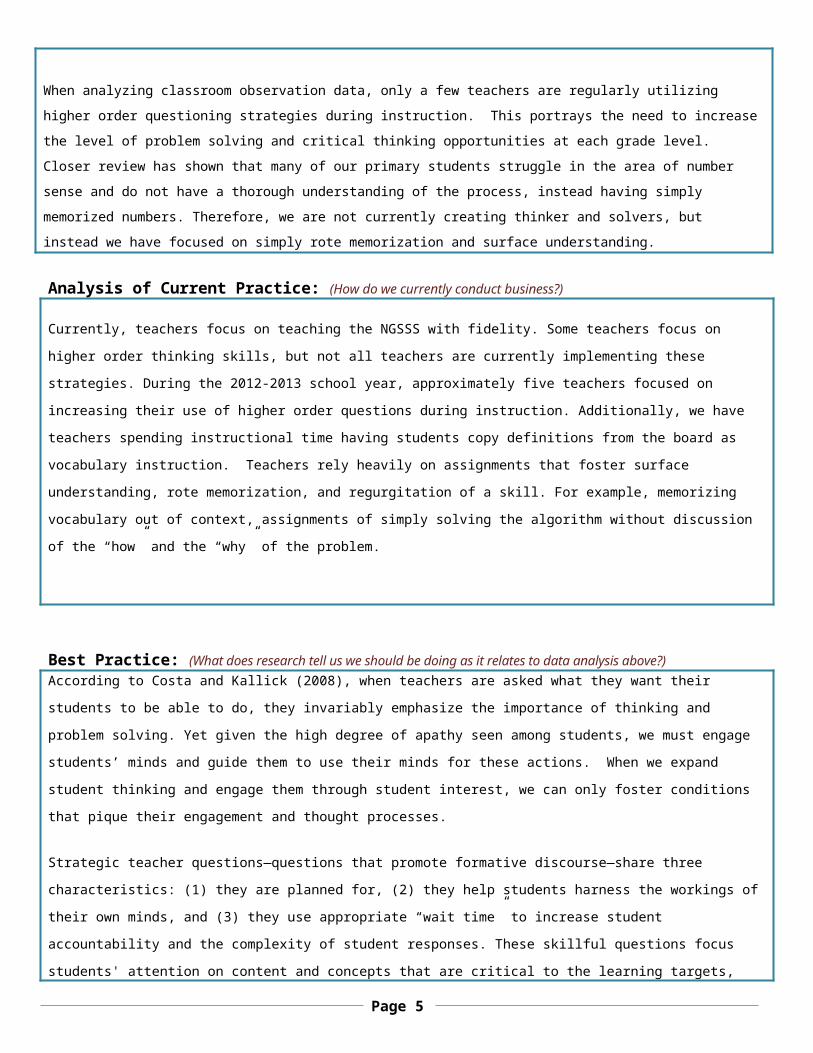
When analyzing classroom observation data, only a few teachers are regularly utilizing higher order questioning strategies during instruction. This portrays the need to increase the level of problem solving and critical thinking opportunities at each grade level. Closer review has shown that many of our primary students struggle in the area of number sense and do not have a thorough understanding of the process, instead having simply memorized numbers. Therefore, we are not currently creating thinker and solvers, but instead we have focused on simply rote memorization and surface understanding.
Analysis of Current Practice: (How do we currently conduct business?)
Currently, teachers focus on teaching the NGSSS with fidelity. Some teachers focus on higher order thinking skills, but not all teachers are currently implementing these strategies. During the 2012-2013 school year, approximately five teachers focused on increasing their use of higher order questions during instruction. Additionally, we have teachers spending instructional time having students copy definitions from the board
Page 3

as vocabulary instruction. Teachers rely heavily on assignments that foster surface understanding, rote memorization, and regurgitation of a skill. For example, memorizing vocabulary out of context, assignments of simply solving the algorithm without discussion of the “how” and the “why” of the problem.
Best Practice: (What does research tell us we should be doing as it relates to data analysis above?)According to Costa and Kallick (2008), when teachers are asked what they want their students to be able to do, they invariably emphasize the importance of thinking and problem solving. Yet given the high degree of apathy seen among students, we must engage students’ minds and guide them to use their minds for these actions. When we expand student thinking and engage them through student interest, we can only foster conditions that pique their engagement and thought processes.
Strategic teacher questions—questions that promote formative discourse—share three characteristics: (1) they are planned for, (2) they help students harness the workings of their own minds, and (3) they use appropriate “wait time” to increase student accountability and the complexity of student responses. These skillful questions focus students' attention on content and concepts that are critical to the learning targets, build logically and directly on students' prior knowledge, stimulate students' reasoning in ways that help them formulate personal responses, and result in learning that is richer, deeper, and more integrated (Dillon, 1988; Walsh & Sattes, 2005).
Best practices tell us to preview key vocabulary prior to seeing it in text as a tool for building vocabulary with students. To keep students engaged in the word preview, consider selecting words that are most critical to understanding the text. To keep the number of pretaught words to a minimum, words that are the specific names of members of a known category can be left for students to connect with the storage categories they already have in long-term memory. For example, if the text mentions a food, and it can be inferred through contextual clues that the word refers to a type of food, students can connect the new word with the known category on their own. However, words that should be pretaught are those that are critical for understanding the meaning of the text, appear frequently throughout a text, are important terminology for understanding the text or content (and that are not explained within the text), and words that students will encounter often in their future reading or discussions (Roit, 2002).
Page 4
CONTENT AREA: Reading Math Writing Science Parental
InvolvementDrop-out Programs
Language Arts
Social Studies
Arts/PE Other:
School Based Objective: (Action statement: What will we do to improve programmatic and/or instructional effectiveness?)
In the 2012-2013 school year, all teachers will utilize higher order thinking strategies and using vocabulary in context during reading/activity lessons as demonstrated by observations and peer collaboration with specific and honest feedback.
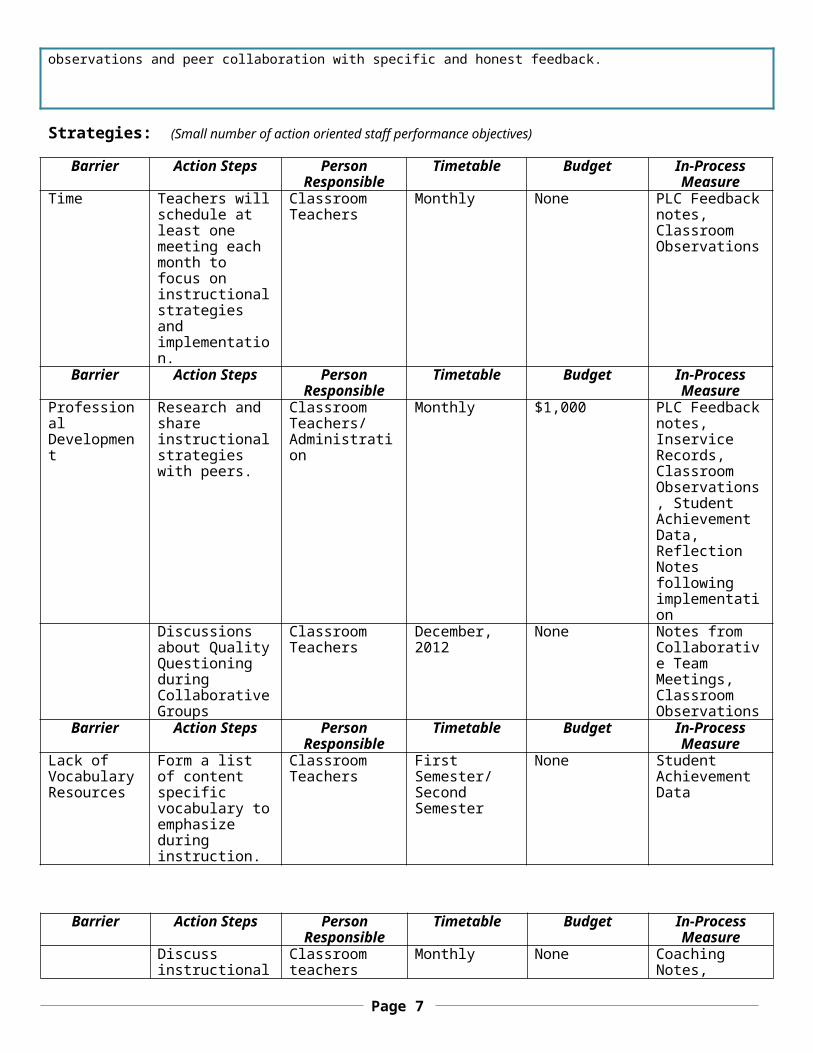
Strategies: (Small number of action oriented staff performance objectives)
Barrier Action Steps Person Responsible
Timetable Budget In-ProcessMeasure
Time Teachers will schedule at least one meeting each month to focus on instructional strategies and implementation.
Classroom Teachers
Monthly None PLC Feedback notes, Classroom Observations
Barrier Action Steps Person Responsible
Timetable Budget In-ProcessMeasure
Professional Development
Research and share instructional strategies with peers.
Classroom Teachers/Administration
Monthly $1,000 PLC Feedback notes, Inservice Records, Classroom Observations, Student Achievement Data, Reflection Notes following implementation
Discussions about Quality Questioning during Collaborative Groups
Classroom Teachers
December, 2012
None Notes from Collaborative Team Meetings, Classroom Observations
Barrier Action Steps Person Responsible
Timetable Budget In-ProcessMeasure
Lack of Vocabulary Resources
Form a list of content specific vocabulary to
Classroom Teachers
First Semester/Second
None Student Achievement Data
Page 5

emphasize during instruction.
Semester
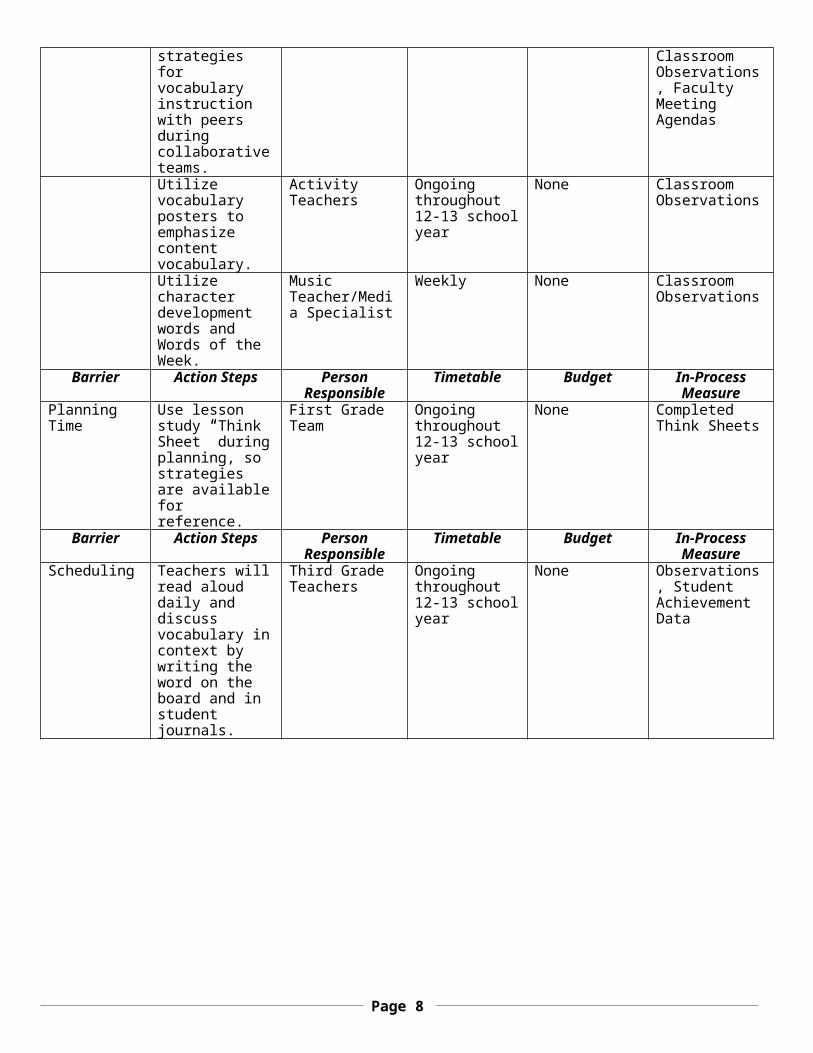
Barrier Action Steps Person Responsible
Timetable Budget In-ProcessMeasure
Discuss instructional strategies for vocabulary instruction with peers during collaborative teams.
Classroom teachers
Monthly None Coaching Notes, Classroom Observations, Faculty Meeting Agendas
Utilize vocabulary posters to emphasize content vocabulary.
Activity Teachers
Ongoing throughout 12-13 school year
None Classroom Observations
Utilize character development words and Words of the Week.
Music Teacher/Media Specialist
Weekly None Classroom Observations
Barrier Action Steps Person Responsible
Timetable Budget In-ProcessMeasure
Planning Time
Use lesson study “Think Sheet” during planning, so strategies are available for reference.
First Grade Team
Ongoing throughout 12-13 school year
None Completed Think Sheets
Barrier Action Steps Person Responsible
Timetable Budget In-ProcessMeasure
Scheduling Teachers will read aloud daily and discuss vocabulary in context by writing the word on the board and in student journals.
Third Grade Teachers
Ongoing throughout 12-13 school year
None Observations, Student Achievement Data
Page 6
EVALUATION – Outcome Measures and Reflection
Qualitative and Quantitative Professional Practice Outcomes: (Measures the level of implementation of the professional practices throughout the school)
All classroom teachers will implement higher order questioning strategies during reading instruction daily. Teachers will utilize essential questions that students can answer following the lesson. Teachers will be observed having students summarize learning throughout the lesson, not just at the end of the lesson. This will serve as formative assessment and allow for reteaching of strategies, as needed. 100% of teachers will display higher order thinking strategies in lesson planning. During classroom observations, 90% of teachers will demonstrate higher order thinking strategies with students.
Qualitative and Quantitative Student Achievement Expectations: (Measures of student achievement)
Students will have daily opportunities for higher order thinking to include analyzing and summarizing content information.
Student achievement will be measured qualitatively by the use of classroom walkthrough and teacher/peer observation data that demonstrates the use of the high yield strategies, Extended Thinking Strategies and Using Vocabulary in Context on a weekly basis. Student achievement will be measured quantitatively by the use of district assessments: District Required Literacy Assessments, District Required Math Assessments, District required Science Assessments, District Required Social Studies Assessments, FAIR, and FCAT. Teachers will show a 10% increase (approximately 3 students per class) in the number of students on grade level at the beginning of the year (August 2012) as compared to the end of the year (May 2013). Using the 2013 FCAT data, Pinewood looks to have 82% of students scoring proficient in reading and 84% scoring proficient in math.
Page 7
APPENDIX A
(ALL SCHOOLS)Reading Goal
1.2012 Current
Level of Performance
(Enter percentage information and the number of students that percentage reflects ie.
28%=129 students)
2013 Expected Level of
Performance(Enter percentage
information and the number of students that percentage reflects ie. 31%=1134 students)
Anticipated Barrier(s):1.
Strategy(s):1.
FCAT 2.0Students scoring at Achievement Level 3
Barrier(s): Foundational skill deficits in comprehension
Strategy(s):1. Skill based intervention groups for on grade level students to
close gaps in comprehension.2. Increase use of Quality Questioning strategies to support higher
order thinking.
37% (68) 40% (71)
Florida Alternate Assessment: Students scoring at levels 4, 5, and 6 in Reading
Barrier(s):
Strategy(s):
1.
N/A N/A
FCAT 2.0Students scoring at or above Achievement Levels 4 and 5 in Reading
Barrier(s): Lacking Acceleration and Enrichment Opportunities
Strategy(s):1. Incorporate literature circles to support critical thinking and
inferencing.2. Increase the use of Quality Questioning strategies to support
higher order thinking.
41% (76) 42% (75)
Florida Alternate Assessment:Students scoring at or above Level 7 in Reading
Barrier(s):
Strategy(s):1.
N/A N/A
Florida Alternate Assessment:Percentage of students making learning Gains in Reading
Barrier(s):
N/A N/A
Page 8

Strategy(s):1.
FCAT 2.0Percentage of students in lowest 25% making learning gains in Reading
Barrier(s): Motivation, Skill Deficits
Strategy(s):1. Integration of technology to increase student engagement and
motivation.2. Reading Counts opportunities
Florida Alternate Assessment:Percentage of students in Lowest 25% making learning gains in ReadingBarrier(s):
Strategy(s):1.
83% (31) 84% (32)
Ambitious but Achievable Annual Measurable Objectives (AMOs). In six years school will reduce their Achievement Gap by 50%:
Baseline data 2010-11:
Student subgroups by ethnicity NOT making satisfactory progress in reading :
White:
Black:
Hispanic:
Asian:
American Indian:
Enter numerical data for current level of performance
21% (33)
38% (3)
17% (1)
0% (0)
100% (1)
Enter numerical data for expected level of
performance
18% (29)
25% (2)
0% (0)
0% (0)0% (0)
English Language Learners (ELL) not making satisfactory progress in ReadingBarrier(s): Skill deficits in vocabulary and comprehension skills
Strategy(s):1. Small skill based intervention groups focusing on isolated skills
determined by district assessment data. 2. Higher Ordering Questioning strategies to support critical thinking.3. Use of essential questions and opportunities for summarizing.
33% (1) 0% (0)
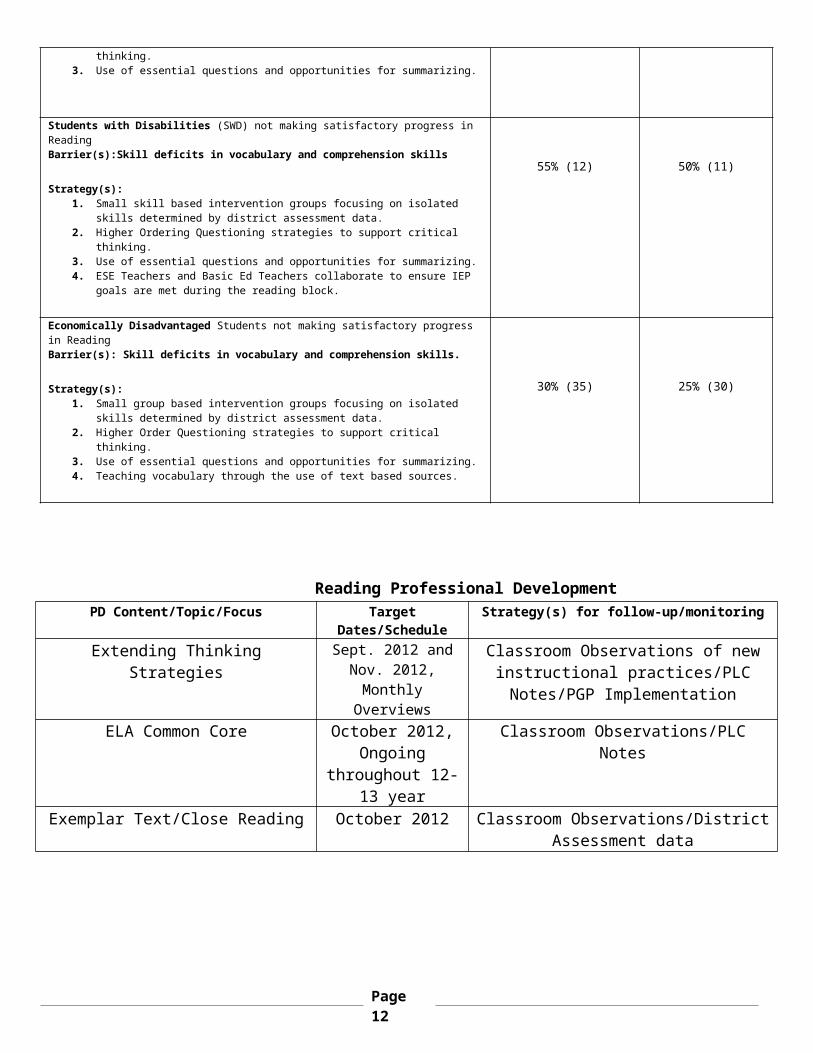
Students with Disabilities (SWD) not making satisfactory progress in ReadingBarrier(s):Skill deficits in vocabulary and comprehension skills
Strategy(s):1. Small skill based intervention groups focusing on isolated skills
determined by district assessment data.2. Higher Ordering Questioning strategies to support critical thinking.3. Use of essential questions and opportunities for summarizing.4. ESE Teachers and Basic Ed Teachers collaborate to ensure IEP goals are
met during the reading block.
55% (12) 50% (11)
Economically Disadvantaged Students not making satisfactory progress in ReadingBarrier(s): Skill deficits in vocabulary and comprehension skills.
Strategy(s):1. Small group based intervention groups focusing on isolated skills
determined by district assessment data.2. Higher Order Questioning strategies to support critical thinking.3. Use of essential questions and opportunities for summarizing.4. Teaching vocabulary through the use of text based sources.
30% (35) 25% (30)
Page 9

Reading Professional DevelopmentPD Content/Topic/Focus Target
Dates/ScheduleStrategy(s) for follow-up/monitoring
Extending Thinking Strategies Sept. 2012 and Nov. 2012,
Monthly Overviews
Classroom Observations of new instructional practices/PLC Notes/PGP Implementation
ELA Common Core October 2012, Ongoing
throughout 12-13 year
Classroom Observations/PLC Notes
Exemplar Text/Close Reading October 2012 Classroom Observations/District Assessment data
Mathematics Goal(s):1.
2012 Current Level of
Performance(Enter
percentage information and the number of students that percentage
reflects)
2013 Expected Level of
Performance(Enter percentage information and the number of students that percentage
reflects)
CELLA GOAL Anticipated Barrier
Strategy Person/Process/
Monitoring2012 Current Percent of Students Proficient in Listening/ Speaking:
2012 Current Percent of Students Proficient in Reading:
2012 Current Percent of Students Proficient in Writing:
100%
100%
100%
Page 10

Anticipated Barrier(s):1.
Strategy(s):1.
FCAT 2.0Students scoring at Achievement Level 3Barrier(s): Lack of Number Sense among students, Lack of Higher Order Thinking skill opportunities
Strategy(s):1. Provide Professional Development in Number Sense.2. Utilize Number Talk Strategies with the students to
support increased understanding of number sense.3. Provide small group instruction to address basic math
deficits.4. Provide opportunities for text based examples of math
vocabulary.
37% (67) 40% (72)
Florida Alternate Assessment: Students scoring at levels 4, 5, and 6 in MathematicsBarrier(s):
Strategy(s):1.
N/A N/A
FCAT 2.0Students scoring at or above Achievement Levels 4 and 5 in MathematicsBarrier(s):Lack of Higher Order Thinking skill opportunities
Strategy(s):1. Provide Professional Development in Higher Order
Questioning Strategies.2. Provide small group instruction to support differentiated
instruction for students.3. Provide opportunities for text based examples of math
vocabulary.
43% (78) 44% (78)
Florida Alternate Assessment:Students scoring at or above Level 7 in MathematicsBarrier(s):
Strategy(s):1.
N/A N/A
Florida Alternate Assessment:Percentage of students making learning Gains in MathematicsBarrier(s):
Strategy(s):1.
N/A N/A
FCAT 2.0Percentage of students in lowest 25% making learning gains in MathematicsBarrier(s): Lack of Number Sense among students, Lack of Higher Order Thinking skill opportunities
Strategy(s):1. Provide Professional Development in Number Sense.2. Utilize Number Talk Strategies with the students to
support increased understanding of number sense.3. Provide small group instruction to address basic math
deficits.4. Provide opportunities for text based examples of math
vocabulary.
83% (34) 84% (37)
Florida Alternate Assessment:N/A N/A
Page 11
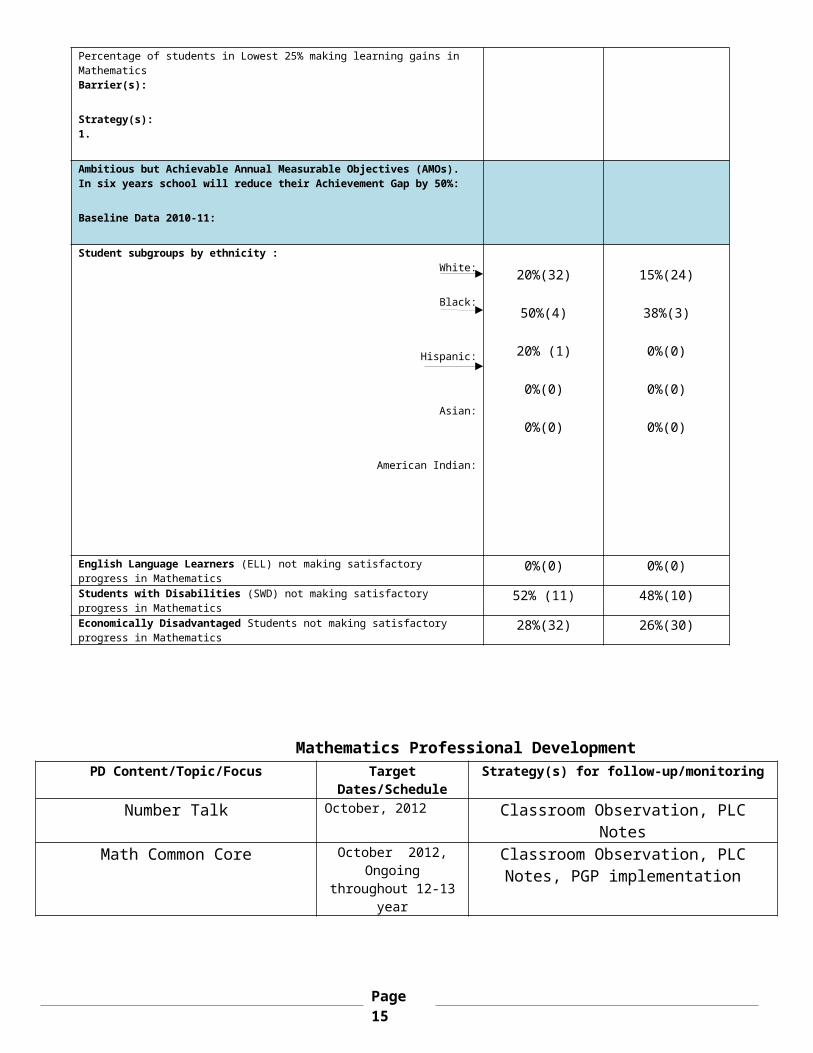
Percentage of students in Lowest 25% making learning gains in MathematicsBarrier(s):
Strategy(s):1.
Ambitious but Achievable Annual Measurable Objectives (AMOs). In six years school will reduce their Achievement Gap by 50%:
Baseline Data 2010-11:
Student subgroups by ethnicity :White:
Black:
Hispanic:
Asian:
American Indian:
20%(32)
50%(4)
20% (1)
0%(0)
0%(0)
15%(24)
38%(3)
0%(0)
0%(0)
0%(0)
English Language Learners (ELL) not making satisfactory progress in Mathematics
0%(0) 0%(0)Students with Disabilities (SWD) not making satisfactory progress in Mathematics
52% (11) 48%(10)Economically Disadvantaged Students not making satisfactory progress in Mathematics
28%(32) 26%(30)
Mathematics Professional DevelopmentPD Content/Topic/Focus Target
Dates/ScheduleStrategy(s) for follow-up/monitoring
Number Talk October, 2012 Classroom Observation, PLC Notes
Math Common Core October 2012, Ongoing throughout
12-13 year
Classroom Observation, PLC Notes, PGP implementation
Writing 2012 Current Level of Performance
(Enter percentage information and the number of students
that percentage reflects)
2013 Expected Level of
Performance(Enter percentage information and the number of students that percentage
reflects)Barrier(s):Lack of grammar and spelling conventions
Page 12

Strategy(s):1. Additional focus on
grammar and spelling of High Frequency Words in the primary grade levels.
2. Increased opportunities for writing to inform.
FCAT: Students scoring at Achievement level 3.0 and higher in writing 90%(41) 91%(39)Florida Alternate Assessment: Students scoring at 4 or higher in writing N/A N/A
Science Goal(s)(Elementary and Middle)
1.
2012 Current Level of Performance
(Enter percentage information and the number of students
that percentage reflects)
2013 Expected Level of
Performance(Enter percentage information and the number of students that percentage
reflects)Barrier(s):Lack of hands-on opportunities in the primary grades.
Strategy(s):1. Professional Development
for primary teachers focusing on inquiry based, hands-on science activities.
2. Implementation of science lab materials for increased hands-on activities.
FCAT 2.0 Students scoring at Achievement level 3 in Science: 47%(21) 51%(22)Florida Alternate Assessment: Students scoring at levels 4, 5, and 6 in Science
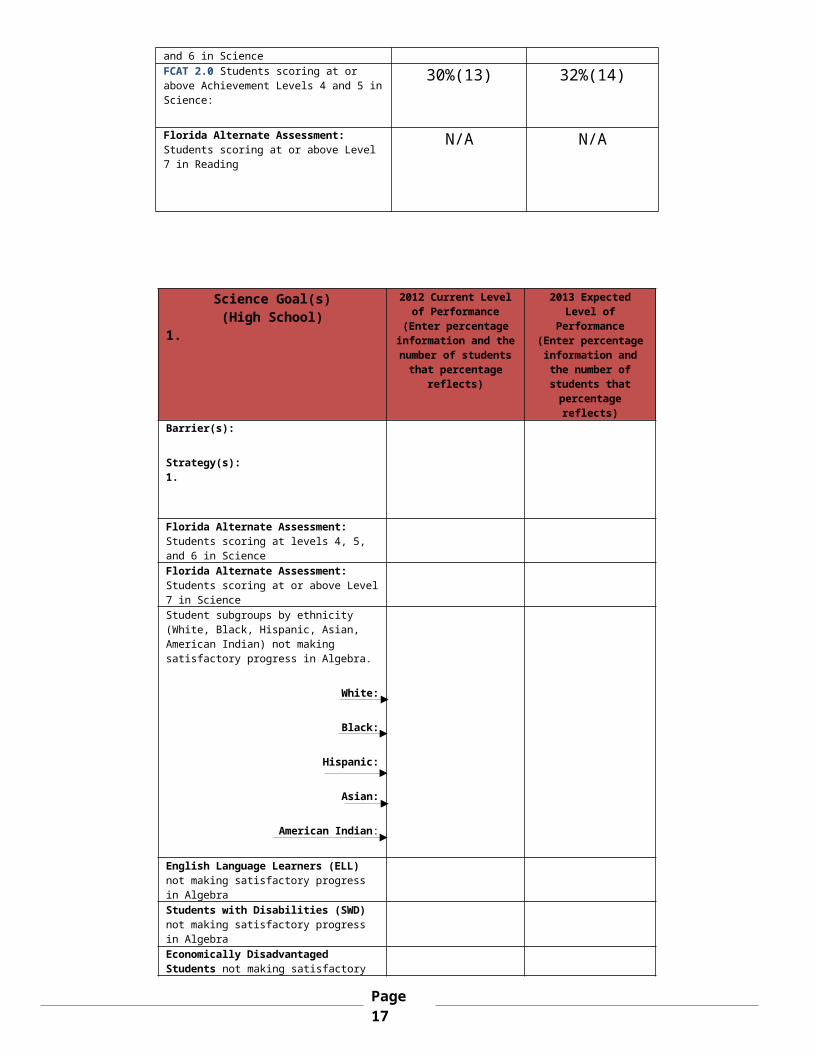
N/A N/AFCAT 2.0 Students scoring at or above Achievement Levels 4 and 5 in Science: 30%(13) 32%(14)Florida Alternate Assessment:Students scoring at or above Level 7 in Reading
N/A N/A
Science Goal(s)(High School)
1.
2012 Current Level of Performance
(Enter percentage information and the number of students
that percentage reflects)
2013 Expected Level of
Performance(Enter percentage information and the number of students that percentage
reflects)Barrier(s):
Strategy(s):1.
Page 13

Florida Alternate Assessment: Students scoring at levels 4, 5, and 6 in ScienceFlorida Alternate Assessment:Students scoring at or above Level 7 in ScienceStudent subgroups by ethnicity (White, Black, Hispanic, Asian, American Indian) not making satisfactory progress in Algebra.
White:
Black:
Hispanic:
Asian:
American Indian:
English Language Learners (ELL) not making satisfactory progress in AlgebraStudents with Disabilities (SWD) not making satisfactory progress in AlgebraEconomically Disadvantaged Students not making satisfactory progress in Algebra
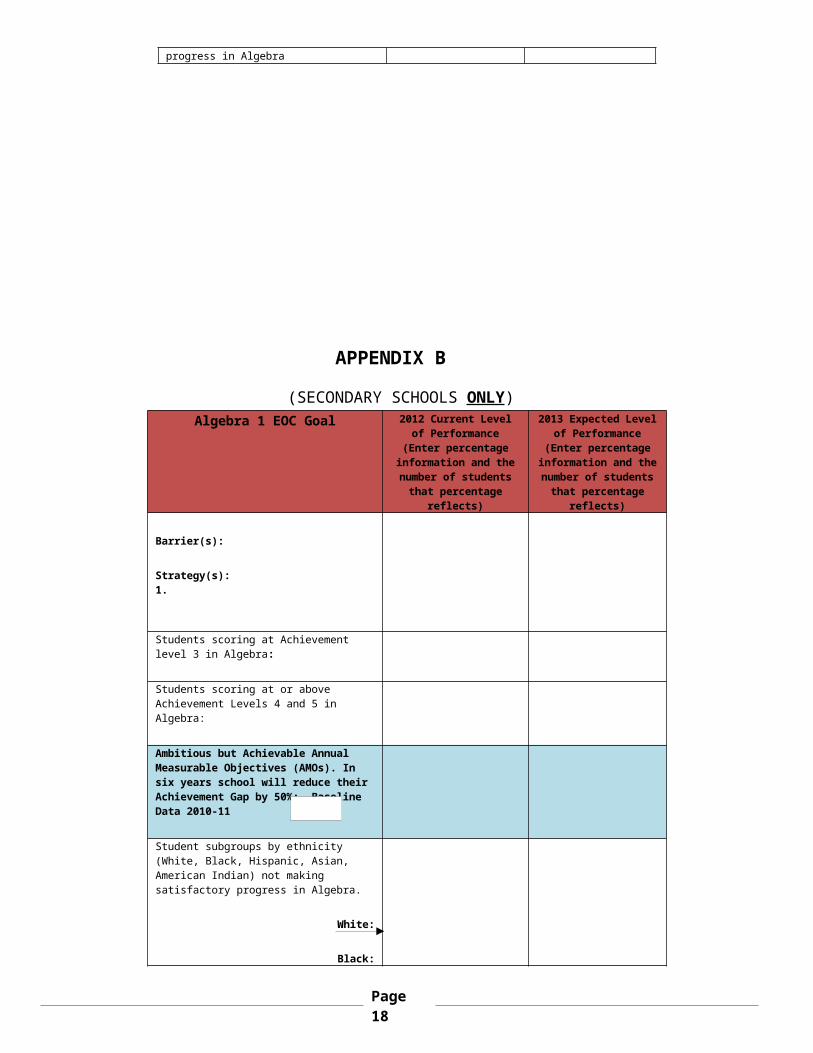
APPENDIX B
(SECONDARY SCHOOLS ONLY)Algebra 1 EOC Goal 2012 Current Level of
Performance(Enter percentage
information and the number of students
that percentage reflects)
2013 Expected Level of Performance
(Enter percentage information and the number of students
that percentage reflects)
Barrier(s):
Strategy(s):1.
Students scoring at Achievement level 3 in Algebra:
Page 14
Students scoring at or above Achievement Levels 4 and 5 in Algebra:
Ambitious but Achievable Annual Measurable Objectives (AMOs). In six years school will reduce their Achievement Gap by 50%: Baseline Data 2010-11
Student subgroups by ethnicity (White, Black, Hispanic, Asian, American Indian) not making satisfactory progress in Algebra.
White:
Black:
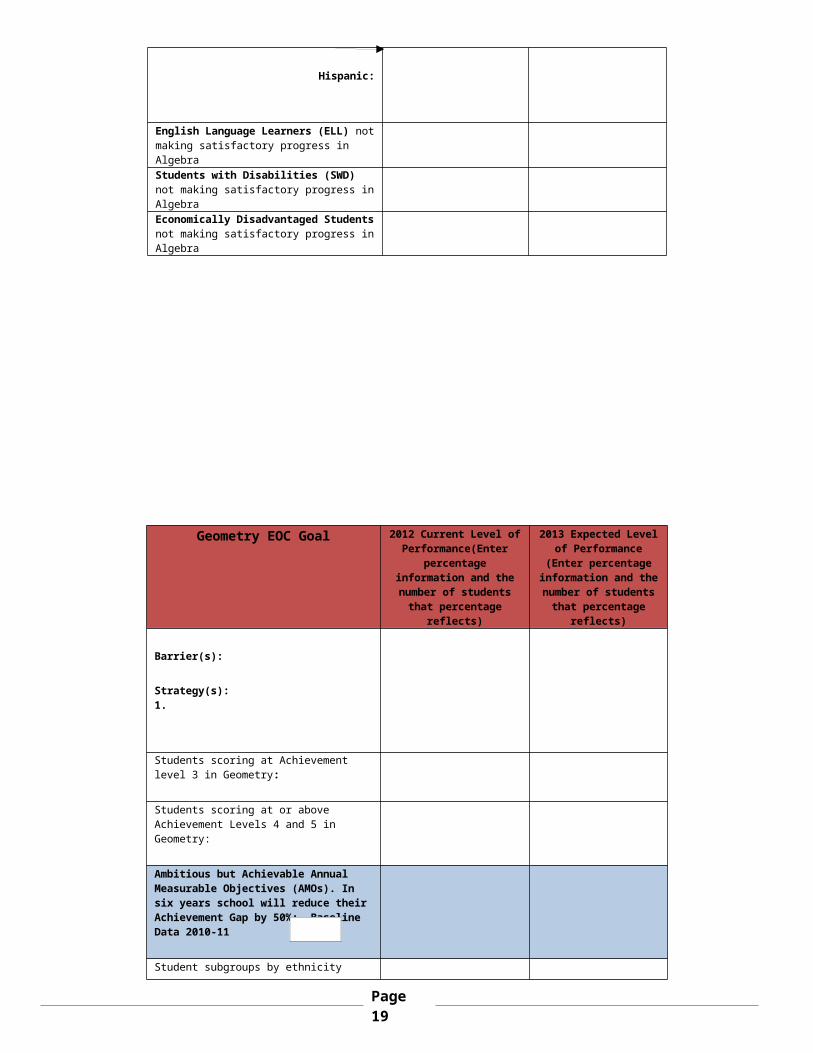
Hispanic:
English Language Learners (ELL) not making satisfactory progress in AlgebraStudents with Disabilities (SWD) not making satisfactory progress in AlgebraEconomically Disadvantaged Students not making satisfactory progress in Algebra
Geometry EOC Goal 2012 Current Level of Performance(Enter
percentage information and the number of students
that percentage reflects)
2013 Expected Level of Performance
(Enter percentage information and the number of students
that percentage reflects)
Barrier(s):
Strategy(s):1.
Students scoring at Achievement level 3 in Geometry:
Students scoring at or above Achievement Levels 4 and 5 in Geometry:
Ambitious but Achievable Annual Measurable Objectives (AMOs). In six years school will reduce their Achievement Gap by 50%: Baseline
Page 15

Data 2010-11
Student subgroups by ethnicity (White, Black, Hispanic, Asian, American Indian) not making satisfactory progress in Geometry.
White:
Black:
Hispanic:
English Language Learners (ELL) not making satisfactory progress in GeometryStudents with Disabilities (SWD) not making satisfactory progress in GeometryEconomically Disadvantaged Students not making satisfactory progress in Geometry
Biology EOC Goal
2012 Current Level of
Performance(Enter
percentage information
and the number of
students that percentage
reflects)
2013 Expected Level of
Performance(Enter
percentage information
and the number of
students that percentage
reflects)Students scoring at Achievement level 3 in Biology:Students scoring at or above Achievement Levels 4 and 5 in Biology:
Civics EOC 2012 Current Level of
Performance(Enter
percentage information
and the number of
students that percentage
reflects)
2013 Expected Level of
Performance(Enter
percentage information
and the number of
students that percentage
reflects)Students scoring at Achievement level 3 in Civics:Students scoring at or above Achievement Levels 4 and 5 in Civics:
U.S. History EOC
2012 Current Level of
Performance
2013 Expected Level of
Performance
Page 16
(Enter percentage information
and the number of
students that percentage
reflects)
(Enter percentage information
and the number of
students that percentage
reflects)Students scoring at Achievement level 3 in U. S. History:Students scoring at or above Achievement Levels 4 and 5 in U. S. History:
Science, Technology, Engineering, and
Mathematics (STEM) Goal(s)
Anticipated Barrier
Strategy Person/Process/Monitoring
Based on the analysis of school data, identify and define areas in need of improvement:
Goal 1:
Goal 2:
Career and Technical Education (CTE) Goal(s)
Anticipated Barrier
Strategy Person/Process/Monitoring
Based on the analysis of school data, identify and define areas in need of improvement:
Goal 1:
Goal 2:
Additional Goal(s) Anticipated Barrier
Strategy Person/Process/Monitoring
Based on the analysis of school data, identify and define areas in need of improvement:
Goal 1:
Goal 2:
Page 17
APPENDIX C
(TITLE 1 SCHOOLS ONLY)
Highly Effective Teachers Describe the school based strategies that will be used to recruit and retain high quality, highly effective teachers to the school.
Descriptions of Strategy Person Responsible Projected Completion Date
1. Mentoring for teachers new to the school or grade level.
Mentoring Teachers/Peer Coaches
Ongoing
2. Provide high quality professional development opportunities
Administration/Content Contacts
Ongoing
3. Collaborative Groups Administration/Team Facilitators
Ongoing
4. Peer Coaching Team observes and provides feedback for teachers.
Peer Coaching Team Ongoing
Non-Highly Effective Instructors Provide the number of instructional staff and paraprofessionals that are teaching out-of-field and/or who are not highly effective. *When using percentages, include the number of teachers the percentage represents (e.g., 70% [35]).
Number of staff and paraprofessionals that are teaching out-of-field/and who are not highly
effective
Provide the strategies that are being implemented to support the staff in becoming
highly effective3%(3) Teachers are following the ESOL timeline to
gain certification.
For the following areas, please write a brief narrative that includes the data for the year 2011-12 and a description of changes you intend to incorporate to improve the data for the year 2012-13.
MULTI-TIERED SYSTEM OF SUPPORTS (MTSS)/RtI (Identify the MTSS leadership team and it role in development and implementation of the SIP along with data sources, data management and how staff is trained in MTSS)
Our MTSS Leadership Team consists of our Administration, School Psychologist, Staffing Specialist, Guidance Counselor and ESE teachers. The additional member of our team is the classroom and/or resource teacher (Title I or ESE) involved in providing services and/or interventions to the student. Teachers and administration closely monitor student progress and create intervention groups by
Page 18
skill deficit. After monitoring progress and seeing minimal growth, the student is referred to the MTSS team for additional intervention strategies. The team will also include the student’s parent/guardian for input on the student’s progress. As a result of the MTSS team meeting, the new interventions are put into place and closely tracked and monitored. The MTSS team meets to discuss the progress of the interventions and makes instructional decisions based on the intervention data. If the data supports ESE placement, the MTSS team will convene to evaluate possible staffing into an ESE program. If the data supports continued interventions, the team will recommend that the successful interventions remain in place for the student’s success. PARENT INVOLVEMENT:To encourage parental involvement, we host several grade level evening events throughout the school year. In 2011-2012 we offered P.A.I.R. (Parents Actively Involved in Reading) nights four times a school year for Kindergarten and First Grade families. The turnout to the event was under twenty families, but those in attendance provided feedback stating that they learned effective strategies for use at home. For the 2012-2013 school year, we want to increase the opportunities for families at all grade levels. We will still host the P.A.I.R. events, but will also include events for other grade levels. In October, we will host our second and third grade families at our reading success nights. To increase involvement in our parental events, we offer childcare and snacks In November, we will host a Publix Math Night to support real world math exposure for our students and their families. ATTENDANCE: (Include current and expected attendance rates, excessive absences and tardies)Pinewood’s current attendance rate is 96% with an expected 2012-2013 attendance rate to remain at or above 96%. During the 2011-2012 school year we had 22 students with excessive absences and expect that number to drop for the 2012-2013 school year to 20 students. For the 2011-2012 school year we had 42 students with excessive tardies and expect a drop during the 2012-2013 school year to 38 students.
SUSPENSION:During the 2011-2012 school year we had 20 students serving out of school suspensions and expect that number to drop for the 2012-2013 school year to 18 students. For the 2011-2012 school year we had 15 students serving in-school suspensions and expect that number to drop during the 2012-2013 school year to 13 students. . For the 2011-2012 school year we had 8 students suspended for one day off of the bus and expect that number to drop during the 2012-2013 school year to 7 students.
DROP-OUT (High Schools only):
POSTSECONDARY READINESS: (How does the school incorporate students’ academic and career planning, as well as promote student course selections, so that students’ course of study is personally meaningful? Describe strategies for improving student readiness for the public postsecondary level based on annual analysis of the High School Feedback Report.)
Page 19