ACCIDENTS-THE TOTAL COST - Inside Minesinside.mines.edu/UserFiles/File/MSHP...Accidents - The Total...
34
Accidents - The Total Cost A Guide for Estimating The Total Cost of Accidents Mine Safety and Health Program Colorado School of Mines Golden, CO 80401
-
Upload
truongkhanh -
Category
Documents
-
view
230 -
download
2
Transcript of ACCIDENTS-THE TOTAL COST - Inside Minesinside.mines.edu/UserFiles/File/MSHP...Accidents - The Total...
Accidents - The Total Cost
A Guide for Estimating The Total Cost of Accidents
Mine Safety and Health Program
Colorado School of Mines
Golden, CO 80401
i
Accidents – The Total Cost
A Guide for Estimating the Total Cost of Accidents
By
Mine Safety and Health Program Technical Staff
Western Mining Safety and Health Training and Translation Center
Colorado School of Mines
Golden, CO 80401
July 24, 2011
Copyright © 2011 by Colorado School of Mines
All Rights Reserved, including the right of reproduction in whole or in part in any form
ii
Acknowledgements The MSHP Technical Staff and Contractors who developed and edited this document
include:
David Blumenstein, EM
Robert Ferriter, EM, PE, CMSP
Jerry Powers, MBA, CMSP
Michelle Reiher, MS, MBA
Other individuals who contributed to this document through reviews / comments
included: Hugh Miller, Ph.D., CMSP, Colorado School of Mines; Larry Grayson, Ph.D.,
CMSP, The Pennsylvania State University; and Linda Lake, Liberty Mutual Insurance
Company. Additionally, appreciation is extended to Christine Geier, CSM Undergraduate
Student, for her graphic art contributions.
Disclaimer
This material was produced under grant number 1 R25 OH008319-02 from the National
Institute for Occupational Safety and Health. It does not necessarily reflect the views
or policies of the U.S. Department of Health and Human Services, nor does mention of
trade names, commercial products, or organizations imply endorsement by the U.S.
Government.
iii
PREFACE
This publication is an aid for mining professionals engaged in the management of
workplace accident costs. It presents an approach to the assignment of full company-
controlled monetary costs to accidents, thus enabling these costs to be recognized and
better controlled. As an additional benefit, non-monetary costs such as human
suffering and environmental damage may also be controlled.
ABSTRACT
The purpose of this guide is to allow mining companies to estimate the total cost of
accidents using both visible and hidden costs. Visible costs are those costs that
management readily associates with an accident, while hidden costs are those costs
directly attributable to an accident that are not readily recognized. Even though the
magnitude of the hidden costs associated with a specific accident may be considerably
greater than that of the visible costs, these hidden costs are often difficult to calculate
due to the challenges associated with determining a dollar value for certain
consequences and the way accident costs are typically tracked in conventional
accounting practices. This guide provides techniques that are useful in identifying and
quantifying hidden costs. This guide will also be useful for internal applications, such as
for lobbying support for a stronger safety and health program, and may also be used in
conjunction with an appropriate financial analysis tool to measure the effectiveness of
safety and health programs.
iv
TABLE OF CONTENTS
ACCIDENT PREVENTION ........................................................................ 1
Leading Indicators ............................................................. 2
Trailing Indicators .............................................................. 3
WHAT IS AN ACCIDENT? ........................................................................ 5
Accident Costs ................................................................... 5
Accident Cost Resources .................................................... 6
ACCIDENT COST DETERMINATION PROCEDURE ................................... 11
Event Description ............................................................ 11
Accident Consequence Tree ............................................. 11
Cost Calculation ............................................................... 14
SAMPLE COST ESTIMATE REPORT ........................................................ 16
SUMMARY ........................................................................................... 21
REFERENCES ....................................................................................... 22
APPENDIX ........................................................................................... 24
Exercise 1 ....................................................................... 24
Exercise 2 ....................................................................... 27
1
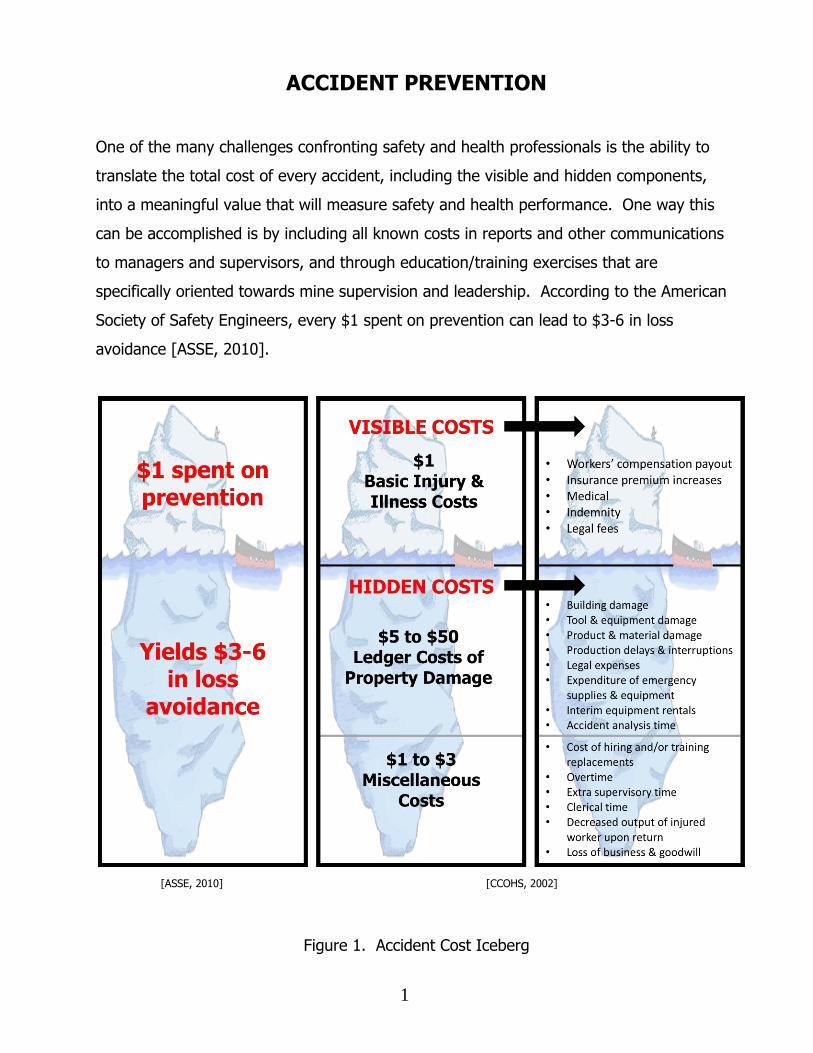
ACCIDENT PREVENTION
One of the many challenges confronting safety and health professionals is the ability to
translate the total cost of every accident, including the visible and hidden components,
into a meaningful value that will measure safety and health performance. One way this
can be accomplished is by including all known costs in reports and other communications
to managers and supervisors, and through education/training exercises that are
specifically oriented towards mine supervision and leadership. According to the American
Society of Safety Engineers, every $1 spent on prevention can lead to $3-6 in loss
avoidance [ASSE, 2010].
Figure 1. Accident Cost Iceberg
[ASSE, 2010] [CCOHS, 2002]
2
Because accident expenses are often trailing (reactive) indicators of safety and health
performance, it is difficult to effectively manage these costs. If the total cost of an
accident were quickly made known to those in charge, it would be easier to gain support
to fund accident prevention efforts which would minimize the effects of accidents that do
occur. These prevention expenses and efforts are considered leading (proactive)
indicators of safety and health performance. Both leading and trailing indicators should be
used in measuring safety and health performance so that a return on safety and health
investments can be accurately estimated.
Leading Indicators
Accident prevention costs are fixed costs of safety and health programs and activities that
are in place to prevent and mitigate the effects of accidents. Investment in accident
prevention is a basic expense most companies believe is a necessary part of business.
How much to spend beyond merely complying with applicable regulations, however, can
be a reflection of the company’s commitment to providing a safe and healthy workplace
for its employees. Although there is a diminishing return on investment in the following
accident prevention areas, each has the benefit of avoiding or lessening the loss due to
accidents.
Accident Response Programs
Resources spent training and pre-planning for accidents. This includes mine rescue
training, purchase of equipment, and emergency response planning.
On –Site Medical Services
Expenses used for maintaining medical care facilities and personnel on the
property.
3
Inspections and Audits
Resources invested to conduct safety and health inspections and audits, as well as
time spent evaluating and implementing safer processes, procedures, and work
practices.
Self-Insured Fund
Cash reserves set aside for accident expenses not covered by insurance.
Basic Insurance Premiums
Premiums for workers’ compensation, liability (casualty and fire), equipment
breakdown, and other required insurance. These would be the minimum premiums
charged based on a good loss record.
Safe Design
The cost of safety and health items not required for production but necessary for
accident prevention. These items may include rescue chambers, dilution
ventilation, operator isolation, road berms, multiple entries, seatbelts, and other
site-specific accommodations.
Other costs that may be associated with accident prevention include:
Safety personnel and staff, including their continued training and professional
development,
Personal protective equipment programs,
Regulatory compliance activities, and
Legal counsel (advice).
Trailing Indicators
Since accident costs are trailing indicators of safety and health performance, should an
accident occur, it is important to make sure that accurate and complete data is used to
4
determine the total cost of the accident. This information can help decision makers
establish the appropriate amount of expenditure the company is willing to pay for accident
prevention. It is also important to ensure that accident related cost items are not “double
counted” by appearing in more than one accounting category. To assist with the
identification of these cost items, it is helpful to first understand the financial accounting
system of the company. For example, the following universal classes of accident costs are
suggested [Aaltonen, 1996]:
Lost work hours,
Lost assets (both current and fixed),
Short-term payments (equipment rental and contractor support),
Lost revenue and production, and
Other (including delayed payments such as long-term payments, delayed health
payments, insurance premium adjustments and some legal fees).
5
WHAT IS AN ACCIDENT?
An accident is any unexpected or unplanned event that causes a loss of production, harm
to people, damage to property or extended costs [Grayson, 2001]. Many companies also
include harm to the environment where resources are required as a loss. Have you ever
wondered how much an accident actually costs a company? Unfortunately, there is no
easy way to find out, but like any other expense, the cost of a workplace accident affects
a company’s bottom line. Whether we like it or not, accidents are more expensive than
many of us realize due to hidden costs. Visible costs such as medical expenses, costs to
replace equipment, fines and penalties are easy to find and calculate, but it is not easy to
find information necessary to calculate the hidden costs not directly associated with the
accident, such as the cost to train and compensate a new employee, investigate the
accident or implement corrective action. Due to the nature of hidden costs, many of them
may not be obvious to those responsible for deciding how much to spend for accident
prevention. Regardless, there must be a connection between an accident and all of the
costs that result from it. If the total cost is more closely known, a company can make
more informed decisions of how much to spend to minimize future accident costs. As a
resource to safety and health professionals, this publication will present a basic procedure
that attempts to identify all of the costs associated with an accident.
Accident Costs
Throughout this publication, the terms hidden and visible will be used to describe accident
costs. Categorizing accident costs into visible and hidden is a way of determining which
costs are currently recognized as accident-related by corporate management and which
costs must be determined and reported in order to provide the total cost of an accident.
Other terms have also been used to describe the same type of accident costs. For
instance, costs may also be referred to as financial and lost opportunity costs, or direct
and indirect costs.
6
Financial and Lost Opportunity. Financial costs are costs a company must pay as a
result of an accident and may include overtime payments, repair costs, cost of
extra materials, fines, and penalties. Lost opportunity costs include those costs
associated with labor paid for no production, such as salary costs of employees
waiting to work, employees at home unable to work while injured, and costs for
machinery running idle [Health and Safety Executive, 2007]. Lost opportunity costs
also include production and resource losses due to interruptions in the production
cycle, the inability to mine previously identified mineral resources and reserves, and
the delay of converting mined material into revenue through sales or other types of
financial transactions.
Direct and Indirect Costs. A direct cost is a cost that can be easily and
conveniently traced to the accident such as medical expenses and indemnity
payments while an indirect cost is a cost that cannot be easily and conveniently
traced to the particular accident such as the salary of the person investigating the
accident. The terms direct and indirect have generally been abandoned in favor of
other more objective terms [Hagan, 2001].
Whether a cost is visible or hidden is not as important as accounting for all of the costs
associated with the accident. Figure 1 illustrates examples of both visible and hidden
costs.
Accident Cost Resources
There are two main resources that are used to determine accident costs: accounting
systems and insurance coverage. Unfortunately, these two resources complicate the
process for determining accident related costs as they cause many costs to be hidden,
thus requiring the use of other resources to establish the total cost of an accident.
Insurance coverage has caused many of the accident costs to be hidden because most
insurance coverage places an emphasis solely on insurance-based consequences such as
bodily harm and property damage which leaves many accident costs unmanaged. On the
7
other hand, using an activity-based consequence approach will include management of the
visible as well as the hidden costs because this approach looks at the broader cause and
effect relationship of an accident.
Accounting systems have also caused many accident costs to be hidden as a company’s
accounting procedures often determine whether a cost is directly attributed to the accident
or placed in another category. Therefore, assignment to one category or another is not
always the same among different companies [Dorman, 2000]. In addition, the
amortization and disbursement of these costs between different categories will often
disguise the magnitude and true value of these costs items. In general, hidden costs are
reported by accounting systems, but they are typically in some category other than
“accident.”
While it is impractical to assume that a safety and health professional can influence or
facilitate a major change in a company’s accounting practices or insurance coverage, it
may be possible to establish general administrative procedures that would allow safety
and health personnel to track the visible cost components over time, as well as provide a
means of estimating the likely influence of hidden costs.
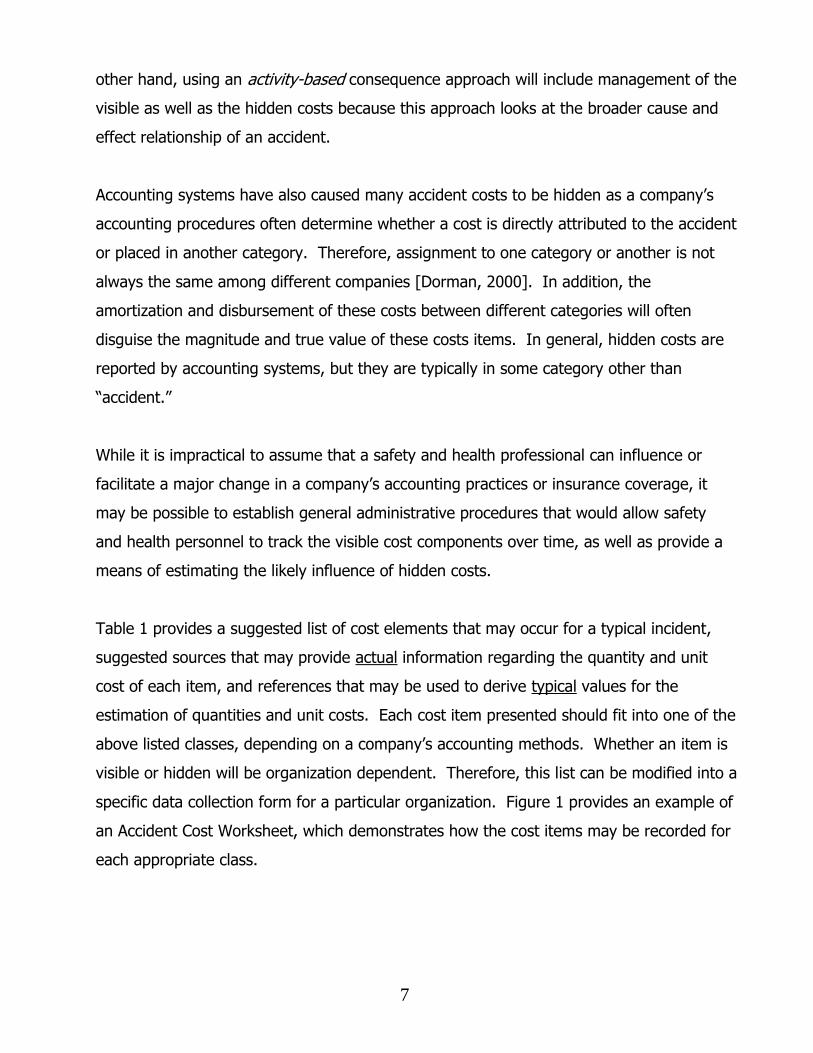
Table 1 provides a suggested list of cost elements that may occur for a typical incident,
suggested sources that may provide actual information regarding the quantity and unit
cost of each item, and references that may be used to derive typical values for the
estimation of quantities and unit costs. Each cost item presented should fit into one of the
above listed classes, depending on a company’s accounting methods. Whether an item is
visible or hidden will be organization dependent. Therefore, this list can be modified into a
specific data collection form for a particular organization. Figure 1 provides an example of
an Accident Cost Worksheet, which demonstrates how the cost items may be recorded for
each appropriate class.
8
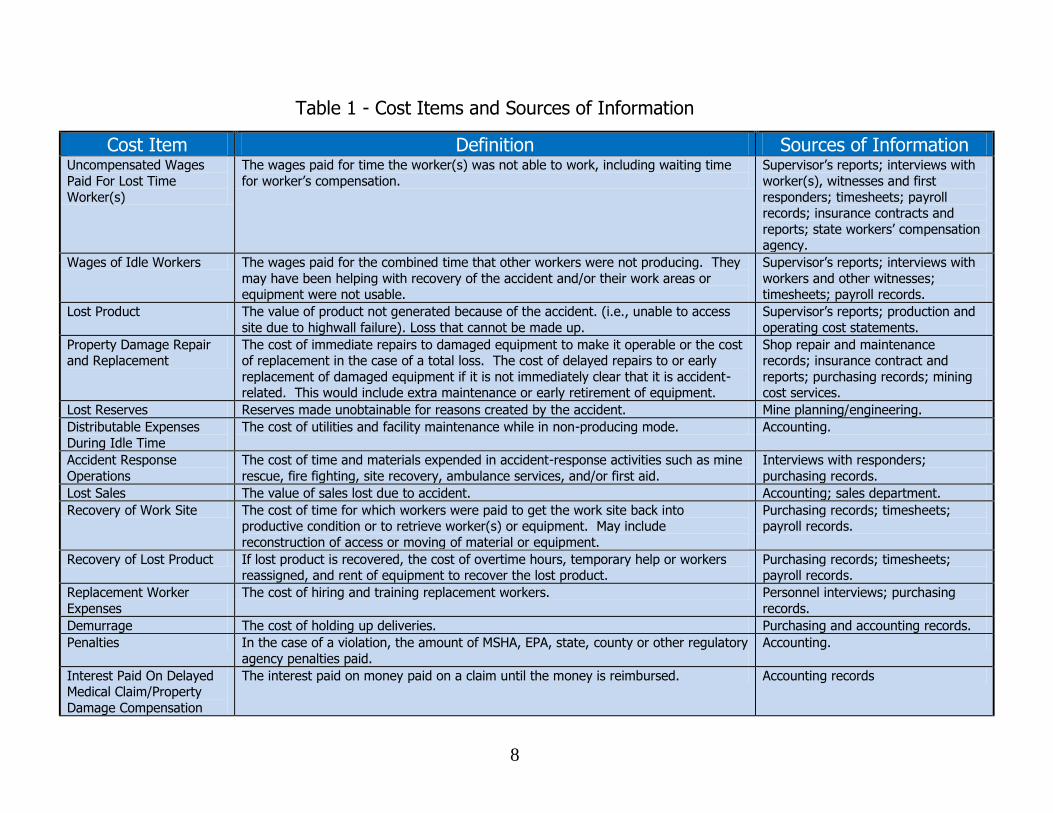
Table 1 - Cost Items and Sources of Information
Cost Item Definition Sources of Information
Uncompensated Wages
Paid For Lost Time
Worker(s)
The wages paid for time the worker(s) was not able to work, including waiting time
for worker’s compensation.
Supervisor’s reports; interviews with
worker(s), witnesses and first
responders; timesheets; payroll records; insurance contracts and
reports; state workers’ compensation agency.
Wages of Idle Workers The wages paid for the combined time that other workers were not producing. They
may have been helping with recovery of the accident and/or their work areas or equipment were not usable.
Supervisor’s reports; interviews with
workers and other witnesses; timesheets; payroll records.
Lost Product The value of product not generated because of the accident. (i.e., unable to access
site due to highwall failure). Loss that cannot be made up.
Supervisor’s reports; production and
operating cost statements.
Property Damage Repair and Replacement
The cost of immediate repairs to damaged equipment to make it operable or the cost of replacement in the case of a total loss. The cost of delayed repairs to or early
replacement of damaged equipment if it is not immediately clear that it is accident-related. This would include extra maintenance or early retirement of equipment.
Shop repair and maintenance records; insurance contract and
reports; purchasing records; mining cost services.
Lost Reserves Reserves made unobtainable for reasons created by the accident. Mine planning/engineering.
Distributable Expenses
During Idle Time
The cost of utilities and facility maintenance while in non-producing mode. Accounting.
Accident Response
Operations
The cost of time and materials expended in accident-response activities such as mine
rescue, fire fighting, site recovery, ambulance services, and/or first aid.
Interviews with responders;
purchasing records.
Lost Sales The value of sales lost due to accident. Accounting; sales department.
Recovery of Work Site The cost of time for which workers were paid to get the work site back into productive condition or to retrieve worker(s) or equipment. May include
reconstruction of access or moving of material or equipment.
Purchasing records; timesheets; payroll records.
Recovery of Lost Product If lost product is recovered, the cost of overtime hours, temporary help or workers reassigned, and rent of equipment to recover the lost product.
Purchasing records; timesheets; payroll records.
Replacement Worker
Expenses
The cost of hiring and training replacement workers. Personnel interviews; purchasing
records.
Demurrage The cost of holding up deliveries. Purchasing and accounting records.
Penalties In the case of a violation, the amount of MSHA, EPA, state, county or other regulatory
agency penalties paid.
Accounting.
Interest Paid On Delayed Medical Claim/Property
Damage Compensation
The interest paid on money paid on a claim until the money is reimbursed. Accounting records
9
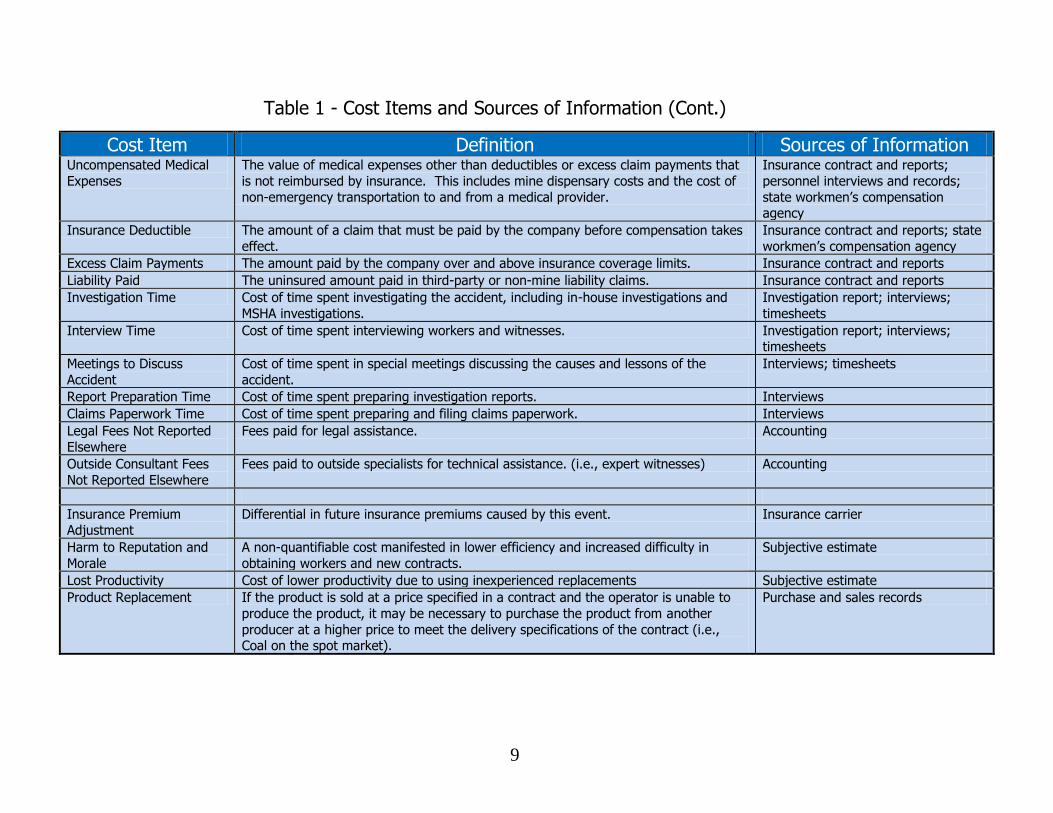
Table 1 - Cost Items and Sources of Information (Cont.)
Cost Item Definition Sources of Information
Uncompensated Medical
Expenses
The value of medical expenses other than deductibles or excess claim payments that
is not reimbursed by insurance. This includes mine dispensary costs and the cost of
non-emergency transportation to and from a medical provider.
Insurance contract and reports;
personnel interviews and records;
state workmen’s compensation agency
Insurance Deductible The amount of a claim that must be paid by the company before compensation takes
effect.
Insurance contract and reports; state
workmen’s compensation agency
Excess Claim Payments The amount paid by the company over and above insurance coverage limits. Insurance contract and reports
Liability Paid The uninsured amount paid in third-party or non-mine liability claims. Insurance contract and reports
Investigation Time Cost of time spent investigating the accident, including in-house investigations and
MSHA investigations.
Investigation report; interviews;
timesheets
Interview Time Cost of time spent interviewing workers and witnesses. Investigation report; interviews; timesheets
Meetings to Discuss
Accident
Cost of time spent in special meetings discussing the causes and lessons of the
accident.
Interviews; timesheets
Report Preparation Time Cost of time spent preparing investigation reports. Interviews
Claims Paperwork Time Cost of time spent preparing and filing claims paperwork. Interviews
Legal Fees Not Reported
Elsewhere
Fees paid for legal assistance. Accounting
Outside Consultant Fees
Not Reported Elsewhere
Fees paid to outside specialists for technical assistance. (i.e., expert witnesses) Accounting
Insurance Premium Adjustment
Differential in future insurance premiums caused by this event. Insurance carrier
Harm to Reputation and
Morale
A non-quantifiable cost manifested in lower efficiency and increased difficulty in
obtaining workers and new contracts.
Subjective estimate
Lost Productivity Cost of lower productivity due to using inexperienced replacements Subjective estimate
Product Replacement If the product is sold at a price specified in a contract and the operator is unable to
produce the product, it may be necessary to purchase the product from another
producer at a higher price to meet the delivery specifications of the contract (i.e., Coal on the spot market).
Purchase and sales records
10
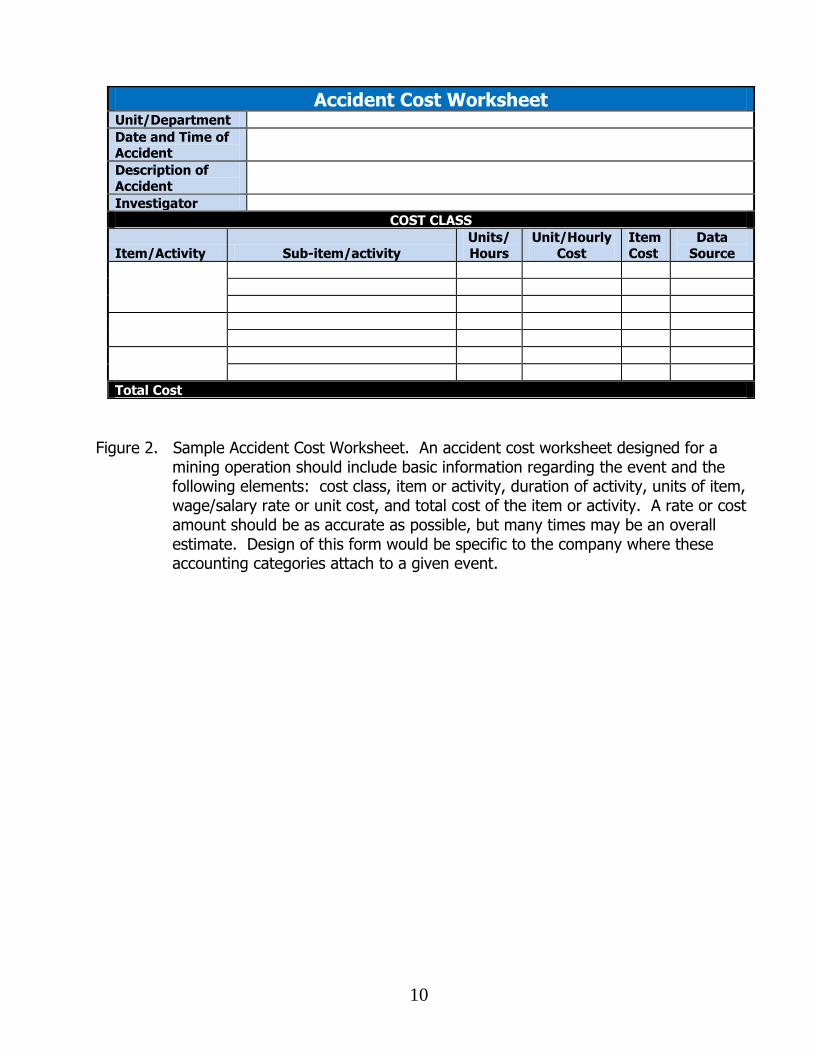
Figure 2. Sample Accident Cost Worksheet. An accident cost worksheet designed for a mining operation should include basic information regarding the event and the following elements: cost class, item or activity, duration of activity, units of item, wage/salary rate or unit cost, and total cost of the item or activity. A rate or cost amount should be as accurate as possible, but many times may be an overall estimate. Design of this form would be specific to the company where these accounting categories attach to a given event.
Accident Cost Worksheet Unit/Department
Date and Time of Accident
Description of
Accident
Investigator
COST CLASS
Item/Activity Sub-item/activity
Units/
Hours
Unit/Hourly
Cost
Item
Cost
Data
Source
Total Cost
11
ACCIDENT COST DETERMINATION PROCEDURE
A total cost estimate of one or more accidents may demonstrate whether current accident
prevention expenditures are achieving a satisfactory level of safety and health performance.
Because determining actual accident expenses may be a time-consuming task, a systematic
approach to gathering the necessary data is of great benefit. The systematic approach
presented below will strive to identify and assign a cost to all activity based consequences of
the accident through three steps: 1) Event description, 2) Accident consequence tree and 3)
Cost calculation.
Event Description
First, the event must be defined by start time, end time, location, and all information relevant
to the consequences of the event. The start time is when the normal process is interrupted
and the end time is when the normal process resumes. Once the event is defined, then the
consequences and their component activities may be assigned to the event.
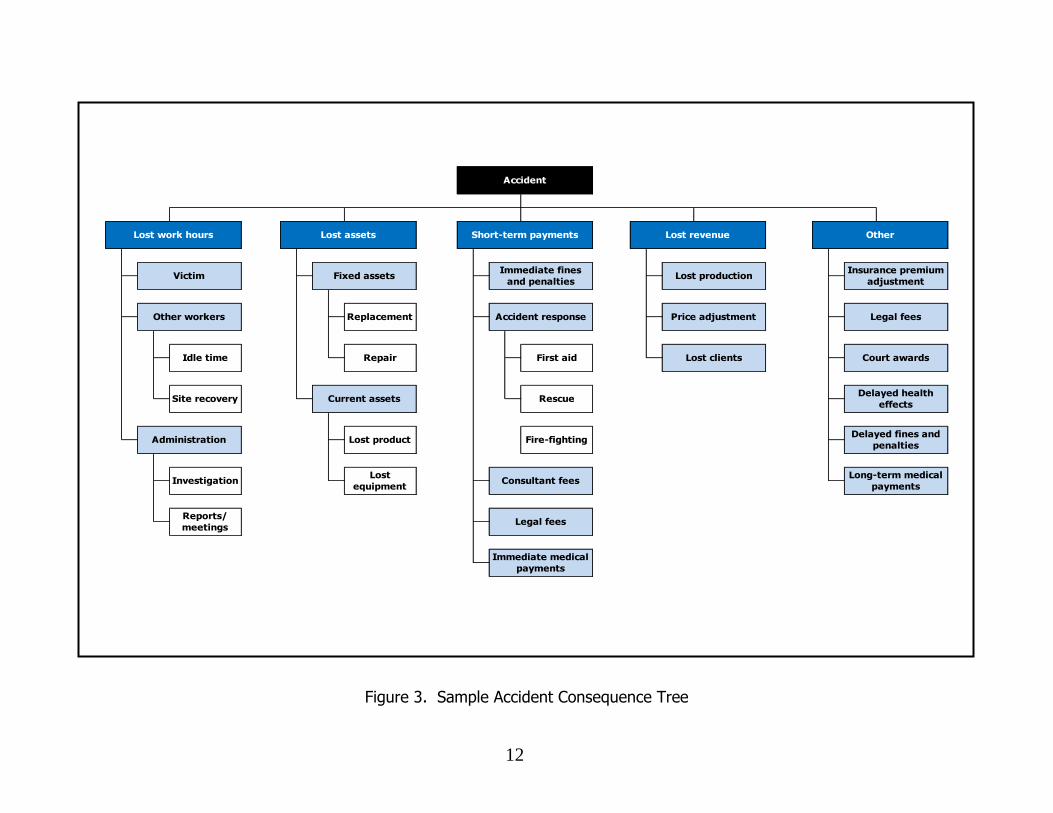
Accident Consequence Tree
Similar to the way a fault tree is used to analyze the causes of an accident by reasoning
backward from the event, an accident consequence tree can be constructed to analyze the
consequences of an accident by reasoning forward from the event [Rikhardsson, 2006].
Consequence tree construction is a logic process that produces a diagram displaying all
possible consequences of a particular undesired event. The process begins with the undesired
event at the top of the tree. Reasoning forward from the undesired event, the events that
could directly result from the undesired event are shown immediately below. Each primary
consequence is analyzed to determine its consequences. The logic process continues for each
consequence identified. An example of an Accident Consequence Tree is shown in Figure 3.
An actual tree may have a complete set of primary, secondary, and subsequent consequences.
12
Lost assets
Repair
Current assets
Lost product
Lost
equipment
Reports/
meetings
Other workers
Victim
Administration
Lost work hours
Idle time
Site recovery
Investigation
Fixed assets
Replacement
Immediate fines
and penalties
Accident response
Lost production
Price adjustment
Immediate medical
payments
Short-term payments Lost revenue Other
Accident
First aid
Rescue
Fire-fighting
Consultant fees
Legal fees
Long-term medical
payments
Lost clients
Insurance premium
adjustment
Legal fees
Court awards
Delayed health
effects
Delayed fines and
penalties
Figure 3. Sample Accident Consequence Tree
13
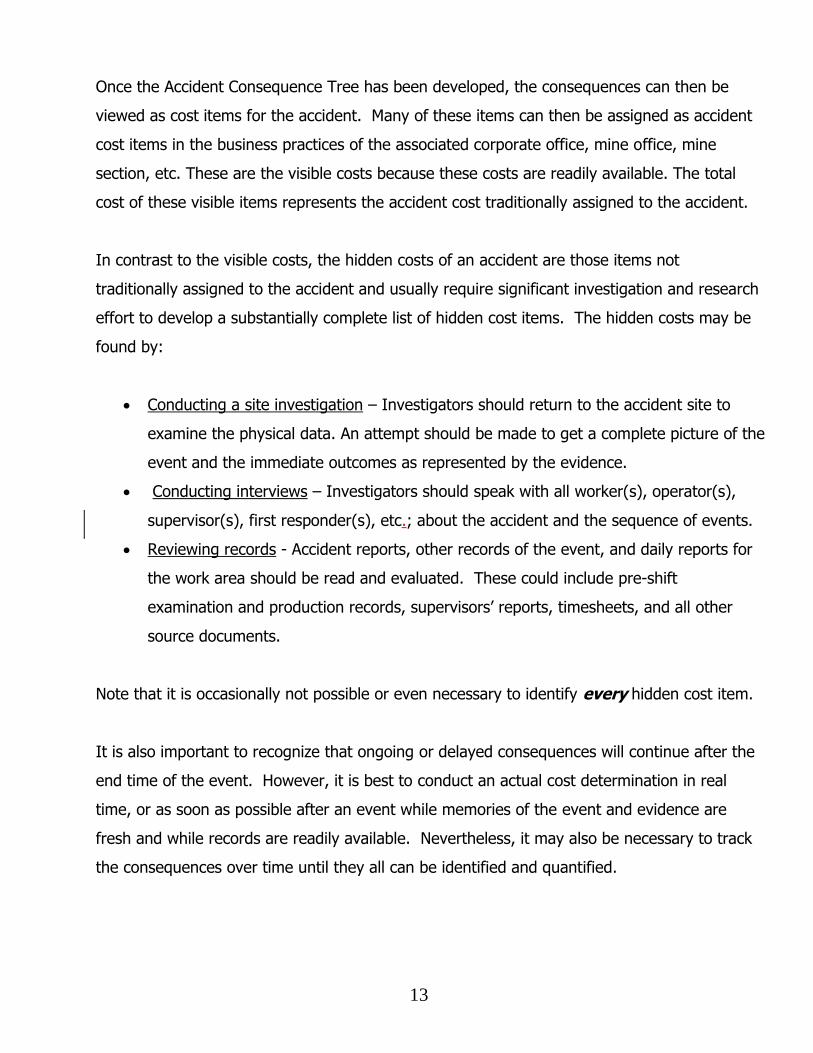
Once the Accident Consequence Tree has been developed, the consequences can then be
viewed as cost items for the accident. Many of these items can then be assigned as accident
cost items in the business practices of the associated corporate office, mine office, mine
section, etc. These are the visible costs because these costs are readily available. The total
cost of these visible items represents the accident cost traditionally assigned to the accident.
In contrast to the visible costs, the hidden costs of an accident are those items not
traditionally assigned to the accident and usually require significant investigation and research
effort to develop a substantially complete list of hidden cost items. The hidden costs may be
found by:
Conducting a site investigation – Investigators should return to the accident site to
examine the physical data. An attempt should be made to get a complete picture of the
event and the immediate outcomes as represented by the evidence.
Conducting interviews – Investigators should speak with all worker(s), operator(s),
supervisor(s), first responder(s), etc.; about the accident and the sequence of events.
Reviewing records - Accident reports, other records of the event, and daily reports for
the work area should be read and evaluated. These could include pre-shift
examination and production records, supervisors’ reports, timesheets, and all other
source documents.
Note that it is occasionally not possible or even necessary to identify every hidden cost item.
It is also important to recognize that ongoing or delayed consequences will continue after the
end time of the event. However, it is best to conduct an actual cost determination in real
time, or as soon as possible after an event while memories of the event and evidence are
fresh and while records are readily available. Nevertheless, it may also be necessary to track
the consequences over time until they all can be identified and quantified.
14
Cost Calculation
Once the cost items are identified and listed, the value of each listed cost item is determined.
It will be necessary to go to daily reports and source documents to determine the actual cost
of each item. Source documents can include:
Cash receipts,
Credit card receipts,
Cash register tapes,
Cancelled checks,
Supplier invoices,
Purchase orders,
Time cards,
Deposit slips,
Notes for loans, and
Payment stubs for interest.
When the actual cost of a cost item cannot be determined because records are not available,
the cost can be estimated using typical values, estimated values or personal experience. If
necessary, labor, equipment, and other production costs can be estimated using data provided
by a cost provider such as CoalMine, a division of InfoMine [Mining Cost Service, 2008],
available by subscription or using published information found in some libraries. Cost items
associated with non-production efforts such as witness time and equipment rental must also
be assigned a dollar value. The complete list of data collected should then be tabulated to
calculate the total cost of the accident. However, it is important to realize that the total cost
calculated will typically underestimate the actual cost due to the difficulty in identifying every
cost item.
15
There are several useful websites that provide programs to estimate accident and injury costs
as follows:
WorkSafeBC - Safety Calculator at www.worksafebc.com,
Health and Safety Executive - The Incident Cost Calculator at www.hse.gov.uk,
Mine Safety and Health Administration - Injury and Fatality Cost Calculation Worksheet
at www.msha.gov, and
Occupational Safety and Health Administration - Safety and Health Management
Systems eTools and Small Business Safety Pays Program at www.osha.gov.
Each of these sites offers a simple computer-based interactive program and other resources
for the estimation of incident costs. These programs allow for detailed costs and cost
estimates to be entered under one of several suggested cost categories and the costs are
then added together to yield a total cost. The forms used during this process can also be
printed for use in manual calculation.
Because conducting thorough accident investigations can be time consuming, it is likely that
this exercise cannot be completed for every accident that occurs. Therefore, it is
recommended that a trial cost determination be conducted to reveal the nature and possible
shortcomings in the company’s investigation and record keeping procedures. This trial may
reveal that current investigation forms need to be modified or new ones need to be developed
in order to capture the data required to obtain the total cost of an accident. Additionally, trial
cost determinations should be done for different types of accidents as there may be
differences in the data required for each type of accident.
16
SAMPLE COST ESTIMATE REPORT
For the following scenario the Sample Accident Consequence Tree (Figure 2) is used to find
the consequences of the accident. For each consequence, the cost components are identified
and recorded in an Accident Cost Worksheet. The source documents used to determine the
cost of each cost component are also recorded. The following events leading up to this
accident are described, as they are relevant to having a complete understanding of the scope
of the consequences.
After the bench height was increased from 50 feet to 75 feet, highwall sloughing had become
a continual maintenance issue. For a few days prior to the accident, truck drivers had been
complaining of loose material falling from the highwall.
On January 4, the supervisor inspected the highwall from the pit floor in the fading light of
dusk. The swing shift supervisor inspected the highwall with a spotlight from the pit floor. On
January 5, at 1:45 AM, the highwall failed, burying the shovel and killing the 35-year-old
shovel operator.
The collapse also partly buried a 777B CAT haul truck, injuring the driver. He had a broken
leg, two broken ribs, cuts, abrasions, contusions, and a head injury. Six weeks following the
accident, he still has trouble concentrating. The shovel was damaged beyond repair. The
truck driver was extricated and transported to the hospital where he was treated for injuries.
The highwall was stabilized to the point where the body of the victim could be rescued at
11:30 AM. The MSHA order was terminated at 11:45 AM on January 5. Recovery of the work
site was then initiated. Efforts to reclaim the work site continued for 17 days while production
was reduced to less than normal capacity.
17
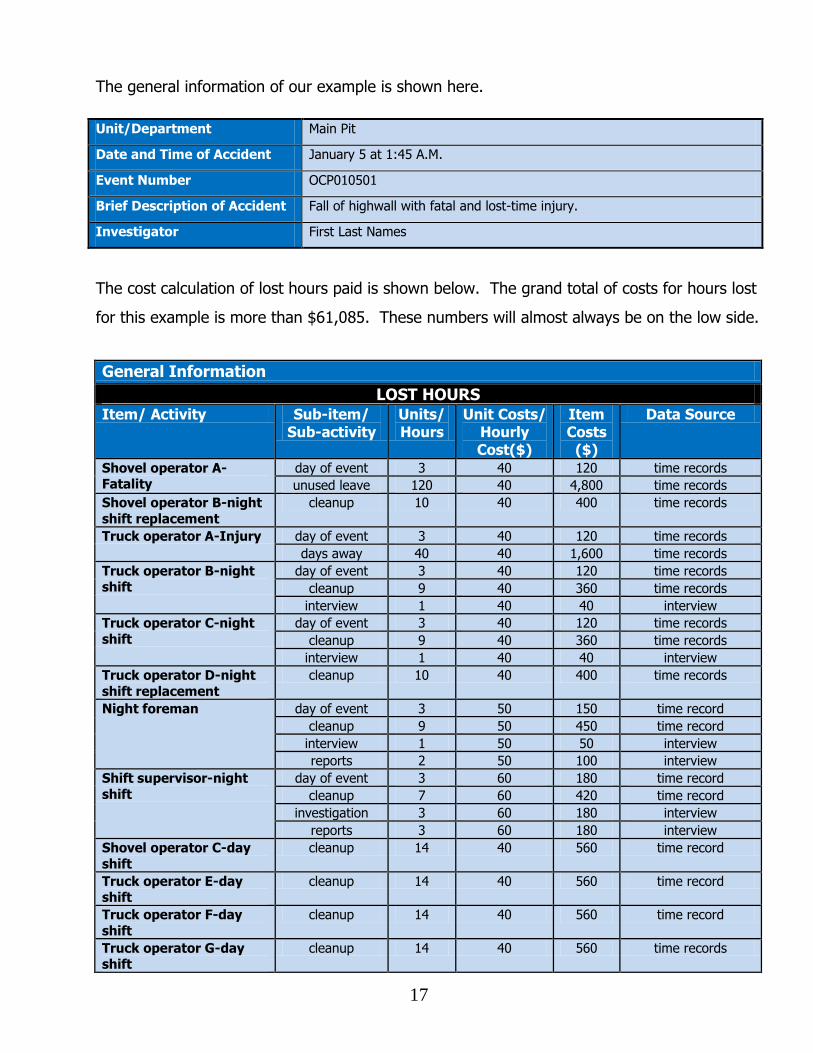
The general information of our example is shown here. Unit/Department Main Pit
Date and Time of Accident January 5 at 1:45 A.M.
Event Number OCP010501
Brief Description of Accident Fall of highwall with fatal and lost-time injury.
Investigator First Last Names
The cost calculation of lost hours paid is shown below. The grand total of costs for hours lost
for this example is more than $61,085. These numbers will almost always be on the low side.
General Information
LOST HOURS Item/ Activity Sub-item/
Sub-activity Units/ Hours
Unit Costs/ Hourly Cost($)
Item Costs
($)
Data Source
Shovel operator A-Fatality
day of event 3 40 120 time records
unused leave 120 40 4,800 time records
Shovel operator B-night
shift replacement
cleanup 10 40 400 time records
Truck operator A-Injury day of event 3 40 120 time records
days away 40 40 1,600 time records
Truck operator B-night shift
day of event 3 40 120 time records
cleanup 9 40 360 time records
interview 1 40 40 interview
Truck operator C-night
shift
day of event 3 40 120 time records
cleanup 9 40 360 time records
interview 1 40 40 interview
Truck operator D-night
shift replacement
cleanup 10 40 400 time records
Night foreman day of event 3 50 150 time record
cleanup 9 50 450 time record
interview 1 50 50 interview
reports 2 50 100 interview
Shift supervisor-night
shift
day of event 3 60 180 time record
cleanup 7 60 420 time record
investigation 3 60 180 interview
reports 3 60 180 interview
Shovel operator C-day
shift
cleanup 14 40 560 time record
Truck operator E-day shift
cleanup 14 40 560 time record
Truck operator F-day
shift
cleanup 14 40 560 time record
Truck operator G-day shift
cleanup 14 40 560 time records
18
Item/ Activity Sub-item/ Sub-activity
Units/ Hours
Unit Costs/ Hourly Cost($)
Item Costs
($)
Data Source
Day foreman-day shift cleanup 14 50 700 time records
Shift supervisor-day shift
cleanup 14 60 840 time records
Vice President event 15 100 1,500 interview
Administration paperwork 4 40 160 interview
All pit personnel extra meetings 100 40 4,000 interview
Overtime ? ? ? time records
Repair of equipment repair time ? ? ? shop records
Move truck 175 interview
Demolish and move shovel
11,300 time records
Overtime ? ? ? time records
Repair of equipment repair time ? ? 30,000 shop records
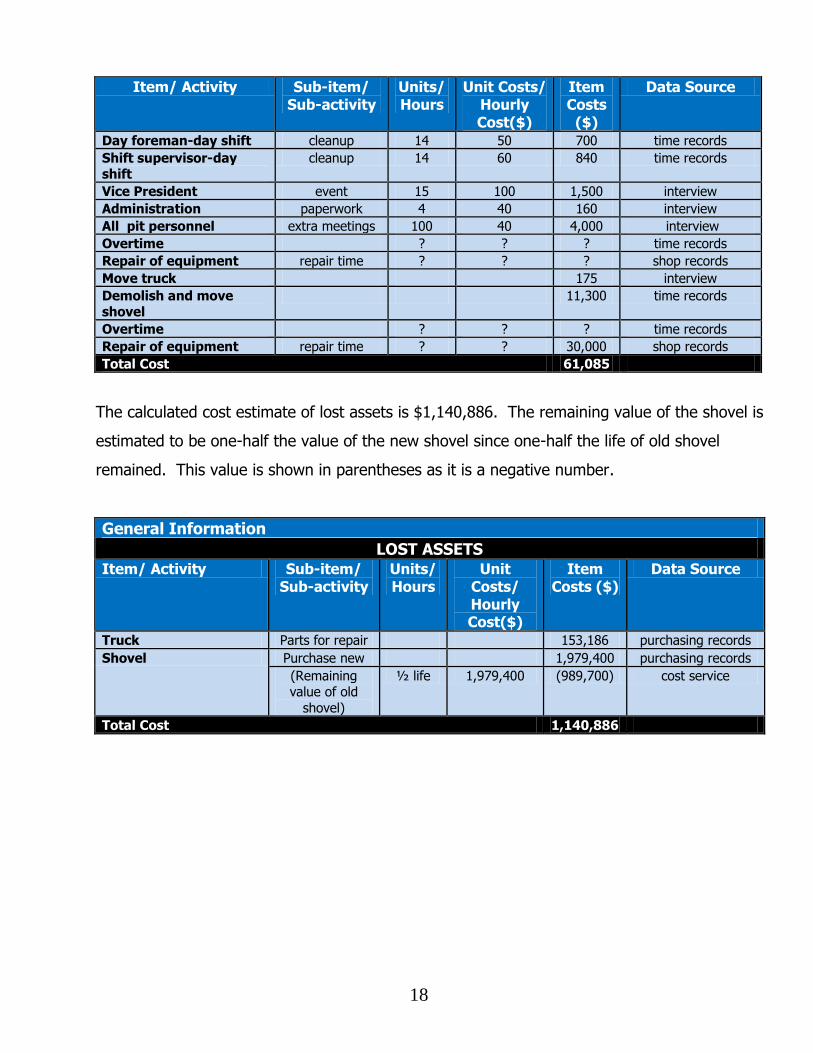
Total Cost 61,085
The calculated cost estimate of lost assets is $1,140,886. The remaining value of the shovel is
estimated to be one-half the value of the new shovel since one-half the life of old shovel
remained. This value is shown in parentheses as it is a negative number.
General Information
LOST ASSETS Item/ Activity Sub-item/
Sub-activity Units/ Hours
Unit Costs/ Hourly Cost($)
Item Costs ($)
Data Source
Truck Parts for repair 153,186 purchasing records
Shovel Purchase new 1,979,400 purchasing records
(Remaining value of old
shovel)
½ life 1,979,400 (989,700) cost service
Total Cost 1,140,886
19
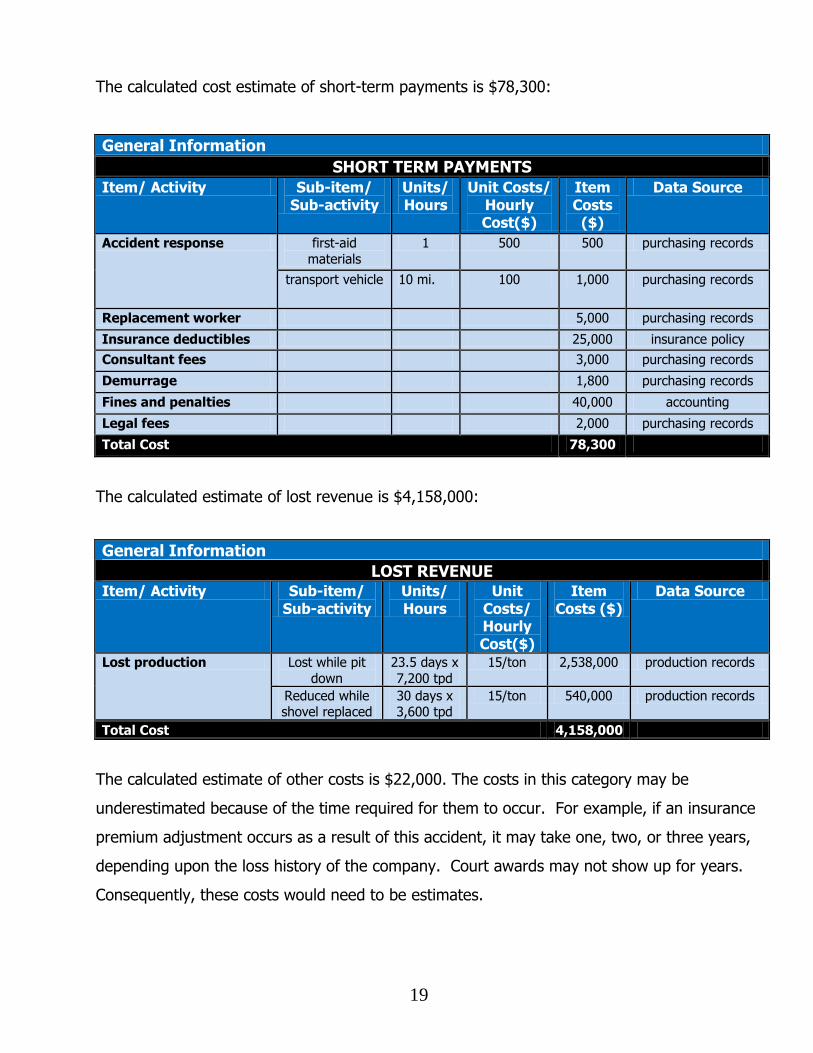
The calculated cost estimate of short-term payments is $78,300:
General Information
SHORT TERM PAYMENTS
Item/ Activity Sub-item/ Sub-activity
Units/ Hours
Unit Costs/ Hourly Cost($)
Item Costs
($)
Data Source
Accident response first-aid
materials
1 500 500 purchasing records
transport vehicle 10 mi. 100 1,000 purchasing records
Replacement worker 5,000 purchasing records
Insurance deductibles 25,000 insurance policy
Consultant fees 3,000 purchasing records
Demurrage 1,800 purchasing records
Fines and penalties 40,000 accounting
Legal fees 2,000 purchasing records
Total Cost 78,300
The calculated estimate of lost revenue is $4,158,000:
General Information
LOST REVENUE Item/ Activity Sub-item/
Sub-activity Units/ Hours
Unit Costs/ Hourly Cost($)
Item Costs ($)
Data Source
Lost production Lost while pit
down
23.5 days x
7,200 tpd
15/ton 2,538,000 production records
Reduced while shovel replaced
30 days x 3,600 tpd
15/ton 540,000 production records
Total Cost 4,158,000
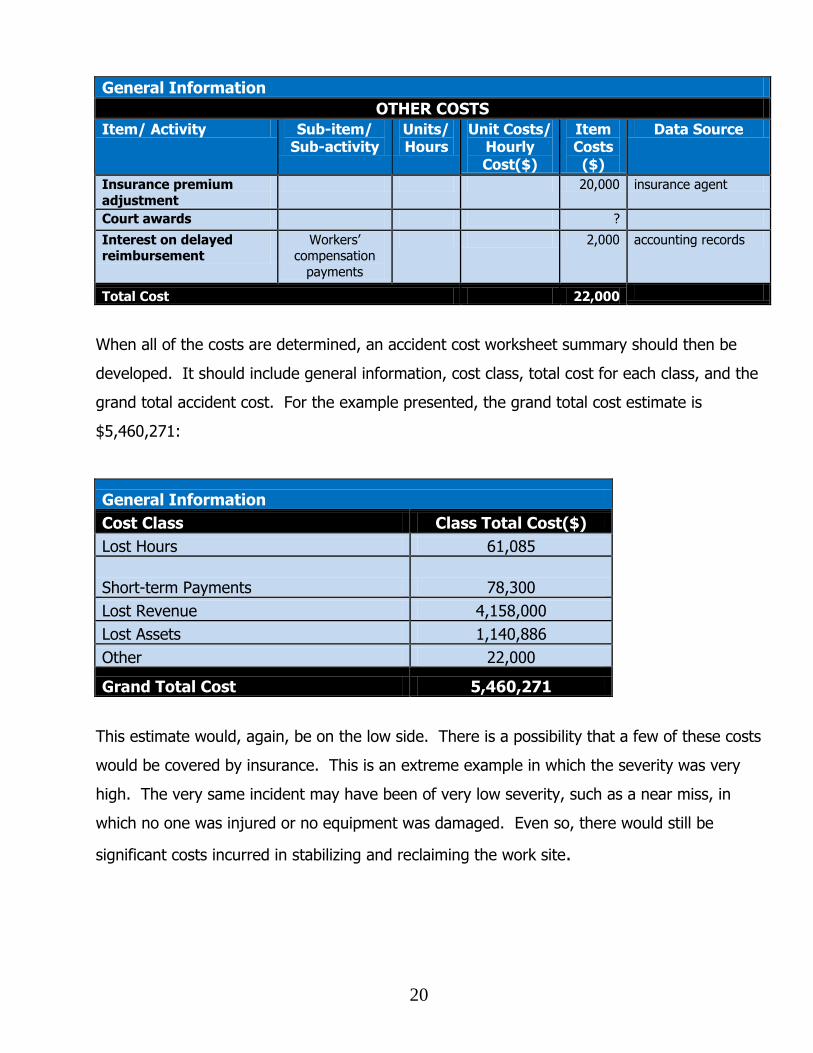
The calculated estimate of other costs is $22,000. The costs in this category may be
underestimated because of the time required for them to occur. For example, if an insurance
premium adjustment occurs as a result of this accident, it may take one, two, or three years,
depending upon the loss history of the company. Court awards may not show up for years.
Consequently, these costs would need to be estimates.
20
General Information
OTHER COSTS
Item/ Activity Sub-item/ Sub-activity
Units/ Hours
Unit Costs/ Hourly Cost($)
Item Costs
($)
Data Source
Insurance premium
adjustment
20,000 insurance agent
Court awards ?
Interest on delayed reimbursement
Workers’ compensation
payments
2,000 accounting records
Total Cost 22,000
When all of the costs are determined, an accident cost worksheet summary should then be
developed. It should include general information, cost class, total cost for each class, and the
grand total accident cost. For the example presented, the grand total cost estimate is
$5,460,271:
General Information
Cost Class Class Total Cost($)
Lost Hours 61,085
Short-term Payments 78,300
Lost Revenue 4,158,000
Lost Assets 1,140,886
Other 22,000
Grand Total Cost 5,460,271
This estimate would, again, be on the low side. There is a possibility that a few of these costs
would be covered by insurance. This is an extreme example in which the severity was very
high. The very same incident may have been of very low severity, such as a near miss, in
which no one was injured or no equipment was damaged. Even so, there would still be
significant costs incurred in stabilizing and reclaiming the work site.
21
SUMMARY
The total cost of an accident can be determined using logical investigation techniques in which
all visible and hidden costs of the accident are fully identified and quantified. By conducting
an accident total cost determination, the impact of accidents on the company’s profit becomes
more apparent. Hence, with a clearer focus on the net return on safety and health
investments, management can make more informed decisions regarding accident prevention
expenditures.
22
REFERENCES
Aaltonen, M.V.P. (1996). Computer-Aided Calculation of Accident Costs. American Society of Safety Engineers. (2010). Reducing/Ignoring Workplace Safety Programs During Economic Downturn a Wrong Move for Business. Bureau of Mines. (1988) Bureau of Mines Cost Estimation System Handbook. Construction Users Roundtable. (1990). The Economic Impact of Construction Accident. In Improving Construction Safety Performance. Retrieved June 8, 2007 from http://www.curt.org/pdf/135.pdf . CostMine. (2006). Mine & Mill Equipment Costs: An Estimator's Guide. Spokane, WA: CostMine-a Division of InfoMine. CostMine. (2007). Mine Wage & Benefit Surveys. Spokane, Way: CostMine-a Division of InfoMine. CostMine. (2008). Mining Cost Service. Spokane, Way: CostMine-a Division of InfoMine. Department of Labor, Bureau of Labor Statistics. (2009). Mining and Milling Cost Indexes. Dorman, Peter. (2000). Three Preliminary Papers on the Economics of Occupational Safety and Health. Retrieved June 10, 2007 from http://www.ilo.org/public/english/protection/safework/papers/ecoanal /. Grayson, Larry R. (2001). Hazard Identification, Risk Management, and Hazard Control. In Michael Karmis (Ed.), Mine Health and Safety Management (245 – 261). Littleton, CO: Society for Mining, Metallurgy, and Exploration, Inc. Hagan, Philip E., Montgomery, John F., and O’Reilly, James T. (Eds.). (2001). Accident Investigation, Analysis, and Costs. Accident Prevention Manual – Administration and Programs (178 – 201). Itasca, IL: National Safety Council. Health and Safety Executive. Incident Cost Calculator. Retrieved September 13, 2007 from http://www.hse.gov.uk/costs/incost_calc/incost_calc.asp Jones, Elmer A., and Pettijohn, W. T. (Eds.). 1973. Mine Costs and Control. In Given, Ivan A. (Ed.), SME Mining Engineering Handbook (31-1 – 31-50). New York: Society of Mining Engineers of The American Institute of Mining, Metallurgical, and Petroleum Engineers, Inc.
23
Linz, Douglas H., and Alvarado, Barbara A. Demonstrating Cost Savings & the Cost of Work Disability. (2002). Retrieved August 6, 200 from http://www.systoc.com/Tracker/Winter01/CostSavings.asp . McGarraugh, Robert, E.M. (1920). Mine Bookkeeping. New York. McGraw-Hill Book Company. Mine Safety and Health Administration (MSHA). (1991). Fault Tree Analysis. National Council on Compensation Insurance. (2004). ABC’s of Experience Rating. Retrieved June 30, 2007, from https://www.ncci.com/media/pdf/abc_Exp_Rating.pdf . Canadian Centre for Occupational Health and Safety. (2002). Accident Cost Iceberg by Doug Johnson. Retrieved July 24, 2011 from http://www.ccohs.ca/hscanada/hsdocs.html . Prichard, Ron. The Cost of Safety. (2002). Retrieved May 10, 2007 from http://www.irmi.com/Expert/articles/2002/prichard10.aspx . Priz, Edward J. (2005). Ultimate Guide to Workers’ Compensation Insurance. Madison, WI: Entrepreneur, Inc. Rikhardson, Pall. (2006). Accounting for Health and Safety Costs: review and comparison of selected methods. Aarhus School of Business. The Hartford Loss Control Department. (2002). Supporting the Need for Risk Management. Retrieved June 3, 2007 from http://www.thehartford.com/corporate/losscontrol/TIPS/520-008.pdf . Willcox, Frank. (1949). Accounting System. In Mine Accounting and Financial Administration (70 – 89). New York: Pitman Publishing Corporation. WorkSafeBC. Small Business Safety Calculator. Retrieved September 13, 2007 from http://www2.worksafebc.com/sc/calculator/Calculator_worksheet.pdf
24
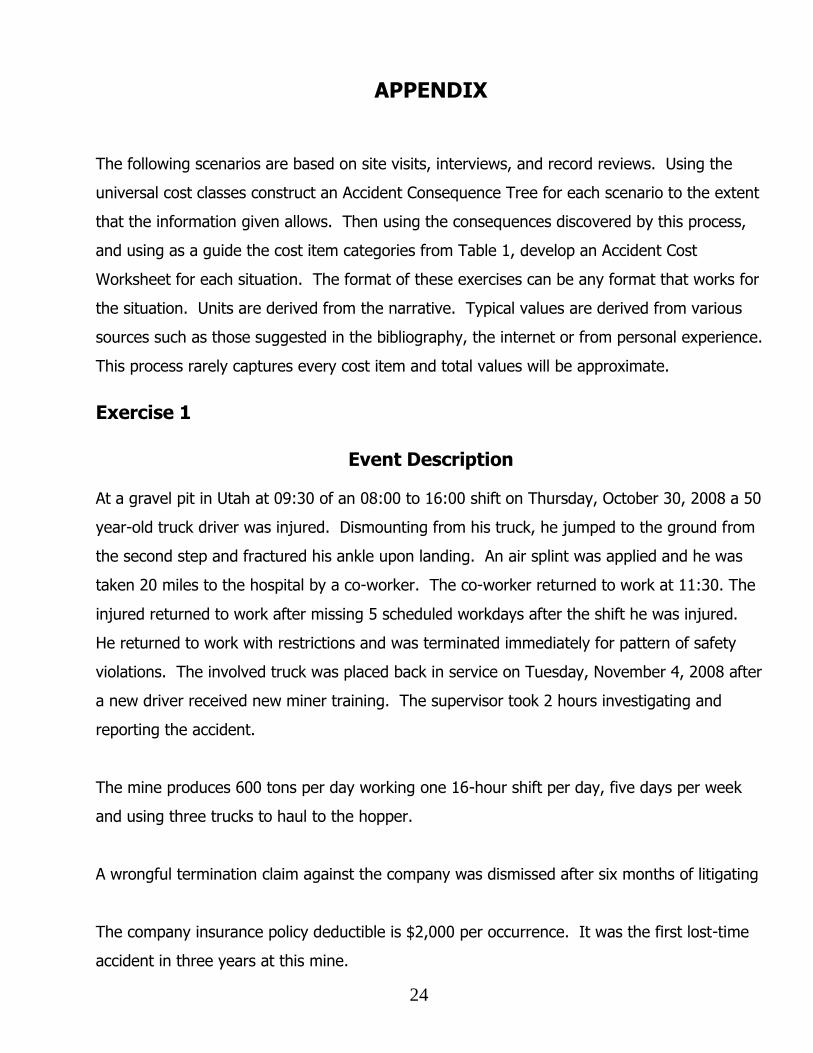
APPENDIX
The following scenarios are based on site visits, interviews, and record reviews. Using the
universal cost classes construct an Accident Consequence Tree for each scenario to the extent
that the information given allows. Then using the consequences discovered by this process,
and using as a guide the cost item categories from Table 1, develop an Accident Cost
Worksheet for each situation. The format of these exercises can be any format that works for
the situation. Units are derived from the narrative. Typical values are derived from various
sources such as those suggested in the bibliography, the internet or from personal experience.
This process rarely captures every cost item and total values will be approximate.
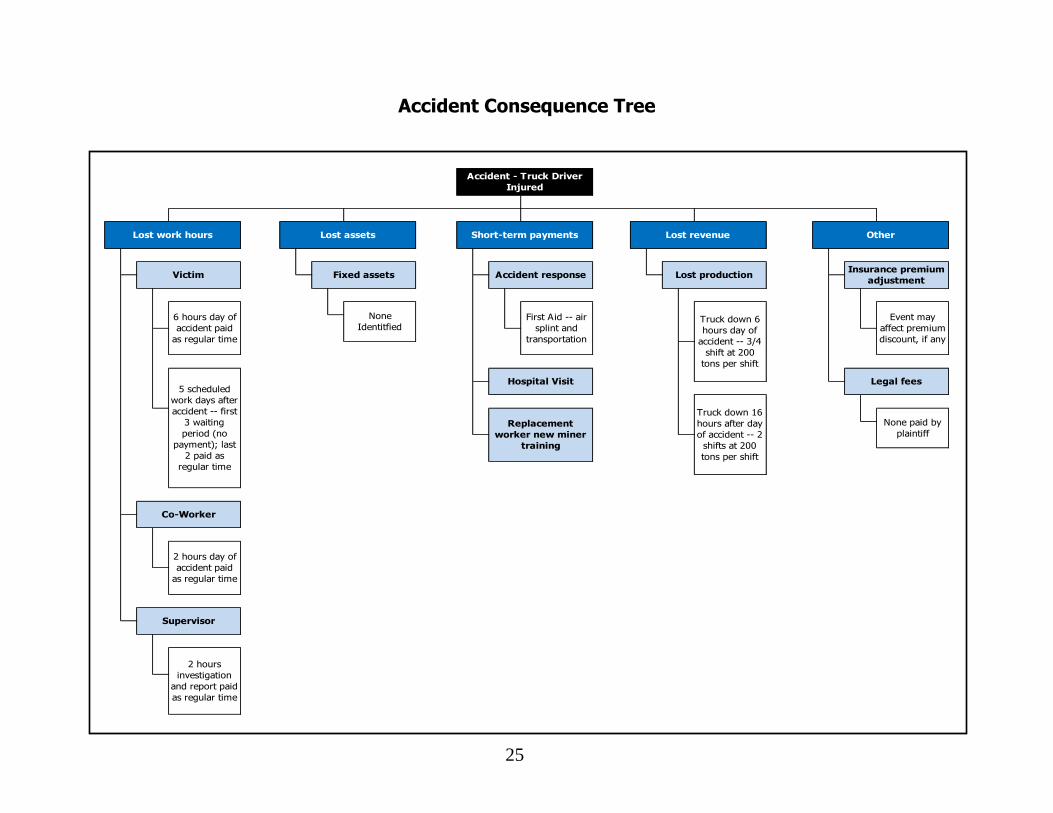
Exercise 1
Event Description
At a gravel pit in Utah at 09:30 of an 08:00 to 16:00 shift on Thursday, October 30, 2008 a 50
year-old truck driver was injured. Dismounting from his truck, he jumped to the ground from
the second step and fractured his ankle upon landing. An air splint was applied and he was
taken 20 miles to the hospital by a co-worker. The co-worker returned to work at 11:30. The
injured returned to work after missing 5 scheduled workdays after the shift he was injured.
He returned to work with restrictions and was terminated immediately for pattern of safety
violations. The involved truck was placed back in service on Tuesday, November 4, 2008 after
a new driver received new miner training. The supervisor took 2 hours investigating and
reporting the accident.
The mine produces 600 tons per day working one 16-hour shift per day, five days per week
and using three trucks to haul to the hopper.
A wrongful termination claim against the company was dismissed after six months of litigating
The company insurance policy deductible is $2,000 per occurrence. It was the first lost-time
accident in three years at this mine.
25
Accident Consequence Tree
Other
Accident - Truck Driver
Injured
Lost work hours Lost assets Short-term payments Lost revenue
Victim Fixed assets Accident response Lost productionInsurance premium
adjustment
2 hours
investigation
and report paid
as regular time
None
Identitfied
None paid by
plaintiff
Truck down 6
hours day of
accident -- 3/4
shift at 200
tons per shift
Truck down 16
hours after day
of accident -- 2
shifts at 200
tons per shift
Event may
affect premium
discount, if any
Legal fees
2 hours day of
accident paid
as regular time
Supervisor
First Aid -- air
splint and
transportation
Hospital Visit
Replacement
worker new miner
training
6 hours day of
accident paid
as regular time
Co-Worker
5 scheduled
work days after
accident -- first
3 waiting
period (no
payment); last
2 paid as
regular time
26
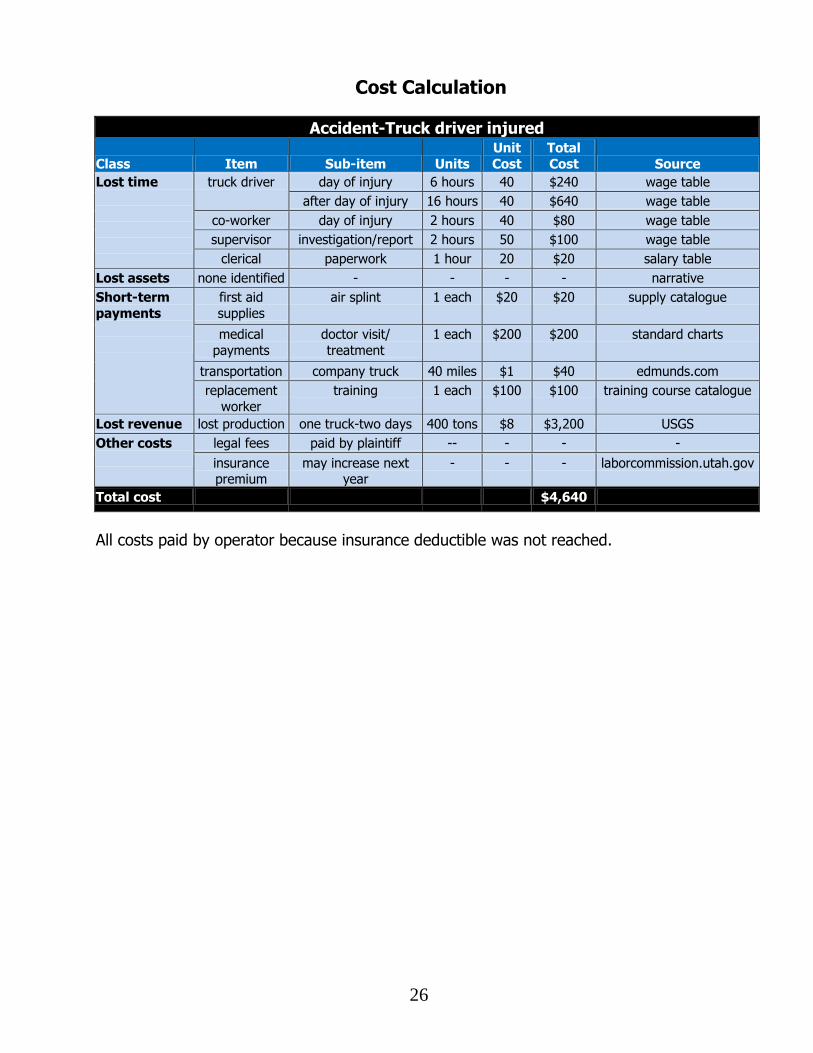
Cost Calculation
Accident-Truck driver injured
Class Item Sub-item Units
Unit
Cost
Total
Cost Source
Lost time
truck driver day of injury 6 hours 40 $240 wage table
after day of injury 16 hours 40 $640 wage table
co-worker day of injury 2 hours 40 $80 wage table
supervisor investigation/report 2 hours 50 $100 wage table
clerical paperwork 1 hour 20 $20 salary table
Lost assets none identified - - - - narrative
Short-term
payments
first aid
supplies
air splint 1 each $20 $20 supply catalogue
medical
payments
doctor visit/
treatment
1 each $200 $200 standard charts
transportation company truck 40 miles $1 $40 edmunds.com
replacement
worker
training 1 each $100 $100 training course catalogue
Lost revenue lost production one truck-two days 400 tons $8 $3,200 USGS
Other costs
legal fees paid by plaintiff -- - - -
insurance premium
may increase next year
- - - laborcommission.utah.gov
Total cost $4,640
All costs paid by operator because insurance deductible was not reached.
27
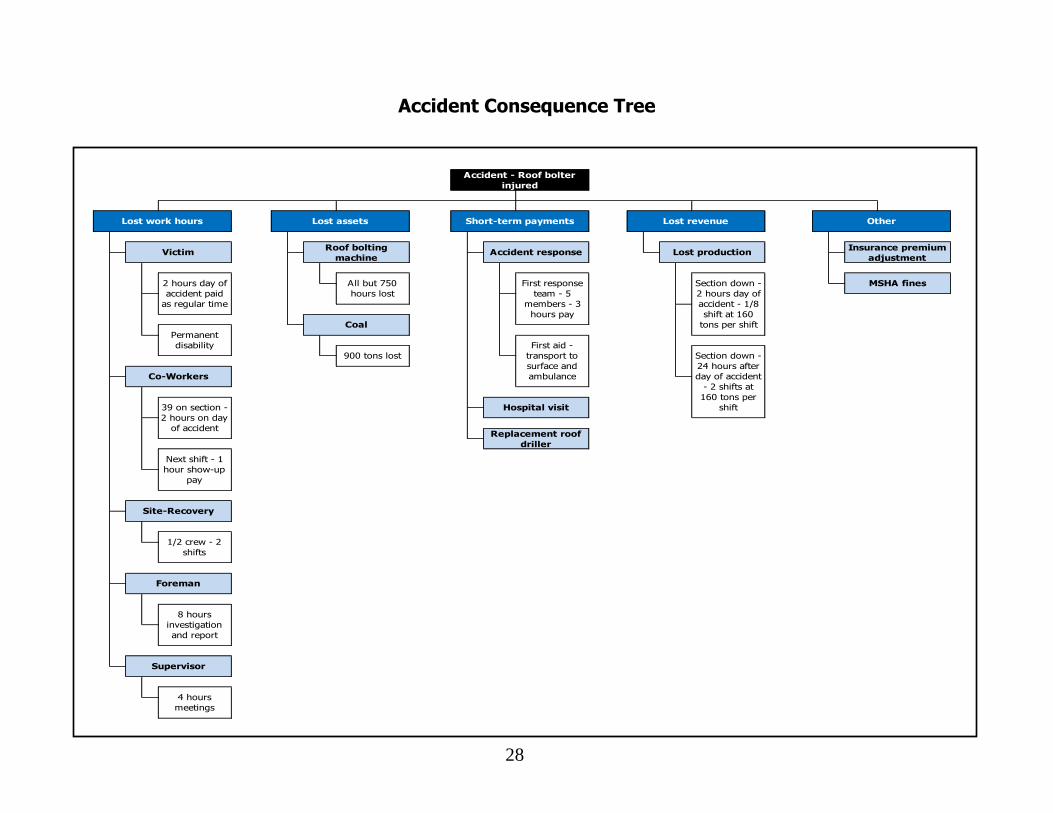
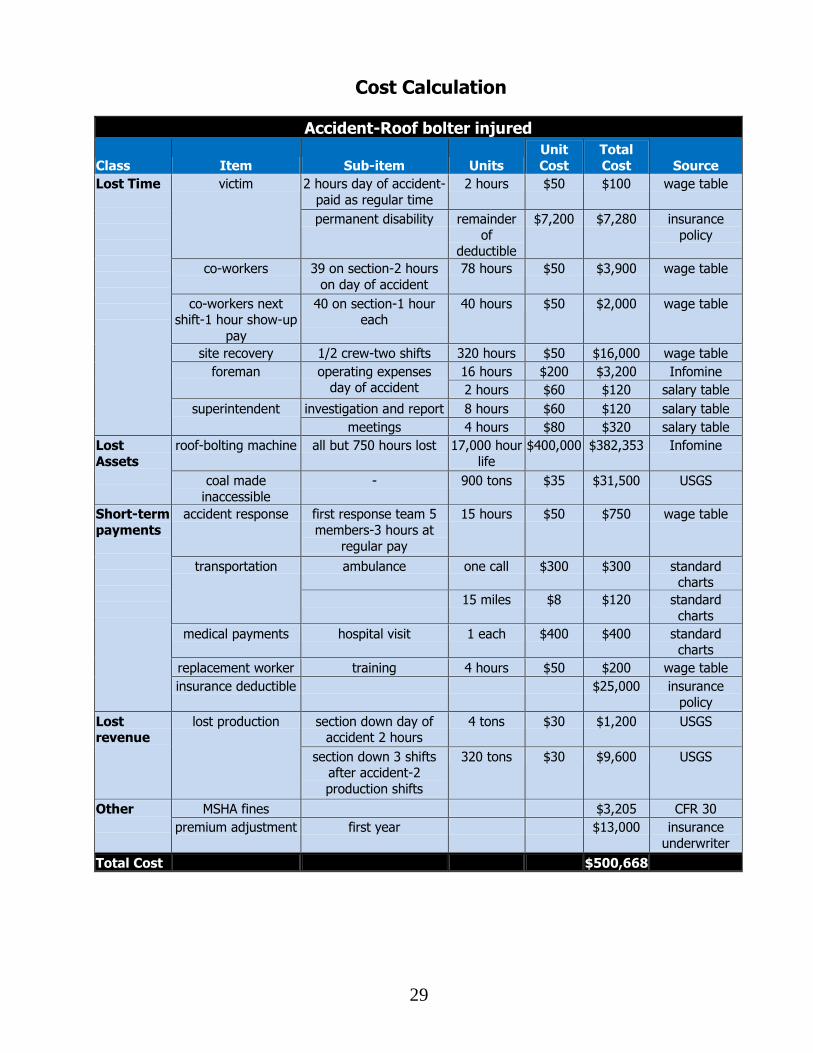
Exercise 2
Event Description At an underground coal mine in Colorado at 22:00 of a 16:00 to 24:00 shift on Monday,
February 25, 2002, a 40 year-old roof-bolting machine operator received permanent injury,
losing the use of his left arm. The operator was working and a large coal and rock rib struck
him crushing his left arm. Measures to rescue the victim were delayed due to coal and rock
from the rib continuing to fall. After about one hour the victim was extricated by the five-man
rescue team and transported to the surface by unit truck. At the surface, a County Hospital
ambulance took over the care of the victim transporting him 15 miles to the hospital.
The section was under a 103(k) order for 8 hours and it took two shifts to clear and recover
the site. A replacement driller required 4 hours of training on a new drill. The amount of coal
made inaccessible by roof conditions was 900 tons. The mine was cited for violations of
75.220(a)(1), S&S, High Negligence and 75.362, S&S, High Negligence, total penalties paid
were $3,205.
The drill was a J.H. Fletcher II, Model No. RRII15, dual boom, single bar ATRS. It had 750
hours use and was a total loss.
The mining operation produces two shifts a day and maintains on the third shift. Total
employment is 195 (175 work underground, 40 on the section). Production is 960 tons per
day from three mechanized mining units. Section haulage is by diesel ram cars and conveyor
belts that transport to the surface.
The company insurance policy is a $25,000 deductible. This is the seventh serious accident at
this mine this year and the company was put into and assigned risk pool raising premiums by
$13,000 a year.
28
Accident Consequence Tree
Other
2 hours day of
accident paid
as regular time
Section down -
2 hours day of
accident - 1/8
shift at 160
tons per shift
Accident - Roof bolter
injured
Lost work hours Lost assets Short-term payments Lost revenue
VictimRoof bolting
machineAccident response Lost production
Insurance premium
adjustment
Co-Workers
39 on section -
2 hours on day
of accident
Next shift - 1
hour show-up
pay
Permanent
disability
Site-Recovery
1/2 crew - 2
shifts
Foreman
Supervisor
4 hours
meetings
8 hours
investigation
and report
Replacement roof
driller
Section down -
24 hours after
day of accident
- 2 shifts at
160 tons per
shift
MSHA finesAll but 750
hours lost
Coal
900 tons lost
First response
team - 5
members - 3
hours pay
First aid -
transport to
surface and
ambulance
Hospital visit
29
Cost Calculation
Accident-Roof bolter injured
Class Item Sub-item Units
Unit
Cost
Total
Cost Source
Lost Time
victim 2 hours day of accident-
paid as regular time
2 hours $50 $100 wage table
permanent disability remainder
of deductible
$7,200 $7,280 insurance
policy
co-workers 39 on section-2 hours
on day of accident
78 hours $50 $3,900 wage table
co-workers next shift-1 hour show-up
pay
40 on section-1 hour each
40 hours $50 $2,000 wage table
site recovery 1/2 crew-two shifts 320 hours $50 $16,000 wage table
foreman operating expenses day of accident
16 hours $200 $3,200 Infomine
2 hours $60 $120 salary table
superintendent investigation and report 8 hours $60 $120 salary table
meetings 4 hours $80 $320 salary table
Lost
Assets
roof-bolting machine all but 750 hours lost 17,000 hour
life
$400,000 $382,353 Infomine
coal made
inaccessible
- 900 tons $35 $31,500 USGS
Short-term
payments
accident response first response team 5
members-3 hours at
regular pay
15 hours $50 $750 wage table
transportation ambulance one call $300 $300 standard charts
15 miles $8 $120 standard
charts
medical payments hospital visit 1 each $400 $400 standard charts
replacement worker training 4 hours $50 $200 wage table
insurance deductible $25,000 insurance
policy
Lost revenue
lost production section down day of accident 2 hours
4 tons $30 $1,200 USGS
section down 3 shifts after accident-2
production shifts
320 tons $30 $9,600 USGS
Other
MSHA fines $3,205 CFR 30
premium adjustment first year $13,000 insurance
underwriter
Total Cost $500,668