
Accessibility Disclosure We understand the importance of ...
30
Accessibility Disclosure We understand the importance of making work accessible to everyone. Most of this document has been made accessible, however the tables are not up to the State of Nevada’s standards. If you have any problems related to the accessibility or you need any enhanced accessibility, please email [email protected].
Transcript of Accessibility Disclosure We understand the importance of ...

Accessibility Disclosure
We understand the importance of making work accessible to everyone. Most of this document has
been made accessible, however the tables are not up to the State of Nevada’s standards. If you have
any problems related to the accessibility or you need any enhanced accessibility, please email
Department of Health and Human Services | November 2020
Special Surveillance Report Veteran Suicide
November 2020
Office of Analytics Department of Health and Human Services
Steve Sisolak Governor
State of Nevada
Richard Whitley, MS Director
Department of Health and Human Services
Lisa Sherych Administrator
Division of Public and Behavioral Health
Ihsan Azzam, Ph.D, MD Chief Medical Officer
Division of Public and Behavioral Health

Special Surveillance Report on Veterans Suicide 2015-2019
Page 3 of 30 Department of Health and Human Services | November 2020
Acknowledgements
Prepared by and Additional Information:
Devin Gamboa Biostatistician I Office of Analytics Department of Health of Human Services State of Nevada [email protected]
Thank you to following for providing leadership, data and technical support for this report:
Martha Framsted Public Information Officer Division of Public and Behavioral Health Department of Health of Human Services State of Nevada
Kyra Morgan, MS Biostatistician Office of Analytics Department of Health of Human Services State of Nevada
Madison Lopey Biostatistician II Office of Analytics Department of Health of Human Services State of Nevada
Recommended Citation
Office of Analytics. Department of Health and Human Services. Special Surveillance Report: Veterans
Suicide 2015-2019. Carson City, Nevada. November 2020.
Special Surveillance Report on Veterans Suicide 2015-2019
Page 4 of 30 Department of Health and Human Services | November 2020
Table of Contents Acknowledgements ....................................................................................................................................... 3
Table of Contents .......................................................................................................................................... 4
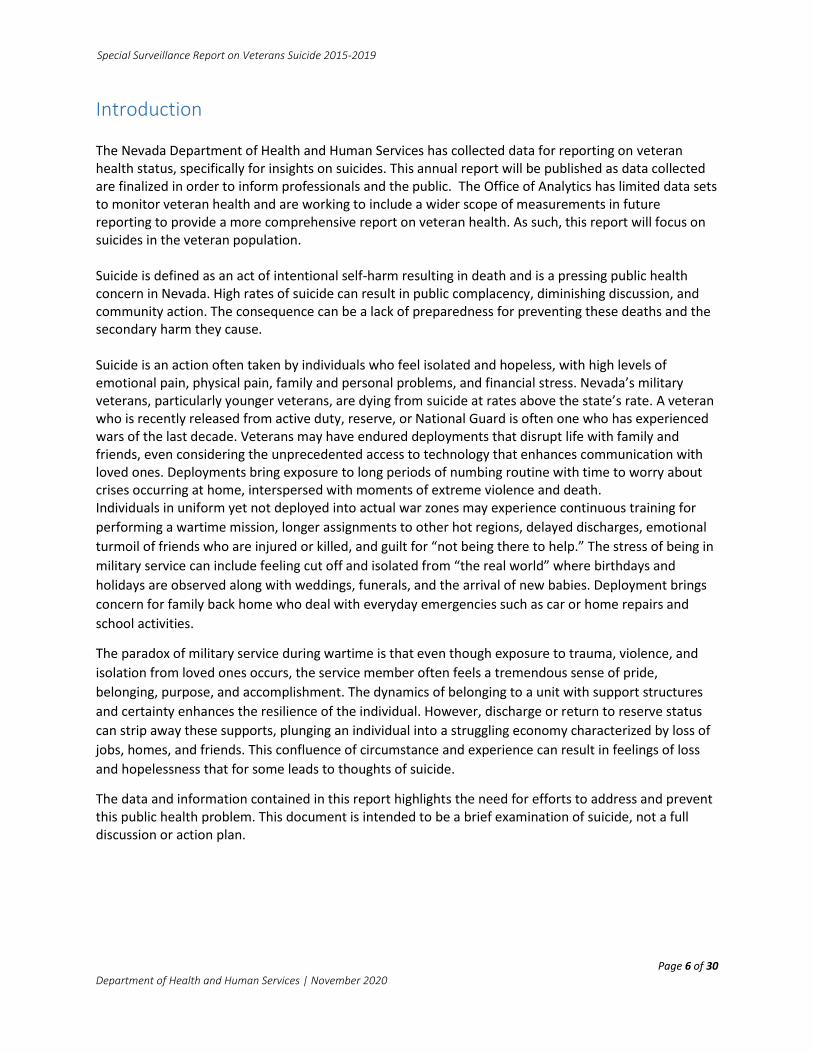
Introduction .................................................................................................................................................. 6
Data Sources ................................................................................................................................................. 7
Technical Notes ............................................................................................................................................. 8
Veteran-Related Deaths ................................................................................................................................ 9
Figure 1. Top 10 Primary Causes of Death by Veteran Status. Nevada Residents, 2015-2019 Combined.
................................................................................................................................................................ 10
Figure 2. Total Count of Deaths by Veteran Status and Age Group. Nevada Residents Ages 20+, 2015-
2019. ....................................................................................................................................................... 11
Figure 3. Non-Veteran Death Counts by Manner of Death and Race/Ethnicity. Nevada Residents Ages
20+, 2015-2019. ...................................................................................................................................... 12
Figure 4. Veteran Death Counts by Manner of Death and Race/Ethnicity. Nevada Residents Ages 20+,
2015-2019. .............................................................................................................................................. 13
Figure 5. Percentage of Total Deaths that had a Cause of Death Indicated as Suicide by Veteran Status
by Age Group. Nevada Residents Ages 20+, 2015-2019 Combined. ...................................................... 14
Figure 6. Total Count of Suicide-Related Deaths by Veteran Status and Age Group. Nevada Residents
Ages 20+, 2015-2019............................................................................................................................... 15
Figure 7. Counts of Suicide-Related Deaths by Year and Veteran Status. Nevada Residents Ages 20+,
2015-2019. .............................................................................................................................................. 15
Figure 8. Age Distribution of Suicide-Related Deaths by Veteran Status. Nevada Residents Aged 20+,
2015-2019 Combined. ............................................................................................................................. 16
Figure 9. Age Distribution of Population by Veteran Status. Nevada Residents Ages 20+, 2015-2019
Combined. ............................................................................................................................................... 16
Figure 10. Age Distribution of Suicide-Related Deaths by Veteran Status. Nevada Residents Ages 20+,
2015-2019. .............................................................................................................................................. 17
Figure 11. Suicide-Related Deaths by Year, Veteran Status, and Method of Suicide. Nevada Residents
Ages 20+, 2015-2019............................................................................................................................... 17
Figure 12. Percent of Non-Veteran Suicide-Related Deaths by Method and Sex. Nevada Residents Ages
20+, 2015-2019 Combined. ..................................................................................................................... 18
Figure 13. Percent of Veteran Suicide-Related Deaths by Method and Sex. Nevada Residents Ages 20+,
2015-2019 Combined. ............................................................................................................................. 18
Figure 14. Suicide Age-Adjusted Rates (per 100,000) by Year and Veteran Status. Nevada Residents
Ages 20+, 2015-2019............................................................................................................................... 19
Figure 15. Methods of Suicide Age-Adjusted Rates (per 100,000) by Year, Veteran Nevada Residents
Ages 20+, 2015-2019............................................................................................................................... 20

Special Surveillance Report on Veterans Suicide 2015-2019
Page 5 of 30 Department of Health and Human Services | November 2020
Figure 16. Methods of Suicide Age-Adjusted Rates (per 100,000) by Year, Non-Veteran Nevada
Residents Ages 20+, 2015-2019. ............................................................................................................. 20
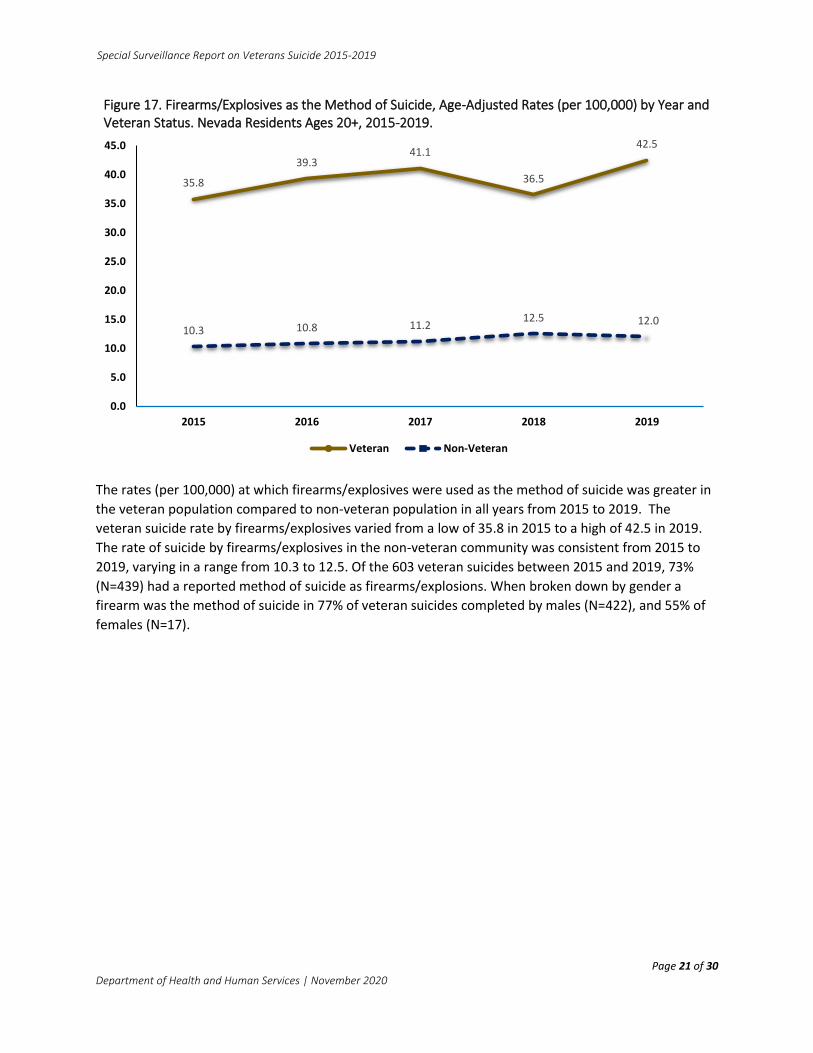
Figure 17. Firearms/Explosives as the Method of Suicide, Age-Adjusted Rates (per 100,000) by Year
and Veteran Status. Nevada Residents Ages 20+, 2015-2019. ............................................................... 21
Suicide-Related Hospitalizations ................................................................................................................. 22
Figure 18. Suicide-Related Emergency Department Visits and Inpatient Admissions by Military
Community Status and Sex. Nevada Residents, 2015-2019 Combined. ................................................. 22
Figure 19. Suicide-Related Emergency Department Visits and Inpatient Admissions by Military
Community Status and Age-Group. Nevada Residents, 2015-2019 Combined. ..................................... 23
Figure 20. Suicide-Related Emergency Department Visits by Military Community Status, Method of
Attempts and Year. Nevada Residents, 2015-2019. ............................................................................... 24
Figure 21. Suicide-Related Inpatient Admissions by Military Community Status, Method of Attempts
and Year. Nevada Residents, 2015-2019. ............................................................................................... 25
Behavioral Risk Factor Surveillance System (BRFSS) ................................................................................... 26
Figure 22. Percentage who Reported Suicide Ideology by Veteran Status and Year. Nevada Residents,
2015-2019. .............................................................................................................................................. 26
Conclusion ................................................................................................................................................... 27
Appendix ..................................................................................................................................................... 27
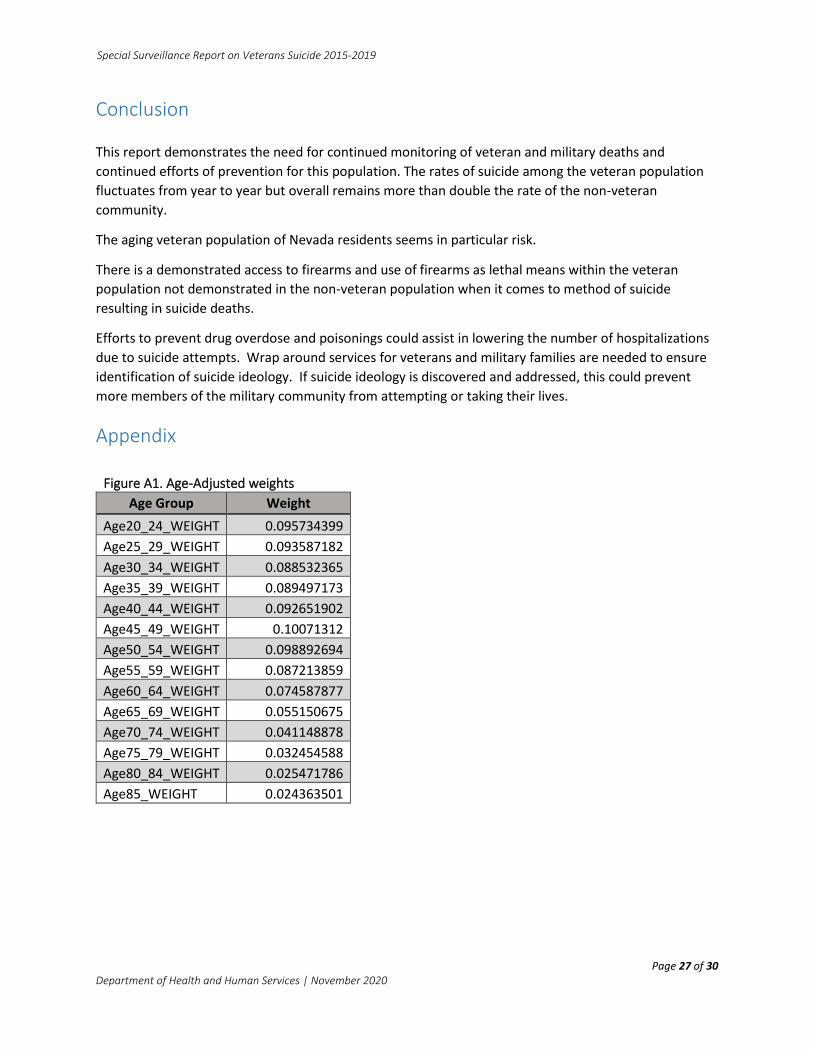
Figure A1. Age-Adjusted weights ............................................................................................................ 27
Figure A2. Total Counts and Rates (per 100,000) by Method of Suicide and Veteran Status. Nevada
Residents Ages 20+, 2015. ...................................................................................................................... 29
Figure A3. Total Counts and Rates (per 100,000) by Method of Suicide and Veteran Status. Nevada
Residents Ages 20+, 2016. ...................................................................................................................... 29
Figure A4. Total Counts and Rates (per 100,000) by Method of Suicide and Veteran Status. Nevada
Residents Ages 20+, 2017. ...................................................................................................................... 29
Figure A5. Total Counts and Rates (per 100,000) by Method of Suicide and Veteran Status. Nevada
Residents Ages 20+, 2018. ...................................................................................................................... 30
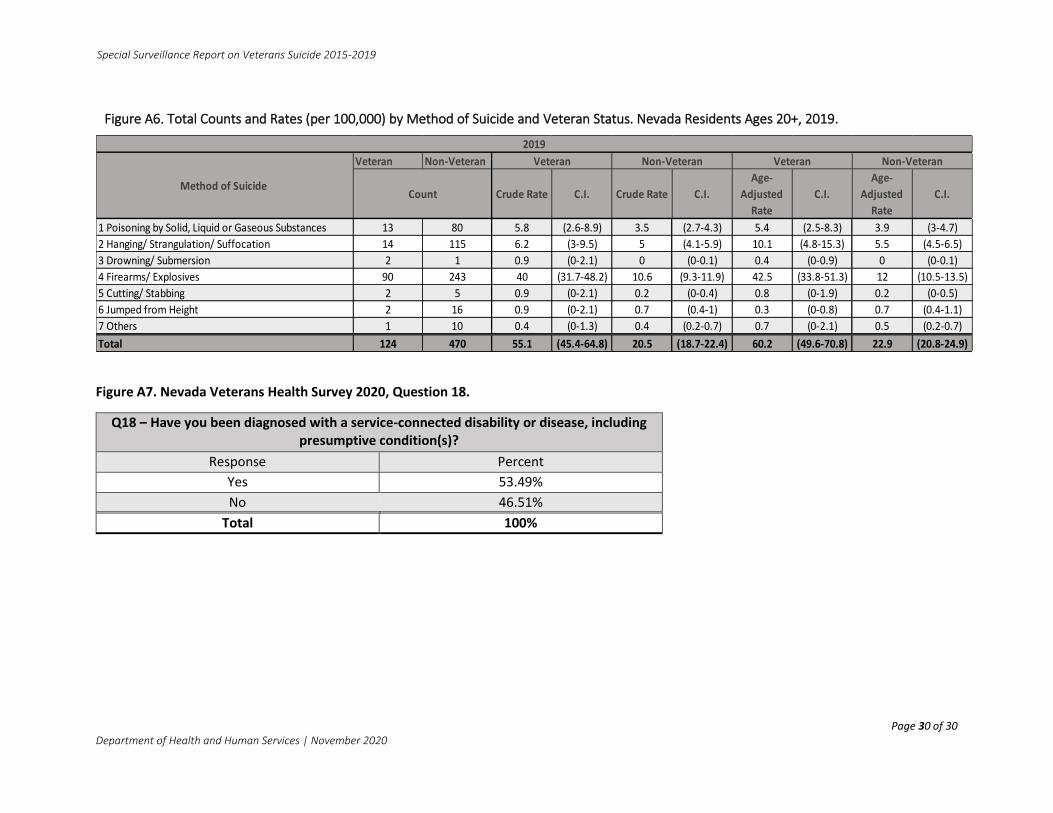
Figure A6. Total Counts and Rates (per 100,000) by Method of Suicide and Veteran Status. Nevada
Residents Ages 20+, 2019. ...................................................................................................................... 31
Figure A7. Nevada Veterans Health Survey 2020, Question 18. ……………………………………………………….32
Special Surveillance Report on Veterans Suicide 2015-2019
Page 6 of 30 Department of Health and Human Services | November 2020
Introduction
The Nevada Department of Health and Human Services has collected data for reporting on veteran health status, specifically for insights on suicides. This annual report will be published as data collected are finalized in order to inform professionals and the public. The Office of Analytics has limited data sets to monitor veteran health and are working to include a wider scope of measurements in future reporting to provide a more comprehensive report on veteran health. As such, this report will focus on suicides in the veteran population.
Suicide is defined as an act of intentional self-harm resulting in death and is a pressing public health concern in Nevada. High rates of suicide can result in public complacency, diminishing discussion, and community action. The consequence can be a lack of preparedness for preventing these deaths and the secondary harm they cause.
Suicide is an action often taken by individuals who feel isolated and hopeless, with high levels of emotional pain, physical pain, family and personal problems, and financial stress. Nevada’s military veterans, particularly younger veterans, are dying from suicide at rates above the state’s rate. A veteran who is recently released from active duty, reserve, or National Guard is often one who has experienced wars of the last decade. Veterans may have endured deployments that disrupt life with family and friends, even considering the unprecedented access to technology that enhances communication with loved ones. Deployments bring exposure to long periods of numbing routine with time to worry about crises occurring at home, interspersed with moments of extreme violence and death. Individuals in uniform yet not deployed into actual war zones may experience continuous training for
performing a wartime mission, longer assignments to other hot regions, delayed discharges, emotional
turmoil of friends who are injured or killed, and guilt for “not being there to help.” The stress of being in
military service can include feeling cut off and isolated from “the real world” where birthdays and
holidays are observed along with weddings, funerals, and the arrival of new babies. Deployment brings
concern for family back home who deal with everyday emergencies such as car or home repairs and
school activities.
The paradox of military service during wartime is that even though exposure to trauma, violence, and
isolation from loved ones occurs, the service member often feels a tremendous sense of pride,
belonging, purpose, and accomplishment. The dynamics of belonging to a unit with support structures
and certainty enhances the resilience of the individual. However, discharge or return to reserve status
can strip away these supports, plunging an individual into a struggling economy characterized by loss of
jobs, homes, and friends. This confluence of circumstance and experience can result in feelings of loss
and hopelessness that for some leads to thoughts of suicide.
The data and information contained in this report highlights the need for efforts to address and prevent this public health problem. This document is intended to be a brief examination of suicide, not a full discussion or action plan.

Special Surveillance Report on Veterans Suicide 2015-2019
Page 7 of 30 Department of Health and Human Services | November 2020
Data Sources
Behavioral Risk Factor Surveillance System (BRFSS) BRFSS is a state-based system of health surveys that collects information on health risk behaviors, preventive health practices, chronic health conditions, and use of preventive services. More than 350,000 adults are interviewed each year, making the BRFSS the largest telephone health survey in the world. For many states, the BRFSS is the only available source of timely and accurate data on health-related behaviors. The survey consists of a set of federally grant funded core questions and individual states may include and pay for their own questions in the survey. While the survey’s focus is chronic disease and injury, topics covered by the survey include car safety, obesity, and exercise among many others. Since state-added questions are not asked nationwide, these questions are not comparable.
Center for Health Information and Analysis (CHIA) Hospitalization data in this report are collected by CHIA, a research center housed at the University of Nevada, Las Vegas. CHIA collects billing records from all hospital inpatient, outpatient and ambulatory surgical centers. More information can be found at http://www.chiaunlv.com/index.php.
Nevada Electronic Death Registry System Mortality data in this report are from Nevada’s Electronic Death Registry System, collected by the Office of Vital Records. In this report, the top 10 primary causes of death are ranked from highest to lowest based on frequency of occurrence. Death data from 2015 to 2019 have been finalized as of October of 2020. This included the addition of out of state deaths and data cleaning. Data in previous reports were preliminary and therefore may not match exactly to data in this report.
Nevada Veteran Population Demographics: Nevada veteran population by age groups and sex from 2015 to 2019 were gathered from the U.S. Department of Veteran Affairs website. More information at https://www.va.gov/vetdata/veteran_population.asp.
Nevada Non-Veteran Population Demographics Non-veteran population estimates were calculated by subtracting the veteran populations from the Nevada population estimates. Nevada population estimates are from vintage year 2019 data, provided by the Nevada State Demographer. Data include individuals living in group quarters, as defined by the Nevada State Demographer.
Nevada Veteran Health Survey The Nevada Department of Veteran Services conducted a survey to determine and help Nevada veterans file claims for Veterans Administration (VA) compensation for 2020. This can be found at https://nvhealth.qualtrics.com/jfe/form/SV_51Og7q890Lvoy2h.
U.S. Population The U.S. Census Bureau’s U.S. 2010 standard population was used to create age-adjusted weights. More information at https://www.census.gov/prod/cen2010/briefs/c2010br-03.pdf.

Special Surveillance Report on Veterans Suicide 2015-2019
Page 8 of 30 Department of Health and Human Services | November 2020
Technical Notes
Age-adjusted rates are included in this report. Age-adjusting is used in order to control the effects of
differences in rates that result from age differences in the populations being compared. For example,
heart disease death rates would be higher in a population comprised of older individuals compared to a
population comprised of younger individuals. In this report, age-adjusting is applied to eliminate the
effects of age distribution between veteran and non-veteran populations.
Age-adjusted rates are weighted to the 2010 standard population provided by the U.S. Census.
Population distributions changed significantly between 2000 and 2010. Some previous versions of this
report used 2000 standard populations, and therefore there are differences in rates from previously
published reports. The weights table can be found in the Appendix Section, Figure A1.
All age-adjusted rates are based on the standard population distribution for the population aged 20 and
older. The Nevada veteran population breakdown by age groups is provided by the U.S. Department of
Veteran Affairs, which categorizes all veterans under the age of 20 into a single population group. Some
Nevadans aged under 18 had the “Military Status” box checked as “yes” on their death certificates due
to error or perhaps enrollment in delayed military entry programs. Since these individuals cannot be
considered veterans and are not the target group in this report, and may skew age-adjusted rates, only
individuals aged 20 and over at time of death are included in this report.
Race/Ethnicity in this report are broken down into White, Black, Native American, Asian, Hispanic and
Other/Unknown. White, Black, Native American and Asian categories are all non-Hispanic.
Identifying veteran status within the hospitalization data collected by CHIA is reliant (with limitations) to
a payer code of TRICARE (formerly CHAMPUS, Civilian Health and Medical Program of the Uniformed
Services) and CHAMPVA (Civilian Health and Medical Program of the Department of Veteran's Affairs).
TRICARE is a Department of Defense health care program for “active duty and retired members of the
uniformed services, their families, and survivors,” per benefits.gov, and CHAMPVA is a Veteran’s Affairs
program. Because of this limitation the hospitalization section of this report may contain dependents
and spouses of veterans who are covered through these payer sources.
Hospitalization data from CHIA is representative of the number of visits and not the number of unique
individuals. Therefore, a single person may be counted multiple times.
Due to the transition in billing schemas from ICD-9 to ICD-10, suicide attempt on or before October 1,
2015 are identified by an External Code of Injury (E-Codes), and suicide attempts after October 1, 2015
are identified by specific T and X codes. Due to these coding changes, please use caution when
comparing data before and after October 1, 2015.

Special Surveillance Report on Veterans Suicide 2015-2019
Page 9 of 30 Department of Health and Human Services | November 2020
Veteran-Related Deaths
In preparing this section of the report it was determined to compare the Nevada veteran population to Nevada’s non-veteran population. This determination was made to ensure a person’s veteran status was clearly identified through an individual’s death certificate, and no assumptions were made to the status. The Nevada death certificate inquires on veteran status, but this is not always completed. Due to this limitation, care should be taken in comparing total number of deaths, percentages and rates reported within this report to other topical reports, as well as the total number of deceased Nevada residents in any given year.
Between 2015 and 2019, there were a total of 121,605 Nevada resident deaths. Of these deaths, 1,977
were under the age of 20, 441 deaths had an unknown age, and 3,444 had an unknown veteran status.
Records with age under 20, unknown age, and unknown veteran status were not mutually exclusive, and
there were cases of overlap. For comparative purposes, individuals with either unknown age, ages under
20, and/or unknown veteran have been excluded from this section of the report, leaving a total of
115,841 deaths.
The four leading causes of death are the same for both veteran and non-veterans, which are heart
disease, malignant neoplasms or cancers, chronic lower respiratory disease, and cerebrovascular disease
(stroke).
When comparing primary causes of death, non-veterans had a higher percentage of total deaths for
cerebrovascular diseases (5%) and non-transport accidents (5%), where veteran percentage is 4% and
3%, respectively. Alzheimer’s disease, diabetes mellitus, and influenza and pneumonia each accounted
for the same percentage of total deaths in both veteran and non-veteran populations at 3%, and 4%
respectively.
Parkinson’s was the 10th ranked primary cause of death in the veteran population (1%) and all other causes accounting for the remaining 22% of total deaths. In the non-veteran population, the 10th ranked primary cause of death was chronic liver diseases and cirrhosis at 2%, and all other causes accounting for 23% of total deaths. Some of the differences found may be due to service-connected disabilities or diseases that veterans face. The Nevada Veteran Health Survey found that 53% of surveyed individuals responding “yes” to being diagnosed, including presumptive conditions (Figure A7).

Special Surveillance Report on Veterans Suicide 2015-2019
Page 10 of 30Department of Health and Human Services | November 2020
Figure 1. Top 10 Primary Causes of Death by Veteran Status. Nevada Residents, 2015-2019 Combined.
Rank Primary Cause of Death Count % of Total
Deaths
Veteran
1 Diseases of the heart 9,215 30%
2 Malignant neoplasms 6,760 23%
3 Chronic lower respiratory diseases 2,317 8%
4 Cerebrovascular diseases (stroke) 1,274 4%
5 Alzheimer's disease 842 3%
6 Nontransport accidents 839 3%
7 Diabetes mellitus 776 3%
8 Influenza and pneumonia 683 2%
9 Intentional self-harm (suicide) 603 2%
10 Parkinson's disease 474 1%
11 All other diseases (residual) 6,290 22%
Total 30,073 100%
Non-Veteran
1 Diseases of the heart 21,728 25%
2 Malignant neoplasms 18,688 22%
3 Chronic lower respiratory diseases 5,767 7%
4 Cerebrovascular diseases (stroke) 4,349 5%
5 Nontransport accidents 4,014 5%
6 Alzheimer's disease 2,814 3%
7 Intentional self-harm (suicide) 2,267 3%
8 Diabetes mellitus 2,223 3%
9 Influenza and pneumonia 1,999 2%
10 Chronic liver disease and cirrhosis 1,828 2%
11 All other diseases (residual) 20,091 23%
Total 85,768 100%
Suicide ranks as the ninth primary cause of death among veterans (two percent of total veteran deaths),
and seventh among non-veterans (three percent of total non-veteran deaths).

Special Surveillance Report on Veterans Suicide 2015-2019
Page 11 of 30 Department of Health and Human Services | November 2020
Figure 2. Total Count of Deaths by Veteran Status and Age Group. Nevada Residents Ages 20+, 2015-2019.
Year of
Death
Veteran Status
Age Group Total
20-24 25-34 35-44 45-54 55-64 65-74 75-84 85+
2015 Non-Veteran 162 456 683 1,438 2,725 3,459 3,507 3,454 15,884
Veteran 6 29 47 192 519 1,453 1,869 1,739 5,854
2016 Non-Veteran 189 470 700 1,534 2,810 3,714 3,863 3,635 16,915
Veteran 8 21 41 170 525 1,497 1,918 1,728 5,908
2017 Non-Veteran 180 495 677 1,450 2,869 3,784 4,018 3,708 17,181
Veteran 6 27 56 158 535 1,550 1,958 1,892 6,182
2018 Non-Veteran 165 478 776 1,425 2,966 3,827 4,157 3,800 17,594
Veteran 1 35 33 134 454 1,539 1,934 1,815 5,945
2019 Non-Veteran 165 468 693 1,467 2,949 4,101 4,524 3,827 18,194
Veteran 5 26 40 125 511 1,549 1,940 1,988 6,184
Total Non-Veteran 861 2,367 3,529 7,314 14,319 18,885 20,069 18,424 85,768
Veteran 26 138 217 779 2,544 7,588 9,619 9,162 30,073
Total veteran deaths comprise a range of 25% (2018, 2019) to 27% (2015) of total deaths in Nevada of
individuals aged 20+. This fluctuation is expected and should not be interpreted as significant changes.
It represents both changes in numbers of total deaths as well as population changes.
Special Surveillance Report on Veterans Suicide 2015-2019
Page 12 of 30 Department of Health and Human Services | November 2020
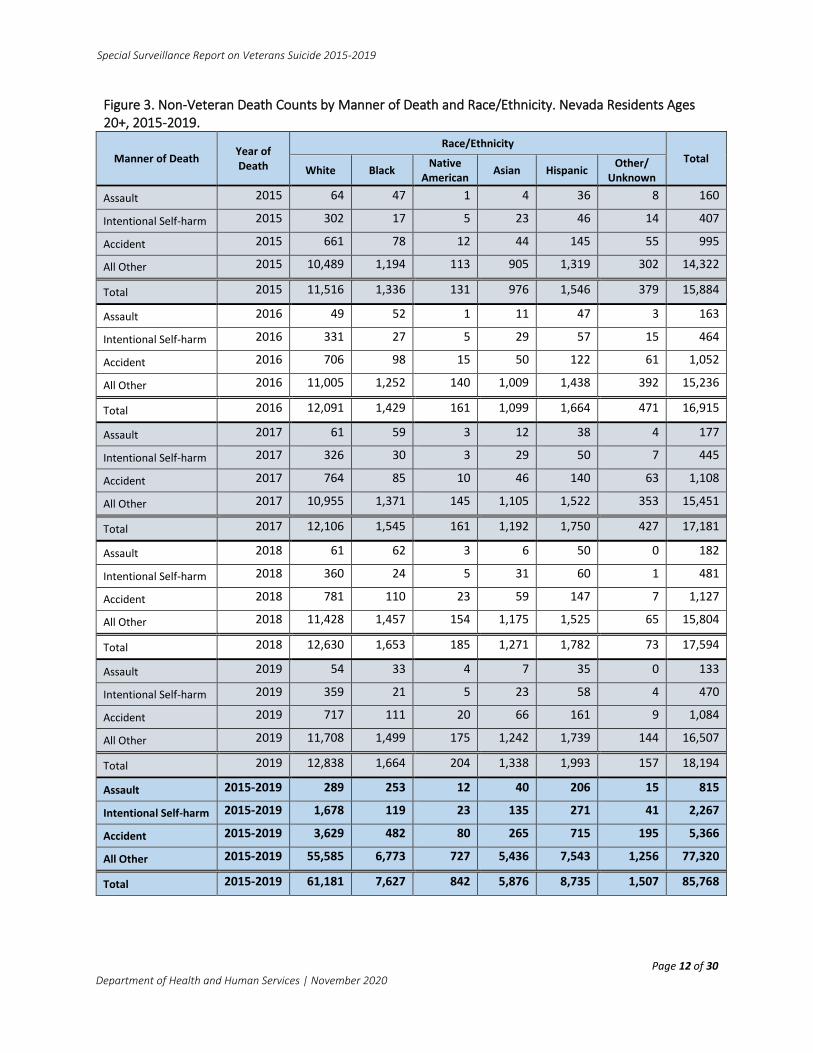
Figure 3. Non-Veteran Death Counts by Manner of Death and Race/Ethnicity. Nevada Residents Ages 20+, 2015-2019.
Manner of Death Year of Death
Race/Ethnicity
Total White Black
Native American
Asian Hispanic Other/
Unknown
Assault 2015 64 47 1 4 36 8 160
Intentional Self-harm 2015 302 17 5 23 46 14 407
Accident 2015 661 78 12 44 145 55 995
All Other 2015 10,489 1,194 113 905 1,319 302 14,322
Total 2015 11,516 1,336 131 976 1,546 379 15,884
Assault 2016 49 52 1 11 47 3 163
Intentional Self-harm 2016 331 27 5 29 57 15 464
Accident 2016 706 98 15 50 122 61 1,052
All Other 2016 11,005 1,252 140 1,009 1,438 392 15,236
Total 2016 12,091 1,429 161 1,099 1,664 471 16,915
Assault 2017 61 59 3 12 38 4 177
Intentional Self-harm 2017 326 30 3 29 50 7 445
Accident 2017 764 85 10 46 140 63 1,108
All Other 2017 10,955 1,371 145 1,105 1,522 353 15,451
Total 2017 12,106 1,545 161 1,192 1,750 427 17,181
Assault 2018 61 62 3 6 50 0 182
Intentional Self-harm 2018 360 24 5 31 60 1 481
Accident 2018 781 110 23 59 147 7 1,127
All Other 2018 11,428 1,457 154 1,175 1,525 65 15,804
Total 2018 12,630 1,653 185 1,271 1,782 73 17,594
Assault 2019 54 33 4 7 35 0 133
Intentional Self-harm 2019 359 21 5 23 58 4 470
Accident 2019 717 111 20 66 161 9 1,084
All Other 2019 11,708 1,499 175 1,242 1,739 144 16,507
Total 2019 12,838 1,664 204 1,338 1,993 157 18,194
Assault 2015-2019 289 253 12 40 206 15 815
Intentional Self-harm 2015-2019 1,678 119 23 135 271 41 2,267
Accident 2015-2019 3,629 482 80 265 715 195 5,366
All Other 2015-2019 55,585 6,773 727 5,436 7,543 1,256 77,320
Total 2015-2019 61,181 7,627 842 5,876 8,735 1,507 85,768
Special Surveillance Report on Veterans Suicide 2015-2019
Page 13 of 30 Department of Health and Human Services | November 2020
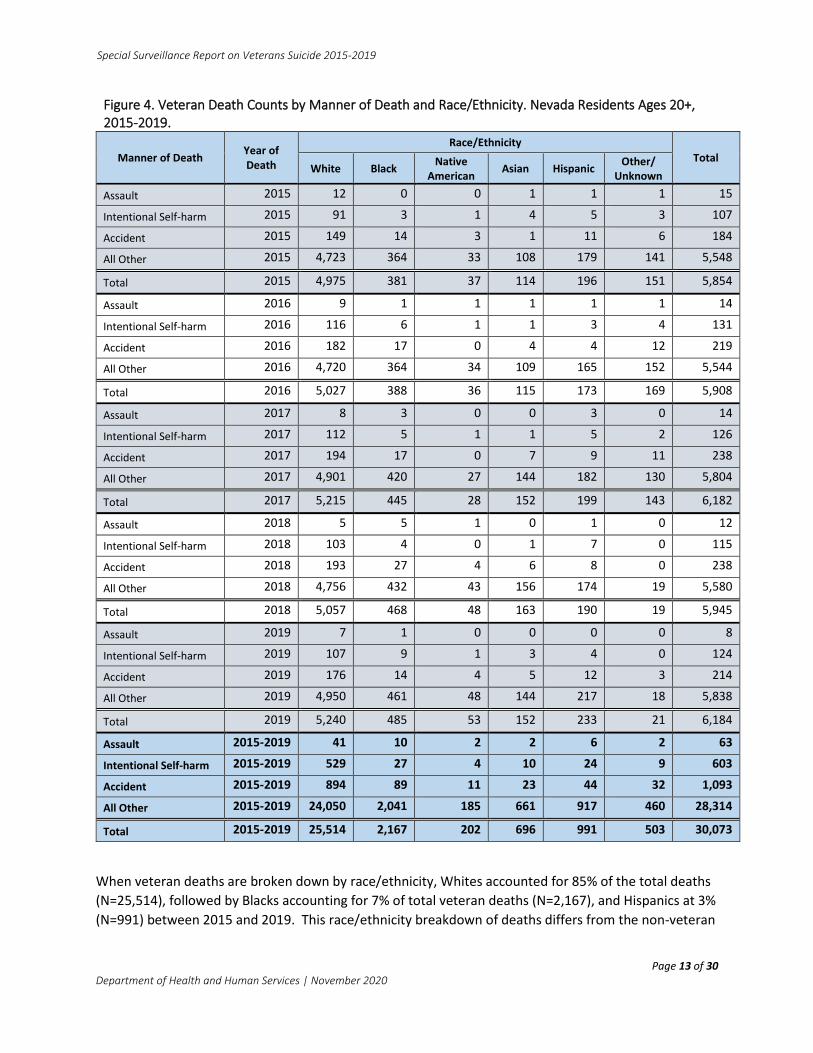
Figure 4. Veteran Death Counts by Manner of Death and Race/Ethnicity. Nevada Residents Ages 20+, 2015-2019.
Manner of Death Year of Death
Race/Ethnicity
Total White Black
Native American
Asian Hispanic Other/
Unknown
Assault 2015 12 0 0 1 1 1 15
Intentional Self-harm 2015 91 3 1 4 5 3 107
Accident 2015 149 14 3 1 11 6 184
All Other 2015 4,723 364 33 108 179 141 5,548
Total 2015 4,975 381 37 114 196 151 5,854
Assault 2016 9 1 1 1 1 1 14
Intentional Self-harm 2016 116 6 1 1 3 4 131
Accident 2016 182 17 0 4 4 12 219
All Other 2016 4,720 364 34 109 165 152 5,544
Total 2016 5,027 388 36 115 173 169 5,908
Assault 2017 8 3 0 0 3 0 14
Intentional Self-harm 2017 112 5 1 1 5 2 126
Accident 2017 194 17 0 7 9 11 238
All Other 2017 4,901 420 27 144 182 130 5,804
Total 2017 5,215 445 28 152 199 143 6,182
Assault 2018 5 5 1 0 1 0 12
Intentional Self-harm 2018 103 4 0 1 7 0 115
Accident 2018 193 27 4 6 8 0 238
All Other 2018 4,756 432 43 156 174 19 5,580
Total 2018 5,057 468 48 163 190 19 5,945
Assault 2019 7 1 0 0 0 0 8
Intentional Self-harm 2019 107 9 1 3 4 0 124
Accident 2019 176 14 4 5 12 3 214
All Other 2019 4,950 461 48 144 217 18 5,838
Total 2019 5,240 485 53 152 233 21 6,184
Assault 2015-2019 41 10 2 2 6 2 63
Intentional Self-harm 2015-2019 529 27 4 10 24 9 603
Accident 2015-2019 894 89 11 23 44 32 1,093
All Other 2015-2019 24,050 2,041 185 661 917 460 28,314
Total 2015-2019 25,514 2,167 202 696 991 503 30,073
When veteran deaths are broken down by race/ethnicity, Whites accounted for 85% of the total deaths
(N=25,514), followed by Blacks accounting for 7% of total veteran deaths (N=2,167), and Hispanics at 3%
(N=991) between 2015 and 2019. This race/ethnicity breakdown of deaths differs from the non-veteran
Special Surveillance Report on Veterans Suicide 2015-2019
Page 14 of 30 Department of Health and Human Services | November 2020
population, which Whites accounted for 71% of deaths, followed by Hispanics at 10% and Blacks at 9%
of deaths.
Among veteran suicides from 2015 to 2019, 88% were White, followed by 4% Black, 2% Asian, and 1%
Native American Race. The racial breakdown of non-veteran suicides is 74% White, 12% Hispanic, 6%
Asian, 5% Black, and 1% Native American.
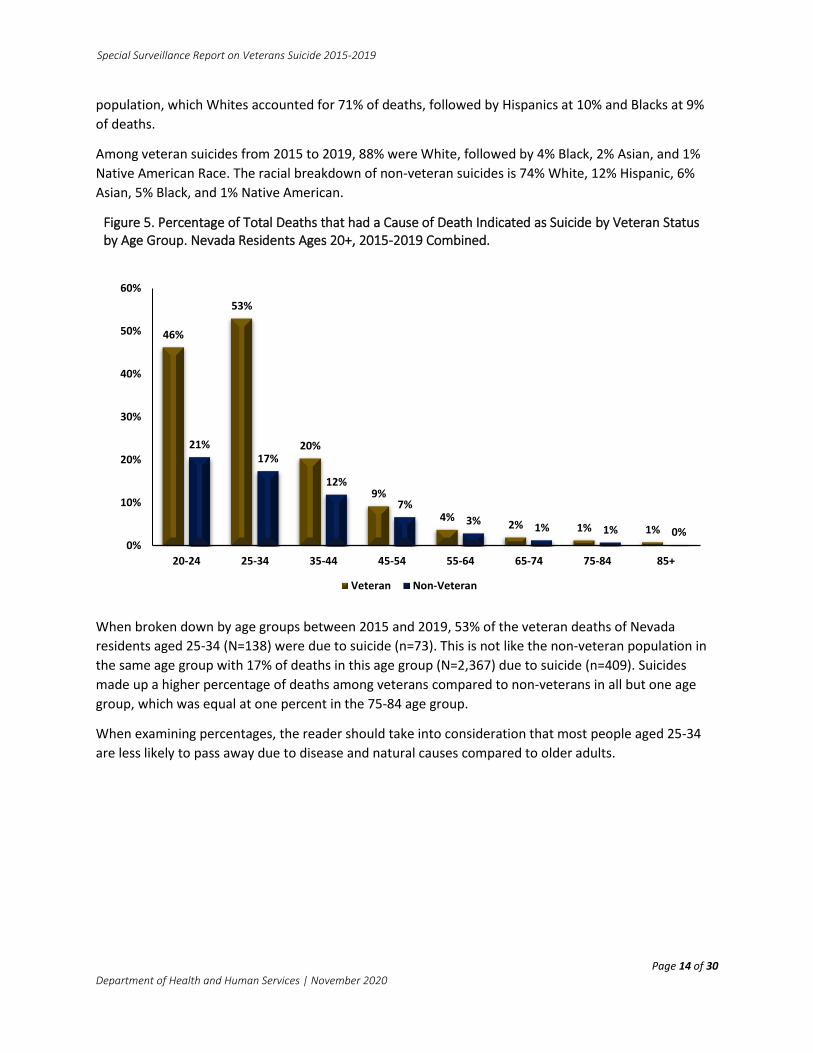
Figure 5. Percentage of Total Deaths that had a Cause of Death Indicated as Suicide by Veteran Status by Age Group. Nevada Residents Ages 20+, 2015-2019 Combined.
46%
53%
20%
9%
4%2% 1% 1%
21%17%
12%
7%
3%1% 1% 0%
0%
10%
20%
30%
40%
50%
60%
20-24 25-34 35-44 45-54 55-64 65-74 75-84 85+
Veteran Non-Veteran
When broken down by age groups between 2015 and 2019, 53% of the veteran deaths of Nevada
residents aged 25-34 (N=138) were due to suicide (n=73). This is not like the non-veteran population in
the same age group with 17% of deaths in this age group (N=2,367) due to suicide (n=409). Suicides
made up a higher percentage of deaths among veterans compared to non-veterans in all but one age
group, which was equal at one percent in the 75-84 age group.
When examining percentages, the reader should take into consideration that most people aged 25-34
are less likely to pass away due to disease and natural causes compared to older adults.

Special Surveillance Report on Veterans Suicide 2015-2019
Page 15 of 30 Department of Health and Human Services | November 2020
Figure 6. Total Count of Suicide-Related Deaths by Veteran Status and Age Group. Nevada Residents Ages 20+, 2015-2019.
Year of Death
Veteran Status
Age Group Total
20-24 25-34 35-44 45-54 55-64 65-74 75-84 85+
2015 Veteran 3 13 8 13 13 33 15 9 107
Non-Veteran 30 70 74 94 90 28 18 3 407
2016 Veteran 3 9 10 14 18 30 32 15 131
Non-Veteran 30 87 91 101 72 50 28 5 464
2017 Veteran 2 15 11 19 24 21 18 16 126
Non-Veteran 43 79 77 96 70 42 33 5 445
2018 Veteran 0 22 8 11 15 29 21 9 115
Non-Veteran 38 75 98 103 90 48 20 9 481
2019 Veteran 4 14 7 14 22 26 23 14 124
Non-Veteran 36 98 78 87 78 54 33 6 470
Total Veteran 12 73 44 71 92 139 109 63 603
Non-Veteran 177 409 418 481 400 222 132 28 2,267
Of the 115,841 deaths included within this report between 2015 and 2019, 2,870 died due to suicide,
and 603 (21%) of those suicide deaths were reported as having a veteran status. The highest number of
reported veteran suicides occurred in 2016 (N=131) with the lowest number reported the previous year
(N=107). From 2015 to 2019 there were no significant increases or decreases in the number of veteran
suicides in Nevada.
Figure 7. Counts of Suicide-Related Deaths by Year and Veteran Status. Nevada Residents Ages 20+, 2015-2019.
107 131 126 115 124
407
464 445
481 470
0
50
100
150
200
250
300
350
400
450
500
2015 2016 2017 2018 2019
Veteran Non-Veteran

Special Surveillance Report on Veterans Suicide 2015-2019
Page 16 of 30 Department of Health and Human Services | November 2020
Figure 8. Age Distribution of Suicide-Related Deaths by Veteran Status. Nevada Residents Aged 20+, 2015-2019 Combined.
2%
12%
7%
12%
15%
23%
18%
10%
8%
18% 18%
21%
18%
10%
6%
1%
0%
5%
10%
15%
20%
25%
30%
20-24 25-34 35-44 45-54 55-64 65-74 75-84 85+
Veteran Non-Veteran Veteran Non-Veteran
The trend shows an increase in non-veteran suicide deaths as age increases until the 45-54 age group,
followed by a steady decline. This is different in the veteran population, where suicide deaths increase
as age increases until the 65-74 age group before they start to decline. This demonstrates that veteran
suicides are skewed to an older population.
The differences in the age distributions between veteran and non-veteran suicides represented above
are likely due to the differences in the age distributions of those populations in general. Notice from
Figure 9 that veteran vs. non-veteran populations follow a similar distribution.
Figure 9. Age Distribution of Population by Veteran Status. Nevada Residents Ages 20+, 2015-2019 Combined.
1%
8%
10%
15%
19%
26%
14%
6%
9%
19% 18% 18%16%
12%
6%
2%
0%
5%
10%
15%
20%
25%
30%
20-24 25-34 35-44 45-54 55-64 65-74 75-84 85+
Veteran Non-Veteran
Special Surveillance Report on Veterans Suicide 2015-2019
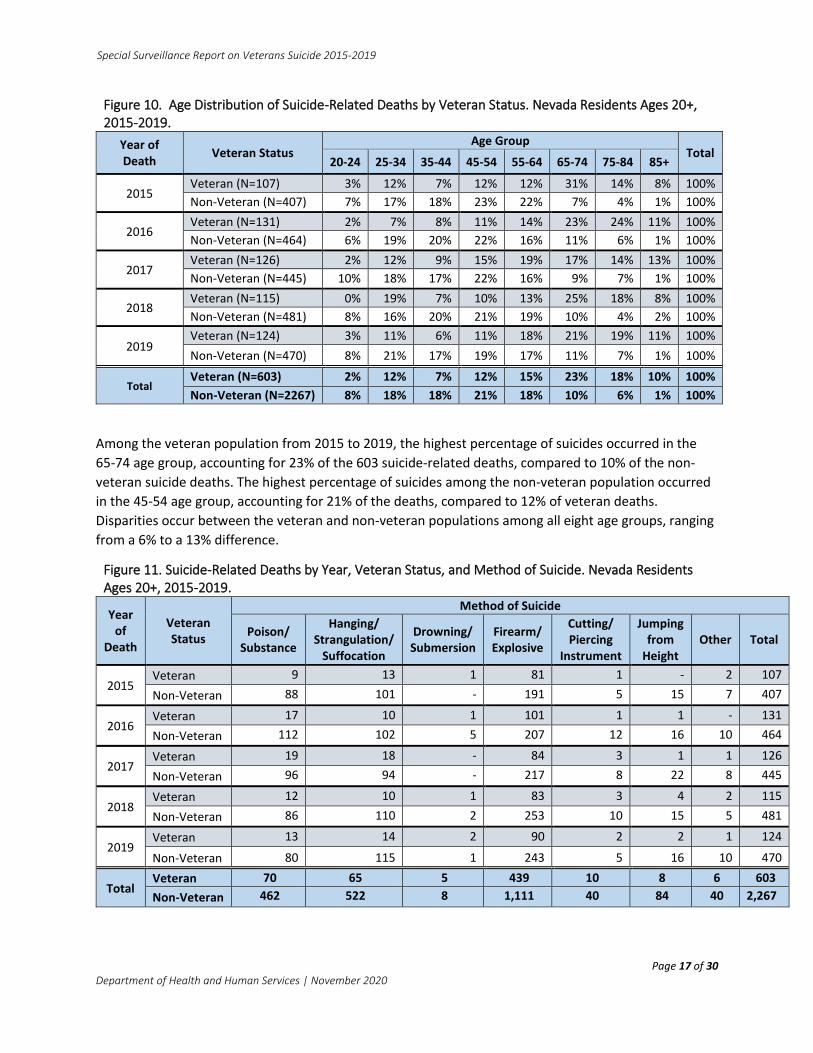
Figure 10. Age Distribution of Suicide-Related Deaths by Veteran Status. Nevada Residents Ages 20+, 2015-2019.
Year of Death
Veteran Status Age Group
Total 20-24 25-34 35-44 45-54 55-64 65-74 75-84 85+
2015 Veteran (N=107) 3% 12% 7% 12% 12% 31% 14% 8% 100%
Non-Veteran (N=407) 7% 17% 18% 23% 22% 7% 4% 1% 100%
2016 Veteran (N=131) 2% 7% 8% 11% 14% 23% 24% 11% 100%
Non-Veteran (N=464) 6% 19% 20% 22% 16% 11% 6% 1% 100%
2017 Veteran (N=126) 2% 12% 9% 15% 19% 17% 14% 13% 100%
Non-Veteran (N=445) 10% 18% 17% 22% 16% 9% 7% 1% 100%
2018 Veteran (N=115) 0% 19% 7% 10% 13% 25% 18% 8% 100%
Non-Veteran (N=481) 8% 16% 20% 21% 19% 10% 4% 2% 100%
2019 Veteran (N=124) 3% 11% 6% 11% 18% 21% 19% 11% 100%
Non-Veteran (N=470) 8% 21% 17% 19% 17% 11% 7% 1% 100%
Total Veteran (N=603) 2% 12% 7% 12% 15% 23% 18% 10% 100%
Non-Veteran (N=2267) 8% 18% 18% 21% 18% 10% 6% 1% 100%
Page 17 of 30 Department of Health and Human Services | November 2020
Among the veteran population from 2015 to 2019, the highest percentage of suicides occurred in the
65-74 age group, accounting for 23% of the 603 suicide-related deaths, compared to 10% of the non-
veteran suicide deaths. The highest percentage of suicides among the non-veteran population occurred
in the 45-54 age group, accounting for 21% of the deaths, compared to 12% of veteran deaths.
Disparities occur between the veteran and non-veteran populations among all eight age groups, ranging
from a 6% to a 13% difference.
Figure 11. Suicide-Related Deaths by Year, Veteran Status, and Method of Suicide. Nevada Residents Ages 20+, 2015-2019.
Year of
Death
Veteran Status
Method of Suicide
Poison/ Substance
Hanging/ Strangulation/
Suffocation
Drowning/ Submersion
Firearm/ Explosive
Cutting/ Piercing
Instrument
Jumping from
Height Other Total
2015 Veteran 9 13 1 81 1 - 2 107
Non-Veteran 88 101 - 191 5 15 7 407
2016 Veteran 17 10 1 101 1 1 - 131
Non-Veteran 112 102 5 207 12 16 10 464
2017 Veteran 19 18 - 84 3 1 1 126
Non-Veteran 96 94 - 217 8 22 8 445
2018 Veteran 12 10 1 83 3 4 2 115
Non-Veteran 86 110 2 253 10 15 5 481
2019 Veteran 13 14 2 90 2 2 1 124
Non-Veteran 80 115 1 243 5 16 10 470
Total Veteran 70 65 5 439 10 8 6 603
Non-Veteran 462 522 8 1,111 40 84 40 2,267

Special Surveillance Report on Veterans Suicide 2015-2019
Page 18 of 30 Department of Health and Human Services | November 2020
Figure 12. Percent of Non-Veteran Suicide-Related Deaths by Method and Sex. Nevada Residents Ages 20+, 2015-2019 Combined.
2%
4%
2%
55%
0%
25%
12%
1%
3%
1%
34%
1%
20%
40%
0% 10% 20% 30% 40% 50% 60%
Others
Jumped from Height
Cutting/Stabbing
Firearms/Explosives
Drowning/Submersion
Hanging/Strangulation/Suffocation
Substances
Female Male
Figure 13. Percent of Veteran Suicide-Related Deaths by Method and Sex. Nevada Residents Ages 20+, 2015-2019 Combined.
1%
1%
2%
74%
1%
11%
10%
0%
0%
0%
55%
0%
13%
32%
0% 10% 20% 30% 40% 50% 60% 70% 80%
Others
Jumped from Height
Cutting/Stabbing
Firearms/Explosives
Drowning/Submersion
Hanging/Strangulation/Suffocation
Substances
Female Male
Among the male population, 74% of the veteran suicides committed were by firearm/explosive,
compared to approximately half of non-veteran suicides (55%). Among the female population, the
greatest difference in method was firearms/explosives, which accounted for 55% of veteran suicide
deaths and 34% of non-veteran suicide deaths.

Special Surveillance Report on Veterans Suicide 2015-2019
Page 19 of 30 Department of Health and Human Services | November 2020
Figure 14. Suicide Age-Adjusted Rates (per 100,000) by Year and Veteran Status. Nevada Residents Ages 20+, 2015-2019.
51.255.4
61.5
52.8
60.2
21.624.0 24.0 23.9 22.9
0.0
10.0
20.0
30.0
40.0
50.0
60.0
70.0
2015 2016 2017 2018 2019
Veteran Non-Veteran
Veteran suicide rates (per 100,000) have varied between 2015 and 2019 with a peak rate of 61.5 per
100,000 veteran population in 2017 compared to the lowest rate of 51.2 per 100,000 veteran
population in 2015. This contrasts with the rate per 100,000 of non-veteran suicides, with rates
continually between 21.6 and 24.0 per 100,000 non-veterans. These rates demonstrate a significant
increased risk for a veteran to complete suicide compared to the non-veteran population of Nevada
residents.
Complete tables of counts, crude rates, age-adjusted rates and confidence intervals for each year from
2015 to 2019 can be viewed in the appendices.
Special Surveillance Report on Veterans Suicide 2015-2019
Page 20 of 30 Department of Health and Human Services | November 2020
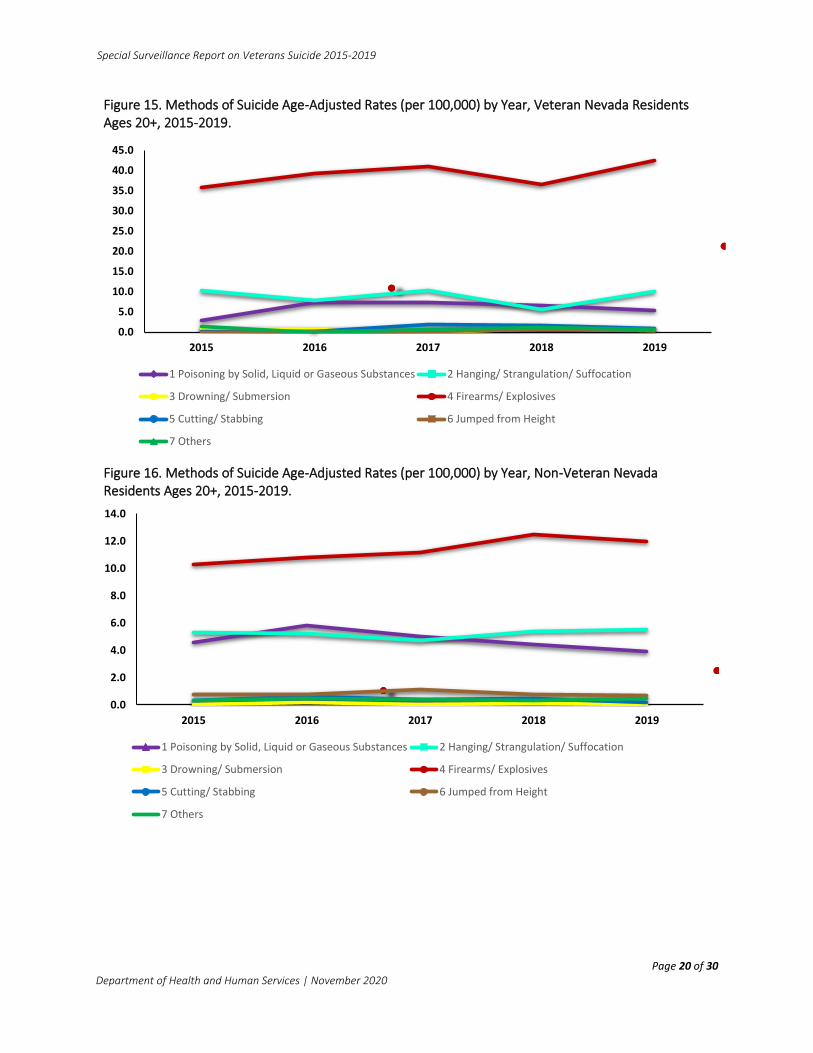
Figure 15. Methods of Suicide Age-Adjusted Rates (per 100,000) by Year, Veteran Nevada Residents Ages 20+, 2015-2019.
0.0
5.0
10.0
15.0
20.0
25.0
30.0
35.0
40.0
45.0
2015 2016 2017 2018 2019
1 Poisoning by Solid, Liquid or Gaseous Substances 2 Hanging/ Strangulation/ Suffocation
3 Drowning/ Submersion 4 Firearms/ Explosives
5 Cutting/ Stabbing 6 Jumped from Height
7 Others
Figure 16. Methods of Suicide Age-Adjusted Rates (per 100,000) by Year, Non-Veteran Nevada Residents Ages 20+, 2015-2019.
0.0
2.0
4.0
6.0
8.0
10.0
12.0
14.0
2015 2016 2017 2018 2019
1 Poisoning by Solid, Liquid or Gaseous Substances 2 Hanging/ Strangulation/ Suffocation
3 Drowning/ Submersion 4 Firearms/ Explosives
5 Cutting/ Stabbing 6 Jumped from Height
7 Others
Special Surveillance Report on Veterans Suicide 2015-2019
Page 21 of 30 Department of Health and Human Services | November 2020
Figure 17. Firearms/Explosives as the Method of Suicide, Age-Adjusted Rates (per 100,000) by Year and Veteran Status. Nevada Residents Ages 20+, 2015-2019.
35.8
39.341.1
36.5
42.5
10.3 10.8 11.212.5 12.0
0.0
5.0
10.0
15.0
20.0
25.0
30.0
35.0
40.0
45.0
2015 2016 2017 2018 2019
Veteran Non-Veteran
The rates (per 100,000) at which firearms/explosives were used as the method of suicide was greater in
the veteran population compared to non-veteran population in all years from 2015 to 2019. The
veteran suicide rate by firearms/explosives varied from a low of 35.8 in 2015 to a high of 42.5 in 2019.
The rate of suicide by firearms/explosives in the non-veteran community was consistent from 2015 to
2019, varying in a range from 10.3 to 12.5. Of the 603 veteran suicides between 2015 and 2019, 73%
(N=439) had a reported method of suicide as firearms/explosions. When broken down by gender a
firearm was the method of suicide in 77% of veteran suicides completed by males (N=422), and 55% of
females (N=17).
Special Surveillance Report on Veterans Suicide 2015-2019
Page 22 of 30 Department of Health and Human Services | November 2020
Suicide-Related Hospitalizations
TRICARE and Civilian Health and Medical Program of the Department of Veteran's Affairs (CHAMPVA), are health care benefits programs in which the Department of Defense and Department of Veteran’s Affairs, respectively, share the cost of health care services. Because service members’ families are covered by these two programs and veteran status is not identified in the billing data, the term “military community” is used in this report to distinguish the veteran population from the non-veteran population. The veteran population in the suicide-related emergency department visits and inpatient admissions section includes any individual that is covered through TRICARE and CHAMPVA, including spouses and dependents of military members.
In the military community, there were 233 emergency department visits and 244 inpatient admissions
related to suicide in 2015-2019 combined. Of the 233 visits, four individuals died, and 100 were
discharged, transferred, left against medical advice, entered hospice, or admitted as an inpatient. Of the
244 inpatient admissions, four individuals died, and 175 admissions were discharged, transferred,
entered hospice, or left against medical advice.
In the non-military community there were 12,256 emergency department visits and 6,767 inpatient
admissions related to suicide in 2015 to 2019 combined. Of the 12,256 visits, 81 individuals died, and
6,677 visits were discharged, transferred, left against medical advice, entered hospice, or admitted as an
inpatient. Of the 6,767 admissions, 145 individuals died, and 3,904 admissions were discharged,
transferred, entered hospice, or left against medical advice.
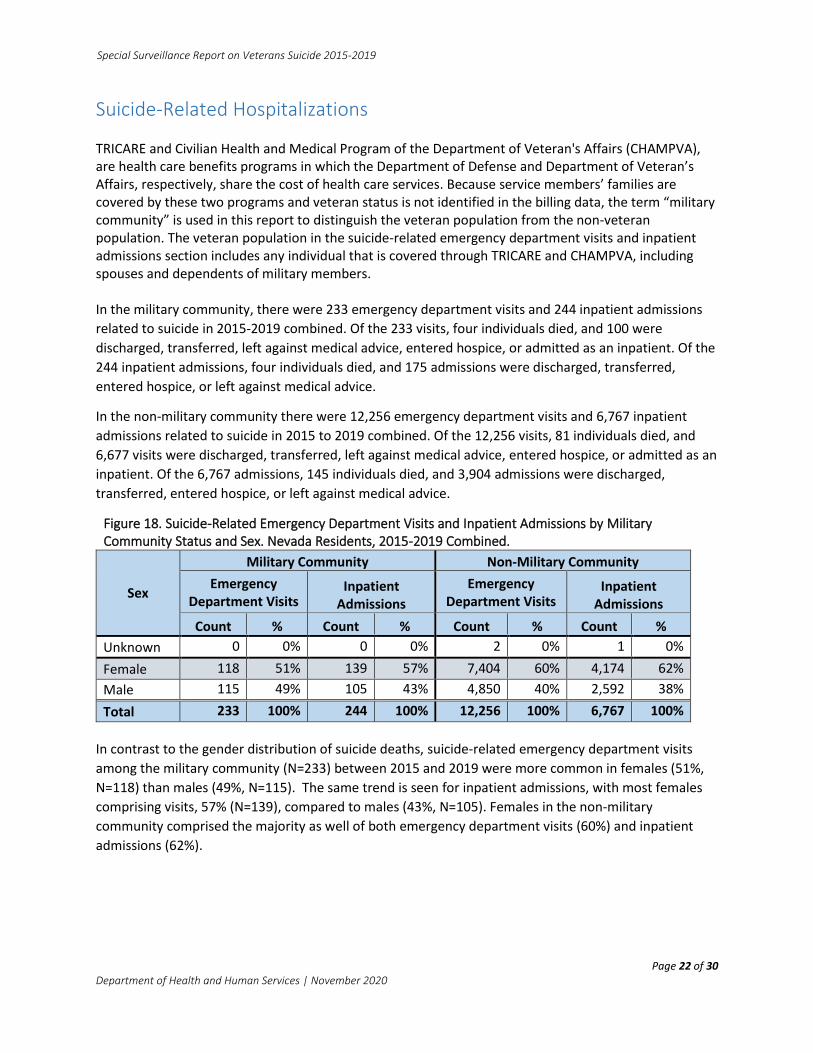
Figure 18. Suicide-Related Emergency Department Visits and Inpatient Admissions by Military Community Status and Sex. Nevada Residents, 2015-2019 Combined.
Sex
Military Community Non-Military Community
Emergency Department Visits
Inpatient Admissions
Emergency Department Visits
Inpatient Admissions
Count % Count % Count % Count %
Unknown 0 0% 0 0% 2 0% 1 0%
Female 118 51% 139 57% 7,404 60% 4,174 62%
Male 115 49% 105 43% 4,850 40% 2,592 38%
Total 233 100% 244 100% 12,256 100% 6,767 100%
In contrast to the gender distribution of suicide deaths, suicide-related emergency department visits
among the military community (N=233) between 2015 and 2019 were more common in females (51%,
N=118) than males (49%, N=115). The same trend is seen for inpatient admissions, with most females
comprising visits, 57% (N=139), compared to males (43%, N=105). Females in the non-military
community comprised the majority as well of both emergency department visits (60%) and inpatient
admissions (62%).

Special Surveillance Report on Veterans Suicide 2015-2019
Page 23 of 30 Department of Health and Human Services | November 2020
Figure 19. Suicide-Related Emergency Department Visits and Inpatient Admissions by Military Community Status and Age-Group. Nevada Residents, 2015-2019 Combined.
Age Group
Military Community Non-Military Community
Emergency Department Visits
Inpatient Admissions
Emergency Department Visits
Inpatient Admissions
Count % Count % Count % Count %
Unknown 0 0% 0 0% 10 0% 0 0%
5-14 16 7% 24 10% 915 7% 383 6%
15-24 78 33% 88 36% 4,036 33% 1,510 22%
25-34 42 18% 33 14% 2,702 22% 1,110 16%
35-44 32 14% 22 9% 1,912 16% 1,132 17%
45-54 24 10% 28 11% 1,495 12% 1,115 16%
55-64 31 13% 35 14% 799 7% 873 13%
65-74 6 3% 9 4% 266 2% 417 6%
75-84 3 1% 2 1% 88 1% 168 2%
85+ 1 0% 3 1% 33 0% 59 1%
Total 233 100% 244 100% 12,256 100% 6,767 100%
The 15-24 age-group had the highest number of inpatient admissions and emergency department visits
between 2015 and 2019 in both communities and categories of hospitalizations. It is important to note
that the individuals in the military community included in Figure 19 may include spouses and
dependents of military members, as well as veterans, and may not be comparable to the suicide death
data. It is unclear if the released patients received mental and behavioral health services after the
attempts.
Special Surveillance Report on Veterans Suicide 2015-2019
Page 24 of 30 Department of Health and Human Services | November 2020
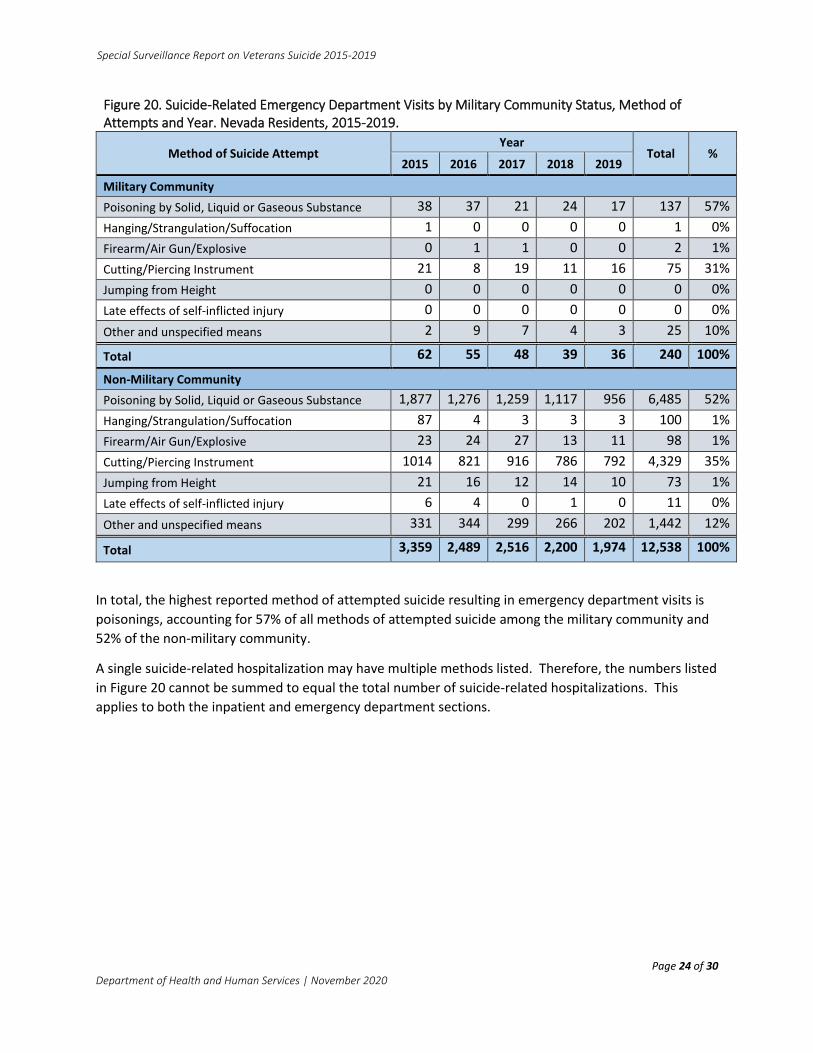
Figure 20. Suicide-Related Emergency Department Visits by Military Community Status, Method of Attempts and Year. Nevada Residents, 2015-2019.
Method of Suicide Attempt Year
Total % 2015 2016 2017 2018 2019
Military Community
Poisoning by Solid, Liquid or Gaseous Substance 38 37 21 24 17 137 57%
Hanging/Strangulation/Suffocation 1 0 0 0 0 1 0%
Firearm/Air Gun/Explosive 0 1 1 0 0 2 1%
Cutting/Piercing Instrument 21 8 19 11 16 75 31%
Jumping from Height 0 0 0 0 0 0 0%
Late effects of self-inflicted injury 0 0 0 0 0 0 0%
Other and unspecified means 2 9 7 4 3 25 10%
Total 62 55 48 39 36 240 100%
Non-Military Community
Poisoning by Solid, Liquid or Gaseous Substance 1,877 1,276 1,259 1,117 956 6,485 52%
Hanging/Strangulation/Suffocation 87 4 3 3 3 100 1%
Firearm/Air Gun/Explosive 23 24 27 13 11 98 1%
Cutting/Piercing Instrument 1014 821 916 786 792 4,329 35%
Jumping from Height 21 16 12 14 10 73 1%
Late effects of self-inflicted injury 6 4 0 1 0 11 0%
Other and unspecified means 331 344 299 266 202 1,442 12%
Total 3,359 2,489 2,516 2,200 1,974 12,538 100%
In total, the highest reported method of attempted suicide resulting in emergency department visits is
poisonings, accounting for 57% of all methods of attempted suicide among the military community and
52% of the non-military community.
A single suicide-related hospitalization may have multiple methods listed. Therefore, the numbers listed
in Figure 20 cannot be summed to equal the total number of suicide-related hospitalizations. This
applies to both the inpatient and emergency department sections.
Special Surveillance Report on Veterans Suicide 2015-2019
Page 25 of 30 Department of Health and Human Services | November 2020
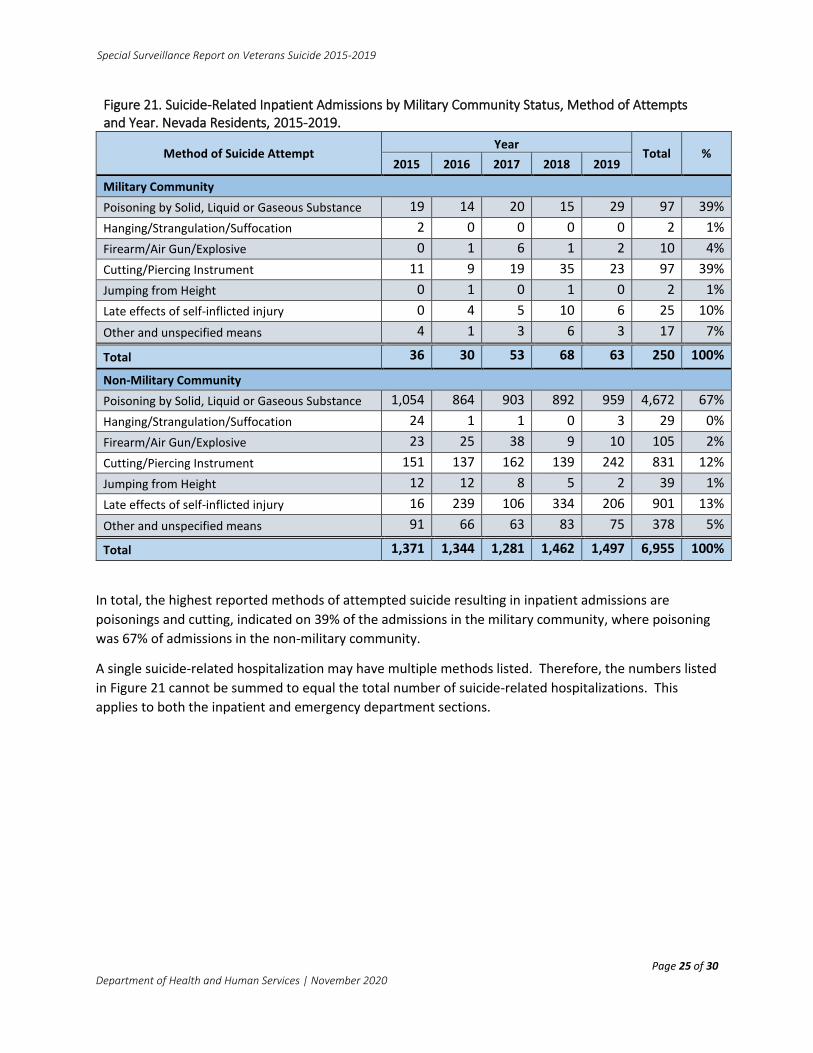
Figure 21. Suicide-Related Inpatient Admissions by Military Community Status, Method of Attempts and Year. Nevada Residents, 2015-2019.
Method of Suicide Attempt Year
Total % 2015 2016 2017 2018 2019
Military Community
Poisoning by Solid, Liquid or Gaseous Substance 19 14 20 15 29 97 39%
Hanging/Strangulation/Suffocation 2 0 0 0 0 2 1%
Firearm/Air Gun/Explosive 0 1 6 1 2 10 4%
Cutting/Piercing Instrument 11 9 19 35 23 97 39%
Jumping from Height 0 1 0 1 0 2 1%
Late effects of self-inflicted injury 0 4 5 10 6 25 10%
Other and unspecified means 4 1 3 6 3 17 7%
Total 36 30 53 68 63 250 100%
Non-Military Community
Poisoning by Solid, Liquid or Gaseous Substance 1,054 864 903 892 959 4,672 67%
Hanging/Strangulation/Suffocation 24 1 1 0 3 29 0%
Firearm/Air Gun/Explosive 23 25 38 9 10 105 2%
Cutting/Piercing Instrument 151 137 162 139 242 831 12%
Jumping from Height 12 12 8 5 2 39 1%
Late effects of self-inflicted injury 16 239 106 334 206 901 13%
Other and unspecified means 91 66 63 83 75 378 5%
Total 1,371 1,344 1,281 1,462 1,497 6,955 100%
In total, the highest reported methods of attempted suicide resulting in inpatient admissions are
poisonings and cutting, indicated on 39% of the admissions in the military community, where poisoning
was 67% of admissions in the non-military community.
A single suicide-related hospitalization may have multiple methods listed. Therefore, the numbers listed
in Figure 21 cannot be summed to equal the total number of suicide-related hospitalizations. This
applies to both the inpatient and emergency department sections.

Page 26 of 30 Department of Health and Human Services | November 2020
Special Surveillance Report on Veterans Suicide 2015-2019
Behavioral Risk Factor Surveillance System (BRFSS)
The BRFSS inquires on each participant’s veteran status. Between 2015 and 2019, BRFSS participants were asked “During the past 12 months have you ever seriously considered attempting suicide?” Survey results are limited and are not available for further break down beyond what is provided below.
Figure 22. Percentage who Reported Suicide Ideology by Veteran Status and Year. Nevada Residents, 2015-2019.
Survey Year Veteran Status Percent Reported Suicide Ideation in
Last 12 months Confidence Interval
2015 Veteran 2% (0.1% - 3.1%)
Non-Veteran 2% (1.4% - 2.8%)
2016 Veteran 2% (0.5%-3.2%)
Non-Veteran 4% (2.8%-4.8%)
2017 Veteran 2% (0.0%-3.7%)
Non-Veteran 3% (2.3%-4.5%)
2018 Veteran 3% (1.1%-4.9%)
Non-Veteran 3% (2.3%-4.6%)
2019 Veteran 5% (1.9%-8.7%)
Non-Veteran 5% (3.4%-6.1%)
Regarding percentage of participants who reported seriously considering attempting suicide during the
past 12 months of taking the BRFSS survey, there is not a notable disparity between veteran and non-
veteran populations.
Special Surveillance Report on Veterans Suicide 2015-2019
Page 27 of 30 Department of Health and Human Services | November 2020
Conclusion
This report demonstrates the need for continued monitoring of veteran and military deaths and
continued efforts of prevention for this population. The rates of suicide among the veteran population
fluctuates from year to year but overall remains more than double the rate of the non-veteran
community.
The aging veteran population of Nevada residents seems in particular risk.
There is a demonstrated access to firearms and use of firearms as lethal means within the veteran
population not demonstrated in the non-veteran population when it comes to method of suicide
resulting in suicide deaths.
Efforts to prevent drug overdose and poisonings could assist in lowering the number of hospitalizations
due to suicide attempts. Wrap around services for veterans and military families are needed to ensure
identification of suicide ideology. If suicide ideology is discovered and addressed, this could prevent
more members of the military community from attempting or taking their lives.
Appendix
Figure A1. Age-Adjusted weights
Age Group Weight
Age20_24_WEIGHT 0.095734399
Age25_29_WEIGHT 0.093587182
Age30_34_WEIGHT 0.088532365
Age35_39_WEIGHT 0.089497173
Age40_44_WEIGHT 0.092651902
Age45_49_WEIGHT 0.10071312
Age50_54_WEIGHT 0.098892694
Age55_59_WEIGHT 0.087213859
Age60_64_WEIGHT 0.074587877
Age65_69_WEIGHT 0.055150675
Age70_74_WEIGHT 0.041148878
Age75_79_WEIGHT 0.032454588
Age80_84_WEIGHT 0.025471786
Age85_WEIGHT 0.024363501

Figure A2. Total Counts and Rates (per 100,000) by Method of Suicide and Veteran Status. Nevada Residents Ages 20+, 2015.
Figure A3. Total Counts and Rates (per 100,000) by Method of Suicide and Veteran Status. Nevada Residents Ages 20+, 2016.
Veteran Non-Veteran
Poisoning by Solid, Liquid or Gaseous Substances 9 88 4 (1.4-6.6) 4.1 (3.3-5.0) 2.8 (1.0-4.6) 4.6 (3.7-5.6)
Hanging/Strangulation/Suffocation 13 101 5.8 (2.6-8.9) 4.8 (3.8-5.7) 10.2 (4.7-15.8) 5.3 (4.2-6.3)
Drowning/Submersion 1 0 0.4 (0.0-1.3) 0 (0.0-0.0) 0.8 (0.0-2.4) 0 (0.0-0.0)
Firearm/Airgun/Explosive 81 191 35.9 (28.1-43.8) 9 (7.7-10.3) 35.8 (28.0-43.6) 10.3 (8.9-11.8)
Cutting/Piercing Instrument 1 5 0.4 (0.0-1.3) 0.2 (0.0-0.4) 0.2 (0.0-0.5) 0.3 (0.0-0.5)
Jumping from Height 0 15 0 (0.0-0.0) 0.7 (0.3-1.1) 0 (0.0-0.0) 0.8 (0.4-1.1)
Others 2 7 0.9 (0.0-2.1) 0.3 (0.1-0.6) 1.4 (0.0-3.3) 0.3 (0.1-0.6)
Total 107 407 47.5 (38.5-56.5) 19.2 (17.3-21.0) 51.2 (41.5-60.9) 21.6 (19.5-23.7)
Age-
Adjusted
Rate
C.I.
2015
Method of Suicide
Veteran Non-Veteran Veteran Non-Veteran
Count Crude Rate C.I. Crude Rate C.I.
Age-
Adjusted
Rate
C.I.
Veteran Non-Veteran
Poisoning by Solid, Liquid or Gaseous Substances 9 112 4.1 (1.4-6.7) 5.2 (4.2-6.1) 2.9 (1.0-4.7) 5.8 (4.8-6.9)
Hanging/Strangulation/Suffocation 13 102 5.9 (2.7-9.0) 4.7 (3.8-5.6) 10.2 (4.7-15.8) 5.2 (4.2-6.2)
Drowning/Submersion 1 5 0.5 (0.0-1.3) 0.2 (0.0-0.4) 0.8 (0.0-2.4) 0.2 (0.0-0.5)
Firearm/Airgun/Explosive 81 207 36.5 (28.5-44.4) 9.5 (8.2-10.8) 36.1 (28.2-43.9) 10.8 (9.4-12.3)
Cutting/Piercing Instrument 1 12 0.5 (0.0-1.3) 0.6 (0.2-0.9) 0.2 (0.0-0.5) 0.6 (0.3-0.9)
Jumping from Height 0 16 0 (0.0-0.0) 0.7 (0.4-1.1) 0 (0.0-0.0) 0.8 (0.4-1.3)
Others 2 10 0.9 (0.0-2.1) 0.5 (0.2-0.7) 1.4 (0.0-3.3) 0.5 (0.2-0.8)
Total 131 464 59 (48.9-69.1) 21.4 (19.5-23.3) 55.4 (45.9-64.9) 24 (21.8-26.2)
Age-
Adjusted
Rate
C.I.
2016
Method of Suicide
Veteran Non-Veteran Veteran Non-Veteran
Count Crude Rate C.I. Crude Rate C.I.
Age-
Adjusted
Rate
C.I.
Page 28 of 30

Special Surveillance Report on Veterans Suicide 2015-2019
Page 29 of 30 Department of Health and Human Services | November 2020
Figure A4. Total Counts and Rates (per 100,000) by Method of Suicide and Veteran Status. Nevada Residents Ages 20+, 2017.
Figure A5. Total Counts and Rates (per 100,000) by Method of Suicide and Veteran Status. Nevada Residents Ages 20+, 2018.
Veteran Non-Veteran
Poisoning by Solid, Liquid or Gaseous Substances 19 96 8.7 (4.8-12.6) 4.4 (3.5-5.2) 7.4 (4.1-10.7) 5 (4.0-6.0)
Hanging/Strangulation/Suffocation 18 94 8.2 (4.4-12.0) 4.3 (3.4-5.1) 10.4 (5.6-15.2) 4.7 (3.7-5.6)
Drowning/Submersion 0 0 0 (0.0-0.0) 0 (0.0-0.0) 0 (0.0-0.0) 0 (0.0-0.0)
Firearm/Airgun/Explosive 84 217 38.5 (30.2-46.7) 9.9 (8.6-11.2) 41.1 (32.3-49.9) 11.2 (9.7-12.7)
Cutting/Piercing Instrument 3 8 1.4 (0.0-2.9) 0.4 (0.1-0.6) 1.8 (0.0-3.9) 0.4 (0.1-0.7)
Jumping from Height 1 22 0.5 (0.0-1.4) 1 (0.6-1.4) 0.2 (0.0-0.5) 1.1 (0.6-1.5)
Others 1 8 0.5 (0.0-1.4) 0.4 (0.1-0.6) 0.6 (0.0-1.9) 0.4 (0.1-0.7)
Total 126 445 57.7 (47.6-67.8) 20.3 (18.4-22.1) 61.5 (50.8-72.2) 22.8 (20.6-24.9)
Age-
Adjusted
Rate
C.I.
2017
Method of Suicide
Veteran Non-Veteran Veteran Non-Veteran
Count Crude Rate C.I. Crude Rate C.I.
Age-
Adjusted
Rate
C.I.
Veteran Non-Veteran
1 Poisoning by Solid, Liquid or Gaseous Substances 12 86 5.6 (2.4-8.8) 3.8 (3-4.6) 6.6 (2.8-10.3) 4.4 (3.4-5.3)
2 Hanging/ Strangulation/ Suffocation 10 110 4.7 (1.8-7.5) 4.9 (4-5.8) 5.5 (2.1-8.9) 5.4 (4.4-6.4)
3 Drowning/ Submersion 1 2 0.5 (0-1.4) 0.1 (0-0.2) 0.8 (0-2.4) 0.1 (0-0.2)
4 Firearms/ Explosives 83 253 38.7 (30.4-47) 11.2 (9.8-12.6) 36.5 (28.6-44.3) 12.5 (11-14.1)
5 Cutting/ Stabbing 3 10 1.4 (0-3) 0.4 (0.2-0.7) 1.6 (0-3.4) 0.5 (0.2-0.8)
6 Jumped from Height 4 15 1.9 (0-3.7) 0.7 (0.3-1) 0.7 (0-1.4) 0.8 (0.4-1.2)
7 Others 2 5 0.9 (0-2.2) 0.2 (0-0.4) 1.2 (0-2.9) 0.3 (0-0.5)
Total 115 481 53.6 (43.8-63.4) 21.3 (19.4-23.3) 52.8 (43.2-62.5) 23.9 (21.8-26)
2018
Veteran Non-Veteran Veteran Non-Veteran
Method of Suicide Count Crude Rate C.I. Crude Rate C.I.
Age-
Adjusted
Rate
C.I.
Age-
Adjusted
Rate
C.I.
Special Surveillance Report on Veterans Suicide 2015-2019
Page 30 of 30 Department of Health and Human Services | November 2020
Figure A6. Total Counts and Rates (per 100,000) by Method of Suicide and Veteran Status. Nevada Residents Ages 20+, 2019.
Figure A7. Nevada Veterans Health Survey 2020, Question 18.
Q18 – Have you been diagnosed with a service-connected disability or disease, including presumptive condition(s)?
Response Percent
Yes 53.49%
No 46.51%
Total 100%
Veteran Non-Veteran
1 Poisoning by Solid, Liquid or Gaseous Substances 13 80 5.8 (2.6-8.9) 3.5 (2.7-4.3) 5.4 (2.5-8.3) 3.9 (3-4.7)
2 Hanging/ Strangulation/ Suffocation 14 115 6.2 (3-9.5) 5 (4.1-5.9) 10.1 (4.8-15.3) 5.5 (4.5-6.5)
3 Drowning/ Submersion 2 1 0.9 (0-2.1) 0 (0-0.1) 0.4 (0-0.9) 0 (0-0.1)
4 Firearms/ Explosives 90 243 40 (31.7-48.2) 10.6 (9.3-11.9) 42.5 (33.8-51.3) 12 (10.5-13.5)
5 Cutting/ Stabbing 2 5 0.9 (0-2.1) 0.2 (0-0.4) 0.8 (0-1.9) 0.2 (0-0.5)
6 Jumped from Height 2 16 0.9 (0-2.1) 0.7 (0.4-1) 0.3 (0-0.8) 0.7 (0.4-1.1)
7 Others 1 10 0.4 (0-1.3) 0.4 (0.2-0.7) 0.7 (0-2.1) 0.5 (0.2-0.7)
Total 124 470 55.1 (45.4-64.8) 20.5 (18.7-22.4) 60.2 (49.6-70.8) 22.9 (20.8-24.9)
2019
Veteran Non-Veteran Veteran Non-Veteran
Method of Suicide Count Crude Rate C.I. Crude Rate C.I.
Age-
Adjusted
Rate
C.I.
Age-
Adjusted
Rate
C.I.


![Web Accessibility Guidelines · Web accessibility aims to help people with disabilities to perceive, understand, navigate, in-teract with, and contribute to the Web [38,44]. The importance](https://static.fdocuments.in/doc/165x107/5f9291ad66270777307f4df7/web-accessibility-guidelines-web-accessibility-aims-to-help-people-with-disabilities.jpg)
