Access to livelihood capitals and propensity for entrepreneurship amongst rice …€¦ · ·...
11
Mumuni and Oladele Agric & Food Secur (2016) 5:1 DOI 10.1186/s40066-015-0049-x RESEARCH Access to livelihood capitals and propensity for entrepreneurship amongst rice farmers in Ghana Eliasu Mumuni * and Oladimeji Idowu Oladele Abstract Background: This paper examines rice farmers’ access to livelihood capitals (natural, financial, physical, social and human) and the relationship and propensity for entrepreneurship capacities amongst rice farmers in the northern and Ashanti regions of Ghana. A simple random and purposive sampling method was used to select a sample size of 301 rice farmers in the two regions. A structured questionnaire was used in conducting the study. The data was analysed with IBM SPSS version 21 using frequencies, percentages, means and standard deviation. Wilcoxon sign rank test, paired t test and Pearson correlation coefficient were also used for the analysis on the access to livelihoods, significance and relationship to entrepreneurial activities of the farmers. Results: Farmers’ access to natural capitals was stronger. Similarly, the Wilcoxon sign rank test and test statistics for the physical capital also revealed a significant difference in the farmers’ physical capitals with all the measured variables including irrigation infrastructure (z = −5.581; p = 0.000), processing facilities (z = −5.904; p = 0.000), and market access (z = −6.171; p = 0.000), after been exposed to the technology interventions. The test statistics shows significant difference in all the measured variables with the p value (p > 0.05) for the human capitals of the farmers. It also showed that farmers’ credit from family and friends, access to bank loans and loans from farmer groups all increased from 47 to 52 %; 26 to 37 % and 28 to 78 %, respectively. Generally farmers’ access to all the five livelihood capitals was significant and higher. On the access to livelihood capitals and its entrepreneurial abilities, natural capitals before (t = 1.789, p = 0.074), natural livelihood after (t = 1.664, p = 0.096), social capital after (t = 1.838, p = 0.066), and physical capital before (t = 2.87, p = 0.004) showed a significantly positive relationship with their entrepreneurial capacities. Conclusions: The study revealed that farmers’ access to stronger livelihood capitals improves on their internal locus of control, improves their farming management abilities and ultimately boosts their agricultural entrepreneurial capa- bilities. The study recommends that farmers should leverage on their human capitals (farming skills taught them) to improving on all other livelihood capitals for better business sense and culture and entrepreneurial skills. Keywords: Livelihood capitals, Farmers, Rice, Entrepreneurship, Agriculture, Ghana © 2016 Mumuni and Oladele. This article is distributed under the terms of the Creative Commons Attribution 4.0 International License (http://creativecommons.org/licenses/by/4.0/), which permits unrestricted use, distribution, and reproduction in any medium, provided you give appropriate credit to the original author(s) and the source, provide a link to the Creative Commons license, and indicate if changes were made. The Creative Commons Public Domain Dedication waiver (http://creativecommons. org/publicdomain/zero/1.0/) applies to the data made available in this article, unless otherwise stated. Background Agriculture is a greater contributor to poverty through jobs creation, food security and availability to world economies [1, 2]. Approximately 1.5 billion people are engaged in smallholder agriculture across the world. ey include 75 % of the world’s poorest people, whose food, income and livelihood prospects depend on agri- culture [3]. It is undoubtedly seen as a bigger contribu- tor to reducing poverty in a mass form than any other intervention according to [1]. By 2050, Africa’s popula- tion will be 1.7 billion people [4] putting an overwhelm- ing pressure on agriculture to feed the people and create jobs. ese jobs will not only come from primary pro- duction of crop commodities and livestock, but through Open Access Agriculture & Food Security *Correspondence: [email protected]; [email protected] Department of Agricultural Economics and Extension, North West University, Mafikeng Campus, Private Bag X2046, Mmabatho 2735, South Africa
Transcript of Access to livelihood capitals and propensity for entrepreneurship amongst rice …€¦ · ·...

Mumuni and Oladele Agric & Food Secur (2016) 5:1 DOI 10.1186/s40066-015-0049-x
RESEARCH
Access to livelihood capitals and propensity for entrepreneurship amongst rice farmers in GhanaEliasu Mumuni* and Oladimeji Idowu Oladele
Abstract
Background: This paper examines rice farmers’ access to livelihood capitals (natural, financial, physical, social and human) and the relationship and propensity for entrepreneurship capacities amongst rice farmers in the northern and Ashanti regions of Ghana. A simple random and purposive sampling method was used to select a sample size of 301 rice farmers in the two regions. A structured questionnaire was used in conducting the study. The data was analysed with IBM SPSS version 21 using frequencies, percentages, means and standard deviation. Wilcoxon sign rank test, paired t test and Pearson correlation coefficient were also used for the analysis on the access to livelihoods, significance and relationship to entrepreneurial activities of the farmers.
Results: Farmers’ access to natural capitals was stronger. Similarly, the Wilcoxon sign rank test and test statistics for the physical capital also revealed a significant difference in the farmers’ physical capitals with all the measured variables including irrigation infrastructure (z = −5.581; p = 0.000), processing facilities (z = −5.904; p = 0.000), and market access (z = −6.171; p = 0.000), after been exposed to the technology interventions. The test statistics shows significant difference in all the measured variables with the p value (p > 0.05) for the human capitals of the farmers. It also showed that farmers’ credit from family and friends, access to bank loans and loans from farmer groups all increased from 47 to 52 %; 26 to 37 % and 28 to 78 %, respectively. Generally farmers’ access to all the five livelihood capitals was significant and higher. On the access to livelihood capitals and its entrepreneurial abilities, natural capitals before (t = 1.789, p = 0.074), natural livelihood after (t = 1.664, p = 0.096), social capital after (t = 1.838, p = 0.066), and physical capital before (t = 2.87, p = 0.004) showed a significantly positive relationship with their entrepreneurial capacities.
Conclusions: The study revealed that farmers’ access to stronger livelihood capitals improves on their internal locus of control, improves their farming management abilities and ultimately boosts their agricultural entrepreneurial capa-bilities. The study recommends that farmers should leverage on their human capitals (farming skills taught them) to improving on all other livelihood capitals for better business sense and culture and entrepreneurial skills.
Keywords: Livelihood capitals, Farmers, Rice, Entrepreneurship, Agriculture, Ghana
© 2016 Mumuni and Oladele. This article is distributed under the terms of the Creative Commons Attribution 4.0 International License (http://creativecommons.org/licenses/by/4.0/), which permits unrestricted use, distribution, and reproduction in any medium, provided you give appropriate credit to the original author(s) and the source, provide a link to the Creative Commons license, and indicate if changes were made. The Creative Commons Public Domain Dedication waiver (http://creativecommons.org/publicdomain/zero/1.0/) applies to the data made available in this article, unless otherwise stated.
BackgroundAgriculture is a greater contributor to poverty through jobs creation, food security and availability to world economies [1, 2]. Approximately 1.5 billion people are engaged in smallholder agriculture across the world.
They include 75 % of the world’s poorest people, whose food, income and livelihood prospects depend on agri-culture [3]. It is undoubtedly seen as a bigger contribu-tor to reducing poverty in a mass form than any other intervention according to [1]. By 2050, Africa’s popula-tion will be 1.7 billion people [4] putting an overwhelm-ing pressure on agriculture to feed the people and create jobs. These jobs will not only come from primary pro-duction of crop commodities and livestock, but through
Open Access
Agriculture & Food Security
*Correspondence: [email protected]; [email protected] Department of Agricultural Economics and Extension, North West University, Mafikeng Campus, Private Bag X2046, Mmabatho 2735, South Africa
Page 2 of 11Mumuni and Oladele Agric & Food Secur (2016) 5:1
entrepreneurship as well. This is because of the shift in primary production to feed an agro-based processing paradigm and the wider expansion and involvement of other stakeholders in development. According to [5], the support to this shift from primary to processing, entre-preneurship and innovation stem from the support of agricultural extension support services and agricultural pro policies.
People’s ability to escape poverty depends on access to assets or livelihood capitals [6]. This means that sustain-able livelihoods are achieved through access to a range of livelihood resources (natural, economic, human, social and physical capital) which are combined in the pur-suit of different livelihood strategies [7]. Rice is a criti-cal, important and a major food security crop in Ghana where about 950,000–1,644,221 metric tons are con-sumed annually [8, 9], but can only produce 580,000–600,000 metric tons leaving a huge deficit gap. The rice farmers who produce rice as a cash crop to supplement household’s income see themselves as entrepreneurs. Combining all sources of available resources to pro-duce, process, store, transport and sell to consumers or other actors along the rice value chain are what they do as small-scale farmer entrepreneurs. The rice produc-tion process is considered a major livelihood option that depends on the available livelihood capitals. These livelihood capitals (natural, physical, human, social and financial) are a major asset for every individual wellbeing which are in different proportions of access and availabil-ity [7, 10].
Based on the sustainable livelihood framework, [11] explains livelihood as ‘the activities, the assets, and the access that jointly determine the living gained by an indi-vidual or a household’. He further defined ‘rural liveli-hood diversification’ as ‘the process by which households construct a diverse portfolio of activities and social sup-port capabilities for survival and in order to improve their standard of living’. The diverse portfolio of activities requires some level of innovation and entrepreneurship to improve rural livelihoods and create enabling busi-ness opportunities and incomes. It helps to influence rural livelihoods through decisions they make about the management of their wealth or capital resources in their households.
Human capital describes the availability of farmers, rice processors, rice marketers, agro-inputs dealers, labour and agricultural technical officers who have the skills, knowledge, ability to utilise their capabilities to under-take rice production as their livelihood option. The type of knowledge and experience applied on the pre- and post-production scale of rice directly relates to the out-comes. The experience, skill and knowledge again help to minimise the adverse effects of vulnerabilities the
production processes are exposed to. Farmers’ ability to select good seeds, prepare and keep good records of their incomes and expenditures incurred, appropriate agro-nomic practices on the life cycle of the rice plant and the right technique to reduce post-harvest losses will inure to a good yield and income. Family labour is an important form of human capital according to [12]. The quality of the rice produced will also be good, making rice millers and marketers get return on their investment because customers will have value for their money. This process will result in a sustainable livelihood process for all the actors in the chain including labour that drives the activi-ties of the production process with guaranteed wage.
The social capitals of farmers include family, friends, trust, norms, communality, gatherings, and networks of farmer associations and other actors like agro-inputs dealers, land owners and agricultural extension officers. All the networking within these knowledge communities does that with a common purpose and interest. Availabil-ity and accessibility to the rice production technologies, and rate of adoption by the farmers have stronger links to their social capital. Social networks may indirectly affect agricultural productivity by influencing farming practices and the household’s propensity to adopt newer technolo-gies via the supply of information through these networks [13, 14]. The networking and membership allow them to learn from each other and depend on specific individual capabilities for their own benefits. Farmers’ adoption levels also increase if they are influenced by their col-league’s farmer other than outsiders. Memberships in more formalised groups (farmer-based organisations) often adhere to mutually agreed or commonly accepted rules, norms and sanctions. This improves their yields and livelihood outcomes with good strategies to man-age the rice farming variabilities. More so, labour which is a bigger agricultural capital is largely from family and hired source for rice production activities [15]. There-fore, family plays an important role in the labour sources for rice production which helps them to reduce cost and cope with the intensification process and the vulnerabili-ties involved, but can have an adverse impact if the bond and belongings are not there. The solidarity component with trust helps them in times of disasters like droughts, poor yields, pest and disease outbreaks and flooding by supporting each other with inputs and even labour in the affected member’s farms.
Natural capital which includes improved access to land, land area cultivated agricultural, fertile soils, water avail-ability and accessibility, pollution elements, livestock and crops are the main drivers of agriculture. Availabil-ity and access to these elements of natural capital depend on the capability of the farmers to accessing and utilis-ing the resources. Rice is produced well under fertile soils

Page 3 of 11Mumuni and Oladele Agric & Food Secur (2016) 5:1
and available water relying with the farmer’s best use of knowledge and agronomic practices. The knowledge to maintain and sustain the availability of the natural capi-tals relates to the efficiency of the human capital and the shared values of the social capital. Watershed manage-ment and maintenance, not polluting the streams and canals for irrigation, dredging of the water ways, pro-tecting the vegetation and good soil management help the farmer’s production process, improving their coping mechanisms to shocks and vulnerabilities. More so, the maintenance helps in sustaining the availability of the capitals for continues use. Livelihood diversification of the available natural resources by the rice farmers can also help them cope with the disasters and vulnerabili-ties. Vegetables can be grown during the off-peak season of the production to improve their household incomes and financial capitals as well.
Rice farming is one of the livelihood sources with higher return on investments in Ghana aside cocoa [9] that help farmers to acquire physical assets. This fact means that production (acreage and yield), rice milling machines, power tillers, land, tractors and many others may be accessible to these farmers who have good return on their investment or otherwise good incomes. Farmers turn to invest more in housing, health care and education of their children [16]. Access to irrigation facilities, roads, storage and markets facilitates the strength of farmer’s physical capital and improves the livelihood outcomes. The incomes generated from the production process pro-vide cash to cover the expenses for their clothing, hous-ing, education and other social amenities of the majority of people in rural areas [17]. Whereas the non-availability of the capitals weakens the resilience and coping mech-anisms of these farmers during disasters or any adverse event like bush fires and droughts. The inter-relationship with social capital to physical is the link and network to seed and other input suppliers, ice millers, etc., which tends to a good will for the farmer and the other actors’ concern. The financial capital of the farmer will have to be better and strong if the physical capitals are to be sus-tainable [18]. The knowledge, innovation and training of the farmer, and the processors as elements of human capital greatly contribute to a better coping strategy and recovery during difficulties and challenges. Government support to them in boosting their resilience will provide good roads for easy access, access to processing and big-ger ware houses for their produce and easy land acquisi-tion for rice production.
Financial capital is seen within the sustainable liveli-hoods framework as the financial resources people use to achieve their livelihood objectives. This capital in agriculture is generated and converted from farmers’ product into cash for household expenses and also to be
used for savings towards challenging times and bad sea-sons. Farmers depending on their trainings and support from extension officers can utilise formal and non-formal financial resources and institutions. This type of liveli-hood strategies and activities can guarantee the level of financial capital they can access or it is available to them. Ministry of Food and Agriculture (MOFA) [9] in their reports argues that farmers who are in stronger famer-based organisations (FBOs) which are a social capital element, could access financial support easily from local banks and microfinance companies as well from their own contributions than those who are not. It is inferred that a higher level of social and financial capital occurs in FBOs with internally generated revenue sources and savings culture [19]. This particular view had been ear-lier upheld by the [20] declaration that most successful groups are those in which a larger proportion of lending capital is derived from group members’ savings. This will automatically add up to improve their coping mecha-nisms during hard times and better their livelihood out-comes. Aside converting their product into cash and getting support from financial institutions, labour works by the farmer and other diverse livelihood activities within the available period can result into a strong finan-cial capital for the famers [21]. Whilst accessing the strat-egies and coping mechanisms of these rice farmers and the likely outcome from agricultural interventions and its entrepreneurial leverage, it is necessary to examine the policy and institutional context within which these capitals exist as espoused by [7, 10]. Whilst some capi-tals may be vulnerable to certain shocks, it may be that authorities are able to act and limit any damage which occurs or perhaps provide recompense [22]. In this sense, the response and support of the district assemblies and the government agencies to the external threats of farm-er’s livelihoods is critical.
In complex changing economies that are globally linked with niche developmental trends, farmers need to be more entrepreneurial with business sense and approach. There is pressure for farmers to change their production roles to all-round entrepreneurship paradigms, diversify-ing away from the production of crops and livestock as raw commodities to an agro-based transformation and further up on the agricultural value chain [23]. Dealing with all rice value chain actors including input dealers, suppliers, transporters, farm labour, agricultural exten-sion officers, marketers and consumers’ etcetera requires some level of skills and assets. Farmers ability to deal with challenges such as vulnerability to production and post-production shocks, access to finance and credit, access to required information, low bargaining power for their produce, unskilled or low technical knowledge etcetera relates to the strength of their livelihood capitals and how

Page 4 of 11Mumuni and Oladele Agric & Food Secur (2016) 5:1
they access it [24]. In all these interplay, the relationship and propensity for entrepreneurship depend largely on the access to livelihood capitals and its level of propor-tions available to the rice farmers. This paper therefore aims to examine rice farmers’ access to livelihood capitals (natural, financial, physical, social and human) and the relationship and propensity for entrepreneurship build up amongst them in Ghana.
Methodology of the studyStudy area and population of the studyThe study area covers the Ashanti and the northern regions of Ghana. Ashanti falls within the semi-decid-uous agro-ecological zone of Ghana and is located by latitude 6°52′N and longitude 1°51′W. The area is on an altitude of approximately 280 m above sea level. The region experiences double maximum rainfall in a year, with peaks in May/June and October. Mean annual rain-fall is between 1100 and 2900 mm. The mean annual tem-perature ranges between 25.5 ℃ in the southern districts and 32 ℃ in the northern parts of the region. Humidity is high averaging about 85 % in the southern districts and 65 % in the northern part of the region, whilst the northern region on its part occupies an area of about 70,383 km2 and represents the largest region in Ghana in terms of land area. The vegetation consists predomi-nantly of grassland, typically Savannah with clusters of
drought-resistant trees such as baobabs or acacias, man-goes and neem. Between May and October is the wet season, with an average annual rainfall of 750–1200 mm (30–40 in.). The dry season is between about November and April. The two regions have a total of over 7000 rice farmers according to MOFA [9] (Fig. 1).
With the approval and support of the MOFA in the Ashanti and the northern regions of Ghana through their district agricultural offices, a total of 301 rice farmers were selected for the interviews. These selected farmers were beneficiaries of a rain-fed lowland rice production project where technical agricultural interventions, skills and technologies were extended to them to improve their production and incomes ultimately. The project was sup-ported by both the Government of Ghana (GoG) through the MOFA and the Japanese Government through Japan International Cooperation Agency (JICA) from 2009 to 2014. With a total farmer population of 2221 of the pro-ject and a confidence level of 95 and 5 % precision level, a sampling formula of n = N/1 + N (e)2 was used to arrive at the sample size (301) in selecting the farmers, where n = the sample size, N = total farmer population and e = error tolerance. Sarantakos Sotirios argues that a big-ger sample size gives better accuracy than smaller sample sizes and lower sampling error [25]. Simple random sam-pling was done to select the 301 respondents for equal chance of representation of being part of the study. This
Fig. 1 Study area (source: GoG, 2011)

Page 5 of 11Mumuni and Oladele Agric & Food Secur (2016) 5:1
method increases the probability of every respondent to be part of the study.
Open- and close-type questionnaires were used in conducting the study. The questionnaires were grouped based on the five livelihood assets classifications of the livelihood frameworks (Bio-data, rice farming, physi-cal capital, social capital, human capital, financial capi-tal, natural capital and entrepreneurship). A consent approval was sort from each rice farmer before the ques-tionnaire administration began and the entire purpose of the study explained to them before the start of the study. The data collected were subjected to descriptive analysis with the use of frequency counts, percentages, and stand-ard deviation. IBM-SPSS version 22 and Microsoft excel sheets were used to analyse the data.
The Wilcoxon signed‑rank sum testWilcoxon theory of sign test compares two related samples like (before and after) with the same sample population for scoring and ranking [26]. The test applies to two-sample designs involving repeated measures and matched pairs, in this case for beneficiaries before and after the impact or differences on their livelihoods. The Wilcoxon signed-rank sum test as used in the study does not assume that the dif-ference between the variables is interval or normally distrib-uted but assumes that the differences are ordinal. The test is robust and highly efficient for moderate to heavy tailed underlying distributions. In particular, it is an improvement over the sign test and very efficient when the underlying dis-tribution is normal [27]. Hettmansperger [27] further added that Wilcoxon signed-rank statistics can be computed as sign statistic of the pair-wise averages of data.
Mathematically, the explanation for the Wilcoxon signed-rank test for the study is as follows;
where W = Wilcoxon signed-rank test, Nr = sample size, X12 = measuring levels. For I = 1, 2, …, n, X1(N1, H1, P1, S1) before the technology intervention; X2 (N2, H2, P2, S2) after the technology intervention; Ri rank; With N natural capital, H human capital, P physical capital and F social capital. Hence
As Nr increases, the sampling distribution of W con-verges to a normal distribution.
The remaining Nr pairs were ranked (Ri) from the small-est absolute difference to the largest absolute difference of the capitals, thus [X2 (N2, H2, P2, S2) − X1(N1, H1, P1, S2)].
(1)W =
∣
∣
∣
∣
∣
Nr∑
i=1
[
sgn(
x2,i − x1,i)
· Ri
]
∣
∣
∣
∣
∣
(2)
W =
[
Nr∑
i=1
sign(X2(N2, H2, P2, S2) − X1(N1, H1, P1, S2)) · Ri .
]
The Probit modelThe Probit model is often used in situations where an individual makes choices between two alternatives. In this case, the decision is to either adopt or not adopt technologies or interventions in rice production to improve on their livelihoods and entrepreneurial activities. The Probit model was then used to deter-mine farmer’s entrepreneurial abilities as a result of access to the key livelihood capitals. Education, age, farming experience, income, market access, gender, extension services and the livelihood capitals were the expressed attributes hypothesised to determine the entrepreneurial propensity of the farmers. Farms and farmer-associated attributes are some of the factors influencing the adoption of new agricultural technolo-gies to improve their livelihoods according to [28]. In the Probit model, the discrete dependent variable Y is a rough categorisation of a continuous, but unob-served variable Y*.
If Y* could be directly observed, then standard regres-sion methods would be used (such as assuming that Y* is a linear function of some independent variables, for example,
In this study, Y* is entrepreneurial abilities which is used as a proxy for Y*. A Probit model is appropriate when the dependent variable to be evaluated is dichoto-mous [29].
Following from [30], the binary probit for the two choice models can be written as:
The actual model specification for farmer’s entrepre-neurial propensity as a result of access to the livelihood capitals is; Yi = β0 + β1 Age + β2 Gender + β3 Educa-tional level +β4 Age + β5 Years of farming experiences + β6 Income + β7 Ready market + β8 Extension contact + β9 Human capital before + β10 Human capital after + β11 Natural capital before + β12 Natural capital after + β13 Social capital before + β14 Social capital after + β15 Financial capital before + β16 Financial capital after + β17 Physical capital before + β18 Physical capital after + µi where Yi and µi represent farmers entrepreneurial pro-pensity with access to livelihood capitals.
(3)Y ∗
= β1X1i + · · ·+βjXji + µi.
(4)Y ∗
i =
{
1 if Y ∗
i > Y
0 if Y ∗
i ≤ 0
(5)P
(
Y =
1
X
)
= F(XB) =1
√
2π
∫ XB
−∞
e−(XB)2
2 dx
(6)X = (1, x1i, x2i, . . . , xki)
(7)β ′
= (β0, β1, . . . , βk)

Page 6 of 11Mumuni and Oladele Agric & Food Secur (2016) 5:1
Results and discussionDemographic characteristics of respondentsAccess to livelihoods and personal welfare improvement farmers depends on some qualities and characteristics. The demographic features of the respondents captured in Table 1 reveal that majority of the farmers were youth-ful with an average mean age of 36 years and years of farming experience averaging 11.13 years (Table 1). From Table 1, many of the youth are engaged in rice farming which is good for Ghana’s present and future agriculture and also shows signs of progress which is contrary to [31] argument that majority of the youth in Africa do not have interest in agriculture.
The findings reveal that men dominates the rice pro-duction process with 86 %, and 14 % female; however, the women have designated roles and responsibilities especially on transplanting, post-harvest, processing and marketing aspect of the rice value chain. This is consist-ent with Ghana’s [32] policy framework for rice, which argues the issues of land tenure, access and ownership that prevented a lot of Ghanaian women from engag-ing in agriculture and rice farming, in particular when they are proved to be more credit worthy. Majority of the farmers had basic education level qualification and had access to market and extension services for their rice
production with an average mean income of GHc 3496. The standard deviation for the livelihood capitals for before and after showed significant variance (Table 1) to the mean, an indication of improvements in their general livelihood abilities.
Non-farm income earnings for the farmers were very significant in supporting their household expenditures complimenting their agricultural incomes (Table 2). The varied sources of their incomes indicate how entre-preneurial the farmers are through generating many activities that create employment. The three sources of income-generating activities if combine for a season means that the rice farmers’ financial capitals and house-hold incomes are stronger. As farmer entrepreneurs, source of funding for their agricultural activities is criti-cal to their farming business sustenance. Personal savings and rice buyers were their major source of funding in addition to their relative and cooperatives (Fig. 2).
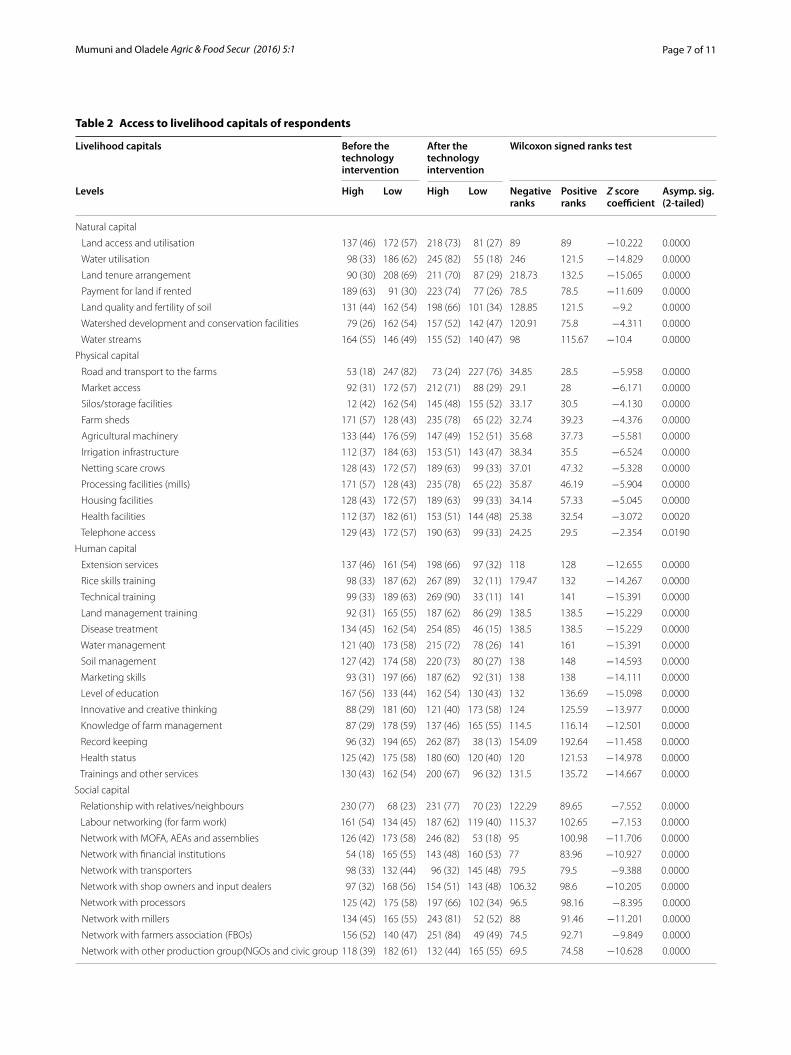
Access to livelihood capitals by respondentsAbout 83 percent of the farmers responded that they had good and strong access to natural capitals includ-ing agricultural land, water and the vegetation (Table 2). The access margins include usage and access of water utilisation (82 %), land access and utilisation (73 %), tenancy arrangement (70 %) and fertility management of the lands/soil (66 %). Their access margins to these resources drastically improved or increased from their early experience without the project. Similarly, all the variables showed very high levels of significance with the test statistics (t test) which include water utilisation (z = −15.391; p = 0.000), land access and utilisation (z = −10.222; p > 0.05), tenancy arrangement (p = 0.000) and fertility management of the lands/soil (p > 0.05). The higher response of access to natural capitals with a strong significant p value score indicates the opportunity for them to expand their farming business to take advantage of the availability and access of the common pool natural resources. Generally, agriculture thrives on the availabil-ity and access to these resources for production [33].
Farmers’ access to physical capitals also reveals some remarkable changes apart from farm roads with low response of (24 %) after the project (Table 2). Market access (from 31 to 71 %), processing facilities (mills) (from 57 to 78 %), housing facilities (from 43 to 63 %), for health (from 37 to 51 %), irrigation infrastructure (from 37 to 51 %), farm sheds (from 57 to 78 %) and net scare crows (from 43 to 63 %) all show an incremental level of change from before the project to after the project. The Wilcoxon sign rank test and test statistics for the physi-cal capital also revealed significant differences in the farmers’ physical capitals with all the measured variables (Table 2) including irrigation infrastructure (z = −5.581;
Table 1 Demographic characteristics of respondents
Variable N Mean Std. deviation
Education 301 1.17 1.63
Age (years) 301 35.79 10.62
Farming experience (years) 301 11.13 6.98
Income (amount) 301 3496.53 3790.43
Ready market 301 1.0432 0.36714
Extension contact 301 1.8671 0.46434
Established market 301 1.8704 0.37393
Gender 301 61.6678 14.20361
Ready market 301 608.0764 57.20773
Human capital before 301 28.83 9.21
Human capital after 301 55.82 6.51
Natural capital before 301 8.59 3.48
Natural capital after 301 22.24 3.48
Social capital before 301 29.30 5.45
Social capital after 301 29.39 5.60
Financial capital before 301 11.36 1.58
Financial capital after 301 8.90 3.48
Physical capital before 301 16.79 2.94
Physical capital after 301 11.98 3.30
Positive psychological capital before 301 36.57 7.63
Positive psychological capital after 301 20.81 5.60
Entrepreneurship ability before 301 61.67 14.20
Entrepreneurship ability after 301 608.08 57.21
Page 7 of 11Mumuni and Oladele Agric & Food Secur (2016) 5:1
Table 2 Access to livelihood capitals of respondents
Livelihood capitals Before the technology intervention
After the technology intervention
Wilcoxon signed ranks test
Levels High Low High Low Negative ranks
Positive ranks
Z score coefficient
Asymp. sig. (2‑tailed)
Natural capital
Land access and utilisation 137 (46) 172 (57) 218 (73) 81 (27) 89 89 −10.222 0.0000
Water utilisation 98 (33) 186 (62) 245 (82) 55 (18) 246 121.5 −14.829 0.0000
Land tenure arrangement 90 (30) 208 (69) 211 (70) 87 (29) 218.73 132.5 −15.065 0.0000
Payment for land if rented 189 (63) 91 (30) 223 (74) 77 (26) 78.5 78.5 −11.609 0.0000
Land quality and fertility of soil 131 (44) 162 (54) 198 (66) 101 (34) 128.85 121.5 −9.2 0.0000
Watershed development and conservation facilities 79 (26) 162 (54) 157 (52) 142 (47) 120.91 75.8 −4.311 0.0000
Water streams 164 (55) 146 (49) 155 (52) 140 (47) 98 115.67 −10.4 0.0000
Physical capital
Road and transport to the farms 53 (18) 247 (82) 73 (24) 227 (76) 34.85 28.5 −5.958 0.0000
Market access 92 (31) 172 (57) 212 (71) 88 (29) 29.1 28 −6.171 0.0000
Silos/storage facilities 12 (42) 162 (54) 145 (48) 155 (52) 33.17 30.5 −4.130 0.0000
Farm sheds 171 (57) 128 (43) 235 (78) 65 (22) 32.74 39.23 −4.376 0.0000
Agricultural machinery 133 (44) 176 (59) 147 (49) 152 (51) 35.68 37.73 −5.581 0.0000
Irrigation infrastructure 112 (37) 184 (63) 153 (51) 143 (47) 38.34 35.5 −6.524 0.0000
Netting scare crows 128 (43) 172 (57) 189 (63) 99 (33) 37.01 47.32 −5.328 0.0000
Processing facilities (mills) 171 (57) 128 (43) 235 (78) 65 (22) 35.87 46.19 −5.904 0.0000
Housing facilities 128 (43) 172 (57) 189 (63) 99 (33) 34.14 57.33 −5.045 0.0000
Health facilities 112 (37) 182 (61) 153 (51) 144 (48) 25.38 32.54 −3.072 0.0020
Telephone access 129 (43) 172 (57) 190 (63) 99 (33) 24.25 29.5 −2.354 0.0190
Human capital
Extension services 137 (46) 161 (54) 198 (66) 97 (32) 118 128 −12.655 0.0000
Rice skills training 98 (33) 187 (62) 267 (89) 32 (11) 179.47 132 −14.267 0.0000
Technical training 99 (33) 189 (63) 269 (90) 33 (11) 141 141 −15.391 0.0000
Land management training 92 (31) 165 (55) 187 (62) 86 (29) 138.5 138.5 −15.229 0.0000
Disease treatment 134 (45) 162 (54) 254 (85) 46 (15) 138.5 138.5 −15.229 0.0000
Water management 121 (40) 173 (58) 215 (72) 78 (26) 141 161 −15.391 0.0000
Soil management 127 (42) 174 (58) 220 (73) 80 (27) 138 148 −14.593 0.0000
Marketing skills 93 (31) 197 (66) 187 (62) 92 (31) 138 138 −14.111 0.0000
Level of education 167 (56) 133 (44) 162 (54) 130 (43) 132 136.69 −15.098 0.0000
Innovative and creative thinking 88 (29) 181 (60) 121 (40) 173 (58) 124 125.59 −13.977 0.0000
Knowledge of farm management 87 (29) 178 (59) 137 (46) 165 (55) 114.5 116.14 −12.501 0.0000
Record keeping 96 (32) 194 (65) 262 (87) 38 (13) 154.09 192.64 −11.458 0.0000
Health status 125 (42) 175 (58) 180 (60) 120 (40) 120 121.53 −14.978 0.0000
Trainings and other services 130 (43) 162 (54) 200 (67) 96 (32) 131.5 135.72 −14.667 0.0000
Social capital
Relationship with relatives/neighbours 230 (77) 68 (23) 231 (77) 70 (23) 122.29 89.65 −7.552 0.0000
Labour networking (for farm work) 161 (54) 134 (45) 187 (62) 119 (40) 115.37 102.65 −7.153 0.0000
Network with MOFA, AEAs and assemblies 126 (42) 173 (58) 246 (82) 53 (18) 95 100.98 −11.706 0.0000
Network with financial institutions 54 (18) 165 (55) 143 (48) 160 (53) 77 83.96 −10.927 0.0000
Network with transporters 98 (33) 132 (44) 96 (32) 145 (48) 79.5 79.5 −9.388 0.0000
Network with shop owners and input dealers 97 (32) 168 (56) 154 (51) 143 (48) 106.32 98.6 −10.205 0.0000
Network with processors 125 (42) 175 (58) 197 (66) 102 (34) 96.5 98.16 −8.395 0.0000
Network with millers 134 (45) 165 (55) 243 (81) 52 (52) 88 91.46 −11.201 0.0000
Network with farmers association (FBOs) 156 (52) 140 (47) 251 (84) 49 (49) 74.5 92.71 −9.849 0.0000
Network with other production group(NGOs and civic group 118 (39) 182 (61) 132 (44) 165 (55) 69.5 74.58 −10.628 0.0000

Page 8 of 11Mumuni and Oladele Agric & Food Secur (2016) 5:1
p = 0.000), processing facilities (z = −5.904; p = 0.000), housing facilities (z = −5.045; p = 0.000), market access (z = −6.171; p = 0.000), and telephone access (z = −2.354; p = 0.019), after been exposed to the tech-nology interventions.
The level of farmers’ human capital as observed from the study showed similar trend as the physical and natu-ral capitals. Rice skill training for instance increased from 33 to 89 %, extension service from 46 to 66 %, and land management trainings of the farmers improved from 31 to 62 %. Also, the marketing skills increased from 32 to 66 % before and after the project as well as from 9 to 46 % for farmers’ innovation and creativity from the study (Table 2). This affirms [34] findings that train-ing of farmers by extension agricultural extension agents improves not only their production and skills but also their finances and household management. However, though many of the respondents experienced the change
and improvements, a few others claim they did not expe-rience any significant change in their human capital lev-els. The test statistics shows significant difference in all the measured variables with a p value of >0.05.
The findings also show that farmers networking with the MOFA and the agricultural extension agents (AEAs) were very good. Their relationship with relatives and neighbours, labour networking (for farm work), network with financial institutions, network with farmers associa-tion (FBOs) as well as networking with input dealers had a strong p value (p > 0.05) from the mean ranks which is an indication of strong access and improvements on their social capitals. Access to information and technology through networking with the relevant agencies improves farmers’ performances and production abilities which lead to increase in entrepreneurial urge [35].
In addition, farmers’ credit from family and friends , access to bank loans and loans from farmer groups all
Table 2 continued
Livelihood capitals Before the technology intervention
After the technology intervention
Wilcoxon signed ranks test
Levels High Low High Low Negative ranks
Positive ranks
Z score coefficient
Asymp. sig. (2‑tailed)
Network with Village committee 132 (44) 165 (55) 195 (65) 106 (35) 57 71.81 −7.053 0.0000
Financial capital
Farm incomes 178 (59) 156 (52) 213 (71) 81 (27) 82 82 −3.211 0.0010
Non-farm income/revenues 67 (22) 98 (33) 164 (55) 100 (33) 50 55.38 −3.475 0.0010
Savings 133 (44) 167 (56) 189 (63) 117 (39) 81 89.02 −5.250 0.0000
Self-help groups savings 98 (33) 192 (64) 153 (51) 144 (48) 97.26 87.38 −8.248 0.0000
Credits from relatives and friends 142 (47) 109 (36) 156 (52) 131 (44) 71 78.12 −8.493 0.0000
Access to bank credits 49 (16) 250 (83) 111 (37) 184 (61) 80.5 82.47 −6.710 0.0000
Self-help groups loan (FBOs) 83 (28) 276 (92) 234 (78) 62 (21) 75.98 72 −2.646 0.0080
0
10
20
30
40
50
60
70
80
90
100
Personal savings Rela�ves Coopera�ves Banks FarmerAssocia�ons
Rice buyers
Perc
ent
Fig. 2 Source of capital for farming

Page 9 of 11Mumuni and Oladele Agric & Food Secur (2016) 5:1
increased from 47 to 52 %; 26 to 37 % and 28 to 78 %, respectively. The z scores and the p values (Table 2) showed significant changes and relationships; thus, farm incomes (z = −3.211; p = 0.001), non-farm income/revenues (z = −3.475; p = 0.000), savings (z = −5.250; p = 0.000), self-help groups’ savings (z = −8.248; p = 0.000), and self-help groups’ loan (FBOs) (z = −2.646; p = 0.008). These results show a highly significant difference and change in their financial livelihood capitals on income, savings and credit affirming [36] position that agricultural credit and financing improve farmers’ livelihoods and abilities.
Relationship between access to livelihood capitals and entrepreneurshipUndisputedly, farmers’ main threat and challenge faced has always been strand or categorised into social barri-ers, economic barriers, physical barriers, regulations, access to finance and information dissemination and their managerial abilities to cope with and sustainably
be in business as well as manage risk. Hence, threading from the stronger access of these livelihood capitals of the rice farmers from the above analysis, it is expected to either translate and contribute to better and stronger entrepreneurial farmers or not have a relationship what-soever. The coefficients in the Probit model (Table 3) reveal a statistically significant relationship that shows that access to livelihood capitals can improve the entre-preneurial abilities of the respondents (Table 3). Age is significant (t = 2.83 and p = 0.005), which means that young farmers with youthful strength are likely to develop more entrepreneurial abilities compared to the aged ones.
From Table 3, gender (p = 0.012), ready market (p = 0.028) for rice produce and contacts to extension officers (p = 0.016) were all significant. These revealed how the mutual distribution of roles in the farm is based on comparative advantage, available market to sell prod-ucts and other value chain products that are linked to rice. Frequent contacts to extension officers on knowl-edge transfer also likely could increase the business and entrepreneurial propensities of the farmers. On the livelihood capitals, natural capitals before (t = 1.789, p = 0.074), natural livelihood after (t = 1.664, p = 0.096), social capital after (t = 1.838, p = 0.066), and physical capital before (t = 2.87, p = 0.004) were all significant. Membership in multiple social networks and groups also enhances people’s mental capability to perceive opportu-nity and additionally encourages their entrepreneurship abilities [37].
The probability of increased in entrepreneurial capac-ities of farmers increases with an increase in natural, social and physical capitals of farmers. The significant relationship of physical capital with entrepreneur-ship could be attributed to how transportation, farm machinery, market access, storage facilities and shelter can help propel entrepreneurial innovations. For social capital, the goodwill availability and the social relations and networks the farmers’ access could improve their agricultural business sense and entrepreneur approach. Again, the results indicate that farmers had good access to natural capitals which is the foundation of rice farm-ing. It could be attributed to how the access and use of land, available and access to agricultural water, how-ever, could trigger entrepreneurial activities of farmers. These significant relationships established reveal the farmers abilities to take risk, improve on their internal locus of control and the need to achieve, and enhance their capabilities as farmers which are attributes of good entrepreneurs.
The scatter plot (Fig. 3) indicates a nonlinear relation-ship without layers between livelihood capitals and entre-preneurship abilities.
Table 3 Probit model analysis of livelihood capitals and entrepreneurial activity
Probit model: Probit (p) = Intercept + BX
Parameters Estimate Std. error
Z Sig.
Education −0.029 0.006 −4.818 0
Age 0.003 0.001 2.83 0.005
Farming experience 0.001 0.002 0.518 0.604
Income 0 0 −27.066 0
Gender −0.049 0.02 −2.522 0.012
Ready market −0.065 0.03 −2.194 0.028
Extension contact 0.051 0.021 2.418 0.016
Established market −0.143 0.028 −5.157 0
Human capital before 0.006 0.001 3.969 0
Human capital after −0.001 0.002 −0.741 0.459
Natural capital before 0.007 0.004 1.789 0.074
Natural capital after 0.005 0.003 1.664 0.096
Social capital before 0 0.002 −0.223 0.824
Social capital after 0.005 0.003 1.838 0.066
Financial capital before 0.002 0.007 0.225 0.822
Financial capital after 0.006 0.005 1.278 0.201
Physical capital before 0.013 0.005 2.87 0.004
Physical capital after −0.02 0.003 −6.158 0
Positive psychological capital before
0.004 0.002 1.488 0.137
Positive psychological capital after
0.002 0.003 0.533 0.594
Intercept −1.133 0.192 −5.895 0
Chi square 13,319.44
df 280
p 0

Page 10 of 11Mumuni and Oladele Agric & Food Secur (2016) 5:1
ConclusionIt can be concluded that labour is mutually shared for both males and females for the production (land preparation, weed control, fertiliser application and harvesting) and post-production (threshing, drying and cleaning) process of rice cultivation. Farmers’ general access to all the key livelihood capitals strongly emerged from this research after the technology interventions. Since agriculture is the main livelihood source for the largely poor in developing and middle income countries like Ghana, a sustainable strategy of entrepreneurship propensity of farmers is the solution to many economic problems like urbanism, pov-erty, hunger, unemployment and economic under devel-opment. Access to stronger livelihood capitals like human skills development, knowledge of agriculture, knowledge of market, and management of the agricultural land, water resources, funding from banks and networking skills helps farmers develop strong and consolidated farming abilities. However, aside physical, natural and social livelihood capi-tals that showed a statistically significant relationship with entrepreneurial abilities, financial and human capitals were not significantly related though linearly correlated. The study recommends that farmers should leverage on their human capitals (farming skills taught them) to improving on all other livelihood capitals for better business sense and culture and entrepreneurial skills. Also, the business aspect of farming can be promoted by government to boost farm-ers’ business skills and entrepreneurship capabilities too.
AbbreviationsMOFA: Ministry of Food and Agriculture; SRID: Statistics, Research and Informa-tion Department; JICA: Japan International Cooperation Agency; FBO: farmer-based organisations; GoG: Government of Ghana.
Authors’ contributionsME designed the data collection instruments and gathered the data, and helped in analysis and write up. OOI supervised the design, the entire data collection process and provided guide, corrections and supervision to the entire research. All authors read and approved the final manuscript.
AcknowledgementsThe authors will like to thank the North West University (NWU) of the Mafikeng Campus, South Africa and Ministry of Food and Agriculture (MOFA), Ghana for their support.
Competing interestsThe authors declare that they have are no competing interests.
Received: 24 October 2015 Accepted: 1 December 2015
References 1. OECD Economic Importance of agriculture for sustainable develop-
ment and poverty reduction. Findings from a case study of Ghana. Econ Importance Agric Sustain Dev Poverty Reduct Find Case Study Ghana. 2010.
2. Dan Z, Wouter D, Chris DB, Tom C. Local bank financing for smallholder farmers: a $9 billion drop in the Ocean. The Initiative For Smallholder Finance Briefing Paper 1; 2013. P. 1–6..
3. Ferris S, et al. Linking smallholder farmers to markets and the implications for extension and advisory services. 2014.
4. FAO. How to feed the world in 2050. Forcast report; 2009. p. 1–35. 5. Lans T, Seuneke P, Klerkx L. Agricultural entrepreneurship. In: Carayannis
EG, editor. Encyclopedia of creativity, invention, innovation, and entrepre-neurship. Springer Reference. Berlin, Heidelberg: Springer; 2013. p. 1–6. doi:10.1007/SpringerReference_378865.
6. FAO. Socio-economic and livelihood analysis in investment planning©. 2008.
7. Scoones I. Sustainable Rural livelihoods: a framework for analysis. Ids Working Paper 72. 1998.
8. Millennium development authority. Investment opportunity in Ghana: maize, soya and rice production and processing. Accra; 2010.
9. MoFA. Agriculture in Ghana: facts and figures.Annual Report, Accra, Ghana; 2013. p. 1–64.
-0.2
-0.15
-0.1
-0.05
0
0.05
0.1
0 5 10 15 20 25
Live
lihoo
d ac
�vi�
es
Entrepreneurship propensity
y = 0.0016x - 0.0264
Fig. 3 Scatter plot of livelihood capitals and entrepreneurial activities

Page 11 of 11Mumuni and Oladele Agric & Food Secur (2016) 5:1
10. GLOPP. DFID’ s sustainable livelihoods approach and its framework; 2008. p. 1–5. http://www.glopp.ch/website/en/technical_project.html.
11. Ellis F. Rural livelihood diversity in developing countries: evidence and policy implications. ODI Nat Resour Perspect. 1999;40:1–10.
12. Mahdi, Shivakoti GP, Schmidt-Vogt D. Livelihood change and livelihood sustainability in the uplands of Lembang subwatershed, West Sumatra, Indonesia, in a changing natural resource management context. Environ Manage. 2009;43:84–99.
13. Social capital and technology adoption on small farms. The case of banana production technology in Uganda. At http://repository.up.ac.za/bitstream/handle/2263/24679/Complete.pdf?sequence=14.
14. Liverpool LSO, Winter-Nelson A. Poverty status and the impact of social networks on smallholder technology adoption in rural Ethiopia. IFPRI Discussion Paper 970; 2010.
15. Mumuni E, Yaa P, Oladele OI. Household welfare among migrant rice farmers in Ashanti Region of Ghana. 2013;747–50.
16. MOFA. Status report on accessment of rainfed rice project outputs. 2013. 17. Norman JC, Kebe B. African smallholder farmers: rice production.
2004;33–64. 18. District P, Province C, Pdr L. Impact assessment of livelihood interventions
in BCI pilot site. In: Hasan Moinuddin, Jiao Xi, Sumit Pokhrel, Wang Wany-ing. 2009.
19. Akpabio IA. Significant predictors of social capital in farmers. J Int Soc Res. 2008;1/3 spring:1–11.
20. Bank W. The world bank participation source book. 1996. 21. Food MA, Policies A, Fao M. Analysis of incentives and disincentives for
rice in Ghana draft version. 2013. 22. Morse S, Mcnamara N, Acholo M. Sustainable livelihood approach: a
critical analysis of theory and sustainable livelihood approach: a critical analysis of theory and practice. 2009.
23. Warren M. Farmers online: drivers and impediments in adoption of Inter-net in UK agricultural businesses. J Small Bus Enterp Dev. 2004;11:371–81.
24. Kahan D. The role of the farm management specialist by. 2013. 25. Sarantakos S. Social research. 1998. 26. Wilcoxon F. Individual comparisons of grouped data by ranking methods.
J Econ Entomol. 1946;39:269. 27. Hettmansperger TP, Oja H. Affine invariant multivariate rank tests for
several samples. Stat Sin. 1998;8:785–800. 28. Mwanga J, Mussei A, Mwangi W, Verkuijl H. Adoption of improved wheat
technologies by small scale farmers in Mbeya district of southern high-lands, Tanzania. Proc Tenth Reg Wheat Work East Cent South Africa Univ Stellenbosch South Africa 1418 Sept 1998. 2001;39–45. At http://reposi-tory.cimmyt.org/xmlui/bitstream/handle/10883/1021/74246.pdf.
29. Maddala GS. Limited-dependent and qualitative variables in economics. New York: Cambridge University Press; 1983. p. 257–91.
30. Greene WH. Econometric analysis. 2011. 31. Anyanwu C. Community development, the Nigerian perspectives.
Gabesther Educational Publishers; 1992. 32. Republic THE. Ministry of food and agriculture the republic of Ghana
national rice development strategy (NRDS) (DRAFT). 2009. 33. FAO. Global agriculture towards 2050. High lev. expert forum-how to feed
world 2050. 2009;1–4. At http://www.fao.org/fileadmin/templates/wsfs/docs/Issues_papers/HLEF2050_Global_Agriculture.pdf.
34. Wellard K. Knowledge transfer: the role of community extension in increasing food security. 2011.
35. Ehmann M. Katalyst case study-7.pdf. 2014. 36. Minten B, Fafchamps M. Social capital and the firm: evidence from agri-
cultural trade. Am J Agric Econ. 2001;83:65–98. 37. Dana L-P. Zotero groups IISES library toward a theory of social capital in
entrepreneurship. Int J Soc Sci. 2012;35–54. At https://www.zotero.org/groups/iises/items/G2V5X3PZ?fullsite=0.
• We accept pre-submission inquiries
• Our selector tool helps you to find the most relevant journal
• We provide round the clock customer support
• Convenient online submission
• Thorough peer review
• Inclusion in PubMed and all major indexing services
• Maximum visibility for your research
Submit your manuscript atwww.biomedcentral.com/submit
Submit your next manuscript to BioMed Central and we will help you at every step: