
ACCEPTED FOR PUBLICATION IN APJ A - arxiv.org FOR PUBLICATION IN APJ ... (Moon et al. 2009) in...
20
ACCEPTED FOR PUBLICATION IN APJ Preprint typeset using L A T E X style emulateapj v. 5/2/11 G11.2-0.3: THE YOUNG REMNANT OF A STRIPPED-ENVELOPE SUPERNOVA KAZIMIERZ J. BORKOWSKI , 1 STEPHEN P. REYNOLDS, 1 &MALLORY S. E. ROBERTS 2 Accepted for publication in ApJ ABSTRACT We present results of a 400-ks Chandra observation of the young shell supernova remnant (SNR) G11.2-0.3, containing a pulsar and pulsar-wind nebula (PWN). We measure a mean expansion rate for the shell since 2000 of 0.0277 ± 0.0018% yr -1 , implying an age between 1400 and 2400 yr, and making G11.2-0.3 one of the youngest core-collapse SNRs in the Galaxy. However, we find very high absorption (A V ∼ 16 m ± 2 m ), confirming near-IR determinations and ruling out a claimed association with the possible historical SN of 386 CE. The PWN shows strong jets and a faint torus within a larger, more diffuse region of radio emission and nonthermal X-rays. Central soft thermal X-ray emission is anticorrelated with the PWN; that, and more detailed morphological evidence, indicates that the reverse shock has already reheated all ejecta and compressed the PWN. The pulsar characteristic energy-loss timescale is well in excess of the remnant age, and we suggest that the bright jets have been produced since the recompression. The relatively pronounced shell and diffuse hard X-ray emission in the interior, enhanced at the inner edge of the shell, indicate that the immediate circumstellar medium into which G11.2-0.3 is expanding was quite anisotropic. We propose a possible origin for G11.2-0.3 in a stripped-envelope progenitor that had lost almost all its envelope mass, in an anisotropic wind or due to binary interaction, leaving a compact core whose fast winds swept previously lost mass into a dense irregular shell, and which exploded as a Type cIIb or Ibc supernova. Subject headings: ISM: individual objects (G11.2-0.3) — ISM: supernova remnants — X-rays: ISM 1. INTRODUCTION The remnants of core-collapse supernovae (CC SNRs) contain a wealth of information on the progenitor system, the supernova (SN) event, and the surrounding material. Young CC SNRs show the clearest imprint of the SN itself and the composition of the ejecta. If a neutron star left behind acts as a pulsar, it can inflate a pulsar-wind nebula (PWN) in the midst of the expanding ejecta. Young PWNe are of great interest in their own right, as they exhibit the particles and magnetic field generated in the relativistic pulsar outflow and modified in a relativistic wind termination shock. However, the PWN can also act as a probe of the innermost material ejected in the supernova. The youngest CC SNR in the Galaxy, Cas A, contains a neutron star which unfortunately does not function as a pulsar, while the youngest PWN in the Galaxy, the Crab Nebula, shows only very indirect evidence for the surrounding SNR shell that ought to contain it (see Hester 2008 for a review). The other historical SNRs, Kepler, Tycho, SN 1006, RCW 86 (= SN 185 CE; Williams et al. 2011) and G1.9+0.3 (the latter only quasi-historical, as the SN event was not observed at Earth due to obscuration around 1900 when it would have been seen), all appear to be remnants of thermonuclear, Type Ia events. For years it was thought that the next youngest historical CC SNR was a bright shell radio source, G11.2-0.3; in fact, one of the present authors (Reynolds et al. 1994) used ROSAT observations to claim support for its association with a possible supernova in CE 386 (Stephenson & Green 2002), as well as arguing for a Type Ia origin. Both these assertions have turned out to be incorrect. G11.2-0.3 has been identified as a potential historical SNR since at least the first well-resolved imaging observations at radio (VLA, 20 00 resolution) and X-ray (Einstein HRI) wavelengths (Downes 1984), where it was argued that its high radio surface brightness and symmetrical well-defined shell structure indicated youth. An identification with the CE 386 event was proposed, but an even younger age was also suggested. Green et al. (1988) observed G11.2-0.3 with the VLA with 3 00 resolution at two frequencies, and argued on morphological grounds that G11.2-0.3 resembled Cas A much more than Tycho or Kepler, in particular in the clumpy structure and lack of a sharp outer boundary. They reinterpreted an H I absorption spectrum of Becker et al. (1985) to estimate a distance of about 5 kpc, and also supported an association with the CE 386 event. More recent distance estimates range from 4.4 kpc (Green 2004) to 5.5–7 kpc (Minter et al. 2008). (Below, we use a distance of 5 kpc but also consider variations between 4.4 and 7 kpc.) The question of the SN type giving rise to G11.2-0.3 was definitively settled with the discovery with ASCA of the PWN (Vasisht et al. 1996) and the 65 ms pulsar (Torii et al. 1997). However, the measured spindown (Torii et al. 1999) gave a characteristic age τ c ≡ P/2 ˙ P of about 20,000 yr, implying that the pulsar was born spinning at nearly its present period (so τ c is a poor age indicator). Best values for the pulsar period and period derivative were obtained with RXTE (see the Fermi Ephemerides database 3 ): P = 64.69 ms and ˙ P =4.43 × 10 -14 ss -1 , giving τ c = 23, 000 yr and spindown luminosity ˙ E =6.5 × 10 36 erg s -1 . Further radio spectral studies (Kothes & Reich 2001) confirmed the presence of a flat-spectrum radio core (α ∼ 0 with S ν ∝ ν α ) with observations between 4.85 and 32 GHz, using the Effelsberg 100-m telescope. The most detailed radio observations of G11.2-0.3 were those of Tam et al. (2002) and Tam & Roberts (2003) with the VLA. Tam et al. (2002) reported a PWN spectral index of α = -0.25 +0.05 -0.10 and a shell spectrum with α = -0.56 ± 0.02, from archival VLA observations. The highest resolution 1 Department of Physics, North Carolina State University, Raleigh, NC 27695-8202; [email protected] 2 New York University Abu Dhabi, U.A.E. 3 http://fermi.gsfc.nasa.gov/ssc/data/access/lat/ephems/index.html arXiv:1602.03531v1 [astro-ph.HE] 10 Feb 2016
Transcript of ACCEPTED FOR PUBLICATION IN APJ A - arxiv.org FOR PUBLICATION IN APJ ... (Moon et al. 2009) in...

ACCEPTED FOR PUBLICATION IN APJPreprint typeset using LATEX style emulateapj v. 5/2/11
G11.2−0.3: THE YOUNG REMNANT OF A STRIPPED-ENVELOPE SUPERNOVA
KAZIMIERZ J. BORKOWSKI,1 STEPHEN P. REYNOLDS,1 & MALLORY S. E. ROBERTS 2
Accepted for publication in ApJ
ABSTRACTWe present results of a 400-ks Chandra observation of the young shell supernova remnant (SNR) G11.2−0.3,
containing a pulsar and pulsar-wind nebula (PWN). We measure a mean expansion rate for the shell since2000 of 0.0277± 0.0018% yr−1, implying an age between 1400 and 2400 yr, and making G11.2−0.3 one ofthe youngest core-collapse SNRs in the Galaxy. However, we find very high absorption (AV ∼ 16m± 2m),confirming near-IR determinations and ruling out a claimed association with the possible historical SN of 386CE. The PWN shows strong jets and a faint torus within a larger, more diffuse region of radio emission andnonthermal X-rays. Central soft thermal X-ray emission is anticorrelated with the PWN; that, and more detailedmorphological evidence, indicates that the reverse shock has already reheated all ejecta and compressed thePWN. The pulsar characteristic energy-loss timescale is well in excess of the remnant age, and we suggest thatthe bright jets have been produced since the recompression. The relatively pronounced shell and diffuse hardX-ray emission in the interior, enhanced at the inner edge of the shell, indicate that the immediate circumstellarmedium into which G11.2−0.3 is expanding was quite anisotropic. We propose a possible origin for G11.2−0.3in a stripped-envelope progenitor that had lost almost all its envelope mass, in an anisotropic wind or due tobinary interaction, leaving a compact core whose fast winds swept previously lost mass into a dense irregularshell, and which exploded as a Type cIIb or Ibc supernova.Subject headings: ISM: individual objects (G11.2−0.3) — ISM: supernova remnants — X-rays: ISM
1. INTRODUCTION
The remnants of core-collapse supernovae (CC SNRs) contain a wealth of information on the progenitor system, the supernova(SN) event, and the surrounding material. Young CC SNRs show the clearest imprint of the SN itself and the composition of theejecta. If a neutron star left behind acts as a pulsar, it can inflate a pulsar-wind nebula (PWN) in the midst of the expanding ejecta.Young PWNe are of great interest in their own right, as they exhibit the particles and magnetic field generated in the relativisticpulsar outflow and modified in a relativistic wind termination shock. However, the PWN can also act as a probe of the innermostmaterial ejected in the supernova.
The youngest CC SNR in the Galaxy, Cas A, contains a neutron star which unfortunately does not function as a pulsar, whilethe youngest PWN in the Galaxy, the Crab Nebula, shows only very indirect evidence for the surrounding SNR shell that ought tocontain it (see Hester 2008 for a review). The other historical SNRs, Kepler, Tycho, SN 1006, RCW 86 (= SN 185 CE; Williamset al. 2011) and G1.9+0.3 (the latter only quasi-historical, as the SN event was not observed at Earth due to obscuration around1900 when it would have been seen), all appear to be remnants of thermonuclear, Type Ia events. For years it was thought thatthe next youngest historical CC SNR was a bright shell radio source, G11.2−0.3; in fact, one of the present authors (Reynoldset al. 1994) used ROSAT observations to claim support for its association with a possible supernova in CE 386 (Stephenson &Green 2002), as well as arguing for a Type Ia origin. Both these assertions have turned out to be incorrect.
G11.2−0.3 has been identified as a potential historical SNR since at least the first well-resolved imaging observations at radio(VLA, 20′′ resolution) and X-ray (Einstein HRI) wavelengths (Downes 1984), where it was argued that its high radio surfacebrightness and symmetrical well-defined shell structure indicated youth. An identification with the CE 386 event was proposed,but an even younger age was also suggested. Green et al. (1988) observed G11.2−0.3 with the VLA with 3′′ resolution attwo frequencies, and argued on morphological grounds that G11.2−0.3 resembled Cas A much more than Tycho or Kepler, inparticular in the clumpy structure and lack of a sharp outer boundary. They reinterpreted an H I absorption spectrum of Becker etal. (1985) to estimate a distance of about 5 kpc, and also supported an association with the CE 386 event. More recent distanceestimates range from 4.4 kpc (Green 2004) to 5.5–7 kpc (Minter et al. 2008). (Below, we use a distance of 5 kpc but also considervariations between 4.4 and 7 kpc.)
The question of the SN type giving rise to G11.2−0.3 was definitively settled with the discovery with ASCA of the PWN(Vasisht et al. 1996) and the 65 ms pulsar (Torii et al. 1997). However, the measured spindown (Torii et al. 1999) gave acharacteristic age τc ≡ P/2P of about 20,000 yr, implying that the pulsar was born spinning at nearly its present period (so τc is apoor age indicator). Best values for the pulsar period and period derivative were obtained with RXTE (see the Fermi Ephemeridesdatabase3): P = 64.69 ms and P = 4.43×10⁻¹⁴ s s−1, giving τc = 23,000 yr and spindown luminosity E = 6.5×1036 erg s−1.
Further radio spectral studies (Kothes & Reich 2001) confirmed the presence of a flat-spectrum radio core (α∼ 0 with Sν ∝ να)with observations between 4.85 and 32 GHz, using the Effelsberg 100-m telescope. The most detailed radio observations ofG11.2−0.3 were those of Tam et al. (2002) and Tam & Roberts (2003) with the VLA. Tam et al. (2002) reported a PWN spectralindex of α = −0.25+0.05
−0.10 and a shell spectrum with α = −0.56± 0.02, from archival VLA observations. The highest resolution1 Department of Physics, North Carolina State University, Raleigh, NC 27695-8202; [email protected] New York University Abu Dhabi, U.A.E.
3 http://fermi.gsfc.nasa.gov/ssc/data/access/lat/ephems/index.html
arX
iv:1
602.
0353
1v1
[as
tro-
ph.H
E]
10
Feb
2016

2
imaging of the PWN radio structure was reported in Roberts et al. (2003). The radio image shows loops and arcs of radioemission most prominent to the northeast (Figures 1, 2, and 3). While the pulsar dominates the X-ray image, it is not detectablein the radio image. This is consistent with the upper limit of 0.1 mJy on the pulsed flux obtained from deep 1.9 GHz radiosearches with the Green Bank Telescope (H. Al Noori, private communication).
G11.2−0.3 was an early target of the Chandra X-ray Observatory. Kaspi et al. (2001) showed that the pulsar was within 8′′ ofthe geometric center of the remnant, providing additional evidence that the pulsar spindown age greatly overestimated the trueage of the pulsar and remnant. Roberts et al. (2003) analyzed the morphology and spectrum of the shell and PWN, in comparisonwith high-resolution radio data. They focused primarily on the PWN, showing the radio counterpart, and pointing out small-scalechanges in X-ray morphology between observations in August and October 2000. Spectral analysis showed that a plane-shockmodel did a reasonable job of describing the brightest (SE) portion of the shell, with kT ∼ 0.6 keV and an ionization timescaleof about 7× 1011 cm−3 s. However, a hard excess was present, which they described with a model of synchrotron emissionfrom a power-law electron spectrum with an exponential cutoff, requiring a rolloff frequency (the characteristic synchrotronfrequency emitted by electrons with the e-folding energy Emax of the exponential cutoff) of about 1.8× 10¹⁶ Hz. A furtherChandra observation of 60 ks was obtained in 2003, confirming variability of the PWN (Roberts et al. 2004). X-ray emissionfrom the PWN was found to consist of bright jets and much fainter, more diffuse emission mostly filling the radio PWN (Robertset al. 2005).
G11.2−0.3 was reported as an infrared source in the IRAS catalogue of Arendt (1989), but this was probably unrelated emissionfrom an H II region (Reach et al. 2006). Reach et al. (2006) detected G11.2−0.3 with Spitzer in the GLIMPSE survey of theGalactic plane with the IRAC instrument. Only faint filamentary emission in a few spots was detected, primarily at the longerwavelengths (5.8 and 8 µm). However, at 24 µm, Spitzer MIPS observations show a bright, complete shell corresponding wellto the radio and X-ray structure and attributed to emission from collisionally heated grains (Pinheiro Gonçalves et al. 2011;Andersen et al. 2011). Recent near-IR observations (Koo et al. 2007; Moon et al. 2009) show [Fe II] emission at 1.644 µm fromthe bright SE shell and the fainter NW shell as well as in several knots surrounding the PWN. The outer shell emission mayrepresent a mixture of ejecta and shocked circumstellar medium (CSM). The interior emission shows Doppler shifts of up to1000 km s−1, and is interpreted as inner ejecta (Moon et al. 2009) in undecelerated expansion. More spatially-localized emissionfrom molecular hydrogen is also present (Koo et al. 2007; Froebrich et al. 2015), with several H2 filaments located outside theradio boundary of the remnant. The recent detection of broad CO lines provides additional evidence for the presence of shockedmolecular gas in G11.2−0.3 (Kilpatrick et al. 2016).
G11.2−0.3 shows expansion at radio and near-IR wavelengths. Tam & Roberts (2003) derived radio expansion rates of 0.057′′±0.012′′ yr−1 and 0.040′′± 0.013′′ yr−1 at 20 and 6 cm, respectively, while Koo et al. (2007) found the SE [Fe II] filament to beexpanding at 0.035′′±0.013′′ yr−1. While the errors are large, these rates imply undecelerated ages (that is, upper limits) of 4,000– 7,000 yr, confirming the relative youth of G11.2−0.3.
G11.2−0.3 presents various interesting problems for the evolution of SNRs and their massive-star progenitors. Chevalier(2005) included it in a group of remnants of Type IIL/b supernovae, a class of supernovae which have lost most of their hydrogenenvelopes at the time of explosion, implying pre-explosion mass loss of at least several M. He interpreted the observations assupporting a SN IIL/b event in which the shell’s reverse shock has not yet reached the PWN. If G11.2−0.3 originated in such asupernova, the current SNR blast wave should be encountering modified CSM, perhaps in a steady-state wind with ρ∝ r−2. Thelarge extent of the PWN relative to the shell has been used as evidence that the reverse shock has not quite reached the PWN yet(Tam et al. 2002), but the nature of central thermal X-ray emission (see Figure 1 in Roberts et al. 2003) is not at all clear. Soeven basic questions concerning this important remnant are not definitively answered: What is the actual age? Is it encounteringstellar-wind material, undisturbed interstellar medium (ISM), or something else? Where is the reverse shock? Is there evidencein X-rays for ejecta emission, whose abundances might contain clues to the progenitor mass? We address these questions belowwith a ∼ 400 ks Chandra observation.
2. X-RAY OBSERVATIONS
Chandra deep observations of G11.2−0.3 took place in 2013 May and September (Table 1), with the remnant located on theACIS S3 CCD chip. All data have been reprocessed with CIAO v4.6 and CALDB v4.6.3, and screened for periods of highparticle background. Very Faint mode was used as the surface brightness of G11.2−0.3 is low, allowing for an efficient rejectionof particle background. The total effective exposure time is 388 ks (3/4 in May and 1/4 in September). Observations in Mayconsist of one long (173 ks) pointing in its first week, and two shorter pointings (combined exposure of 121 ks) in its last week.This makes it possible to study the short-term variability of the PWN. Earlier observations from 2000 and 2003 (Table 1) havealso been used for investigation of the long-term variability of the PWN and for measuring the remnant’s expansion. The sameprocessing steps were followed as for the 2013 observations. The earliest observation from 2000 August was done in Faint mode,so its particle background is higher than for other datasets.
We aligned the 2013 observations to match the reference frame of the longest pointing from early May (Obs. ID 14831). Mostdetected X-rays are produced by G11.2−0.3, so we smoothed the 2013 May 5–7 data with the multiscale partitioning methodof Krishnamurthy et al. (2010), and then used the method described in § 7 to align the other 2013 pointings. The coordinatetransformation used involves only simple translations, without any rotation or change in the physical scale. Alignment of the 2000and 2003 observations to the 2013 reference frame was done simultaneously with the measurement of the remnant’s expansion(as described in § 7). This involves change in the physical scale but not rotation.
Spectral analysis was done with XSPEC v12.8.2 (Arnaud 1996). Background was extracted from a large area on the S3 CCDchip away from G11.2−0.3. The background was modeled instead of subtracted in order to allow the use of C-statistics (Cash1979).

Young Core-Collapse SNR G11.2−0.3 3
Table 1Chandra Observations of G11.2−0.3
Date Observation ID Roll Angle Effective exposure time(deg) (ks)
2000 Aug 06 780 267 192000 Oct 15 781 273 102000 Oct 15 2322 273 4.62003 May 10 3909 95 142003 Jun 27 3910 209 142003 Aug 01 3911 258 7.32003 Sep 08 3912 270 152013 May 05–07 14831 95 1732013 May 25–26 14830 98 582013 May 26–27 14832 98 632013 Sep 07 15652 270 482013 Sep 08–09 16323 270 46
3. RADIO OBSERVATIONS
The Very Large Array observed the field containing G11.2−0.3 in 2001–2002 at 20 cm, 6 cm, and 3.5 cm. The 20 cm and6 cm observations and reduction are described in Tam & Roberts (2003) and were used to measure the expansion of the remnant.Since the PWN has a significantly flatter spectrum than the shell, it is more prominent at 3.5 cm, and we use those data for themorphological comparisons described here. The same image was previously used in Roberts et al. (2003).
A four-pointing mosaic centered on the remnant was used with the pointings separated by half a primary beamwidth. Thebandwidth was 100 MHz which, after flagging and averaging the data sets, had an effective central frequency of 8459.4 MHz.The observations were interleaved with the observations at 20 cm and 6 cm presented in Tam & Roberts (2003) so as to maximizethe hour angle coverage. Each pointing of the mosaic had exposures of roughly 27 min in the DnC Array, 18 min in the C array,13 min in the CnB array, and 31 min in the BnA array. The data processing was performed using standard procedures within theMIRIAD package (Sault & Killeen 1999)4 in mosaic and multifrequency synthesis mode. We performed calibration and editingon each data set individually, before combining all the data. The primary gains were determined using 3C 286 and 3C 48, andphase calibrations were made from observations of 1820-254 (J2000.0). Imaging was performed with Robust weighting as acompromise between maximized signal-to-noise ratio and resolution. We utilized the maximum entropy method algorithm fordeconvolution (Cornwell et al. 1999) and applied self-calibration iteratively to improve phase and amplitude calibrations. Thefinal image is corrected for primary-beam attenuation and has a synthesized beam of 3.1′′× 2.6′′. This image was then furthersmoothed with various kernels to bring out specific features to compare with X-ray images.
4. PULSAR-WIND NEBULA
Roberts et al. (2003) and Tam et al. (2002) presented the basic properties of the PWN at radio and X-ray wavelengths. Thecentral radio emission shown in Fig. 1 has a spectral index α of αP = −0.25+0.05
−0.10, while the mean spectral index of the shell isαS = −0.56± 0.02, although there are spatial variations. While the extents of the radio and X-ray PWN are comparable, theinterior structures differ substantially (Fig. 2). We estimate the length of the X-ray jets to be about 35′′; they do not have clearradio counterparts. The jet widths are of order 10′′ − 15′′. (At 5 kpc, 1′′ = 7.5× 1016 cm.) The radio emission is mainly infilamentary arcs and loops; the outermost loop to the NE appears to bound the X-ray jet.
In Figure 3 we compare the structures of the X-ray and radio PWN. While the outer parts are clearly different, both showsmall scale structure near the pulsar which are similar in extent and overall shape, and are reminiscent of the torus+jet structuresseen in the X-ray emission of other PWNe (e.g., Ng & Romani 2004). What is extraordinary is that these structures are seen inradio as well as in X-rays. Figure 4 shows a close-up of this radio emission, with X-ray contours. There is no evidence of pointsource emission > 0.1 mJy, consistent with the pulsed upper limits. The putative radio torus is inclined to the line of sight, witha semi-major axis of ∼ 12′′ and an apparent axial ratio of about 2 to 1; a circle in projection would have an axis tilted at 60 tothe plane of the sky. The breadth of the torus appears quite narrow, and is unresolved in the 3.5 cm image produced with Robustweighting. To better constrain the thickness of the torus, we created an image with uniform weighting which is less sensitive tolarger structures but has a synthesized beam of 1.8′′× 1.3′′ where the torus thickness may be barely resolved. We put an upperlimit on the size of the brightest knots in the torus of ∼ 2′′ corresponding to a physical size of ∼ 0.05 pc at the nominal 5 kpcdistance. The radio image also shows a clear inner jet-like structure to the Southwest, with the brightest spot coincident with thebrightest time-averaged emission in the X-rays.
The X-ray jet contains bright knots to the SW (more clearly visible in Fig. 7), while the surface brightness is more uniform tothe NE. Figure 5 shows that the mean brightness of the knots is about three times that of the NE jet. These knots have a hardspectrum with a photon index Γ of 1.36+0.10
−0.16 (errors are 90% confidence intervals). Spectra of selected jet regions (in magentain Fig. 3) are shown in Figure 6. At low energies, these spectra are dominated by thermal emission produced in the interior ofG11.2−0.3 (and discussed in the next section), while at high energies, nonthermal emission from the jets swamps the much softerthermal interior emission. We used a plane shock with solar abundances together with a power law to model these spectra (plusan additional multicomponent model for the background). The model fits shown in Figure 6 are the result of a joint fit to all fourspectra with the power-law index Γ assumed constant along the jets, but allowing for variations in absorption. The value of Γ is1.78±0.07, so overall the PWN has a significantly softer spectrum than the bright knots near the pulsar torus. With Γ allowed to
4 See http://www.atnf.csiro.au/computing/software/miriad

4
Figure 1. Left: Smoothed 3.5 cm VLA image. Right: Smoothed 3.3 – 8.1 keV Chandra image. Both are scaled to show the similar maximum extent of thecentral pulsar-wind nebula. The pulsar itself is much brighter and has been masked out in the X-ray image; it is not visible in the radio image. N is up and E is tothe left.
Figure 2. Red: 3.5 cm radio image. Note filamentary arcs and loops, especially to the east. Green: 3.3 – 8.1 keV image. The morphology is simpler, mainly atwo-sided jet. The pulsar has been masked out (blue region); an ellipse fit to the radio torus is overplotted.
vary among regions, we obtain 1.75+0.10−0.09, 1.76+0.12
−0.11, 1.79+0.11−0.11, and 1.91+0.26
−0.22 (moving from the NE to the SW ends of the jet), withthe C-statistic value decreasing by only 1.6 relative to the fit with constant Γ throughout the jets. Applying the likelihood ratio

Young Core-Collapse SNR G11.2−0.3 5
Figure 3. Left: 3.5 cm radio image with torus indicated. Right: Smoothed Chandra image from 3.3 to 8 keV, with radio torus indicated in green, on arcsinhstretch scale. Note the structure coincident with the radio torus. The radio maximum is not the pulsar but the intersection of the torus with the SW jet; the X-raypulsar has again been masked out. Spectral extraction regions along the jets are also shown.
Figure 4. A close-up of the torus/SW jet region in the 3.5 cm image with colors chosen to highlight the torus and bright spot. The orange contours are from thecombined 3.3–8 keV Chandra image. Note that the contours are not equally spaced in intensity, but chosen to highlight particular structures in the X-ray PWNwhich correspond to structures in the radio without unduly obscuring the radio image. The purple ovals outline the proposed radio torus, while the red contoursshow the location of the pulsar in X-rays. The synthesized radio beam is indicated by the black oval in the bottom right corner.
test (Cash 1979), we find that variations in Γ are not statistically significant, so there is no spectral softening along the X-ray jetsas one moves away from the pulsar. This constrains the magnetic-field strength and age of the jets (which may be less than theage of G11.2−0.3). Absence of softening is also consistent with the comparable extents of radio and X-ray nebulae.
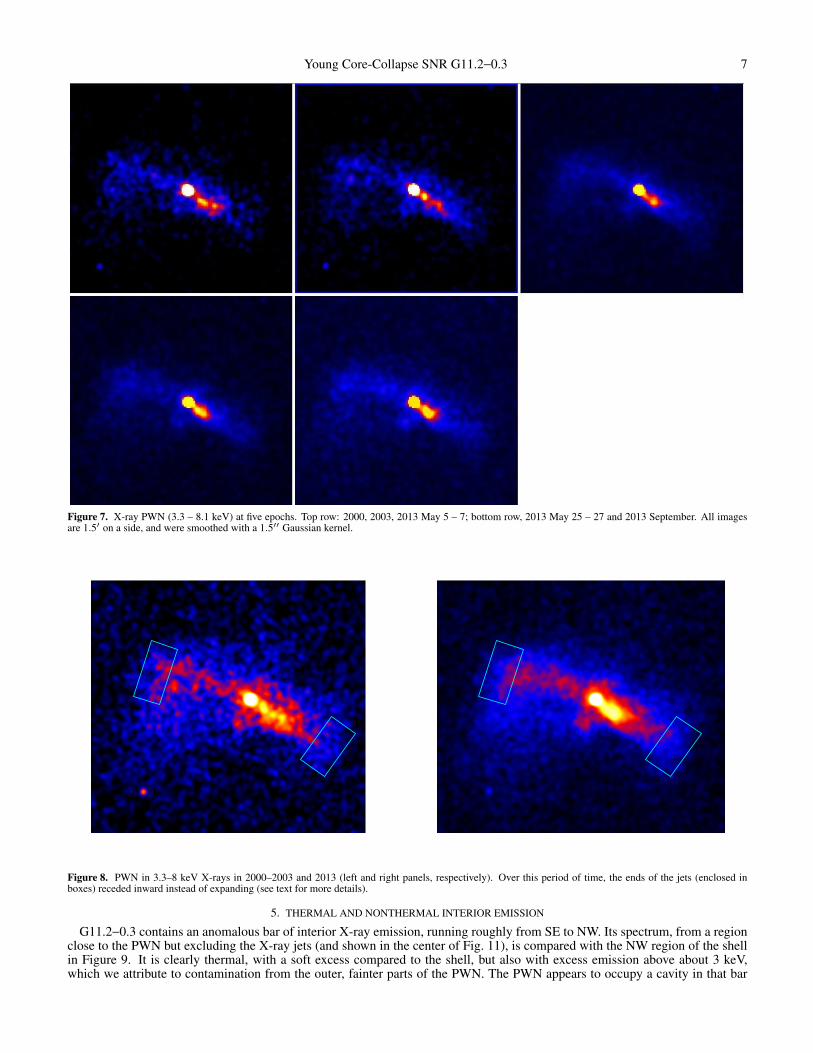
The brighter structures in the PWN clearly change on a timescale of weeks to years (Fig. 7). No systematic motion is apparent,however; the bright knots remain in roughly the same position while substantial brightness changes occur. The ends of the jetsdo not appear to expand over the 13-year period covered (Fig. 8). We measured expansion of the end of the NE jet using the

6
0
5
10
15
20
25
30
-50 -40 -30 -20 -10 0 10 20 30 40 50
arb
itra
ry u
nits
arcsec
Figure 5. Left: Region used for jet profile (summed along the short direction). The region is 87′′× 15′′, at a position angle of 62 E of N. Right: X-ray jetprofile from NE to SW through 3.3 – 8 keV image (pulsar not removed). The bright spots to the SW are about three times as bright as the mean emission to theNE.
1 2 5
10
−4
10
−3
0.0
1
norm
aliz
ed c
oun
ts s
−1 k
eV−
1
Energy (keV)
Figure 6. Spectra of the X-ray jets extracted from regions shown in Figure 3 (from NE to SW: blue, red, black, and green), with model fits indicated (total –solid line, jet emission – dashed line). Background has been modeled, not subtracted.
same method as for expansion of the shell (see § 7 for more details), except that here expansion is measured relative to the pulsar,and we used only high-energy (3.3–8 keV) photons in order to avoid contamination from soft thermal emission that becomesimportant at low energies (Fig. 6). The end of the NE jet contracted inward (instead of expanding) by 3.1(1.4,4.6)% (errorsare 90% confidence intervals) during the 11.6 yr that separate the mean epochs of the images shown in Figure 8. (The quotederrors do not include systematic effects introduced by smoothing of long observations from 2013, so this contraction might beunderestimated.) The contraction rate is 0.27(0.12,0.40)% yr−1, or 0.09(0.04,0.13) arcsec yr−1 at the sharp end where the NE jetterminates. There are not enough high energy photons at the end of the SW jet to measure its motion reliably, but a joint fit toboth ends of the jets, using regions shown in Figure 8 and assuming a uniform expansion, yields contraction of 3.2(1.8,4.3)%,fully consistent with contraction of both jets between 2000–2003 and 2013. Because of the poor photon statistics, it is not clear atthis time whether this apparent contraction is caused by systematic long term motions of the ends of the jets, or whether it reflectsmore complex temporal and morphological variability similar to what is found closer to the pulsar. Long-term variations in thepulsar activity might be responsible for this contraction, or the jets might be hydrodynamically unstable. Alternatively, since, aswe argue below, the reverse shock has already arrived at the center and reheated all the ejecta, this interaction may have producedmore complex PWN dynamics.
Young Core-Collapse SNR G11.2−0.3 7
Figure 7. X-ray PWN (3.3 – 8.1 keV) at five epochs. Top row: 2000, 2003, 2013 May 5 – 7; bottom row, 2013 May 25 – 27 and 2013 September. All imagesare 1.5′ on a side, and were smoothed with a 1.5′′ Gaussian kernel.
Figure 8. PWN in 3.3–8 keV X-rays in 2000–2003 and 2013 (left and right panels, respectively). Over this period of time, the ends of the jets (enclosed inboxes) receded inward instead of expanding (see text for more details).
5. THERMAL AND NONTHERMAL INTERIOR EMISSION
G11.2−0.3 contains an anomalous bar of interior X-ray emission, running roughly from SE to NW. Its spectrum, from a regionclose to the PWN but excluding the X-ray jets (and shown in the center of Fig. 11), is compared with the NW region of the shellin Figure 9. It is clearly thermal, with a soft excess compared to the shell, but also with excess emission above about 3 keV,which we attribute to contamination from the outer, fainter parts of the PWN. The PWN appears to occupy a cavity in that bar

8
1 2 510
−5
10
−4
10
−3
0.0
10
.1
no
rmal
ized
co
un
ts s
−1 k
eV−
1
Energy (keV)
Si Kα
S Kα
Mg Kα
Figure 9. Spectra of the NW shell region (blue) and the central bar (red; excluding the X-ray jet, see Figure 11). Note that the central emission is dominantlythermal, showing the same clear lines of He-like Mg, Si, and S as the outer shell, but with a softer spectrum overall but also a hard excess. We interpret the hardexcess as emission from the fainter regions of the PWN overlapping the bar.
18h11m26.00s28.00s30.00s32.00s34.00sRA (J2000)
20.0"
26'00.0"
40.0"
20.0"
25'00.0"
-19°24'40.0"
Dec (J2000)
0.5
1.0
1.5
2.0
2.5
3.0
3.5
4.0
4.5
Figure 10. X-ray interior emission in the Mg Kα line, overlaid with 3.5 cm radio contours. Scale is in counts per 0.6′′×0.6′′ image pixel in the 1.29–1.40 keVenergy range. Radio contours range from 1 mJy beam−1 to 1.7 mJy beam−1. Note how the radio PWN fills the gap in the bar of soft X-ray emission extendingacross the remnant center.
of thermal emission. Figure 10 compares the soft X-ray image in the Mg Kα line with the 3.5-cm radio image. A brighter rimcan be seen at the SE edge of the PWN. Comparison of the X-ray PWN with the thermal X-ray image (Fig. 11) confirms thisconclusion.
The clear interaction of the PWN with the thermal emission indicates that that material is in the remnant interior, and not justprojected from the front or back face of the shell. That is, material all the way in to the PWN has been reheated by the reverseshock. This is an important clue to the evolutionary state of G11.2−0.3, indicating that that state is quite advanced, and suggestingthat nearly all the SN ejecta have been shocked by now.
Young Core-Collapse SNR G11.2−0.3 9
a
b
c
d
e
f
g
h
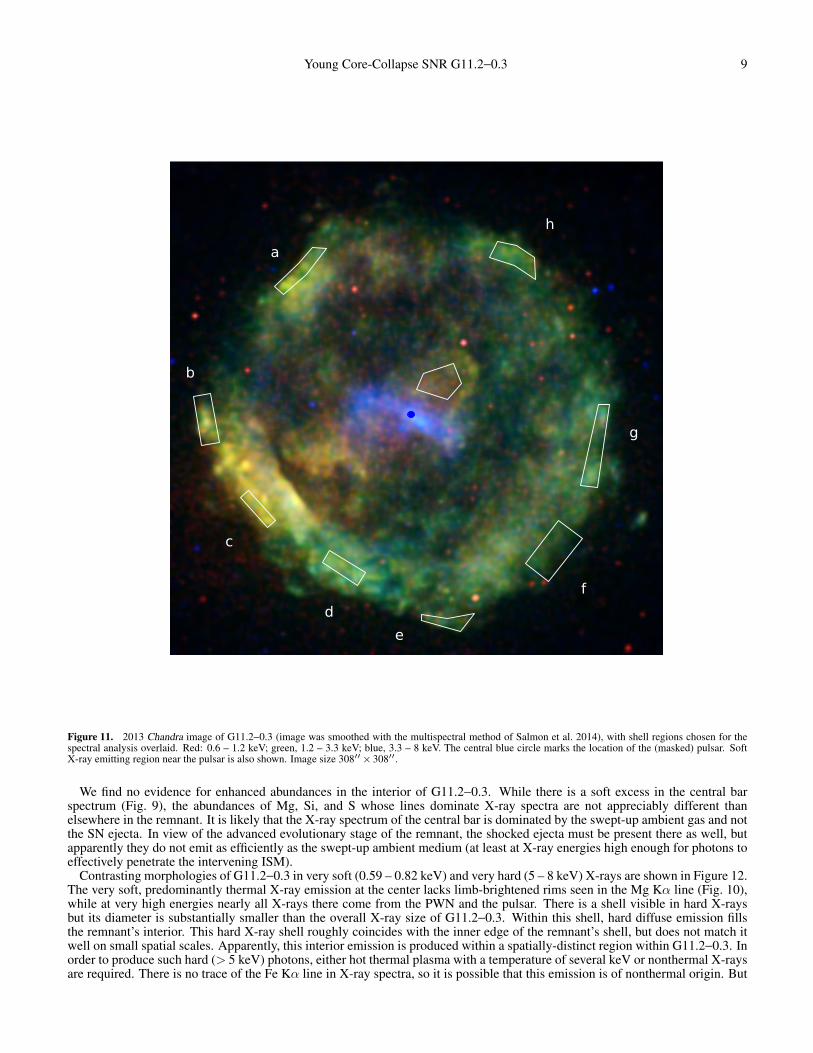
Figure 11. 2013 Chandra image of G11.2−0.3 (image was smoothed with the multispectral method of Salmon et al. 2014), with shell regions chosen for thespectral analysis overlaid. Red: 0.6 – 1.2 keV; green, 1.2 – 3.3 keV; blue, 3.3 – 8 keV. The central blue circle marks the location of the (masked) pulsar. SoftX-ray emitting region near the pulsar is also shown. Image size 308′′×308′′.
We find no evidence for enhanced abundances in the interior of G11.2−0.3. While there is a soft excess in the central barspectrum (Fig. 9), the abundances of Mg, Si, and S whose lines dominate X-ray spectra are not appreciably different thanelsewhere in the remnant. It is likely that the X-ray spectrum of the central bar is dominated by the swept-up ambient gas and notthe SN ejecta. In view of the advanced evolutionary stage of the remnant, the shocked ejecta must be present there as well, butapparently they do not emit as efficiently as the swept-up ambient medium (at least at X-ray energies high enough for photons toeffectively penetrate the intervening ISM).
Contrasting morphologies of G11.2−0.3 in very soft (0.59 – 0.82 keV) and very hard (5 – 8 keV) X-rays are shown in Figure 12.The very soft, predominantly thermal X-ray emission at the center lacks limb-brightened rims seen in the Mg Kα line (Fig. 10),while at very high energies nearly all X-rays there come from the PWN and the pulsar. There is a shell visible in hard X-raysbut its diameter is substantially smaller than the overall X-ray size of G11.2−0.3. Within this shell, hard diffuse emission fillsthe remnant’s interior. This hard X-ray shell roughly coincides with the inner edge of the remnant’s shell, but does not match itwell on small spatial scales. Apparently, this interior emission is produced within a spatially-distinct region within G11.2−0.3. Inorder to produce such hard (> 5 keV) photons, either hot thermal plasma with a temperature of several keV or nonthermal X-raysare required. There is no trace of the Fe Kα line in X-ray spectra, so it is possible that this emission is of nonthermal origin. But

10
18h11m20.00s24.00s28.00s32.00s36.00sRA (J2000)
27'00.0"
26'00.0"
25'00.0"
24'00.0"
-19°23'00.0"
Dec (J2000)
0.0
0.2
0.4
0.6
0.8
1.0
1.2
1.41.61.82.0
18h11m20.00s24.00s28.00s32.00s36.00sRA (J2000)
27'00.0"
26'00.0"
25'00.0"
24'00.0"
-19°23'00.0"
Dec (J2000)
0.0
0.4
0.8
1.2
1.6
2.0
2.4
2.83.23.64.0
Figure 12. Smoothed images of G11.2−0.3 in very soft (0.59 – 0.82 keV; top) and very hard (5 – 8 keV; bottom) X-rays. Scale is in counts per 0.6′′× 0.6′′image pixel. The pulsar has been masked out (cyan regions). The brightest parts of the PWN are saturated. Note striking difference in the shell radius betweensoft and hard X-rays.
irrespective of its (thermal or nonthermal) origin, the presence of a very hard X-ray shell in the interior of a dynamically evolvedremnant such as G11.2−0.3 is quite unexpected.
6. G11.2−0.3 AND A POSSIBLE SN IN CE 386
Lee et al. (2013) found very high extinction (AV = 16m–20m) in their study of 3 IR-bright rims in the SE and S. At 5 kpcdistance, the SN would have been fainter than 29m + MV , clearly not compatible with historical reports of a possible SN in CE386 for even the most luminous SNe. A typical CC SN (MV = −18m) could not have been seen by naked eye even if AV were aslow as 12m reported by Lee et al. (2013) in a few spatially localized regions in the SE. We demonstrate here that absorption is

Young Core-Collapse SNR G11.2−0.3 11
1 2 510−5
10−4
10−3
10−2
10−1
a
0.62+0.03−0.02 keV
2.95+0.05−0.05 × 1022 cm−2
1 2 510−5
10−4
10−3
10−2
10−1
e
0.72+0.06−0.04 keV
3.08+0.11−0.12 × 1022 cm−2
1 2 510−5
10−4
10−3
10−2
10−1
b
0.72+0.03−0.02 keV
2.69+0.06−0.06 × 1022 cm−2
1 2 510−5
10−4
10−3
10−2
10−1
f
0.67+0.02−0.03 keV
3.20+0.08−0.08 × 1022 cm−2
1 2 510−5
10−4
10−3
10−2
10−1
c
0.64+0.02−0.04 keV
2.58+0.05−0.03 × 1022 cm−2
1 2 510−5
10−4
10−3
10−2
10−1
g
0.83+0.04−0.04 keV
3.07+0.05−0.06 × 1022 cm−2
1 2 510−5
10−4
10−3
10−2
10−1
d
0.68+0.02−0.03 keV
3.36+0.06−0.06 × 1022 cm−2
1 2 510−5
10−4
10−3
10−2
10−1
norm
aliz
edco
unts
s−1
keV−
1
Energy (keV)
h
0.69+0.02−0.04 keV
3.29+0.08−0.08 × 1022 cm−2
Figure 13. Spectra of the shell in regions shown in Figure 11, overlaid with model spectra. For each spectrum, the fitted values of hydrogen column density NHand electron temperature Te are shown (errors are 90% confidence intervals).
high not only in the SE and S, ruling out association of G11.2−0.3 with a possible SN 386.We analyzed X-ray spectra of 8 outer shell sections (see Fig. 11) by fitting them with a plane shock model (vpshock model
in XSPEC) with atomic data from AtomDB (Smith et al. 2001; Foster et al. 2012). We assumed solar abundances as givenby Grevesse & Sauval (1998) except for Mg, Si, and S whose abundances have been allowed to vary in our fits. As shown inFigure 13, the fitted values of hydrogen column density NH vary from 2.6×1022 cm−2 to 3.4×1022 cm−2, with the least amount ofabsorption found in the E and SE (regions b and c, consistent with the soft X-ray excess seen there in Figure 11). (Near the pulsar,we find slightly lower (NH = 2.4–2.7×1022 cm−2) absorption from fits to the spectra in Figure 6, but we consider them less reliablein view of the mixed thermal and nonthermal nature of these interior spectra, and with the thermal interior emission not as wellunderstood as the outer shell emission.) In order to convert from NH to AV , we assume the same dust-to-gas mass ratio and thesame dust properties as in the dust model of Weingartner & Draine (2001) with RV = 3.1, so AV = 15.m9(NH/3×1022cm−2). Thisgives AV in the range from 14m to 18m across the entire remnant, confirming the high absorption derived from IR observations.
Our optical extinction estimates depend on a number of uncertain assumptions, but this is unlikely to affect our conclusionsabout the non-association of G11.2−0.3 with a possible SN 386. We assumed solar abundances of Grevesse & Sauval (1998) forboth absorbing and X-ray emitting gas, the same solar abundance set used by Weingartner & Draine (2001) in their dust modelsconstrained by observations of dust in the solar vicinity. Since in the inner Galaxy metal abundances are higher than in the solarneighborhood, this leads to an overestimate of NH (at the high absorption of interest here, heavy elements alone, and not H and

12
He, are responsible for X-ray absorption). But for the same degree of heavy element depletion onto dust expected in the diffuseISM across the entire Galaxy, AV remains the same.
Our neglect of X-ray scattering by dust leads to overestimation of both NH and AV but this effect is difficult to quantify forspatially-extended sources such as G11.2−0.3. Reynolds et al. (2009) found a 25% reduction in NH for the much more compactand much more heavily absorbed (NH = 5.1×1022 cm−2) remnant G1.9+0.3 by modeling its dust-scattered X-ray halo. But evensuch a large and unrealistic reduction in AV would not make a typical CC SN visible without a telescope at 5 kpc distance. Mostlikely, this reduction is quite modest for G11.2−0.3, as our estimates of AV in regions c and d, 14m and 18m, do not exceed the16m–18m found by Lee et al. (2013) in this region of the remnant. (In principle, IR-based estimates of optical extinction shouldbe more reliable than our X-ray-based estimates, but currently there are still uncertainties in atomic data for the [Fe II] transitionsused by Lee et al. (2013) to estimate IR extinction (Giannini et al. 2015; Koo & Lee 2015).)
Recent SNe within the inner Galaxy, such as those that produced G11.2−0.3 and the youngest known Galactic SNR G1.9+0.3,were too heavily absorbed to be detected at optical wavelengths. If the guest star of 386 were indeed a supernova, it must havebeen not so distant and heavily absorbed. Lack of a suitable candidate remnant associated with this guest star casts serious doubtsabout its identification as a supernova event.
7. SHELL EXPANSION
Chandra observed G11.2−0.3 in 2000 (Epoch I observations), 2003 (Epoch II), and 2013 (Epoch III), over a timespan ofnearly 13 yr. This time baseline is long enough to measure expansion of the remnant reliably. We first measured the overallexpansion using a variation of the method described in Carlton et al. (2011) (see also Vink 2008). From the merged 2013 MayChandra data, we extracted a spectral cube, 10242× 128 in size, that included counts from the entire remnant in the 0.6–8 keVenergy range (spectral channels 41–552). Event positions were binned to about 3/5 of the ACIS pixel size, so one image pixelis 0.301′′×0.301′′. With 10242 spatial pixels, the 5.1′×5.1′ area encompasses the entire remnant, including the outlying outerknots. Spectral channels were binned by a factor of 4. The 2013 May data cube was then smoothed with the spectro-spatialmethod of Krishnamurthy et al. (2010), varying a penalty parameter that controls the amount of smoothing. Smoothed datacubeswere summed over spectral channels to yield smoothed 0.6–8 keV images. We used these images as a model for the surfacebrightness of G11.2−0.3 at Epoch III (see Figure 14 for a model with the penalty parameter of 0.015). These model images (afterbackground subtraction) were then fit to the unsmoothed 0.6–8 keV images from earlier epochs (i.e., shrunk to fit) using themaximum likelihood method (C-statistic; Cash 1979). We excluded the remnant’s interior in these fits as shown in Figure 14. Wealso excluded poorly exposed outer sections of the shell at Epoch II. Several point sources were masked out. Spatial variationsin effective exposure times were taken into account by correcting model images with the help of monochromatic (E = 1.7 keV)exposure maps. For each observation from Epochs I and II, there are four free parameters in this model: a physical scaling factor,a surface-brightness scaling factor, and image shifts in right ascension α and declination δ. These image shifts allow correctionof any misalignment of individual pointings due to the Chandra external astrometric errors (mean error of 0.′′16; Rots 2009).They might also be nonzero for perfectly aligned observations in the presence of asymmetric expansion. In this case, expansionmeasurements reported here provide us with the mean expansion rate of the remnant.
Since our model images only approximate the true surface brightness distribution, model uncertainties contribute to errors inmeasured expansion rates. We took these systematic effects into account by using the 0.6–8 keV image from 2013 September asthe control image. In the 0.32 yr time baseline from 2013 May to September, we expect a negligible (only ∼ 0.01%) expansionof the remnant. But fits to the 2013 September image, allowing only for changes in the physical scaling and surface brightnessfactors, revealed systematic trends with the amount of smoothing. Increased smoothing broadens the outer boundary of theremnant, so the model must be shrunk to match unsmoothed data. As the magnitude of this systematic effect is expected to bedependent on the model alone, the physical scaling factor derived from fitting the 2013 September image was used to correct themeasured Epoch I and II scaling factors. We verified that the corrected scaling factors showed no significant variations with theamount of smoothing (except for either grossly inadequate or excessive smoothing).
The measured expansion rates are listed in Table 2 for a model with the penalty parameter of 0.015, together with the alignmenterrors, surface scaling factors, and physical scaling factors. The mean error on displacements among individual observations is0.07′′. The surface brightness scaling factors are larger than unity because we used monochromatic exposure maps that do nottake into account the continuing decrease in time of the Chandra low-energy sensitivity. The chosen penalty parameter leads toa reasonably smooth model image (Figure 14) without producing any appreciable bias in measured scaling factors. The Epoch Iand II observations were fit independently, then corrected for the bias. Errors were added in quadratures. A larger (by ∼ 30%)expansion is found for the Epoch I observations, in agreement with expectations based on the lengths of the time baselines. Thecorrected expansion rates for Epochs I and II are within measurement errors. Their weighted average is 0.0277±0.0018% yr−1.
The inner boundary of the shell is quite sharp in several locations, offering us an opportunity to search for possible variationsin expansion across the shell. We divided the shell into inner and outer sections (Figure 14), and measured their expansionrates. The model is based on all 2013 data, and we used the same (0.015) penalty parameter in order to avoid biasing expansionmeasurements. The Epoch I and II observations were fit simultaneously, assuming constant expansion rates. We refit the wholeshell again to verify that this measurement method is consistent with the more rigorous procedure described above. There isexcellent agreement between the two methods, as the overall shell expansion is 0.0267±0.0013% yr−1 (Table 3). (Errors listedin Table 3 do not include systematic effects.)
We detect expansion in both the outer and the inner shell (Table 3). The outer shell expansion rate is 0.0279±0.0018% yr−1,marginally faster than for the whole shell. Expansion of the inner shell appears slower by nearly 1/4, 0.0215±0.0023% yr−1, butthe errors are large. No differences in expansion rates are expected in the Sedov phase for remnants expanding either into uniformambient medium or into the progenitor wind. But the sharp inner edge seen in G11.2−0.3 is not expected in Sedov models, so

Young Core-Collapse SNR G11.2−0.3 13
2 4 6 8 10 12 14 16 18 20 22
Figure 14. 2013 May Chandra image of G11.2−0.3. Scale is in counts per 0.3′′×0.3′′ image pixel in the 0.6–8 keV energy range (image was smoothed with themultiscale partitioning method of Krishnamurthy et al. 2010). Shell regions chosen for expansion measurements are shown. Intensities shown with the cubehelixcolor scheme of Green (2011). Image size 308′′×308′′.
Table 2Expansion of G11.2−0.3
Baseline Observation ID ∆ta ∆αcosδb ∆δc Sd Expansione Expansion Ratee
(yr) (arcsec) (%) (% yr−1)
2013 May – 2013 Sep · · · 0.32 · · · · · · 1.006±0.002 0.007±0.014 · · ·2003 – 2013 May 3909 10.01 0.043 0.054 1.041±0.005 · · · · · ·
3910 9.88 0.043 0.053 1.049±0.005 · · · · · ·3911 9.79 0.065 0.082 1.033±0.007 · · · · · ·3912 9.68 0.042 0.054 1.038±0.005 · · · · · ·· · · 9.85 · · · · · · · · · (0.268±0.019) (0.0271±0.0019)· · · 9.85 · · · · · · · · · 0.266±0.023 0.0270±0.0024
2000 – 2013 May 780 12.77 0.038 0.046 1.046±0.004 · · · · · ·781 12.58 0.050 0.056 1.052±0.006 · · · · · ·
2322 12.58 0.070 0.079 1.044±0.009 · · · · · ·· · · 12.69 · · · · · · · · · (0.361±0.025) (0.0285±0.0020)· · · 12.69 · · · · · · · · · 0.359±0.029 0.0283±0.0023
(2000+2003) – 2013 May · · · · · · · · · · · · · · · · · · 0.0277±0.0018
Note. — All errors are 1σ.a Baseline length.b Alignment error in right ascension.c Alignment error in declination.d Model surface brightness scaling.e Values in brackets are before correction for systematic effects.

14
Table 3Inner and Outer Shell Expansion
Region Observation ID ∆αcosδ ∆δ S Expansion Ratea
(arcsec) (% yr−1)
Whole Shell 3909 0.040 0.042 1.037±0.005 · · ·3910 0.038 0.047 1.045±0.005 · · ·3911 0.063 0.074 1.030±0.007 · · ·3912 0.044 0.056 1.034±0.005 · · ·780 0.036 0.045 1.042±0.004 · · ·781 0.050 0.054 1.047±0.006 · · ·2322 0.063 0.091 1.040±0.009 · · ·· · · · · · · · · · · · 0.0267±0.0013
Outer Shell 3909 0.054 0.056 1.037±0.009 · · ·3910 0.061 0.066 1.040±0.010 · · ·3911 0.075 0.082 1.042±0.013 · · ·3912 0.067 0.061 1.035±0.009 · · ·780 0.051 0.056 1.042±0.008 · · ·781 0.065 0.066 1.027±0.011 · · ·2322 0.089 0.090 1.033±0.016 · · ·· · · · · · · · · · · · 0.0279±0.0018
Inner Shell 3909 0.060 0.063 1.038±0.006 · · ·3910 0.048 0.060 1.050±0.006 · · ·3911 0.126 0.076 1.028±0.009 · · ·3912 0.057 0.085 1.038±0.006 · · ·780 0.048 0.065 1.045±0.005 · · ·781 0.058 0.067 1.061±0.007 · · ·2322 0.088 0.099 1.045±0.011 · · ·· · · · · · · · · · · · 0.0215±0.0023
Note. — The same notation used as in Table 2.a Errors do not include model uncertainties.
any differences in the inner and outer shell expansion rates are of considerable interest for understanding the complex dynamicsof the remnant.
Expansion of G11.2−0.3 at radio wavelengths was determined by comparison of 2001–2002 and 1984–1985 VLA observationsat 20 cm and 6 cm (Tam & Roberts 2003). Our newly-determined expansion rate is in better agreement with the 6 cm rate of0.029± 0.010% yr−1 than with 0.042± 0.009% yr−1 measured at 20 cm (errors quoted here are the rms deviation about theweighted mean of individual measurements along the remnant’s circumference). As discussed by Tam & Roberts (2003), it isnot clear why the radio expansion measurements at 20 cm and 6 cm do not match each other better, but significant and hard toquantify systematic effects might be important in radio interferometric observations. Expansion rates measured with Chandraare less susceptible to systematic errors than the radio rates, so we consider them more reliable.
At the shell’s outer radius of 3.0d5 pc (here d5 is the distance in units of 5 kpc), the mean blast wave speed vb becomes 810d5km s−1. (We assumed here that the blast wave radius coincides with the shell’s outer radius, but there is a possibility that theblast wave has already propagated farther out into a low-density ambient medium (Chevalier 2005). In this case, the blast wavecould have also encountered much denser gas in several directions beyond the shell, accounting for the presence of outlying H2filaments (Koo et al. 2007). However, the absence of radio or X-ray emission would then be hard to explain.) The distance toG11.2−0.3 has been estimated from H I absorption measurements, ranging from 4.4 kpc (assuming circular Galactic rotation;Green 2004) to 5.5 – 7 kpc (allowing for noncircular motions; Minter et al. 2008). When combined with uncertainties in theexpansion rate measurements, vb is somewhere within 700–1200 km s−1, corresponding to a mean shock temperature kTb of0.6–1.7 keV. This is consistent with X-ray spectra. Vasisht et al. (1996) reported an electron temperature of 0.8 keV by modelingthe ASCA spectrum of G11.2−0.3 with the nonequilibrium ionization spectral model of Masai (1984), while Roberts et al. (2003)found a lower electron temperature of 0.6 keV in the SE using the 2000 Chandra data in combination with vpshock and srcutmodels in XSPEC (Reynolds & Keohane 1999; Borkowski et al. 2001). For the small regions shown in Figure 11, our spectralfits result in temperatures ranging from 0.6 keV to 0.8 keV (Fig. 13). We find an intermediate temperature of 0.7 keV by fittingspectra of the inner and outer shell with an APEC-based plane shock model plus a power law component to account for theexcess of high-energy photons seen in X-ray spectra. (It is not clear at this time whether this excess is of thermal or nonthermalorigin, but the temperature of the bulk of X-ray emitting gas depends only weakly on how this excess is modeled.) The meanshock temperature is expected to be higher than the electron temperature in young SNRs because of the preferential heating ofions in fast collisionless shocks, so there is no obvious conflict between the measured expansion rate and temperature of theX-ray emitting gas for distances between 4.4 and 7 kpc. If d = 7 kpc then very fast (> 1000 km s−1) shocks might be present inG11.2−0.3.
8. ORIGIN OF THE AMBIENT MEDIUM AND AGE OF G11.2−0.3
The measured expansion rate of 0.0277± 0.0018% yr−1 allows us to place constraints on the remnant’s age tSNR. For a blastwave radius rb increasing as tm, vb = mrb/tSNR, and tSNR = mrb/vb. The measured expansion rate is equal to vb/rb, so tSNR = 3600myr. The upper limit to the remnant’s age is 3600 yr for undecelerated (m = 1) expansion, but significant deceleration must havetaken place in G11.2−0.3 because of its advanced dynamical age where nearly all of the SN ejecta have been shocked by now.We use self-similar Sedov models to estimate the deceleration parameter m. For expansion into uniform ISM, m = 2/5 and
Young Core-Collapse SNR G11.2−0.3 15
tSNR = 1400 yr. This might be considered as the lower limit to the remnant’s age. But Chevalier (2005) suggested that the ambientmedium in G11.2−0.3 is of circumstellar origin, and was ejected prior to the SN explosion by its progenitor. For CSM withρ ∝ r−2, produced by steady-state mass loss, m = 2/3 and tSNR increases by 5/3 to 2400 yr. The unknown density distribution ofthe ambient medium affects our estimates of the remnant’s age to a larger degree than the modest (at most 20%) errors in themeasured expansion rates.
Single low-mass CC progenitors do not have strong stellar winds and they do not lose appreciable amounts of mass prior totheir explosions. In this case, after passage through a weak stellar wind containing very little mass, the blast wave is expectedto expand into the ISM, assumed here to be uniform. (Alternatively, expansion might be into a uniform but low density bubbleblown by a fast wind during the main-sequence stage of the progenitor’s evolution.) At the Sedov stage of evolution, the swept-upISM mass Msw must be significantly larger than the ejecta mass. The mass of X-ray emitting gas in G11.2−0.3 can be estimatedfrom the X-ray emission measure EM although results are sensitive to d (assumed to be between 4.4 and 7 kpc). At d = 4.4kpc, we obtain EM = 1.0× 1059 cm−3 by fitting an X-ray Sedov model with the mean shock temperature of kTs = 0.60 keV(corresponding to a shock speed of 720 km s−1) to the shell spectrum, and scaling it up by 30% to account for the missing shellemission from the remnant’s center. (The spectral fits are not statistically acceptable, but our goal here is just to obtain roughestimates for EM. In the spatially-integrated X-ray Sedov models available in XSPEC, the amount of collisionless electronheating at the blast wave, Tes/Ts, is assumed not to vary with time, but we considered it as a free parameter in view of our poorknowledge of how electrons are heated in fast collisionless shocks. Electrons are subsequently heated downstream of the blastwave through Coulomb collisions with hot ions, so post-shock electron temperatures Te depend on the assumed kTs and fittedTes/Ts and ionization timescale τ . See Borkowski et al. (2001) for more details about these Sedov models.) With rb = 2.6 pc, thepreshock density n0 is 4 cm−3, and the mass of X-ray emitting gas is only 11 M. Since the ejecta mass Me j must be more than6 M even for the least massive (∼ 8M) CC progenitor, Msw < 5M < Me j, and the remnant cannot be in the Sedov stage ofthe evolution. In disagreement with observations, the reverse shock is unlikely to propagate all the way to the center for such adynamically young remnant. Somewhat better agreement arises if G11.2−0.3 were much farther away than 4.4 kpc. From X-raySedov model fits with kTs = 1.18
(vb/1000 kms−1)2
keV, we find that EM is nearly independent of the assumed distance. (Whenmodel parameters do not depend on d, EM ∝ d2. But here kTs ∝ v2
b ∝ d2, and the increased X-ray emissivity of the Sedov modelat higher blast wave speeds leads to an approximately constant EM.) This implies that n0 ∝ d−3/2 and M ∝ d3/2, so n0 = 3.4d−3/2
5
cm−3 and M = 13d3/25 M. At 7 kpc, n0 = 2 cm−3 and the total mass of the X-ray emitting gas is about 22 M. The ejecta mass
Me j > 6M comprises of at least ∼ 0.3 of this amount, so the remnant might still not be fully in the Sedov evolutionary stage.Progenitors significantly more massive than 8M can lose the 10–20 M present in G11.2−0.3. For a single progenitor, this
might occur through strong stellar winds, while in close binaries mass loss is further enhanced through tidal interactions. In theSedov solution with a steady-state stellar wind with ρ = Dr−2 (or n0 = Dnr−2, where Dn = D
(µmp
)−1, µ = 1.4 is the mean mass
per hydrogen atom in atomic mass units, and mp is the proton mass), the emission measure EM is equal to nenH
64πD2n
5rb(for cosmic
abundances ne/nH = 1.23). Just as for a uniform ambient medium, the mass of X-ray emitting gas and the ambient density (i.e.,D or Dn) can be found by estimating EM and rb. Since an X-ray Sedov wind model is not available in XSPEC, we assumedplane-parallel geometry but unequal electron and ion temperatures and used the plane shock models npshock and vnpshockin XSPEC in our estimates of EM (the X-ray fitting procedure is the same as described above). The estimated emission measuresare again around 1× 1059 cm−3, but the preshock densities are about half as large (n0 = 2 cm−3 at 4.4 kpc, and n0 = 0.9 cm−3
at 7 kpc) and masses are 50% higher (15–30 M) than for the uniform ambient medium. These lower density and higher massestimates are caused by differences in the model postshock density distributions (density drops more slowly with decreasingradius in the Sedov wind model than in the standard Sedov model). The wind strength is D∗ ∼ 3 (where D∗ = D/1.0× 1014 gcm−1), corresponding to M ∼ 10−4M yr−1 and vw = 15 km s−1. This is at the upper range of mass-loss rates inferred for Type IILand IIb SNe (Chevalier 2009; Smith 2014).
The post-shock density ρ increases linearly with radius in the Sedov wind model. This results in an X-ray shell with the surfacebrightness profile of 2−1/2
(1 − (r/rb)2
)1/2 (2(r/rb)2 + 1
)(we assumed here that the X-ray emissivity scales as ρ2, and normalized
the brightness to a peak of 1). The maximum surface brightness peaks at a rather small (r = 2−1/2rb) radius, and the shell is not verydistinct (the central surface brightness is lower than the peak by only 21/2). Such a thick and indistinct shell is clearly inconsistentwith the observations, since the X-ray shell in G11.2−0.3 is quite prominent and not overly broad. The density must drop quiterapidly toward the center, as evidenced by the sharp inner shell edge at several locations within the remnant. This means that theshocked masses have been overestimated, and preshock densities underestimated when using the Sedov wind model. A wind-like(n0 = Dnr−2) density distribution for the CSM appears unlikely even if one allows for departures from the Sedov wind model.(This self-similar model is only asymptotically valid in the limit when the shocked ejecta mass is negligible compared to theshocked ambient mass, while young remnants such as G11.2−0.3 might still be at earlier evolutionary stages). In order to keepEM fixed while making the shell more prominent than in the Sedov wind model, a decrease in the swept-up mass and an increasein the preshock density would have been required. These two requirements are mutually exclusive under a steady-state mass losshypothesis. Note that these estimates of preshock densities and shocked CSM masses rely on the assumption that most of theX-ray emission is produced by the swept-up CSM. This assumption is justified given the lack of evidence for enrichment in heavyelements anywhere within the remnant, even in its interior. The shocked ejecta contribution to X-rays might be nonnegligible,but very likely it is not dominant. The CSM in G11.2−0.3, if present, is likely to have a more complex density distribution thandescribed by a steady-state stellar wind.

16
A CSM origin for the swept-up gas in G11.2−0.3 still remains viable although its ambient density distribution is not welldescribed by a steady-state stellar wind. The absence of a sharp and well-defined outer boundary of the remnant might result ifthe blast wave had already overrun the slow wind of the SN progenitor. But this will not make the X-ray emitting shell moreprominent than in the Sedov wind model, and aside from a few isolated outer knots, no widespread X-ray or radio emissionis seen beyond the outer shell boundary. A subenergetic explosion might also be required since the shell velocity is ratherlow. Alternatively, the progenitor’s wind might have been less dense at the very final stages of its evolution prior to the SN,with a significant fraction of mass lost ∼ 105 yr before the explosion through a dense and slow outflow. The wind density isgenerally expected to drop with time when a single massive progenitor moves from red to blue across the HR diagram because ofheavy mass loss. The mass-loss history becomes more complex and less understood in close binaries, but steady-state mass lossbecomes even less likely. If the progenitor loses enough material to expose its helium core (or nearly expose it with a residualhydrogen envelope still present), a radiatively-driven fast wind is expected to sweep material ejected through slow and densewinds in the prior evolutionary stages into dense shells. The blast wave in G11.2−0.3 might be now moving through undisturbedCSM lost ∼ 105 yr ago when the mass loss rate was much higher than immediately prior to the explosion. Alternatively, the blastwave might be propagating through a dense swept-up shell or it might have already exited into much more tenuous gas locatedbeyond its outer boundary. In either case, the remnant’s dynamics becomes complex, and its understanding requires reliance onhydrodynamical simulations. Within the framework of such future investigations, the measured expansion of the shell is expectedto provide refined constraints on the remnant’s age and SN explosion properties.
The strongest evidence for a CSM (as opposed to ISM) origin of the swept-up ambient medium is the presence of stronglyasymmetric soft thermal emission in the interior of G11.2−0.3. Its asymmetric morphology argues strongly against an ISMorigin, as this requires a highly improbable density distribution centered around the explosion site. Strongly asymmetric massloss provides a natural explanation for this interior emission. Such interior emission might become prominent in SNR 1987Aonce its blast wave envelops its famous bright inner ring, if this ring marks the inner edge of a much larger torus. Another exampleis provided by the dusty torus in the red supergiant (RSG) WOH G64 in the Large Magellanic Cloud (Ohnaka et al. 2008). Withan initial main-sequence mass of 25 M and with a total ejected mass of 3–9 M, this RSG has already lost a significant fractionof its mass through a highly asymmetric outflow. Such a massive and asymmetric outflow is expected in close binary systemsbecause of tidal effects, although firm evidence for the presence of a binary companion in WOH G64 is still lacking (Levesqueet al. 2009). Rotation might also result in a strongly asymmetric outflow even for a single SN progenitor, and both rapid rotation(Chita et al. 2008) and binarity (Podsiadlowski et al. 1991) have been invoked as the origin of the observed CSM asymmetry inSNR 1987A.
Extreme asymmetry is expected if most mass was lost by the progenitor when it was undergoing Roche-lobe overflow. Apossible detection of a close binary companion to SN 2011dh by Folatelli et al. (2014) suggests that this is how mass was lostby the progenitor of this nearby Type IIb SN. According to the binary evolution model of Benvenuto et al. (2013), confirmedby detection of the companion, the progenitor underwent several episodes of high mass-transfer Roche-lobe overflow. The mostrecent transfer took place ∼ 105 yr prior to the explosion, so massive and asymmetric CSM is expected to be present in SN2011dh at pc-scale distances from the explosion site.
Systematic theoretical investigations of effects that strongly asymmetric outflows imprint on both SNe and SNRs are lacking.Exploratory 2D hydrodynamical simulations with a strongly asymmetric wind in the context of a Type Ia explosion indicate thatthe interior emission seen in Kepler’s SNR can be explained in this framework (Burkey et al. 2013). Like Kepler’s SNR for TypeIa explosions, G11.2−0.3 becomes important for understanding the origin of asymmetric mass loss in CC SNe. The pulsar windat its center probes the interior of the remnant, while the shocked thermal gas and IR emission provide information about boththe shocked ambient gas and the shocked ejecta. There is much to learn by studying G11.2−0.3 in more detail, but it becomesobvious that multidimensional hydrodynamical simulations are necessary to make further progress. Although Kaplan & Moon(2006) found no IR counterpart to the pulsar that might be expected in the presence of a surviving binary companion bound to thepulsar, the binary could have been disrupted by the explosion. Just as for SNR 1987A, the origin of the CSM asymmetry remainsunclear at this time.
9. PULSAR-WIND NEBULA ANALYSIS
The confirmation of a young age for G11.2−0.3, even though it cannot be the result of an event in CE 386, supports theconclusion that the pulsar was born at nearly its present period. For a constant braking index n, the true age of the pulsar is givenby
t =P
(n − 1)P
[1 −
(P0
P
)n−1]. (1)
Taking a typical braking index of 2.5 and an age estimate of 2000 yr, we find P0 = 0.96P = 62 ms, consistent with the estimate ofTorii et al. (1999), and implying an initial energy IΩ2
0/2 = 5× 1048 erg, for a moment of inertia of 1045 g cm2. Spindown withconstant magnetic field and braking index also gives the time-dependence of pulsar luminosity by
L =L0(
1 + t/τ) n+1
n−1(2)
with the slowing-down timescale τ given by
τ =2
n − 1PP
− t ∼= 60,000 yr. (3)
Young Core-Collapse SNR G11.2−0.3 17
That is, the power input into the PWN from the pulsar has been roughly constant since the supernova.We can attempt to interpret the brightness ratio between the NE jet and the bright knots in the SW jet as Doppler boosting. For
synchrotron emission with photon index Γ, the jet/counterjet brightness ratio, for jets making an angle θ with the line of sight andtraveling at speed v = βc, is
I(jet)I(counterjet)
=(
1 +β cosθ1 −β cosθ
)a
(4)
where a = Γ+ 1 for a continuous jet and a = Γ+ 2 for discrete blobs (Lind & Blandford 1985). We estimate cosθ = 0.5 from thetorus aspect ratio, and a brightness ratio of 3. Using the expression for a continuous jet, and taking the overall PWN photon indexof 1.78, we obtain β = 0.4. Using the knot value of Γ = 1.36, we find β = 0.46; and for the discrete blob exponent (with Γ = 1.36),we obtain β = 0.32. Thus mildly relativistic flow could produce the X-ray brightness ratio we see, as well as account for a similarbrightness asymmetry seen at radio wavelengths. These values of β are quite typical for pulsar torus/jet models (Ng & Romani2004). For β = 0.4, the sky-plane speed would be 5.1′′ yr−1, thus requiring about 8 yr to reach the ends of the jet. From standardsynchrotron expressions, a magnetic field of less than about 140 µG would result in a synchrotron-loss time of 8 yr or greater forelectrons radiating 8 keV photons. However, the flow would need to decelerate rapidly downstream of the bright knots, as the jetdoes not appear to expand (barring some peculiar behavior of magnetic field, such as its rapid disappearance). Rapid decelerationis in fact a consequence of the spherical MHD model of Kennel & Coroniti (1984), though the geometry here is clearly morecomplex. Some kind of magnetic braking may be involved (Komissarov & Lyubarsky 2004), as seems to be required in othercases as well. In any case, we can rule out that the knots are moving with anything like β = 0.4; they would need to be stationarystructures such as internal shocks, through which fluid passes.
We point out that while extrapolations of the PWN X-ray power-law spectrum back to the radio result in a “break” frequencyof 8 GHz with a change in slope of about 0.5, the expected value for synchrotron losses in a homogeneous source with constantelectron injection, this feature in G11.2−0.3 is unlikely to be due to losses, as it would require a magnetic field strength of about3 mG for an assumed remnant age of 2000 yr. This value would imply a loss time for 8 keV-emitting electrons less than the 8 yrestimated above by (3/0.14)−1.5, or about a month, so that the jets could not possibly extend as far as they are observed withoutclear spectral steepening.
In our interpretation, the PWN has already been compressed by the return of the reverse shock. However, unlike most otherPWNe, the much longer pulsar slowdown timescale for G11.2−0.3 means that the pulsar energy input is about the same as itsinitial value, rather than far weaker, which is more typical. We interpret the more extended radio and X-ray nebulae as theremnants of the pre-reverse-shock PWN, and the X-ray jets as more recently produced features. The integrated spectrum canthen be quite complex (Reynolds & Chevalier 1984), with multiple bends and breaks between radio and X-rays, even withoutinvoking intrinsic spectral structure in the electron distribution produced at the original pulsar-wind termination shock.
Chevalier (2005) estimates a minimum nonthermal energy for the PWN in G11.2−0.3 which implies a minimum pressure ofabout 10−10 dyn cm−2. While he approximates the PWN as a sphere, the estimate is unlikely to be dramatically in error. Itimplies a magnetic field of order 50 µG, implying an energy loss timescale of about 36 yr for 8 keV-emitting electrons. Thisin turn requires a mean flow velocity of about 20,000 km s−1 to avoid producing spectral steepening at the jet ends – less thanour inferred transrelativistic speeds for Doppler boosting in the knots, but inconsistent with the absence of outward motion ofjet ends. This minimum pressure is, however, about two orders of magnitude below the pressure to be expected in the remnantinterior if all the SN energy has been thermalized (see below). We discuss this discrepancy in the following section.
10. DISCUSSION AND CONCLUSIONS
The high visual extinction toward G11.2−0.3, obtained both from [Fe II] observations (Lee et al. 2013) and from our absorptionmeasurements toward the PWN and the shell, definitively rules out the association of G11.2−0.3 with any naked-eye event seenon Earth, in particular with the CE 386 event, unfortunately removing G11.2−0.3 from the short list of SNRs with known ages.However, our mean shell expansion rate of 0.0277± 0.0018% yr−1 gives an age in a comparable range, for a plausible range ofexpansion parameter m between 0.4 and 2/3, of 1400 – 2400 yr – comparable to the 1629 yr resulting from the CE 386 association.We confirm that G11.2−0.3 is one of the three or four youngest shell CC remnants in the Galaxy – perhaps third, behind Cas Aand Kes 75 (containing a young pulsar, with spindown age <∼ 1700 yr; Mereghetti et al. 2002, Livingstone et al. 2006).
In the PWN, we have identified a torus-like structure in radio and X-rays. Such structures are commonly seen in PWNe,but only in X-rays; a sharply defined radio torus + jet is unique to G11.2−0.3. Furthermore, the jet in G11.2−0.3 completelydominates the torus – in fact, the bulk of the X-ray PWN emission is from the jet, unlike most PWNe with jet/torus structure. Weattribute this characteristic to the very long pulsar slowdown timescale, so that the pulsar energy input is almost the same as atbirth. Mildly relativistic outflow could explain the brightness asymmetry between SW and NE jets, though this interpretation isnot without problems.
Our X-ray spatial analysis shows several anomalous features for a shell SNR. The presence of significant asymmetric interioremission requires significant departures from the simple self-similar driven wave or Sedov evolutionary phases. The sharp inneredge of the outer shell and the hard X-ray emission found near this edge are unexplained in any simple picture. No sharp X-rayrims are found, unlike all young Type Ia remnants, where they are found to have nonthermal spectra and indicate significantmagnetic-field amplification (Parizot et al. 2006). (Some CC remnants also show these rims, such as Cas A and the X-ray-synchrotron-dominated remnants G347.3−0.5 (RX J1713.7−3946) and G266.2−1.2 (RX J0852.0−4622). See Reynolds et al.(2012) for discussion and references.)
The X-ray spectrum of the shell can be reasonably well described by a thermal, plane-shock model with temperatures of 0.6 –0.8 keV, consistent with inferred shock velocities ranging from 700 km s−1 (at 4.4 kpc; Green 2004) to 1100 km s−1 (at the largest

18
allowed distance of 7 kpc; Minter et al. 2008) that are required to account for the measured expansion of the shell. The emissionmeasures from fits with a more-sophisticated X-ray Sedov model indicate a mass of X-ray emitting gas of about M = 13d3/2
5 M,too low for the remnant to be fully in the Sedov stage of evolution into a uniform medium. The bar of central emission running atroughly position angles (100 – 280) has a thermal spectrum, with no clear evidence for enhanced abundances. The presence ofthermal emission near the center of the remnant, and clear morphological correspondences between the inner thermal emissionand the PWN, indicate that the reverse shock has already returned to the center and re-shocked all the SN ejecta. Since it isexpected (e.g., Chevalier 2005) that G11.2−0.3 is expanding into a stellar wind, a reanalysis of the spectrum for a wind modelincreases the inferred shocked mass to 15 – 30 M. However, the predicted morphology of a remnant running into a uniform r−2
density profile is not consistent with the sharp shell we observe. The assumption of a smooth, spherically symmetric wind CSMis apparently far too simple to explain what we see in G11.2−0.3.
We summarize here the scenario we propose for this complex object. We adopt Chevalier’s (2005) classification of G11.2−0.3as resulting from a category of supernovae exploding after losing most of their envelopes (several solar masses) prior to explosion.Such substantial mass loss is likely to be quite asymmetric, perhaps due to a binary companion, and we invoke the possibility ofa disk wind.
After the explosion, the supernova blast wave has encountered this lost mass, both radially and azimuthally inhomogeneous,and has by now swept up of order 10 solar masses. The density currently just ahead of the blast wave is quite low, resulting in adiffuse rather than sharp outer edge of shell emission. The reverse shock has moved all the way back to the center, reheating allejecta, but CSM inhomogeneities have left characteristic imprints, such as the sharp inner edges of the outer shell visible in somelocations and the limb-brightened hard X-ray emission in the remnant’s interior. We interpret the presence of hard X-rays nearthe inner edge of the remnant’s outer shell as evidence for an abrupt change in the density distribution of the ambient CSM. Thisis consistent with the sharp inner edge of the shell. The shocked low-density gas in the interior of the remnant, including the bulkof the SN ejecta, does not radiate as efficiently as the much denser material in the outer shell, so it is difficult to detect its faintthermal X-ray emission against the bright shell. Only the most dense shocked ambient gas is visible in thermal X-rays as theanomalous bar of interior emission. X-ray emission from the more tenuous gas is clearly seen only at high photon energies wheregas in the shell radiates less efficiently because of its low (0.6 – 0.8 keV) temperature. This emission might be of nonthermalorigin. (Electrons radiating 8-keV synchrotron photons can survive for∼ 1000 yr if B<∼ 5 µG, as might be true in the low-densityinterior. Internal diffuse X-ray synchrotron emission is also seen in the comparably-aged remnant RCW 86 [Williams et al. 2011],a remnant thought to result from a cavity explosion.) Shocked ejecta have been unambiguously detected only in some very denseclumps which have cooled and are the source of the observed [Fe II] near-IR emission. The pulsar was born with a very lowvelocity and is still near the remnant center. The PWN it produced has been compressed by the return of the reverse shock, but ina fairly symmetrical fashion. The pulsar continues to inject relativistic fluid into the PWN, in a jet/torus configuration in whichthe jets, rather than the torus, are the most apparent.
This scenario can accommodate most of what is known about G11.2−0.3, but leaves many important questions unanswered.Most prominent is the nature of the mass lost: evidently its spatial distribution is uneven in all respects. The inferred densitydiscontinuity in the CSM density distribution points to a major change in the nature of mass loss after ejection of the bulk ofthe stellar envelope in slow and dense outflows. It is possible that the progenitor was a compact blue star at the time of theexplosion, with only a residual hydrogen envelope left on top of its nearly stripped helium core. This would have resulted in a(compact) cIIb SN (Chevalier & Soderberg 2010) instead of a IIL or an (extended) eIIb SN expected for much larger red or yellowsupergiant progenitors that suffered substantial but not so extreme mass loss. Alternatively, the entire H envelope might havebeen stripped, and the SN was of Type Ibc. Most Type cIIb/Ibc SNe arise from explosions of tidally-stripped binary progenitorswith main-sequence masses less than ∼ 25M rather than from explosions of the classical Wolf-Rayet stars originating in moremassive stars (Smith 2014). The progenitor of G11.2−0.3 was likely a low-mass He star in a close binary system, possibly witha residual H envelope still present as inferred and modeled for the Type cIIb SN 2008ax (Chevalier & Soderberg 2010; Folatelliet al. 2015). Such compact progenitors of Type cIIb/Ibc SNe lose mass in fast stellar winds that compress denser and moreslowly moving material ejected in the prior evolutionary stages into dense shells, with the low-density shocked fast wind fillingthe interiors of these shells. Their strong ultraviolet radiation heats dust that is present in these shells. Progenitor systems similarto what we infer for G11.2−0.3, consisting of a low-mass He star, a binary companion that is necessary to strip the H envelope,and a compact IR-emitting shell, are likely present among many compact circumstellar bubbles discovered by Spitzer that arepowered by massive stars (Wachter et al. 2010; Gvaramadze et al. 2010; Flagey et al. 2014).
The nature of interior material is, however, still debatable. While CSM in a disk is a likely arrangement for strongly asymmetricdense CSM swept up by the fast wind of a stripped-envelope progenitor, it is also possible that this material is highly asymmetricejecta. While spectral analysis does not show obvious heavy-element enhancements anywhere in G11.2−0.3, a mixture of shockedCSM and ejecta might not show clear spectral signatures, particularly if the ejecta were much cooler than the CSM. A mechanismfor producing such asymmetric ejecta is unknown at this time.
The thermal pressure in the outer shell is several ×10−8 dyn cm−2, and we expect a comparable central pressure if all theSN energy has been thermalized. The estimate of a central thermal pressure of at least ∼ 10−8 dyn cm−2, which results fromthe assumption that only mild pressure variations are present within the interior of G11.2−0.3, causes serious difficulties ininterpreting the PWN. We showed above that the minimum (equipartition) nonthermal pressure in the PWN is two orders ofmagnitude less. Now there is no guarantee that equipartition must hold. However, if the magnetic energy dominates, bringing thePWN pressure up to the central thermal pressure would require a magnetic-field strength of about 0.6 mG, in which synchrotronlifetimes of 8 keV-emitting electrons would be only one year – clearly at odds with the lack of spectral steepening in the jets(which are 2 – 3 lt-yr long). The maximum magnetic-field strength consistent with that constraint is about 0.2 mG, providingonly one-tenth the required pressure. If the PWN is particle-dominated, not an impossibility, the magnetic-field strength is

Young Core-Collapse SNR G11.2−0.3 19
basically unconstrained. 3-D relativistic MHD simulations (Porth et al. 2014) show that magnetic dissipation can lower themagnetic energy to a small fraction of the particle energy. These simulations also show that a young PWN is a complex object,with strong departures from symmetry in magnetic-field strength and (to some extent) in pressure, so all conclusions drawn fromassumptions of spherical symmetry should be regarded as provisional.
The high external pressure also implies a pulsar-wind termination shock radius given by
rs =(
E4πcPext
)1/2
∼ 0.01 pc (5)
or about 0.5′′, far smaller than the size of the torus – but given the drastic oversimplifications (mainly spherical symmetry) underwhich this simple estimate is obtained, perhaps this is not a concern. In any case, the inner edge of the torus, where the shockwould be located, could well be at a much smaller radius.
The inferred thermal pressure, while high, implies a low explosion energy for a distance of 4.4 kpc: ESN ∼ 2×1050 erg. (Weaccounted for the kinetic energy of the shell in our estimates of the explosion energy but it is a minor (20%–25%) contribution tothe total energy budget.) This estimate scales with the volume, or more accurately, ESN = 2.5×1050d7/2
5 erg; at 7 kpc it rises byabout a factor of 4, more consistent with a typical CC explosion. It is possible that the outer shell we observe is not the outermostextremity of the SNR. In addition to a few obvious knots at larger radii, it is possible that hot thermal material is able to “leak”through the shell in spots, where if the density is sufficiently low it might not be readily detectable in X-rays or infrared. However,it would be more difficult to hide such material from a deep radio image, so it would be worthwhile to revisit G11.2−0.3 withthe greatly enhanced capabilities of the JVLA to (among other goals) search for such a halo. If present, this halo might also shedlight on the origin of outlying H2 filaments found by Koo et al. (2007). It is possible that these filaments mark locations wherethe blast wave has encountered much denser than average material after breaking through the shell.
The ejecta of a stripped-envelope SN contain little (if any) H, while dense CSM swept up by the blast wave consists mostly ofH. The shocked CSM and the shocked ejecta in G11.2−0.3 can be distinguished by the presence or absence of H lines in theirnear-IR spectra and by their kinematics. Koo et al. (2007) detected the Brγ line in a spectrum of the brightest emission filamentin the SE, and H2 emission lines in a spectrum of a spatially-localized region in the S, so the emission there comes mostly fromshocked CSM. Highly blueshifted (∼ 1000 km s−1) knots near the center are devoid of H (Moon et al. 2009), consistent withejecta of a stripped-envelope SN. The shocked, H-rich CSM has been accelerated by the blast wave, but its velocity is expected tobe at most one or two hundred km s−1, far less than the ∼ 1000 km s−1 found for the H-poor ejecta. Moon et al. (2009) proposedthat the ejecta are rich in Fe, but other elements such as He might still be dominant. (The upper limit to the strength of the He I1.083 µm line cited by Moon et al. (2009) is not particularly constraining.) Deeper spectra are needed in order to learn moreabout the composition of the IR-emitting ejecta, but we predict that little (if any) H will be found within the SN ejecta.
Further understanding of this interesting object will require multi-dimensional hydrodynamic simulations, which can test someof the features of our proposed scenario. Additional observational efforts in radio and in near-IR are the most likely to castadditional light. A search for a possible surviving binary companion would be quite challenging but, if successful, wouldbe a major advance. G11.2−0.3 serves as additional evidence, if any were needed, that supernovae, and their remnants, arefundamentally three-dimensional objects, and their full understanding will require three-dimensional theory.
This work was supported by NASA through the Chandra General Observer Program grant GO3-14076A. We are grateful toCindy Tam for reduction of the VLA data. We acknowledge help from Andrew Moseby in reprocessing and preparing Chandradata of G11.2−0.3 for analysis. The scientific results reported in this article are based on observations made by the Chandra X-rayObservatory, and by the Karl G. Jansky Very Large Array at the National Radio Astronomy Observatory. The National RadioAstronomy Observatory is a facility of the National Science Foundation operated under cooperative agreement by AssociatedUniversities, Inc. This research has made use of software provided by the Chandra X-ray Center (CXC) in the applicationspackages CIAO and ChIPS. We acknowledge use of various open-source software packages for Python, including Numpy, Scipy,Matplotlib, Astropy (a community-developed core Python package for Astronomy), and APLpy5.
REFERENCES
Andersen, M., Rho, J., Reach, W. T., Hewitt, J. W., & Bernard, J. P. 2011, ApJ, 742, 7Arendt, R. G. 1989, ApJS, 70, 181Arnaud, K. A. 1996, in Astronomical Data Analysis and Systems V, eds. G. Jacoby & J. Barnes, ASP Conf. Series, v.101, 17Becker, R. H., Markert, T., & Donahue, M. 1985, ApJ, 296, 461Benvenuto, O. G., Bersten, M. C., & Nomoto, K. 2013, ApJ, 762, 74Borkowski, K. J., Lyerly, W. J., & Reynolds, S. P. 2001, ApJ, 548, 820Burkey, M., Reynolds, S. P., Borkowski, K. J., & Blondin, J. M. 2013, ApJ, 764:63Carlton, A. K., Borkowski, K. J., Reynolds, S. P., et al. 2011, ApJ, 2011, 737:L22Cash, W. 1979, ApJ, 228, 939Chevalier, R. A. 2005, ApJ, 619, 839Chevalier, R. A. 2009, in Proc. Space Telescope Science Institute Symposium Series No. 20, Eds. M. Livio & E. Villaver (Cambridge University Press), 199Chevalier, R. A., & Soderberg, A. M. 2010, ApJ, 711, L40Chita, S. M., Langer, N., van Marle, A. J., García-Segura, G., & Heger, A. 2008, A&A, 488, L37Cornwell, T., Braun, R., & Briggs, D. S. 1999, Synthesis Imaging in Radio Astronomy II, 180, 151Downes, A. 1984, MNRAS, 210, 845
5 APLpy is an open-source plotting package for Python hosted at http://aplpy.github.com

20
Flagey, N., Noriega-Crespo, A., Petric, A., & Geballe, T. R. 2014, AJ, 148, 34Folatelli, G., Bersten, M. C., Benvenuto, O. G., et al. 2014, ApJ, 793:L22Folatelli, G., Bersten, M. C., Kuncarayakti, H., et al. 2015, ApJ, 811:147Foster, A. R., Ji, L., Smith, R. K., & Brickhouse, N. S. 2012, ApJ, 756, 128Froebrich, D., Makin, S. V., Davis, C. J., et al. 2015, MNRAS, 454, 2586Giannini, T., Antoniucci, S., Nisini, B., et al. 2015, ApJ, 798:33Green, D. A. 2004, BASI, 32, 335Green, D. A. 2011, BASI, 39, 289Green, D. A., Gull, S. F., Tan, S. M., & Simon, A. J. B. 1988, MNRAS, 231, 735Grevesse, N., & Sauval, A. J. 1998, Space Sci. Rev., 85, 1Gvaramadze, V. V., Kniazev, A. Y., & Fabrika, S. 2010, MNRAS, 405, 1047Hester, J. J. 2008, ARA&A, 46, 127Kaplan, D. L., & Moon. D.-S. 2006, ApJ, 644, 1056Kaspi, V. M., Roberts, M. S. E., Vasisht, G., et al. 2001, ApJ, 560, 371Kennel, C. F., & Coroniti, F. V. 1984, ApJ, 283, 694Kilpatrick, C. D., Bieging, J. H., & Rieke, G. H. 2016, ApJ, 816:1Komissarov, S. S., & Lyubarsky, Y. E. 2004, MNRAS, 349, 779Koo, B.-C., & Lee, Y.-H. 2015, PKAS, in Proc. 12th Asia-Pacific Regional IAU Meeting (arXiv:1502.00048)Koo, B.-C., Moon, D.-S., Lee, H.-G., et al. 2007, ApJ, 657, 308Kothes, R., & Reich, W. 2001, A&A, 372, 607Krishnamurthy, K., Raginsky, M., & Willett, R. 2010, SIAM J. Imaging Sci., 3, 619Lee, H.-G., Moon, D.-S., Koo, B.-C., et al. 2013, ApJ, 770, 143Levesque, E. M., Massey, P., Plez, B, & Olsen, K. A. G. 2009, AJ, 137, 4744Lind, K., & Blandford, R. D. 1985, ApJ, 295, 358Livingstone, M. A., Kaspi, V. M., Gotthelf, E. V., & Kuiper, L. 2006, ApJ, 647, 1286Masai, K., 1984, J. Quant. Spectrosc. Rad. Transf., 51, 211Mereghetti, S., Bandiera, R., Bocchino, F., & Israel, G. L. 2002, ApJ, 574, 873Minter, A. H., Camilo, F., Ransom, S. M., Halpern, J. P., & Zimmerman, N. 2008, ApJ, 676, 1189Moon, D.-S., Koo, B.-C., Lee, H.-G., et al. 2009, ApJ, 703, L81Ng, C.-Y., & Romani, R. W. 2004, ApJ, 601, 479Ohnaka, K., Driebe, T., Hofmann, K.-H., Weigelt, G., & Wittkowski, M. 2008, A&A, 484, 371Parizot, E., Marcowith, A., Ballet, J., & Gallant, Y. A. 2006, A&A, 453, 387Pinheiro Gonçalves, D., Noriega-Crespo, A., Paladini, R., Martin, P. G., & Carey, S. J. 2011, AJ, 142, 47Podsiadlowski, P., Fabian, A. C., & Stevens, I. R. 1991, Nature, 354, 43Porth, O., Komissarov, S. S., & Keppens, R. 2014, MNRAS, 438, 278Reach, W. T., Rho, J., Tappe, A., et al. 2006, AJ, 131, 1479Reynolds, S. P., Borkowski, K. J., Green, D. A., et al. 2009, ApJ, 695, L149Reynolds, S. P., & Chevalier, R. A. 1984, ApJ, 278, 630Reynolds, S. P., Gaensler, B. M., & Bocchino, F. 2012, SpSciRev, 166, 231Reynolds, S. P., & Keohane, J. W. 1999, ApJ, 525, 368Reynolds, S. P., Lyutikov, M., Blandford, R. D., & Seward, F. D. 1994, MNRAS, 271, L1Roberts, M. S. E., Lyutikov, M., Gaensler, B. M., et al. 2005, in “X-Ray and Radio Connections” (eds. L.O. Sjouwerman and K.K. Dyer), published
electronically by NRAO (http://www.aoc.nrao.edu/events/xraydio)Roberts, M. S. E., Lyutikov, M., Kaspi, V. M., & Tam, C. R. 2004, BAAS, 36, 1522Roberts, M. S. E., Tam, C. R., Kaspi, V. M., et al. 2003, ApJ, 588, 992Rots, A. 2009, Determining the Astrometric Error in CSC Source Positions, http://cxc.harvard.edu/csc/memos/files/Rots_CSCAstrometricError.pdfSalmon, J., Harmany, Z., Deladalle, C.-A., & Willett, R. 2014, J. Math. Imaging Vis., 48, 279Sault, R. J., & Killeen, N. E. B. 1999, The MIRIAD User’s Guide (Sydney: ATNF)Smith, N. 2014, ARA&A, 52, 487Smith, R. K., Brickhouse, N. S., Liedahl, D. A., & Raymond, J. C. 2001, ApJ, 556, L91Stephenson, F. R., & Green, D. A. 2002, Historical Supernovae and their Remnants (Oxford: Oxford University Press)Tam, C., & Roberts, M. S. E. 2003, ApJ, 598, L27Tam, C., Roberts, M. S. E., & Kaspi, V. M. 2001, ApJ, 572, 202Torii, K., Tsunemi, H., Dotani, T., & Mitsuda, K. 1997, ApJ, 489, L145Torii, K., Tsunemi, H., Dotani, T., et al. 1999, ApJ, 523, L69Vasisht, G., Aoki, T., Dotani, T., Kulkarni, S. R., & Nagase, F. 1996, ApJ, 456, L59Vink, J. 2008, ApJ, 689, 231Wachter, S., Mauerhan, J. C., Van Dyk, S. D., et al. 2010, AJ, 139, 2330Weingartner, J. C., & Draine, B. T. 2001, ApJ, 548, 296Williams, B. J., Blair, W. P., Blondin, J. M., et al. 2011, ApJ, 741:96


![arXiv:cs/0110053v1 [cs.IR] 26 Oct 2001 - arXiv.org e … particular, this means that metadata such as e.g. publication date, document type, publication source, etc. is not assumed](https://static.fdocuments.in/doc/165x107/5aaa17cb7f8b9a7c188dab4e/arxivcs0110053v1-csir-26-oct-2001-arxivorg-e-particular-this-means.jpg)


