Acceptance Quality Limits and Visual Inspection
27
PDA: A Global Association Acceptance Quality Limits and Visual Inspection Robert Miller, Pfizer Inc. Pfizer Global Quality, Visual Inspection [email protected]
Transcript of Acceptance Quality Limits and Visual Inspection

PDA: A Global Association
Acceptance Quality Limits and Visual Inspection
Robert Miller, Pfizer Inc. Pfizer Global Quality, Visual Inspection [email protected]

Objective/Agenda
“Understand the use of acceptance sampling along with visual inspection to reduce risk“
• Introduction • Requirements • AQL defined, OC curves, UQL defined • Lot Size and Common mistakes • Current Topics and Usage of AQLs • Final Thoughts
2

Introduction • Acceptance Sampling – uses statistical sampling to determine
whether to accept or reject a production lot of material. • Brief History
– 100% Inspection was (is) too costly – Became common during WWII, Mil-Std-105 – Allowed buyers to make decision to accept or reject – Same principle for incoming materials for aseptic processing
• 100% Inspection – Sampling after 100% inspection provides a final Quality Control evaluation, tests the effectiveness of the 100% inspection and may reveal special cause situations.
Sample – Inspect – Apply decision rule – Accept or Reject
3
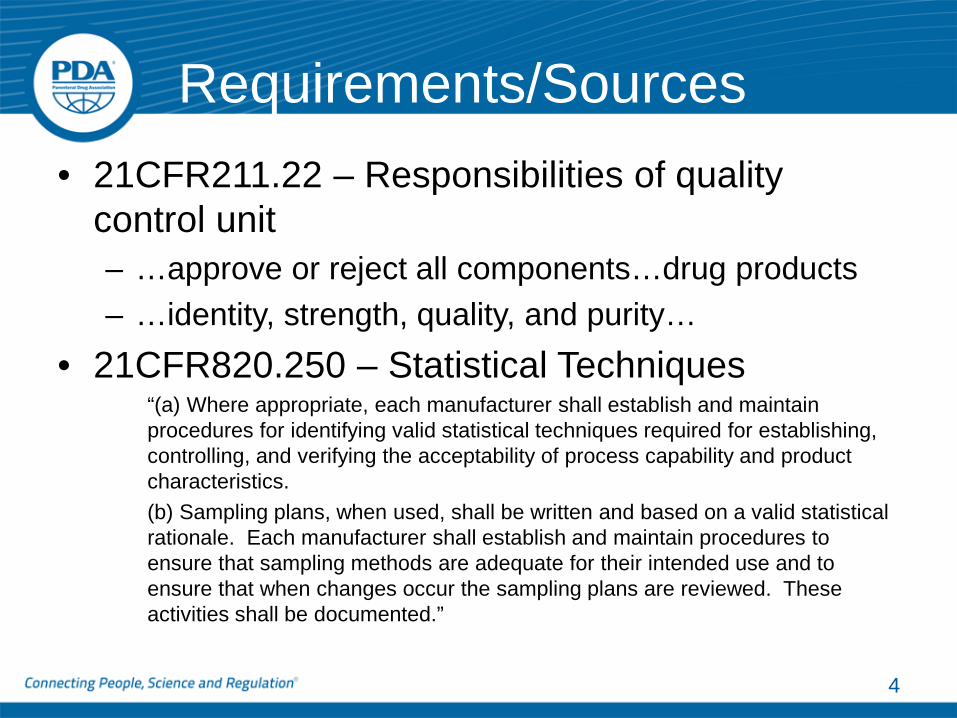
Requirements/Sources • 21CFR211.22 – Responsibilities of quality
control unit – …approve or reject all components…drug products – …identity, strength, quality, and purity…
• 21CFR820.250 – Statistical Techniques “(a) Where appropriate, each manufacturer shall establish and maintain procedures for identifying valid statistical techniques required for establishing, controlling, and verifying the acceptability of process capability and product characteristics. (b) Sampling plans, when used, shall be written and based on a valid statistical rationale. Each manufacturer shall establish and maintain procedures to ensure that sampling methods are adequate for their intended use and to ensure that when changes occur the sampling plans are reviewed. These activities shall be documented.”
4

Uses
• Sampling for incoming material release. – Tailgate sample, random sample*
*“A sampling method in which all members of a group (population or universe) have an equal and independent chance of being selected.”
• Part of the 100% visual inspection process of finished goods.
5

AQL Defined
• Acceptance Quality Limit ”The AQL is the quality level that is the worst tolerable process average when a continuing series of lots is submitted for acceptance sampling”*
6
* ANSI/ASQ Z1.4 R2013

AQL Defined • 0.65% AQL Quality Statement
“If you sample 800 and use the acceptance criteria of accept on 10, reject on 11, you have ~95% probability of accepting the batch if it contains 0.65% defects or less”
7
95% Probability of Accepting

What determines the plan? • Specifications
– Required quality level – Destructive/non-destructive testing – Customer Expectations – Regulatory/Compendial Requirements
• Acceptance Sampling Plan – ANSI Plans – Binomial Distribution – Evaluation of Risk (95% probability of accepting?)
8

Acceptance Sampling Plans • The purpose of an acceptance sampling plan is to make
accept/reject or pass/fail decisions without evaluating all units.
• Reject/Fail – Hold, reinspect, reprocess. • Accept/Pass – Release.
• Plans are defined by two parameters: – N=800 (sample size) – A=10 (accept number) – This is an ANSI/ASQ plan for a 0.65% AQL
9

What do the numbers mean? • Related to the binomial distribution.
– It provides the probability of finding a number of units (Accept Number) in a sample (N) when the population has a percentage defects (AQL).
• Single Sampling Plan n=800 A=10. – Statistically significant (95%) chance of accepting a
batch with 0.65% defects. – Routinely (95% of the time) chance of accepting a
batch with 0.65% defects. 10
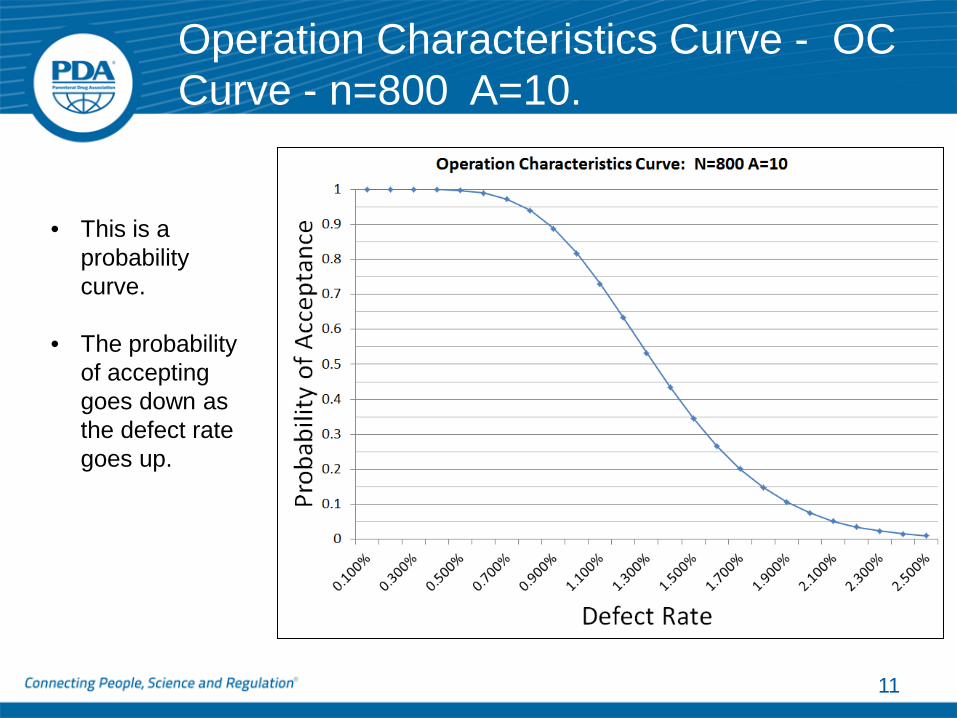
Operation Characteristics Curve - OC Curve - n=800 A=10.
11
• This is a probability curve.
• The probability of accepting goes down as the defect rate goes up.
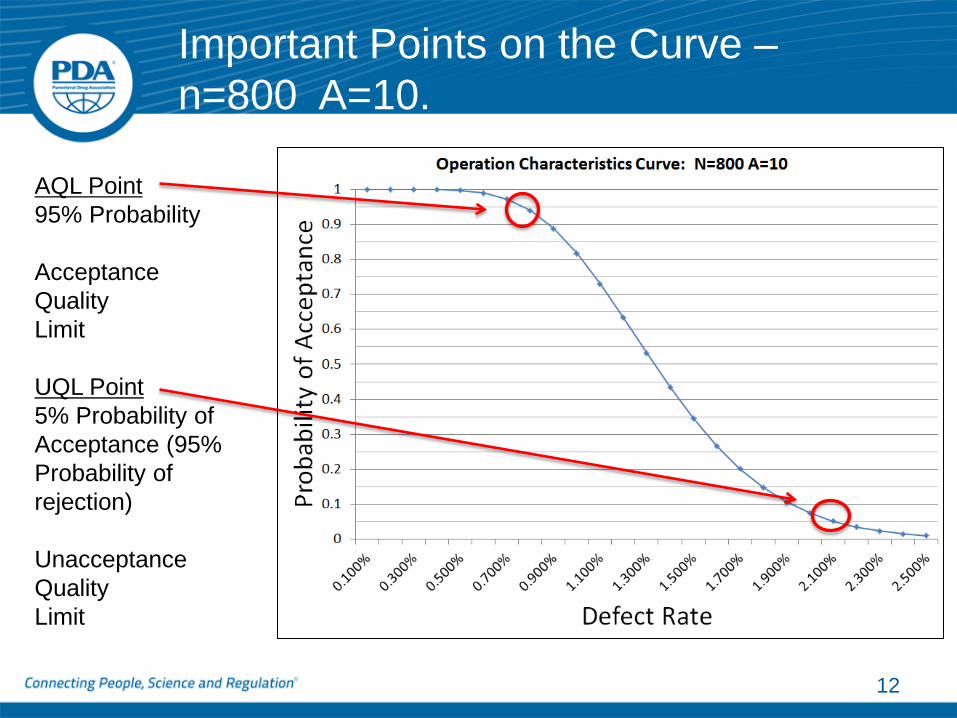
Important Points on the Curve – n=800 A=10.
12
AQL Point 95% Probability Acceptance Quality Limit UQL Point 5% Probability of Acceptance (95% Probability of rejection) Unacceptance Quality Limit

AQL vs. UQL • Acceptance Quality Limit – Represents the
percentage of defects routinely accepted.
• Unacceptable Quality Limit – Represents the percentage of defects routinely rejected. – Also referred to as RQL, LTPD or LQ – Commonly 90% or 95% probability of rejection.
13

Protection that the plan provides
• Sampling 800 and accepting the batch with 10 units. – Routinely (95%
of the time) accepts batches that are <=0.77% defective.
– Routinely (95% of the time) rejects batches that are >=2.1% defective
14
95%+
<=0.77% >=2.1%
Note: AQL of 0.77% is true 95% value, if you use the ANSI/ASQ plan with a Defect rate of 0.65% you would have a 98% probability of acceptance.

Selecting Plans
15
• ANSI/ASQ Z1.4 – 0.65% Plans
*Wayne Taylor
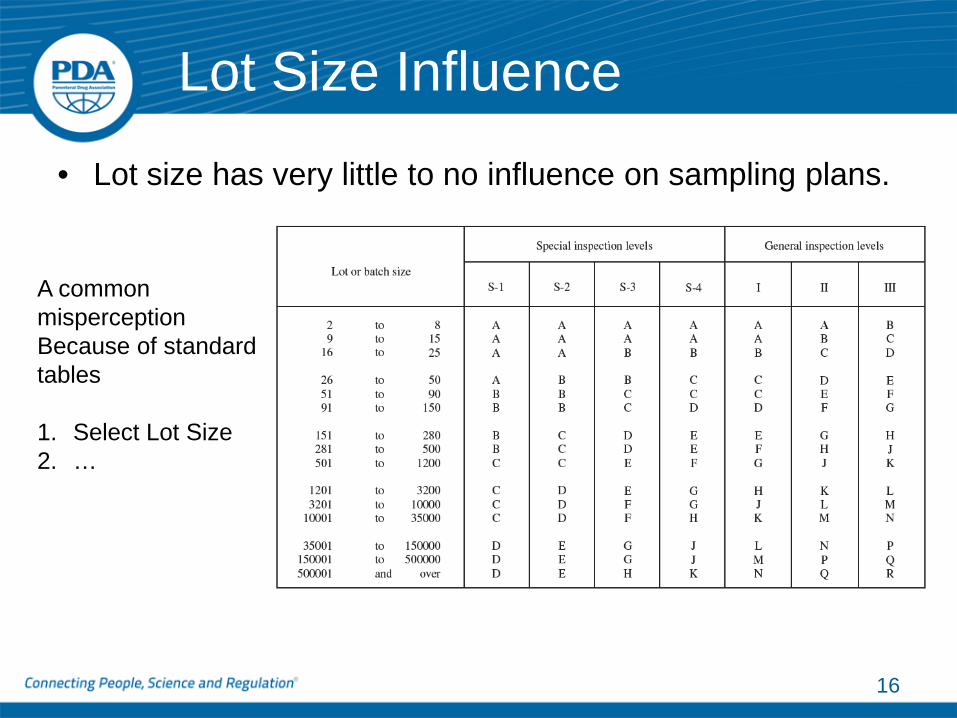
Lot Size Influence
• Lot size has very little to no influence on sampling plans.
16
A common misperception Because of standard tables 1. Select Lot Size 2. …

Lot Size Influence
1. Select Lot Size.
2. Sample size is related to lot size.
3. Read Accept/Reject Criteria.
17
XX WRONG XX

• Down Arrow Note is commonly overlooked. • Minimum sample size is necessary to achieve lower AQL
levels. 18
Lot Size Influence
These are Not valid

Statistical Inference from Sampling
19
Defect Rate 1 in 800
Pass an AQL of 0.65% Fail an AQL of 0.015%
What can we learn from Two samples of 800 units?
Defect Rate 1 in 800
Pass an AQL of 0.65% Fail an AQL of 0.015%
We can infer from these samples The same information.
The quantity in the population Is irrelevant to what we can infer From the sample.

Recommendations
20
• Understand the OC curves and protection they provide for both AQL and UQL.
• Realize an AQL of 0.65% means routinely accepting lots with 6500 ppm defect rate.
• Understand the sample size is unrelated to population size (in most situations).

Topics: Recommended Levels
• General Industry Ranges • Critical Acceptance drives the sample size. For example
to achieve a 0.015% AQL, you must sample 800.
21 *Proposed USP <1790>

Topics: USP 790
Sampling at Batch Release (After 100% Manufacturing Inspection)
Sample and inspect the batch using ANSI/ASQ Z1.4 (or ISO 2859-1). General Inspection Level II, single sampling plans for normal inspection with and AQL of 0.65%. Alternate sampling plans with equivalent or better protection are acceptable. NMT the specified number of units contains visible particulates.
22
Note the prerequisite. Note the minimum.

Thoughts
• This should not be considered a target. • Comprehensive particle reduction is still regulatory
expectation. • The pre-requisite (after 100% inspection) contains a vast
amount of work. • Doesn’t preclude the necessary particle
characterizations and elimination. • Opinion: Extrinsic and Atypical particles
23
95% Probability of Accepting

Topics: Uses of tightened AQL.
When Batches fail defect alert limits. • Indication of special
cause variation from filling/freeze dry.
• Inspection is not necessarily deficient, but may want a sampling plan that reduces risk.
24
Accept Reject

Topics: Uses of tightened AQL.
25
When Initial AQL fails. • Indication that overall
lot quality is not acceptable.
• Indication that inspection was not effective.
• Re-inspect with another tightened AQL.
25
Accept Reject

Review • Acceptance Sampling is a method to evaluate quality
(and measure inspection effectiveness). – If you are failing your acceptance criteria, your quality is worse
than the AQL. – Quality must be established in the overall process, not by relying
on culling defects.
• Understand the % defects that are routinely accepted and routinely rejected by your sampling plans.
• Evaluate capabilities vs. AQL levels for suppliers and finished goods.
26

27
Questions?