ACCELERATION OF FISH SAUCE FERMENTATION - …digitool.library.mcgill.ca/thesisfile60539.pdf · ·...
115
( ( ( \. ACCELERATION OF FISH SAUCE FERMENTATION USING PROTEOL YTIC ENZYMES by Ravipim Chaveesuk A thesis sumitted to the Faculty of Graduate Studies and Research in partial fulfilment of the requirements for the degree of Master of Science. Department of Food Science and Agricultural Chemistry Macdonald Campus of McGiII University Montreal, P.Q., Canada July, 1991
Transcript of ACCELERATION OF FISH SAUCE FERMENTATION - …digitool.library.mcgill.ca/thesisfile60539.pdf · ·...

(
(
( \.
ACCELERATION OF FISH SAUCE FERMENTATION USING PROTEOL YTIC ENZYMES
by
Ravipim Chaveesuk
A thesis sumitted to the Faculty of Graduate Studies and Research in partial fulfilment of the requirements for the
degree of Master of Science.
Department of Food Science and Agricultural Chemistry Macdonald Campus of McGiII University
Montreal, P.Q., Canada
July, 1991

i
ABSTRACT
Fish sauce fermentation is widely used in Southeast Asia as a means of
preservation and producing valued added products from underutilized fish species. First
grade and second grade Nampla, commercially produced Thai fish sauces, were analyzed
for their chemical and microbiologie al composition. First grade commercially produced
Nampla contained higher amounts of total nitrogen, formol nitrogen, free and total amino
acids compared to second grade sauce. Most of the essential amine acids were present
in both grades of sauces. Low microbial counts of halotolerant microorganisms were
observed in both sauces. The use of trypsin and chymotrypsin to accelerate the rate of
fish sauce fennentation produced from herring, one of the underutilized fish species in
( Quebec, was investigated. Results showed that supplementation with trypsin and
chymotrypsin increased significantly the rate of proteolysis, the amounts of total nitrogen,
formol nitrogen and free amine acids in the final fish sauces (p<0.05). Fennentation time
was aIso reduced from 6-12 months to 2 months. A significant increase in total nitrogen
and free amino acid contents in the end products was observed when the enzyme
concenttation was increased from 0.3% to 0.6% (p<0.05). Supplementation with 0.6%
of 25:75 trypsin:chymotrypsin showed the most satisfactory results in terms of total
nitrogen, formol nitrogen and free amino acid contents. However, the levels of free
amine acids and volatile bases in herring sauces produced with various proponions of
0.6% trypsin and chymottypsin were significantly lower than in first grade commercially
produced Nampla. Results of sensory evaluation indicated that supplementation with
( '~
various proponions of 0.6% trypsin and chymottypsin did not result in a significant

ii
difference in the preference for color, aroma and flavor (p>O.05). The lighter col or of
herring sauces produced with 0.6% enzyme supplement was preferred to the darker color
of rtrst grade commercial produced Nampla. However, there was no significant difference
in the preference for aroma and flavor among enzyme suppkmented sauces and first
grade commercially produced Nampla. Microbiological composition of herring sallr.es
produced with enzyme supplementation was similar to that observed from commercially
produced Nampla.

iii
1 RESUME
...
La fermentation est largement utilisée dans le sud-est de l'Asie comme moyen de
préservation et de production de la sauce de poisson, constituant un produit à valeur
ajoutée fait à partir d'e:.pèces de poisson sous-utilisées. Des échantillons de première et
de deuxième qualité de "Nampla", des sauces de poisson thailandaise!. produites
commercialement, furent analysés au niveau de leur composition chimique et
microbiologique. Le "Nampla" de première qualité contient des quantités plus élevées
d'azote total. d'azote formolé, d'acides aminés totaux et libre~ comparativement à la sauce
de deuxième qualité. La plupart des acides aminés essentiels étaient présents dans les
deux types de sauce étudiés. Les dénombrements bactériens d'organismes tolérants aux
{ concentrations élevées en sels furent quantitativement peu élevés. L'utilisation de la ",
trypsine et de la chymotrypsine afin d'augmenter le taux de fermentation de la sauce de
poisson produite à partir du hareng, une des espèces sous-utilisée du Québec, fut étudiée.
Les résultats montrent que l'addition de trypsine et de chymotrypsine augmente
significativement le taux de protéolyse. la quantité d'azote total, d'azote formolé, et
d'acides aminés libres dans le produit final (p<0.05). Le temps de fermentation a été
réduit de 6-12 mois à 2 mois. Une augmentation significative du contenu en azote total,
en azote formolé, et en acides aminés libres dans le produit final fut observée lorsque la
concenttation d'enzyme passait de 0.3% à 0.6% (p<0.05). L'addition de 0.6% d'un
mélange de trypsine et de chymotrypsine (25:75 respectivement) a donné les résultats les
plus satisfaisants au niveau des contenus en azote total, azote fonnolé, et acides aminés ,.. Il -, libres. Toutefois, les taux d'acides aminés libres et de bases volatiles dans les sauces

, !
iv
produites à partir de hareng avec différentes proportions de trypsine/chymotrypsine (0.6%)
étaient significativement plus bas que ceux obtenus avec la sauce "Nampla" produite
commercialement (première qualité). Les résultats de l'évaluation sensorielle indiquent
que l'addition de différents mélanges à 0.6% de trypsine, et de chymotrypsine ne pennet
pas de déterminer des différences significatives au niveau des préférences pour la couleur,
l'arôme, et la saveur (p>O.05). La couleur plus pâle des sauces de hareng produites avec
l'addition d'enzyme à 0.6% a été préférée à la couleur plus foncée de la sauce "Nampla"
commerciale de première qualité. Cependant, il n'y a pas de différences significatives au
niveau de la préférence pour l'arôme et la saveur entre les sauces produites avec
l'addition d'enzyme et la sauce "Nampla" de première qualité. La composition
bactérienne des sauces produites par addition d'enzyme était similaire à celle observée
pour les sauces "Nampla" produites commercialement. ",'

(
(
(
v
ACKNOWLEDGEMENTS
1 wish to express my deepest gratitude to Dr. J.P. Smith for his invaluable
guid:lnce, encouragement and patience throughout the course of this study, paniculary
during the preparation of the thesis. 1 am also very grateful to Dr. B.K. Simpson for bis
useful advice and his kindness in letting me use his laboratory instruments. My
appreciation is also extended to Dr. T. John for his helpful guidance in sensory
evaluation.
Special thanks go to my friends in Food Science and Agricultural Chemistl'y,
Macdonald Campus of McGill University for their help and suppon during this study.
My sincere thanks are aIso extended to a11 participants who were taking their time and
effon panicipation in the sensory test.
1 am finaIly indebted to Canadian International Development Agency (CIDA) for
the financial fundmg without which this study would never be made possible.

r r l'
> *,
. l " "
...... , ,
TABLE OF CONTENTS
ABSTRACT
RESUME
ACKNOWLEDGEMENTS
TABLE OF CONTENTS
LIST OF TABLES
LIST OF FIGURES
1:0 LITERATURE REVIEW
1.1. Introduction
1.2. Fish sauce
1.3. Fish sauce production
1.3.1. Types of sauce and methods of production
1.3.2. Raw materiai~
1.4. Chemical and nutritional composition of fish sauce
1.5. Role of salt
1.6. Role of proteolytic enzymes in fish sauce fermentation
1.6.1. Endogenous fish enzymes
1.6.1.1. Digestive enzymes
1.6.1.2. Muscle tissue enzymes
1.6.2. Microbial enzymes
1.7. Proteolytic changes during the fennentation of fish sauce
vi
Page
iii
v
vi
x
xiii
3
4
4
7
lO
13
13
14
14
17
18
19

vii
( Page
1.8. Browning reaction and the col or of fish sauce 20
1.9. Development of flavor and arorna in fish sauce 21
1.10. Microbiology of fish sauce 25
1.11. The acceleration of fish sauce production 28
1.12. Rationale for this study 34
1.13. Objective of stud) 35
2:0 MATERIALS AND METHODS 36
2.1. Materials 36
2.2. Analysis of commercial fish sauces 36
2.3. Prt:paration of fish sauce 36
( 2.4. Analytical procedures 37
2.4.1. Chernical analysis 37
2.4.1.1. pH 37
2.4.1.2. Sodium chloride 38
2.4.1.3. Total nitrogen 38
2.4.1.4. Fonnol nitrogen 39
2.4.1.5. Soluble protein 39
2.4.1.6. Volatile nitrogen 40
2.4.1.7. Amino acid analysis 40
2.4.1.7 .1. Sample preparation 40
2.4.1.7.2. Reversed Phase HPLC chromatography 41
( 2.4.2. Microbiological analysis 43

viii
Page
2.5. Sensory evaluation 43
2.6. Statistical analysis 44
3:0 RESUL TS AND DISCUSSION 45
3.1. Chernical and microbiologie al composition of first grade
and second grade commercially produced Thaï fish sauce (Nampla) 45
3.1.1 Chernical composition 45
3.1.2. Nitrogen distribution in commercially produced Nampla 45
3.1.3. Arr.ino acid composition 48
3.1.4. Comparison of commercially produced Nampla
with regulatory Thai specification 50
3.1.5. Microbiological composition 50
3.2. Production of fish sauce from herring and using 0.3% trypsin
and chymotrypsin 53
3.2.1. Physical changes 53
3.2.2. pH change 53
3.2.3. Changes in degree of protein hydrolysis 53
3.2.4. Chemical composition 54
3.2.5. Amino acid composition 58
3.2.6. Microbiological composition 61
3.3. Production of fish sauce from herring and using various
proportions of 0.6% trypsin and chymotrypsin 62
-- 3.3.1. pH change 62

ix
Page
3.3.2. Changes in the formation of nitrogenous compounds 62
3.3.3. Chemical composition 70
3.3.4. Comparison of nitrogenous compounds of herring sauces
produced with 0.3% and 0.6% trypsin and chymotrypsin 72
3.3.5. Comparison of the chemical composition of herring sauces produced
with various proportions of 0.6% trypsin and chymotrypsin
and first grade commercially produced Nampla 72
3.3.6. Distribution of nitrogenous compounds in herring sauces produced
with various proportions of 0.6% trypsin and chymotrypsin
and first garde commercially produced Nampla 76
( 3.3.7. Amino acid composition 78
3.3.7.1. Free amino acid composition 78
3.3.7.2. Comparison of free ami no acid composition of herring sauces
produced with 0.3% and 0.6% trypsin and chymotrypsin 81
3.3.7.3. Comparison of free amino acid composition of herring sauces
produced with various proportions of 0.6% trypsin
and chymotrypsin and flI'sl grade commercially produced Nampla 81
3.3.7.4. Total amine acid composition 82
3.3.8. Microbiological analysis 86
3.3.9. Senso!)' evaluation 88
4:0 SUMMARY AND CONCLUSION 91
( 5:0 REFERENCES 94
L ______ _

LIST OF TABLES ~~I.
PaI,,-e
Table 1. Typical proximate analyses of post rigor flesh fish 1
Table 2. Examples of indigenous fish sauces 5
Table 3. Marine and fresh water fish and shellfish
mainly use in fish sauce production 8
Table 4. Moisture, ash, protein and fat content
of various types of fish and shrimp used in fish sauce production 9
Table 5. Chemical composition of fish sauce Il
Table 6. Amino acid profiles of various commercial fish sauces 12
Table 7. Composition of the mobile phase used in amino acid analysis 42
Table 8. The gradient program used for ami no acid analysis
by reversed phase HPLC-System Gold 42
Table 9. Chemical composition of first grade and second grade
cornrnercially produced Nampla 46
Table 10. Distribution of nitrogenous compounds in f11"st grade
and second grade commercially produced Nampla 47
Table Il. Comparison of first grade and second grade
commercially produced Nampla with regulatory Thaï standard 51
Table 12. Total aerobic and anaerobic plate counts in first grade and
second grade commercially produced Nampla 52
Table 13_ Chemical composition of herring sauces produced with
~ various proponions of 0.3% trypsin and chymotrypsin 57
",r

xi
( Page
Table 14. Total aerobic and anaerobic plate counts in herring sauces produced
with various proportions of 0.3% trypsin and chymotrypsin 61
Table 15. Chemical composition of final herring sauces produced with
various proportions of 0.6% trypsin and chymotrypsin 71
Table 16. Nitrogenous compounds of herring sauces
produced with 0.3% and 0.6% trypsin and chymotrypsin 74
Table 17. Chemical composition of herring sauces produced with
various proportions of 0.6% trypsin and chymotrypsin
and flfSt grade commercially produced Nampla 7S
Table 18. Nitrogen distribution in herring sauces produced with
{ various proportions of 0.6% trypsin and chymotrypsin
and first grade commercially produced Nampla 77
Table 19. Free amino acid composition of herring sauces
produced with 0.3% and 0.6% trypsin and chymotrypsin 83
Table 20. Free amino acid composition of herring sauces produced with
various proportions of 0.6% trypsin and chymotrypsin
and first grade commercia1ly produced Nampla 84
Table 21. Total aerobic plate counts during fennentation of herring sauces
produced with various porponions of 0.6% trypsin and chymotrypsin 87
Table 22. Total anaerobic plate counts during fennentation of herring sauces
produced with various proponions of 0.6% trypsin and chymotrypsin 87
(
, xii
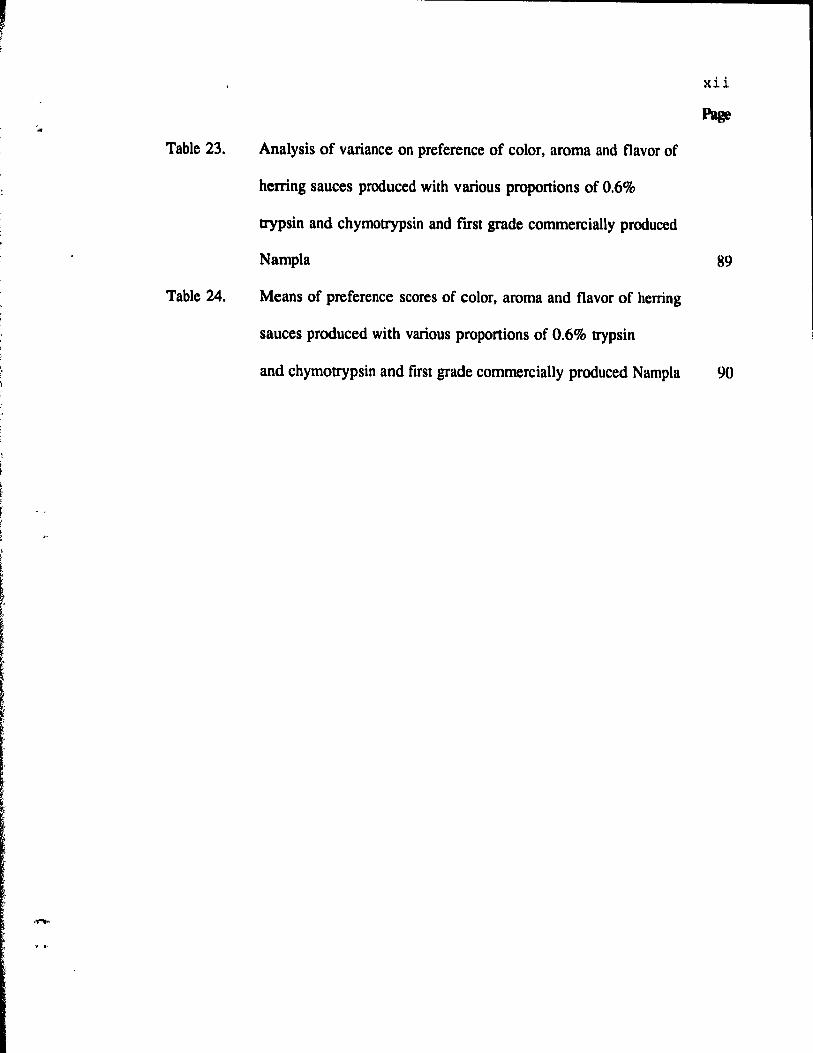
Table 23. Analysis of variance on preference of color, aroma and flavor of
hening sauces produced with various proponions of 0.6%
trypsin and chymotrypsin and frrst grade commercially produced
Nampla 89
Table 24. Means of preference scores of color, aroma and flavor of herring
sauces produced with various proportions of 0.6% trypsin
and chymotrypsin and first grade commercially produced Nampla 90

xiii
r LIST OF FIGURES '-R.,
Figure 1. Fish sauce production 6
Figure 2. Free :tmino acid profile of commercially produced Nampla 49
Figure 3. Total amino acid profile of commercially produced Nampla 49
Figure 4. pH changes during fermentation of herring sauces produced
with various proponions of 0.3% trypsin and chymotrypsin 5S
Figure 5. Changes in degree of protein hydrolysis during fermentation of
herring sauces produced with various proponions of 0.3% trypsin
and chymotrypsin 56
Figure 6. Essential free amino acid profile of hening sauces produced
<" with various proponions of 0.3% trypsin and chymottypsin 59 t , Figure 7. Non-essential free amino acid profile of hening sauces produced
with various proportions of 0.3% trypsin and chymottypsin S9
Figure 8. Essential total ami no acid profile of herring sauces produced
with various proponions of 0.3% trypsin and chymotrypsin
Figure 9. Non-essential total amino acid profile of hening sauces produced
with various proponions of 0.3% trypsin and chymotrypsin
Figure 10. pH changes during fermentation of hening sauces produced
with various proponions of 0.6% trypsin and chymorrypsin 64
Figure 11. Changes in degree of protein hydrolysis during fennentation of
hening sauces produced with various proponions of 0.6% trypsin
,( and chymotrypsin 6S ,~

r ,
xiv
Figure 12. Changes in total nitrogen during fennentation of herring sauces
produced with various proponions of 0.6% trypsin and chymotrypsin 66
Figure 13. Changes in free amine acid content during fermentation of herring
sauces produced with various proponions of 0.6% trypsin
and chymotrypsin 67
Figure 14. Changes in volatile nitrogen during fermentation of herring sauces
produced with various proponions of 0.6% trypsin and chymotrypsin 68
Figure 15. Changes in soluble protein during fennentation of herring sauces
produced with various proponions of 0.6% trypsin and chymotrypsin 69
Figure 16. Essential free amine acid profile of final herring sauces produced
with various proponions of 0.6% trypsin and chymotrypsin 80
Figure 17. Non-essential free aminQ aeid profile of final herring sauces
produced with various ratios of 0.6% trypsin and chymotrypsin 80
Figure 18. Essential total amino aeid profile of final herring sauces
produced with various proponions of 0.6% trypsin and chymotrypsin
and first grade N ampla 85
Figure 19. Non-essential total amine acid profile of final herring sauces
produced with various proponions of 0.6% trypsin and chymotrypsin
and first grade Nampla 85

(
(
(
1.1. Introduction
CHAPTER 1
LITERATURE REVIEW
To a large number of world's population, fish, bath marine and fresh water
varieties, is one of the most important sources of dietary protein. While fish is an
excellent food, it is also an extremely perishable product due to its biochemical and
biological composition. The combination of high water activity, moderate pH of 6-7 and
availability of a range of nutrients (Shewan, 1962) makes fish an ideal substrate for both
the rapid growth of spoilage bacteria and activities of endogenous enzymes. The
chemical composition of fish is shown in Table 1.
Table 1. Typical proximate analyses of post rigor t1esb fish
Fish muscle
Fatty Lean
Water activity 0.99 0.99
pH 6.2-6.5 6.2-6.5
Water (%) 68.6 81.8
Protein (%) 20.0 16.4
Lipid (%) 10,0 0.5
Carbohydrate (%) 0.3 0.3
Ash (%) 1.4 1.3
Source: Jacquot, 1961.

'.
2
Due to its biological nature and limited shelf life, several methods can he used to
extend the shelf life of fish including chilling in ke, freezing, drying, smoking, canning
and modified atmosphere packaging. Anolher method of preserving or improving the
quality of fish is through fermentation wilh endogenous fish or microbial enzymes or
added proteolytic enzymes to convert fish to sauces, pasles, soup stocks and protein
concentrates. Fermented fish products are very popular in Asian countries and in Europe.
Processing of fish in this manner is usually done to reduce waste that arises because
specific varieties of fish are not acceptable to the consumer or there is a seasonal glut
of aIl varieties of fish. Equally important is the fact that, in most of Asian countries,
proper fish handling and storage facilities are either lacking or inadequate and
fermentation constitutes a major method of fish preservation and adding value to
underutilized species which would otherwise be discarded. Elsewhere, fermenled fish
products serve mainly as delicacies (Van Veen, 1965; Subba Rao, 1967; Burkholder et
al., 1968).
With the preparation of a vast number of possible fermenled fish producls, the tenn
"fermentation" has to be defined in its widest sense. In the restricted sense, fennentation
refers to a panicular mode of energy-yieJding metabolism in which a micro-organism uses
an exogenous organic compound to generate A TP solely by substrate-Ievel
phosphorylation (Morris, 1983). Traditionally, however, it has been used to describe
a1most any process in which natural organic material undergoes extensive transfonnation
into simpler compounds by either the action of micro-organisms or by the action of
endogenous fish enzymes (Mackie et aL, 1971).

3
According to Amano (1962) fennented fish products are grouped into three categories,
based on the rnethods of fermentation :
(i) Traditional products in which fermentation is carried out by endogenous fish enzymes
in the presence of high salt concentrations. Products belonging to this category include
fish sauces and fish pastes ;
(ii) Traditional products where fermentation is carried out by the cornbined action of
endogenous fish and microbial enzymes in the presence of salt. In this procedure,
rnicrobial enzymes are added as a starter culture and are usually micro-organisrns growing
on sorne form of cereal e.g. cooked rice or maize. Products belonging to this type of
fennentation process include Buro (philippines), Plara (Thailand) and Funasushi (Japan);
(iii) Non-traditional products obtained by accelerating the rate of fennentation either with
( enzymes or by chemical hydrolysis. An example of products belonging to this category
of fennented products is fish silage.
1.2. Fish saure
Fish sauce is a liquefied protein food produced from hydrolysis of fish in a high
salt concentration. Generally, fish sauce is a clear, dark brown liquid with a sharp
distinctive aroma and a salt y taste. It is also rich in soluble proteins and amine acids
and is commonly used as a food condiment to improve the flavor and aroma of bland
dishes such as rice.
r ...

.'
4
1.3. Fish sauce production
1.3.1. Types of sauce and methods of production
Fish sauces are known under a variety of names and vary according to both their
nutritive and organoleptic qualities. Examples of indigenous fennented fish sauces. their
methods of manufacture and their country of origin are snown in Table 2.
Generally, traditional fish sauce fennentation begins with mixing uneviscerated
fish with salt in the ratio of 5:1-2:1 (fish:salt) (Figure 1). The mixture is then transferred
to fermentation tanks constructed of concrete and built into the ground or placed in
earthenware pots an" buried into the ground. When the tank or pot is filled. it is sealed
off to allow the fish to liquify. At the end of fennentation, the supematant li(!uor is then
drained off and fùtered through sand filtering beds. The filtrate May he sun-ripened in
the earthenware container for up to 3 months to obtain a sauce with improved color and
aroma. This liquid constitutes tirst grade fish sauce. The residue, which still contains
unhydrolyzed fish tissue. is subsequently hydrolyzed with saturated brinc for up to 3
months. These extractions, which give poorer quality sauces. May he improved by
blending with various amounts of the s\&pematant liquid or by the addition of caramel or
molasses prior to extraction. This darkens the color of the sauce and also improves its
keeping quality by the production of acids, such as butyric aeid from molasses or caramel,
which lower product pH. However, lower quality 5auces have poorer keeping propenies
as they have lower salt concentrations. The finished products are a clear, brown liquid,
rich in salt and have a specific characteristic aroma and flavor. The final residue, which
consi~ts mainly of bones, is used as a fertilizer (Van Veen, 1965; Saisithi et aL, 1966;
Subba Rao, 1967).

5
( Table 2. Examples of indigenous fermented fish sauces
Country Narne Fish spc'.cies Fish:Salt Fennentarion rime (month'
>
France Pissala Aphya pellucida 4:1 0.5-2 Gobius spp. Engraulis spp. Atherina spp. Meletta spp.
Greece Garos Scomber colias 9:1 0.25 Hong Kong Sardinella spp. 4:1 3-12
Jelio spp. Carandidae spp. Engraulis spp. Teuthis spp.
India and Columbo-cure Ristrelliger spp. 6:1 up to 12 Pakistan
cybium spp. Clupea spp.
Indonesia Ketjap-lkan Stolephorus spp. 5:1 6 Clupea spp.
( Leiagnathus spp. Japan Shotturu Astroscopus spp. 5:1 6
Clupea spp. Omnastrephis spp.
Korea Shrimp 4:1 6 Malaysia Budu Stoleporus spp. 5:1-3:1 3-12 Philippines Patis Stoleporus spp. 3:1-4:1 3-12
Clupea spp. Decapterus spp. Leionathus spp.
Thailand Nampla Stoleporus spp. 5:1-1:1 5-12 Ristrelliger spp. Cirrhinus spp.
Vietnam Nuoc-mam Stoleporus spp. 5:1-1:1 3-12 Ristrelliger spp. Decapterus spp. Clupea spp.
Source: Adapted from Beddows, 1985.
(

6
Uneviscerated fish , mixed with salt 5: 1-2: 1 (fish:salt) ,
Fennentation for 6-12 months
/' Supematant liquid separated Residue
~ Filtered
~ Extracted with saturated brine
up to 3 months
Sun-ripen 1-3 months
~ First grade sauce
~ BottIe
Figure 1. Fish sauce production.
1 second grade sauce
separated
~ Filtered , Bottled
Residue
~ Added caramels
or molasses , Extracted in
Saturated boiled
brine , Filtered ,
Thid WcΠsaare , Bottled

7
In the production of Nouc-mam, an indigenous fermented sauce of Vietnam, the
process is slightly different. The turbid and bloody liquid is drained off after three days
of fermentation and then poured back over the fish until a 10 cm layer of brine covers
the top of the vat (Steinkraus, 1983).
In Greece. fish sauce known as Garos, is made from fish viscera, panicularly the
liver, of Scomber colias. It has a short fermentation time (1 week), probably due to high
concentration of proteolytic enzymes present (Beddows, 1985).
A Japanese fish sauce, called Shotturu, is prepared from sardines, anchovy,
mollusc or sandfish (Subba Rao, 1967). Following fermentation, the liquid is filtered,
boiled p.nd can he stored for severa! years. Shotturu can also he processed into Shyoyu
thro'Jgh the addition of a fermented wheat (Koji).
1.3.1. Raw mate rials
The major raw materials for fish sauce production are mainly fish and salt. A
wide variety of fish, especially marine fish and shellfish, are used to prepare fish sauce
examples of which are shown in Table 3. Marine salt, produced by sun-drying sea water
on salt beds, is usually used.
The moisture, ash, protein and fat content of the various types of fish and shellfish
used in fish sauce manufacture in Southeast Asia are shown in Table 4. There is a wide
variation in prote in and fat content of fish used in the fermentation process and this may
account for the variation in both the nutritive and organoleptic quality of various
fermented sauces.
:f \

,
, ~ , ~
~ f r
l ~
l [
8
Table 3. Marine and fresh water fish and shellfish maint y u~d in fish sauce production.
Fish COtnnlon name
Marine Fish
Rastrelliger sp. Mackerel
Stolephorus indicus Anchovy
Engraulis spp. Anchovy
Stolephorus commersonii Anchovy
Sardinella longiceps Herring
Sardinella perforata Deep-bodies herring
Sardinella fimbriata Fimbriated herring
Leiognathus equulus Slipmouth
Decapterus macrosoma Round scad
Fresh water Fish
Opicephalus striatus Mud fish
Trichogaster Gourami
Anabas testudineus Climbling perch
Clarias sp. Cat fish
Cirrhinus Carp
Shell Fish
OstrealCrassostrea Oyster
Atya sp. Shrimp
Mytilus Mussel
Omnastrephes sp. Squid
Source: Orejana,1983.

(
(
(
9
Table 4. Moisture, ash and protein and fat content of various types of fish and shrimp used in fish sauce production.
Species Moisture(% ) Protein{%) Fat{%) Ash{%)
Mackerel. 52.5-67.5 11.3-18.0 13.0-36.0 8.5-11.5
Herring.or
Sardine
Anchovies 52.5-73.7 11.3-13.4 13.0-36.0 8.5-11.5
(Stolephorus sp.)
Small whole 76.10 16.90 4.80 2.40
herring( C lupea)
Shrimp 81.50 17.90 0.60 1.60
Slipmouth 79.50 17.32 1.82
(Leiognathus)
Roundscad 74.19 21.90 3.95
(Decapterus)
Source: Orejana, 1978.

r , ,
10
1.4. Chemical and nutritional composition of fish sauce
The chemical composition of fish sauce are shown in Table 5. Nutritionally, fish
sauce is an important protein supplement, supplying as much as 7.5 % of an individual's
nitrogen intake (Amano, 1962). It is also a good source of minerai elements such as Ca,
P, Fe and other organic nutrients and aIso the B-group of vitamins. However, the high
salt concentration of fish sauce limits its consumption.
The distribution of nitrogenous compounds in fish sauce varies according to the
types of raw material used and methods of production. Analysis of various fish sauces
has shown that total organic nitrogen ranges from 1.7-2.3 % of which 40-60 % is in the
fonn of free amino acids. Volatile nitrogen, mostly ammonia, comprises approximately
7-12 % of the total nitrogen (Uyenco et al., 1953; Saisithi et al., 1966; Beddows et al.,
1979).
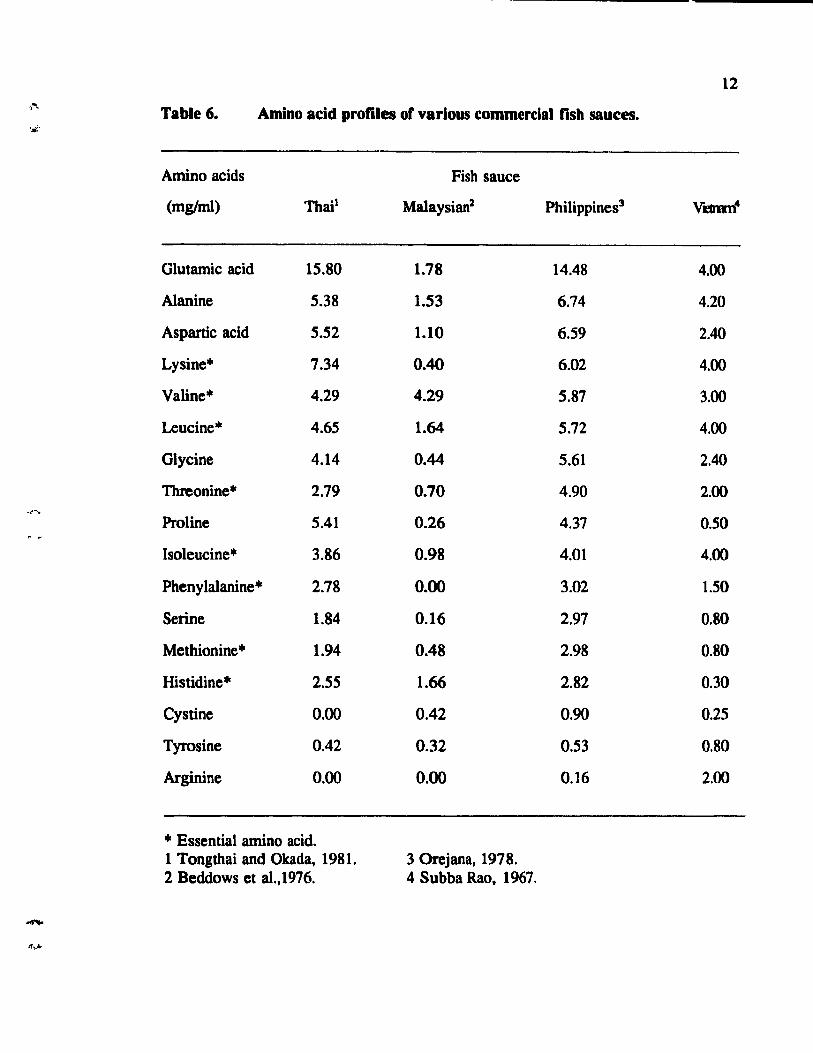
The amine aeid profile of various commereially produced fish sauces are shown
in Table 6. Both the bound and free amino acid content contribute to the nutritional
quality of fish sauce. The essential amino acids are usually fairly well preserved
(Orejana, 1978; Beddows et al., 1976; Amano, 1962) and the high level of lysine in fish
sauce compensates for low levels of this amine aeid in rice (Jansen and Howe, 1964).
-

11
( Table 5. Chemical composition of fish sauce.
Component Compositionl
Moisture 60-70 %
Protein 28-33 g/IOO g
Fat 1-3 g/100g
Carbohydrate 1-3 g/lOOg
Fiber 0
Ash 64-68 g/IOOg
NaCI 55-60 g/IOOg
Ca 30-130 mg/l ()()g
( " P 90-130 mg/l ()()g
Fe 3-30 mg/lOOg
K 800 mg/lOOg
Thiamine 0.03 mg/lOOg
Riboflavin 0.3 mg/l00g
Niacin 6-12 mg/lOOg
Retinol 30 microgram/lOOg
Diotin 30 microgram/lOOg
1 Dry weight basis
Source: Campbell-Platt. 1987.
-.-'"
Table 6. Amino acid profiles of various commercial tish sauces.
Amino acids
(mg/ml)
Glutamic acid 15.80
Alanine 5.38
Aspanic acid 5.52
Lysine'" 7.34
Valine'" 4.29
Leucine· 4.65
Glycine 4.14
TIueonine'" 2.79
Proline 5.41
Isoleucine* 3.86
Phenylalanine * 2.78
Serine 1.84
Methionine· 1.94
Histidine· 2.55
Cystine 0.00
Tyrosine 0.42
Arginine 0.00
• Essential amino acid. 1 Tongthai and Okada, 1981. 2 Beddows et al.,1976.
Fish sauce
Malaysian2
1.78
1.53
1.10
0.40
4.29
1.64
0.44
0.70
0.26
0.98
0.00
0.16
0.48
1.66
0.42
0.32
0.00
3 Orejana, 1978. 4 Subba Rao, 1967.
Philippines]
14.48
6.74
6.59
6.02
5.87
5.72
5.61
4.90
4.37
4.01
3.02
2.97
2.98
2.82
0.90
0.53
0.16
12
4.00
4.20
2.40
4.00
3.00
4.00
2.40
2.00
0.50
4.00
1.50
0.80
0.80
0.30
0.25
0.80
2.00

13
1.5. Role of salt
After the fish and salt mixture is packed into the fennentation tank, a brine is
quickly fonned due to the osmotic action of saiL The addition of salt is not only a means
of extracting liquid, which is rich in soluble protein and other components from the fish,
but it a1so controls the rate of fermentation and microbial spoilage. (Amano, 1962;
Saisithi, 1967; Orejana, 1978).
The concentration of salt is added at a level sufficient to prevent the growth of
spoilage and pathogenic microorganisms and even results in a rapid decrease in microbial
numbers. The bacteriostatic action of salt is due mainly to the reduction of water activity,
which disrupts the osmotic balance in bacterial cells (Christian and Waltho, 1962).
However, too a high salt concentration may also slow down the activity of enzyme
resulting in a slower rate of fennentation. White a low concentration of salt enhances
rapid protein hydrolysis, it also increases the development of ammonia, which is
considered undesirable in the final sauce (Amano, 1962). In addition, fish sauce with a
low salt concentration will result in the growth of spoilage hacteria and a product with
poor keeping q"ality. The minimum concentration of salt should he in the ratio of 4: 1
(fish:salt) or 25% (w/w)(Rose, 1918; Amano, 1962; Raksakulthai, 1987). Salt, free from
impurities, is always recommended for rapid hydrolysis of fish protein (Amano, 1962;
Hamm and Clague, 1950).
1.6. Role of proteolytic enzymes in fish quce fermentation
During the fennentation period, fish tissue is gradually hydrolyzed indicating the
activity of proteolytic enzymes. The proteolytic enzymes responsible for the protein
..

14
degradation are either endogenous fish enzymes or enzymes from microorganisms.
1.6.1. Endogenous tish enzymes
Endogenous proteolytic enzymes in fish originate from the digestive tract, internai
organs or muscle tissue. The propenies and activity of endogenous proteolytic enzymes
vary with fish species (Amano, 1962) and fishing season (Kashiwada, 1952).
1.6.1.1. Digestive enzymes
The contribution of digestive enzymes to fish sauce fermentation was studied by
Uyenco et al., (1953). They observed a two fold increase in the ami no nitrogen in fish
sauce prepared fmm whole fish compared to sauce prepared from gut1.ed fish. They
concluded that digestive enzymes were the main agents for proteolysis and differences in
the amino acid content of the end product.
Simpson and Haard (1987) found that the removal of viscera from herring prior
to fermentation reduced the formation of brine-soluble proteins and peptides. Round
hening contained approximately twice the amount of protein in the brine compared 10
gutted herring after 48 days of fermentation. Funhermore, the free amino acid
concentration in conventional fermented herring was approximately twice of that of the
products prepared from eviscerated fish (Simpson and Haard, 1987).
Raksakulthai (1987) observed that digestive enzymes appeared to contribute in the
fennentation of capeUn fish sauce since the rate of protein hydrolysis of whole fish was
significantly higher compared to that of gutted fish. However, there was no significant
difference in the sensory quaUties of fish sauce produced from whole or e'Viscerated fish.

15
Digestive proteases include pepsins, secreted by the gasttic mucosal glands,
trypsins and chymotrypsins secreted by the pancreatic tissue or pyrolic caeca.
Pepsin is a gasttic protease which is more active at acid pH values. Peptic activity
depends on pH, temperature, and nature of the substrate (Kapoor et al., 1975).
Two acid proteases (1 and II) have been isolated from the stomach of sardines
(Noda et al., 1982). These enzymes were similar to mammalian cathepsin D and pepsin.
The proteolytic activity of both enzymes was inhibited by 15-20% NaCl. However, acid
protease type Il was found to be stable for 3 months after the onset of fish sauce
fennentation from sardines containing 22% NaCl (Noda et aL, 1982).
Trypsin and chymotrypsin are endopeptidases. They are classified as serine
proteases due to their requirement of a serine residue in the catalytic reaction. Kapoor
et aL, (1975) suggested the term "trypsin" be used for pancreatic proteolytic enzymes
which are active between pH 7-11.
Noda et aL, (1982) purified three alkaline proteinases (l, n and Ill) from pyrolic
caeca of sardine. Type 1 was an alkaline proteinase, type II an anionic a-chymottypsin
like enzyme and type III was an anionic trypsin like enzyme. The proteolytic activity of
these three enzymes was irlhibited to varying degrees depending on the concentration of
NaCI added. Alkaline proteinase type 1 was unstable when NaCI exceeded 15% while
the trypsin like enzyme was still stable with 25% NaCl. Chymotrypsin like activity was
inhibited by 20 % salt. The trypsin like enzyme was also found to be stable in fish sauce
fennentation from sardine containing 22% NaCl after three months.
r ..
-

16
Orejana and Liston (1981) studied the enzymes responsible for proteolysis in Patis,
a Philippine fish sauce. using specifie proteinase inhibitors. They reponed that a trypsin
like enzyme developed within a few days after the onset of fermentation. Enzyme
activity was maximal during the tirst mon th, then declined and remained at a low level
throughout the remaining fermentation period. The decline in activity was suggrsted to
be due mainly to end product inhibition by amino acids and small peptides. The initial
low level of trypsin-like activity at the onset of fermentation was believed to be due to
the presence of inhibitors jn blood or substances produced by bacteria in fish. The trypsin
like enzyme found in Patis produced from round scad was reponed to behave like bovine
trypsin.
Two aminopeptidases (1 and II) have been isolated from the internai organs of
sardine (Vo Van et aL, 1983). Enzyme type 1 retained more than 70% uf its original
activity in 15% Nael, which suggested that it may panicipate in the hydrolysis of fish
proteins and peptides during fish sauce production. Vo Van et aL, (1984) reponed that
the aminopeptidase in fish sauce produced from sardines was fairly stable and highly
active during the initial 2 months of fermentation and then gradually losl its activity. The
properties of the aminopeptidase in this study were similar to those previously isolated
from sardinf:.
Vo Van et aL, (1984) observed that carboxypeptidase activity disappeared almost
completely within a few days after the onset of fermentation of fish sauce from sardines
and concluded that this enzyme did not play a major role in the hydrolysis of fish protein
into free amino acids and peptides in fish sauces.

(
(
(
17
1.6.1.2. Muscle t~ssue enzymes
Cathepsins, peptidases, transaminases, amidases, amino acid decarboxylases,
glutamic dehydrogenases and related enzymes are ail found in fish muscle tissue (Siebert
and Schmitt, 1965) and these enzymes, paniculary cathepsin, may play a role in fish
sauce fermentation .
Cathepsins are intracellular enzymes which exist in animal tissues and catalyze
hydrolysis of protein or synthetic subsuates at acidic pH. These enzymes are located in
the lysosomal fraction of the cell and are therefore distinguishable from digestive enzymes
which are secreted by the cell (Mycek, 1970).
Voskresensky (1965) noted that the activity of cathepsins in the muscle tissues of
salted hening decreased when salt concentrations exceeded 15% and that their activity in
a saturated brine solution were inhibited to a higher degree compared to the activity of
digestive tract enzymes. Furthermore, mal'ly of these enzymes were only active in the
presence of certain reducing substances, such as cysteine, glutathione and hydrogen
sulfide.
Rosario and Maldo (1984) studied the activity of cathepsins during the
fermentation of Patis, a Philippine fish sauce. They reported that cathepsin A and C were
important in proteolysis during fennentation. The activity of cathepsin A was found to
be proportional to the amount of amino acids prodl1ced while the activity of cathepsin C
was proportion al to the amount of low molecular weight proteins in the fish sauce. The
decrease in cathepsin D activity during the fermentation period corresponded to a decrease
in the amount of high molecular weight proteins, which served as a substrate for cathepsin
D.
--..
18
Raksakulthai (1987) observed that cathepsin C contributed to proteolysis in fish
sauce and the fonnation of the delicious fish sauce taste while enzymes associated with
the fish viscera contributed only to proteolysis.
1.6.2. Microbial enzymes
In the presence of high salt concentrations, the activity of endogenous fish
proteolytic enzymes are more significant than the proteolytic activity of microorganisms.
Hamm and Clague (1950) proposed that bacterial growth was not imponant in the
breakdown of fish protein since microbial counts decreased during fermentation.
Furthermore, it has been shown that proteolysis occurred in the presence of bacteriostatic
agents (Uyenco et al., 1953).
Although microorganisms do not appear to play an important role, enzymes from
these organisms, which are present in fish prior to salting, may contribute to proteolysis
of fish sauce fermentation (Amano, 1962; Saisithi, 1967).
Raksakulthai (1987) studied the contribution of bacterial enzymes in fish sauce
fennentation from male capelin using a delayed-salting method. The results showed that
there was no significant difference in proteolysis between 6-18 hr delayed-salting and the
control, indicating that bacterial proteases were probably inactivated by salt and were
therefore not important in fish sauce fermentation. Further studies using gentamicin
sulfate a broad spectrum antibiotic, showed that antibiotic treatment did not significandy
affect protein hydrolysis and protein solubilization in fish sauce. This would imply that
microorganisms did not play a significant role in the fennentation of fish sauce using
freshly caught capelin.
(
(
19
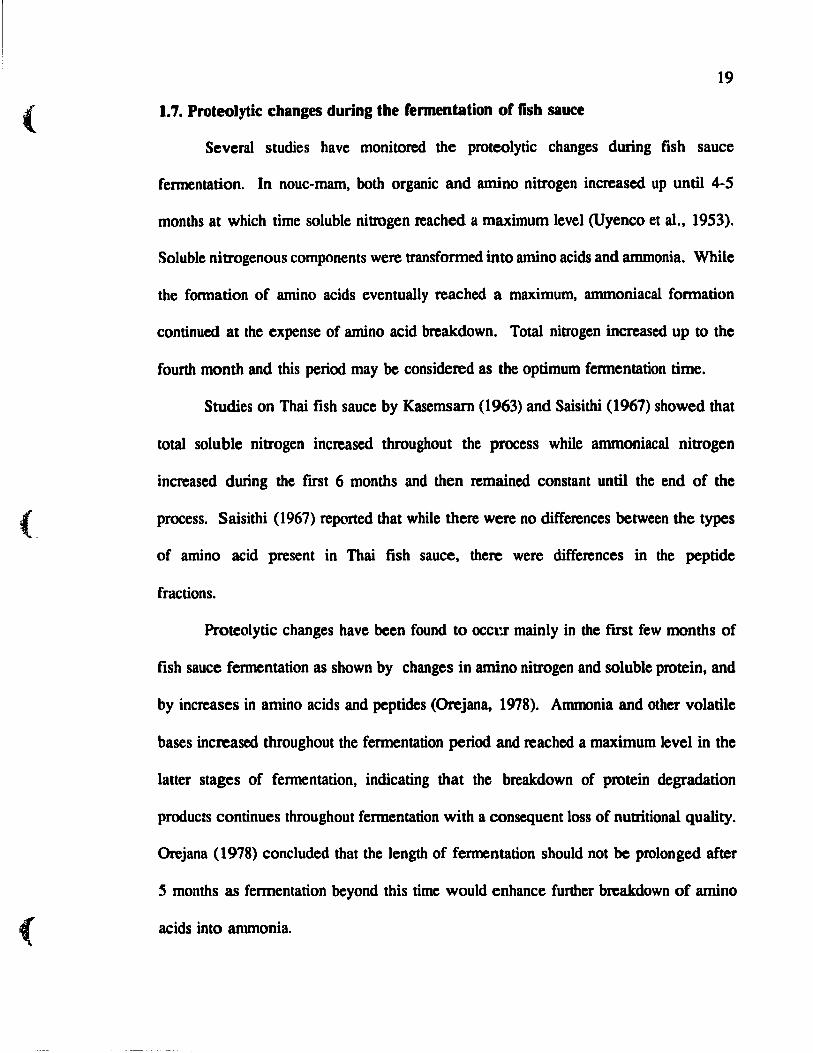
1.7. Proteolytic changes during the fermentation of fish sauce
Several studies have monitored the proteolytic changes during fish sauce
fennentation. In nouc-mam, both organic and amino nitrogen increased up until 4-5
monlhs at which time soluble nitmgen reached a maximum level (Uyenco et al., 1953).
Soluble nitrogenous components were transfonned into amino acids and ammonia. While
the formation of amino acids eventually reached a maximum, ammoniacal formation
continued at the expense of amino acid brea.kdown. Total nitrogen increased up to the
fourth month and lhis period may he considered as the optimum fermentation time.
Studies on Thaï fish sauce by Kasemsam (1963) and Saïsithi (1967) showed thal
total soluble nitrogen increased throughout the process while ammoniacal nitrogen
increased during the fust 6 monlhs and then remained constant until the end of the
process. Saisithi (1967) reported that while there were no differences between the types
of amino acid present in Thaï fish sauce, there were differences in the peptide
fractions.
Proteolytic changes have been found to occcr maïnly in the fust few months of
fish sauce fermentation as shown by changes in amino nitrogen and soluble protein, and
by increases in amino acids and peptides (Ore jan a, 1978). Ammonia and other volatile
bases increased throughout the fermentation pcriod and reached a maximum level in the
latter stages of fermentation, indicating that the breakdown of protein degradation
products continues throughout fermentation with a consequent loss of nutritional quality.
Orejana (1978) concluded that the length of fermentation should not he prolonged after
5 months as fermentation beyond this time would enhance further brea.kdown of amino
acids into arnmonia.

~ ... '
......
20
Orejana and Liston (1979) also reponed that amine nitrogen in fish sauce
comprised mainly of peptides and not free amino acids. The molecular weight mnge of
peptides, fonned during the fU'St 40 days, ranged between 700-1500 daltons. Orejana and
Liston (1979) concluded that during the fllst 40 days of fennentation, endopeptidases of
the trypsin type were the most active. During the period of 70-140 days, small molecular
weight fractions increased significantly, indicating a higher activity of exopeptidases.
In the fennentation of capelin fish sauce at ambient temperature, changes in
protein composition occurred mostly during the {"ust four weeks as shown by an increases
in Cree amino acids, fonnol nitrogen and solubll! protein (Raksakulthai, 1987).
Uyenco et al., (1953), Orejana (1978) and Tongthai and Okada (1981) reponed
that the level of amino acid nitrogen in fish sauce decreased when the fennentation time
was prolonged. However, Raksakulthai (1987), in studies on capelin fish sauce
fermentation, found that free amine acids increased throughout the fennentation period
and ripening, although this increase was reduced after the fourth week of fennentation.
1.8. Browning reaction and color of fish sauce
The color of fish sauce becomes darker as fennentation progresses. This is due
mainly to non-c-"'lymatic browning, a reaction which is desirable in fish sauce. The non
enzymatic browning reaction in fish sauce has been classified by Jones (1962) into 2
types: (i) Sugar-amino reaction or Maillard reaction and (ii) Lipid-amino reaction.
Saisithi (1967) in his studies with Nampla, considered the Maillard amino-sugar
reaction to he the major contributor of color in Thai fish sauce .

(
(
(
21
However. Orejana (1978) observed an increase in free fatly acids in fisb sauce
fennentation as a result of lipolysis. Shc also reported that all fish sauce samples showed
a linear increase in browning over a 40-140 day period. Orejana (1978) suggested that
this increase in color was due to lipid-amino reactions since the concentration of sugar
present in fish is very low and is unlikely to be a source of carbonyl compounds for the
non-enzymatic browning reaction.
According to Jones (1962), lipid-amino reactions can he classified iota three main
types: (i) a reaction between carbonyl groups and the basic nitrogenous constituents (ii)
oxypolymerization and (iii) oxidation of unsaturated lipids.
The role of fat in browning was funher studied by the preparation of patis from
defatted anchovies and the addition of fat to Patis made from defatted anchovies (Ore jan a,
1978). Browning was observed to decrease in patis made from defaned fish samples
compared to the control sample while there was an increase in browning resulting from
the addition of fat to Patis prepared from defatted fish. Orejana (1978) concluded that
lipids and their degradation products (carbonyl compounds and peroxide) appear to be
important sources of carbonyl groups for the non-enzymatic browning reaction in fish
sauce.
1.9. Development of navor and aroma
Color is a significant factor in consumer acceptability of traditionally produced
fish sauce. However, flavor and aroma are the most important factors influencing
consumer acceptability of the end product since a desirable color can readily he obtained
by the addition of caramel or molasses (Beddows, 1985). Although flavor and aroma

22
varies according to the country of origin, fish sauce genemlly has a predominantly sally
taste while amino acids and small peptides also contribute to the ove rail navor.
Kasemsam (1963) reponed that the flavor of fish sauce was due to microbial
action on proteins, or protein degradation products. Raksakulthai (1987) suggested that
most bacterial species did not anack protein but utilized more readily available protein-
degradation products. Therefore, the typical navors of fish sauce are mnst probably
developed during the latter stages of fermentation.
Fermentation of squid muscle in brine resulted in an increase in taste-active
compounds which were identified as free amine acids. Lee and Sung (1977) showed that
the fermentation of squid muscle resulted in a x 1.8 increase in free amino acids. The
major taste-active amine acids in brined squid were proline, leucine, serine, lysine,
arginine and alanine (Lee and Sung, 1977).
Raksakulthai (1987) studied the relationship between sensory preference score and
chemical components in fish sauce and found that there was a strong correlation between
free amino aeid content and preference score. Larger molecular weight components
presen.t in fish sauce appeared to contribute significantly to the typical flavor of fish sauce
since removal of these components resulted in a lower preference score. Raksakulthai
(1987) concluded that the typical flavor of fish sauce was influenced by a eombination
of oligopeptides and free amine acids, especially glutamic acid and glycine.
Dougan and Howard (1975) classified the arorna of Nampla, a Thai fish sauce,
into 3 major groups: (i) A cheesy aroma produced from low molecular weight volatile
fauy acids, specifically n-butyric acid (ii) An ammoniacal aroma derived from the
production of ammonia and amines and (üi) a meaty aroma produced by oxidation of
23
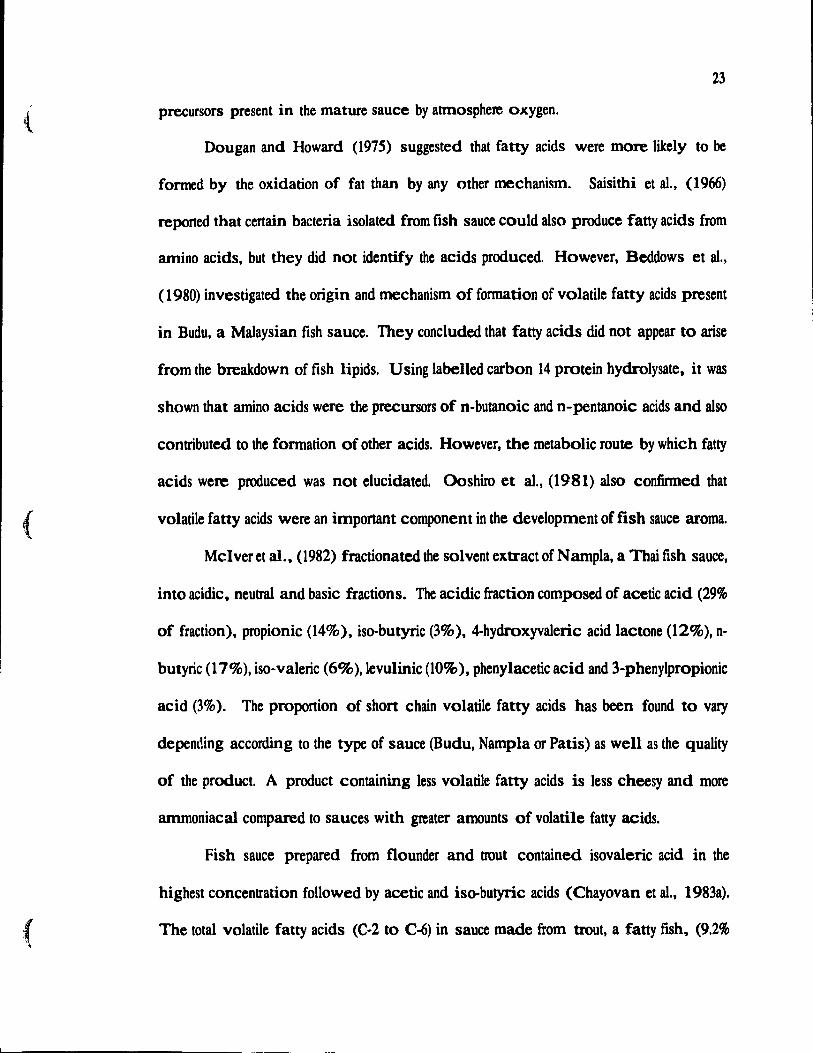
precursors present in the mature sauce by atmosphere oxygen.
Dougan and Howard (1975) suggested that fany acids were more likely to he
fonned by the oxidation of fat than by any other mechanism. Saisithi et al., (1966)
reported that certain bacteria isolated from fish sauce could also produce fatty acids from
amino acids, but they did not identify the acids produced. However, Beddows et al.,
(1980) investigated the origio and mechanism of fonnation of volatile fany acids present
in Budu, a Malaysian fish sauce. They concluded that fatty acids did not appear to arise
from the breakdown of fish lipids. Using labelled carbon 14 prote in hydrolysate. it was
shown that amino acids were the precursors of n-butanoic and n-pentanoic acids and also
contributed to the formation of other acids. However, the metabolic route by which fatty
acids were produced was oot elucidated. Ooshiro et al., (1981) also confinned that
{ volatile fatty acids were an important component in the development of fish sauce aroma.
Mclver et al .• (1982) fractionated the solvent exttact of Nampla, a Thai fish sauce,
into acidic. neutral and basic fractions. The acidic fraction composed of acetic acid (29%
of fraction), propionic (14%), iso-butyric (3%), 4-hydroxyvaleric acid lactone (12%), n-
butyric (17%), iso-valerie (6% ),levulinic (10%), phenylacetic acid and 3-phenylpropionic
acid (3%). The proportion of shon chain volatile fatty acids has been found to vary
depending according to the type of sauce (Budu, Nampla or Patis) as weIl as the quality
of the product. A product containing less volatile fany acids is less cheesy and more
ammoniacal compared to sauces with greater amounts of volatile fatty acids.
Fish sauce prepared from flounder and trout contained isovaleric acid in the
highest concentration followed by acetic and iso-butyric acids (Chayovao et al., 1983a).
The total volatile fatty acids (C-2 to C-6) in sauce made from trout, a fatty fish, (9.2%

r ,
24
fat) were approximately 3 times highcr compared to sauce made from flounder. a lean
fish, (1.6% fat) after 9 months fennentation. Non-volatile fatty acids (C-8 to C-18) were
found in very low concentration compared to volatile fatty acids. Il was concluded that
the tlavor of fish sauce could he due to the overall effects of both volatile and non-
volatile fatty acids along with other biochemical reactions which generally occurred
during fenne:ltation. It is aIso possible that the flavor of fish sauce is also intluenced by
sorne breakdown oxidation products of long-chain polyunsaturated fatty acids found in
fish lipids.
Sanceda et al., (1983) fractionated the volatile distillate of commercial Patis, a
Philippine fish sauce, into 4 fractions-neutral, basic, acidic and phenolic fractions. They
reported that the acidic fraction appeared to play a major role in the aroma of Patis since
any other fraction, in combination with this fraction, produced an aroma similar to that
e;f the whole concentrate. Five major acids were isolated from the acidic fraction: n-
butyric, propionic, iso-butyric, valeric and acetic acids. These acids accounted for 98%
of the total free fatty acids with n-butyric acid heing the most abundant and accounting
for about 50% of the total fatty acids (Sanceda et al., 1984). However, they reponed that
contribution of n-butyric acid to the overa11 of fish sauce aroma was not well pronounced,
suggesting that other volatile compounds present in the neutral, basic and phenolic
fractions may aIso play a major role in the development of aroma.
Sanceda et al., (1986) examined the formation of volatile acids at various stages
of Patis fermentation. They observed that most of the acids identified in commercial Patis
were found in 10w concentrations after only 24 hr fennentation suggesting that these acids
might have been formed prior to saIting during the period between harvesting, .. l"

2S
transportation and salting. They also reported that fany acids increased quantitatively and
qualitatively with fennentation time and that almost all the acids identified in the sauce
werc fonned within 3 months period.
An ammoniacal aroma was found in the basic fraction of solvent extracted fish
sauce (Mclver et aL, 1982). This fraction contained mainly ammonia and ttimethylamine
white dimethylamine and 2,3-butanediol were found in small amounts. Sanceda et al.,
(1984) also reponed nitrogen containing compounds, inc1uding ttimethylamine, in the
basic fraction of solvent extracted fish sauce.
The fonnation of an ammoniacal aroma May not involve bacterial action, as bath
ammonia and trimethylamine can he fonned under aseptic processing conditions.
However, it is possible that bacteria, when present, could increase the amount fonned and
hence conttibute towards the intensity of aroma (Beddows, 1985).
The meaty aroma of fish sauce was found rnainly in the neutral fraction of
solve nt extracted sauce (Mclver et al., 1982). The major compounds isolated were 3
lactones (y-butyrolactone, y-caprolactone and 4-hydroxyvaleric acid lactone), 3-
(methylthio)propanol and 2,3-butanediol. However, Sanceda et al., (1984) repotted that
the compounds found in the neutral fraction of fish sauce comprised mainly of alcohols
and methyl ketones.
1.10. Microbiology of fish sauce
A wide variety of microorganisms have been found in fish sauce and the raw
ingredients in fish sauce production. The possible t}Tes and sources of microorganisms
{ involved in fish sauce fermentation are summarized by Orejana (1983): (i) organisms .
~ "
-
26
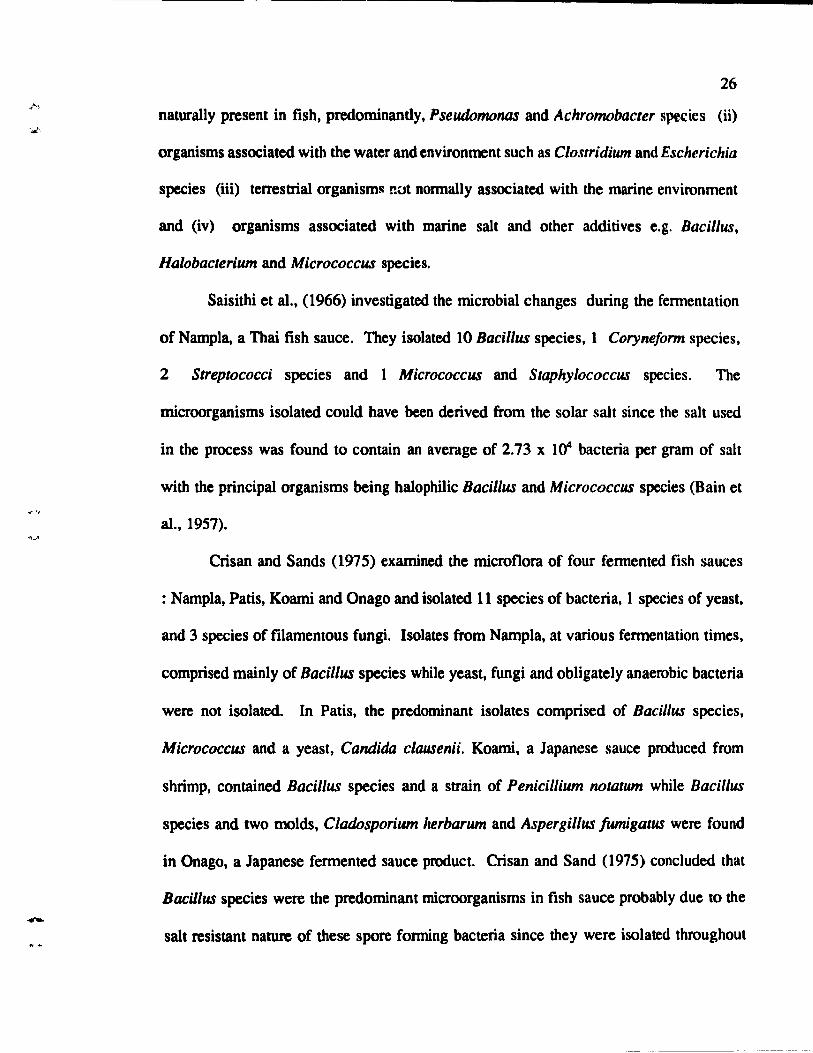
naturally present in fish, predominandy, Pseudomonas and Achromobacter spe~ies (ii)
organisms associated with the water and environment such as Clostridium and Escherichia
species (iii) terrestrial organisms nut nonnally associated with the marine environment
and (iv) organisms associated with marine salt and other additives e.g. Bacillus,
Halobacterium and Micrococcus species.
Saisithi et al., (1966) investigated the microbial changes during the fennentation
of Nampla, a Thai fish sauce. They isolated 10 Bacillus species, 1 Coryneform species,
2 Streptococci species and 1 Micrococcus and Staphylococcus species. The
microorganisms isolated could have been derived from the solar salt since the salt used
in the process was found to contain an average of 2.73 x Hf bacteria per gram of salt
with the principal organisms being halophilic Badl/us and Micrococcus species (Bain et
al., 1957).
Crisan and Sands (1975) examined the microflora of four fermented fish sauces
: Nampla, Patis, Koami and Onago and isolated Il species of bacteria, 1 species of yeast,
and 3 species of filamentous fungi. Isolates from Nampla, at various fermentation times,
comprised mainly of Bacillus species while yeast, fungi and obligately anaerobic bacteria
were not isolated. In Patis, the predominant isolates comprised of 8adllus species,
Micrococcus and a yeast, Candida clausenii. Koami, a Japanese sauce produced from
shrimp, contained Badl/us species and a strain of Penicillium notatum while Badl/us
species and two rnolds, Cladosporium herbarum and Aspergillus fumigatus were found
in Onago, a Japanese fennented sauce product. Crisan and Sand (1975) concluded that
Bacillus species were the predominant microorganisms in fish sauce probably due to the
salt resistant nature of these spore fonning bacteria since they were isolated throughout

27
the fermentation periode The isolates appeared to he halotolerant rather than halophilic
since they grew on media containing 10% salt, but not in media containing 20% salt.
Molds isolated from Japanese sauce were observed only in the finished produet. This was
probably due to surface contamination during the aging process.
The microbiologie al changes in Patis, a Philippine fish sauce prepared from
Stolphorus sp. and mixed species consisting of maekerel (Rastrilliger sp. and Sardinella
sp.) were studied by Sanchez and Klitsaneephaiboon (1983). The predominant organisms
throughout the fennentation period in both types of Patis again eompi'ised mainly of
Bacillus species. Bacillus coagulans, Bacillus megatarium and Bacillus subtilis were
found during the early stage while Bacillus licheniformis, Micrococcus colpogenes and
Staphylococcus epidermis were observed in the middle stages of the fermentation process.
:( \ ..
The predominant organisms in the latter stages of fermentation comprised mainly of salt
resistant strains of Micrococcus roseus, Micrococcus varians and Staphylococcus
saprophyticus .
The dominant microorganisms isolated from Shotturu, a Japanese fish sauce, were
Vibrio and Bacillus species in medium containing 2.5% NaCI. However, when the salt
concentration was increased to 20%, Halobacterium, Bacillus species and unidentified
cocci were the predominant isolates (Fujii and Sakai, 1984).
Ok et al., (1982a) studied protease formation by a moderately halophilic strain of
Bacillus isolated from Bunnese and Chinese fish sauce. The isolated bacteria were
capable of growth in a medium containing 4M NaCI. Maximal protease formation was
observed in media containing 4M and lM NaCI. The pH and temperature optima for
{ enzyme production were pH 7 and 44°C i.e. similar to the fermentation conditions for fish

28
sauce production in Southeast Asia.
It is believed that microorganisms do not play a major role in fish proteolysis
since their numbers decrease steadily as fermentation progresses (Hamm and Clague.
1950; Saisithi et al., 1966; Orejana and Liston, 1979). However, they may he responsible
for the development of fish sauce aroma.
Beddows et al., (1979 and 1980) reponed that when fresh fish and salt were mixed
and fennented without any time elapsing prior to salting, few of the volatile fatty acids.
especially n-butyrlc acid, were formed. Addition of broad spectrum antibiotics also
prevented the formation of the volatile fatty acids, suggesting that microbial action was
involved in the production of these volatile acids components.
Sanceda et al., (1986) from studies on fish, with or without salt, concluded that
bacteria must be involved in the formation of volatile acids since most of the acids found
reached very high concentrations in fish incubated without salt.
However, due to the complex nature of arorna, it is difficult to ascertain any
specifie role of microorganisms in the production of fish sauce aroma.
1.11. Acceleration of fish sauce production
Traditional fish sauce production, which occurs mainly as a result of autolytic
action by digestive proteases in the fish, usually takes 6-12 months to produce an
acceptable end product. The fermentation method is time consuming and requires a large
storage capacity, which is costly. To reduce this capital investment, it is desirable to
accelerate the fermentation process. Many attempts have been made to accelerate the rate
of fermentation. These include: (i) increasing the temperature of fermentation (ii) the use
(
(
29
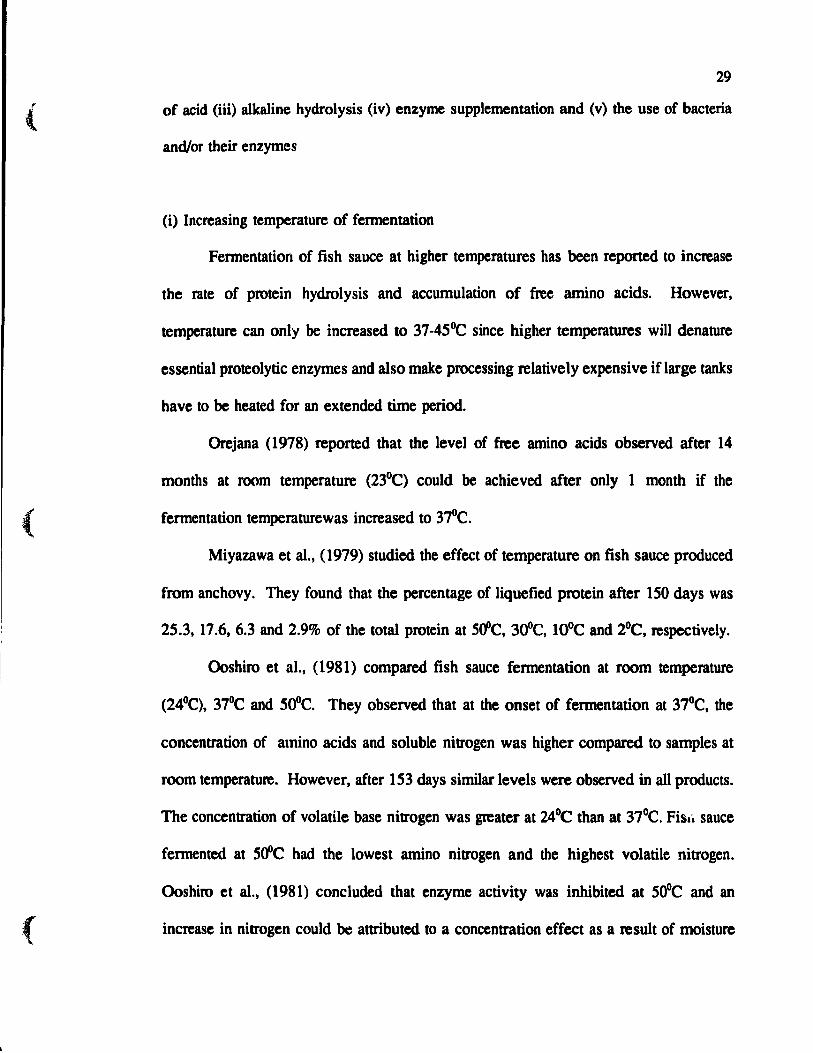
of acid (iii) alkaline hydrolysis (iv) enzyme supplementation and (v) the use of bacteria
and/or their enzymes
(i) Increasing temperature of fennentation
Fennentation of fish sauce at higher temperatures has been reported to increase
the rate of protein hydrolysis and accumulation of free amino acids. However,
temperature can only be increased to 37-45°C since higher temperatures will denature
essential proleolytic enzymes and also make processing relatively expensive if large tanks
have to he heated for an extended time periode
Orejana (1978) reponed that the level of free amino acids observed after 14
months at room temperature (23°C) could he achieved after only 1 month if the
fennentation temperaturewas increased to 37°C.
Miyazawa et al., (1979) studied the effect of temperature on fish sauce produced
from anchovy. They found that the percentage of liquefied protein after 150 days was
25.3, 17.6, 6.3 and 2.9% of the total protein at SO"C, 30°C, lOOC and 2°C, respectively.
Ooshiro et aL, (1981) compared fish sauce fennentation at room temperature
(24°C), 37°C and 50°C. They observed that at the onset of fennentation at 37°C, the
concentration of amino acids and soluble nitrogen was higher compared to samples at
room temperature. However, after 153 days simUar levels were observed in all products.
The concentration of volatile base nitrogen was greater at 24°C than at 37°C. Fisli sauce
fermented at SO"C had the lowest amino nitrogen and the highest volatile nitrogen.
Ooshiro et al., (1981) concluded that enzyme activity was inhibited at 50°C and an
increase in nitrogen could he attributed to a concentration effeet as a result of moisture

30
loss.
Chayovan et al., (1983a) stated that the optimum temperature for commercial fish
sauce production was 3-r>C. However, the practice of placing the container with product
directly in the sun, partly adopted by the Southeast Asia industry, results in a more rapid
protein hydrolysis (Amano, 1962).
(ii) The use of acid
The addition of acid at ambient temperature encourages the activity of acidic
proteolytic enzymes, such as pepsin, which are found abundantly in the fish stomach.
Beddows and Ardeshir (1979b) studied the use of hydrochloric acid in fish sauce
production and reported that the optimum conditions were either pH 2.0 and 10% salt
, ... (w/w) or pH 3.0 and 15% salt (w/w). Acidic proteolysis occurred more rapidly compared
to traditional methods of fermentation and the amount of soluble protein hydrolysed was
comparable to traditional fennentation methods. However. eventhough similar
concentrations of volatile nitrogen were observed, the end product had very little aroma.
Gildberg et al., (1984) studied the acceleration of fish sauce fennentation by
adding acid and reducing salt content. Good quality fish sauce was prepared from minced
anchovy which had been allowed to autolyse at pH 4.0 with a salt concentration as low
as 5%. After the initial phase of rapid proteolysis, samples were neutralised and salt
added to its nonnal concentration (25%). The increased proleolysis al low salt
concentrations was due to the fact that pepsins are significantly inhibited by a salt
t.oncentration greater than 5%. This method was found to produce an acceptable sauce
after 2 months white the tradition al method required 6 months or longer. The product

(
(
31
produced was reponed to have a better balance of essential amino acids than fll'St grade
commercially produced fish sauce although it had a lower level of volatile bases and
acids.
(iii) Alkaline hydrol)~is
It has been reponed that hydrolysis of fish protein is enhanced if fish is adjusted
to an alkaline pH and then ceutralized. However, this method is not recommended for
food processing because of the adverse effect on the nutritional quality of the end product
(Hayashi and Kameda, 1980; Feron et al., 1978).
(iv) Enzyme supplementation
Commercial plant proteases such as bioprase, pronase, papain, bromelain and ficin
have ail been investigated as enzyme supplements to hasten the rate of fish sauce
fermentation.
Murayama et al., (1962) reported that the addition of bioprase and pronase reduced
the fermentation time to 70 days and produced a good quality fish sauce. Guevara et al.,
(1972) used papain in the production of Patis, a Philippine fish sauce, and claimed that
the fennentation rime was reduced to 4-7 days without any deleterious effeet on the
characteristic flavor of the sauce.
Beddows et al .• (1976) reported a high deg."Ce of proteolysis was found in
homogenized mackerel at 38°C containing 0.2% bromelain. Conversion of insoluble
protein into soluble protein was greater if a 24 br pre-incubation pcriod was employed
prior to the addition of salt.

-
32
Beddows and Ardeshir (1979a) examined the effeet of adding bromelain (0.8%),
papain (2.75%) and fiein (2.5%) on the rate ofprotein hydrolysis using minced Ikanbilis.
Bromelain was found to give more favorable resuIts compared to papain or flcin with
greater amounts of fish protein being solubilized in 18-21 days at 33°C. The distribution
of nitrogen was similar to tradition al fennentation rnc.thods but the end product lacked
arcma.
Japanese anchovy was fennented with 20% salt and added "koji" (35%) or 0.5%
pronase and stored at 300e for 150 days (Miyazawa et al., 1979). The addition of "koji"
had a pronounced effect on the liquefication of protein and the formation of free amino
acids, while the effect of pronase on protein hydrolysis was neglible.
Ooshiro et al., (1981) also examined the use of papain, bromelain and trypsin to
produce fish sauce from unminced sardines. Optimum results were obtained using 0.3%
papain at pH 5.2, 37°C and 25% salt. The taste and color of the end product was
satisfactory but it lacked the typical aroma of fish sauce. Funhermore, the fermentation
took 340-350 days.
The visceral extract from sardine, which con tains several proteases, was used in
the preparation of fish sauce from sardine (Yoshinaka et aL, 1983). The sardine flesh
homogenate was incubated with the visceral exttact for 5 hr at pH 8.0 and at 500C. The
mixture was clarified by centrifugation and 25% NaCI was added. The quality of fish
sauce obtained was reponed to be comparable with commercial Shotturu in both amino
acid content and sensorial qualities.
Raksakulthai et al., (1986) examined the effect of proteolytic enzymes (fungal
protease, pronase, trypsin, chymotrypsin, squid protease) or squid hepatopancreas on the

33
( production of fish sauce from male capelin. They observed that an excellent quality fish
sauce could be prepared from minced capelin when fennentation was carried out using
a minced fish:salt ratio of 4: 1 at 20-25°C and 2.5% squid hepatopancreas as a
fennentation aid. Addition of various enzyme preparations to minced capelin increased
the initial rate of protein hydrolysis but did not yield a product with a greater free amino
acid content. Analysis of capelin sauce indicated that the product, supplemented with
squid hepatopancreas, was highly acceptable and more preferable than commercially
produced Patis. However, supplementation with squid hepatopancreas did not improve
the fermentation time since the process, including the aging time petiod, took 33 months.
(v) The use of bacteria and/or their enzymes
Acceleration of fish sauce fennentation by the addition of halophiüc bacteria was
studied by Ok et al., (l982b). When Bacillus Cl and C6, isolated from Chine se fish
sauce, were added to a mixture of sardine and salt and stored at 30°C, the fennentation
time was reduced to 3 months. Partially purified protease from a moderately halophilic
marine bacterium Pseudomonas sp. was used to reduce the fish sauce fennentation
process (Nakano et al., 1986). Results indicated that the enzyme could reduce the
fennentation time from 1.5-3 years to 3-6 months and the product contained nutritionally
valuable amino acids in a high concentration. Sensory tests showed that the product had
a fairly good taste and good quality compared to commercial products.
, l ~

34
1.12. Rationale for this study
One of the major problems facing the world today, panicularly in the develolling
countries, is the provision of adequate supplies of high quality protein. With respo:ct to
this objective, fish is regarded as a good source of protein in tenns of quality, supply and
cost. However, many fish species are rejected by consumers on the basis of their physical
appearance, texturai qualities and unacceptable taste and are discarded as waste products.
This problem also faces developed countries such as Canada, specifically. Quebec where
herring is an underutilized fish species and is often discarded as waste (Boudreau, 1990).
One viable rnethod for the conversion of underutilized fish species into value
added secondary products is through fermentation. Although fish sauce fermentation is
widely practiced in Asian countries, it is very time consuming. Furthermore, little is
known about fish sauce fermentation technology in North America. Detailed studies of
the changes occurring in fish sauce fennentation using enzymes to accelerate the rate of
fennentation would be of great economic value, not only in Asian countries, but also in
Quebec which could produce its own fish sauce from underutilized fish species.

.-----------
35
( 1.13. Objectives of study
In ft view of these comments, the overall objectives of this study are:
(1) To analyze the chemical and microbiological composition of commercially
produced flI'St grade and second grade Thaï fish sauces as a reference for
laboratory produced fish sauce.
(2) To compare the chemical and microbiological composition of commercially
produced flI'St grade and second grade Thaï fish sauce (Nampla) with regulatory
Thaï specifications for both grades of sauce.
(3) To produce an acceptable fish sauce from underutilized fish species, e.g. hening.
(4) To detennine the effect of enzyme supplementation using trypsin and
chymotrypsin to accelerate fish sauce fennentation.
( (5) To monitor the physical, chemical and microbiological changes during
fermentation of the enzyme supplemented fish sauce.
(6) To compare the chemical and microbiological composition and organoleptic
quality of the enzyme supplemented fish sauce with first grade commercially
produced Nampla.
( ,

36
CHAPTER 2
MATE RIALS AND METHODS
2.1. Materials
First grade and second grade Thai fish sauces (Nampla) were obtained from
commercial suppliers in Chinatown, Montreal, Canada.
In the production of fish sauce, herring (Clupea hareng us hareng us) was used as
raw material throughout the study. Fish were obtained fresh from Marché Centrale.
Montreal and transponed to the laboratory under refrigerated storage conditions and kept
at -4°C until use.
Bovine pancreatic trypsin type III (activity: lO,()()()-13,OOO BAEE units per mg
protein) and chymotrypsin type II (activity: 40-60 units per mg protein) were obtained
from Sigma Chemical Company (St.Louis, Missouri).
2.2. Analysis of commercial products
First grade and second grade Thai fish sauces (Nampla) were analyzed for
chemical and microbiological composition as described in analytical procedures (2.4) and
compared to Thai regulatory standards (Anon, 1983).
2.3. Preparation of fish sauce
In the fust study, whole uneviscerated herrings were ground in a meat grinder to
a unifonn size. Approximately 100 gram amounts of minced herring were mixed
-- thoroughly with 25% salt (w/w) and the following amounts of enzyme added ta duplicate ,"

(
(
(
37
batches: (i) no enzyme (control) (ii) 0.3% w/w of trypsin and chymotrypsin in the
proportions of 100:0, 50:50 and 0:100. The mixtures were transferred to fermentation
glass jars, sealed and stored at 37°C. Liquid was removed from each treatment after day
l, 7, 14,21,28, 35 and 42 and analyzed for pH and degree of hydrolysis. At the end of
felmentation (day 42), samples were filtered and the filtrates were analyzed for their pH,
NaCI content, formol nitrogen, total nitrogen, volatile nitrogen, soluble protein and amino
acid composition. Microbiological analysis was done using TSA as the growth medium.
In the second batch of fish sauce, duplicate (900 g) of minced herring were mixed
thoroughly with 25% salt and 0.6% (w/w) of trypsin and chymotrypsin in the proportions
of 100:0, 75:25, 50:50, 25:75 and 0:100 added to each mixture. The mixtures were
placed in the 1 L glass jars, sealed and stored at 37°C. On day 7, 14, 21, 28, 35 and 42
of fermentation, pH, degree of protein hydrolysis, total nitrogen, volatile nitrogen, free
amino acid composition and soluble protein of each treatment were measured. Total
aerobic and anaerobic counts were done using TSA as the growth medium. Analyses of
the end products (clay 42) were compared with f1l'st grade commercially produced Thai
fish sauce (Nampla).
2.4. Ana.ylieal procedures
2.4.1. Chemical aDalysis
2.4.1.1. pH
The pH of ail fish sauces were measured using a previously calibrated Corning
Model 220 pH meter. Duplicate measurements were made by immersing the electrode
directly into 5 ml samples in a beaker.

-
38
2.4.1.2. Sodium chloride
The sodium chloride content of ail sauces was detennined using a Horiba compact
salt meter Model C-121 (Horiba Instruments, Inc., Irvine, Califomia). Samples \Vere
prepared by diluting 1 ml of fish sauce to 25 ml with deionized water. The Horiba
compact salt meter was calibrated with 0.5% and 5% NaCI standard solution and ail
readings were accurate to within .1<),05%.
2.4.1.3. Total nitrogen
Total nitrogen was determined according to A.O.A.C. (1980) procedures.
Approximately 0.5 ml of fish sauce were placed in the Kjeldahl digestion tube. Eight ml
of concentrated H 2S04 and a Kjeldahl catalyst tablet (3.5 g K2S04 and 175 mg MgO,
Fisher Scientific) were added to the sample and digested in a digester at 4!O°C until a
clear solution was obtained. Distilled water (55 ml) was added to the tube and the
mixture steam distilled using a Labconco Rapid Still III System (modeI65300, Labconco,
Chicago) while 85 ml of a NaOH (50%)/N~S203 (5%) solution were added automatically
via a bullt in dispensing system. The distillate was collected in a 50 ml saturated boric
acid with indicatar (Fisher Scientific). Titration was done using 0.05 N HCl undl the
color changed ta pink-red. The results were expressed as mg nitrogen per ml of fish
sauce using the fallowing fonnula:
Total N (mgN/ml)= Volume of HCI x Normality of HCI x 14.007
Volume of fish sauce (ml)

{
(
39
2.4.1.4. Formol nitrogen
Formol nitrogen, a convenient index of the extent of protein hydrolysis, was
detennined by the formol titration method of Beddows et al., (1976). One ml of fish
sauce was mixed with 40 ml of deionized water and titrated to pH 7.0 with 0.1 N NaOH
and then 10 rr~ of forma lin solution (38% v/v) added to the neutralized sauce. Titration
was continued to pH 8.5 with 0.1 N NaOH. Test results were expressed as mg nitrogen
per ml fish sauce using the fonnula below:
mg formol nitrogen = ml NaOU (pH '-S.5) x Normality of NaOU x 14
2.4.1.5. Soluble protein
Soluble prote in was estimated using the Biuret method of Cooper (1977).
Approximately 0.2 ml of fish sauce was diluted to 1 ml with deionized water. To 1 ml
of sample, 4 ml of biuret reagent was added, mixed and incubated for 20 minutes at 37°C.
The biuret solution was prepared by adding 1.5 g CuS04.5Hz0 and 6 g (NaKC40 6.H20)4
to 500 ml deionized water. Three hundred ml of 10% (w/v) NaOH was then added and
the mixture diluted to 1 L with water. A standard curve, with a concentration range of
1-10 mg/ml protein, was prepared by adding appropriate amounts of a stock Bovine
Serum Alburnin containing 10 mg protein/ml (Sigma Chemical Company) to deionized
watet. The absorbance of test and standard solution was read at 540 nm using 1 ml
deionized water and 4 ml biuret reagent as a blank solution. Test results were expressed
as mg protein per ml fish sauce.

....
40
2.4.1.6. Volatile nltrogen
Volatile nitrogen was detennined by the method of Chayovan et aL, (1983b). A
0.7 ml of fish sauce was pipetted into a Labconeo Kjeldahl steam distillation apparatus
and 4 ml of 0.2% Mg(OH)2 solution added. The sample was distilled to release volatile
nitrogen into 50 ml saturated boric aeid containing indieator. The titration method for
total nitrogen detennination was then used as described previously. Results were
expressed as mg nitrogen per ml fish sauce.
2.4.1.7. Amino acid analysis
Free and total amino acid composition were determined by Reversed Phase High
Performance Liquid Chromatography (HPLC) (System Gold, Beckman Instruments Ine.,
U.S.A.), using dimelhylaminoazobenzene sulfonyl chloride (dabsyl chloride) as the
derivatizing agent. Ali samples were deteeted in the visible range at 436 nm.
2.4.1.7.1. Sam pie preparation
(i) Free amino acids
Fish sauce (3 ml) was deproteinized with 4 volumes of 20% sulfosalicylic aeid
(Lee et al., 1982b) and centrifuged al 15,600 g for 30 minutes. One ml of clear
supematant was diluted 10 100 ml with ultra pure water obtained from a Millipore Milli-Q
Plus System (Millipore Canada Ltd.). A 2ü-Jll diluted sample was placed in a sample
tube (5 x 50 mm) and fret!ze-dried for the dabsylation procedure.
Twenty Jll of dabsylation buffer (50 mM sodium bicarbonate pH 8.1, Beckman
Instruments Inc.) was added to each of the dried test, blank and standard. Fony ~l of the

( "
41
reconstituted dabsylation reagent (1 mg of dabsyl ehloride in 1 ml acetonitrile, Beckman
Instruments Ine.) was then added to eaeh tube whieh was sealed with a stopper and heated
at 7ffc in a heating block for 12 minutes. All tubes were vonexed after 1,4,12 minutes
during the heating period. The tubes were then cooled and 440 pl of dilution buffer (50
mM sodium phosphate pH 7.0/ethanoll:1 v/v, Beckman Instrument Ine.) was added and
mixed gently. The derivatized samples were then stored at 4°C until analysis by Reversed
Phase HPLC.
(ii) Total amine acid
For analysis of the total amino acid composition, 20 )li of each diluted fish sauce
(1: 199) was pipette<! into a sample tube, freeze·dried and then placed in a reaction vial.
Four hundred pl of 6 N HCI (Beckman Instruments Inc.) was then added to each reaction
vial and vials plaeed in a PICO TAG System (Waters Division, Millipore Ltd.) set at
110°C for 24 hours to permit gas phase hydrolysis of the sample. On completion of
hydrolysis, samples were then freeze-dried prior to the dabsylation procedure as described
previously.
2.4.1.7.2. Reversed Phase HPLe Chromatography
The chromatographie analysis was perfonned by a Beckman HPLC System using
an ultrasphere C-18 HPLC column (4.6 x 250 mm, Bcckman Instruments Inc.). The
compositions of the mobile phases are shown in Table 7. The gn.dient program used for
the amino acid analysis is shown in Table 8. Ali eluents were degassed by ultrasonication
before use. Integration of the peak aIeas from the chromatograms, obtained at 436 nm,
was done using the System Gold program. Results were expressed as pmol per ml sauce.

Table 7.
Mobile phase
A
B
Composition 01 the mobile phases used in amino add analysis
Composition
100 ml of 100 mM sodium cittate
860 ml of ultra pure water
40 ml of dimethylfonnamide (DMF)
300 ml of mobile phase A
700 ml of 4% DMF in acetonitrile
42
Source: Beckman, 1989.
Table 8.
Time (min)
Initial
0.00
17.20
23.20
29.20
39.90
The gradient program used for amino acid analysis by Reversed Phase HPLC-System Gold
Flow rate (mVmin) %A %B
1.4 75 25
1.4 44 56
1.4 14 86
1.4 0 100
1.4 75 25
1.4 75 25
Source: Beckman. 1989.
,
iii

(
(
43
2.4.2. Microbiological analysis
Total aerobic and anaerobic plate counts were done using a pour plate technique
(A.P.H.A., 1984). Trypticase soy agar (TSA) (BBL, Becton Dickinson and Co., U.S.A.)
and trypticase soy agar containing 10% NaCI were used as the growth medium.
Media were prepared by suspending 40 g of TSA in either 1 L of distilled water
or 1 Lof 10% NaCI solution, mixing thoroughly and heating with frequent agitation to
boiling temperature. After boiling for 1 minute to completely dissolve the rehydrated
media, the solution was sterilized byautoclaving at 121°C for 15 minutes, cooled and kept
at 4°C until use. Prior to use, the media was melted and cooled to 45°C.
Seriai dilutions of samples were done according to the procedures outlined in
A.P.H.A. (1984), using 0.1% Bacto peptone (Difco Laboratories, Detroit, Michigan)
solution as diluent. Aerobic plate counts were incubated at 37°C for 48-72 hours.
Anaerobie plate counts were incubated at 37°C in an BBL anaerobic jar containing a
BBL Gas Pak Plus (hydrogen-carbon dioxide gas generation pack, Becton Dickinson and
Co.) for the same time period.
Plates containing 25-250 colonies per plate were counted using a colony counter
(A.P.H.A., 1984). Counts, expressed as CFU (Colony Forming Unit) per ml of fish sauce,
were obtained by multiplying the total plate count by the reciprocal of the appropriate
dilution.
1.5. Sensory evaluation
Sensory evaluation was conducted only on fish sauces prepared from various ratios
of 0.6% enzyme supplements at the end of the fermentation period (Day 42) and on the

44
fmt grade commercial Thai fish sauce (N ampla).
A group of nine Southeast Asian students from McGill University, Macdonald
Campus, whose diets usually included fish sauce, were asked to evaluate each situee for
the following preference attributes: (i) color, (ü) aroma and (iii) flavor. Evaluations were
camed out using an unstructured 10-cm hedonic graphic rating seale ranging from dislike
extremely to like extremely as described by Giovanni and Pangbom (1983). Samples
were coded and were evaluated in a random order. The color, aroma and flavor tests
were all done on samples in three separate sessions and, in eaeh session, samples were
presented to panellists at the same time. Ail sensory evaluations were carried out in
duplicate.
2.6. Statistical analysis
Statistical analyses of the data (Analysis of variance and Duncan' s multiple
comparison of means) were canied out as described by Steel and Torrie (1980) using a
Statistical Analysis System (SAS, 1985).

45
CHAPTER 3
RESUL TS AND DISCUSSION
3.1. Chemical and microbiolollical composition of tirst grade and second grade
oommerclally produced Thal tish sauce (Nampla)
3.1.1. Chemical composition
The results of the chemical composition for both grades of Nampla are shown in
Table 9. The pH values and the sodium chloride contents were similar with bath grades
of sauce having pH values of 5.3-5.5 and sodium chloride concentrations of 24-25%.
First grade sauce contained approximately 1.6 times more total nitrogen, 1.5 rimes more
fonnol nitrogen, 1.3 times more soluble protein, 2.6 times more free amino acid content,
( and 1.8 limes more total amino acid content compared to the second grade sauce (Table ....
9). However, volatile nitrogen (mainly ammonia) was comparable in both sauces.
3.1.2. Nitrogen distribution in commercially produced Nampla
The nitrogen distribution for both grades of commercially produced Nampla are
shown in Table 10. The nitrogen content of tirst grade sauce comprised of 53% in the
fonn of free amino acids, 17% as protein and peptides and 13.5% as volatile nitrogen.
However, in second grade sauce, only 31.5% of the total nitrogen was in the fonn of free
ami no acids with more nitrogen being distributed as protein, peptides and volatile
nitrogen, which is indicative of lower quality sauce.
( ,
•

46
Table 9. Chemical composition of first grade and s~ond grade commercially produced Nampla
First grade Second grade
pH 5.51 5.16
NaCI (%) 24.50 25.00
Total N (mgN/ml) 23.57 15.10
Fonnol N (mgN/ml) 13.79 9.07
Ammonia N (mgN/mJ) 3.18 2.41
Soluble prote in (mg/ml) 24.45 18.77
Free AA 1 content (~mol/m1) 628.40 237.23
Total AA 1 content (~mol/ml) 774.00 437.11
1 AA = Amino acid

(
(
(
Table 10.
Sauce
grade
First
Second
47
Distribution of nitrogenous compounds in lirst grade and second grade commercially produced Nampla
Total N % of total N
(mgN/ml) Volatile N Amino acid NI Biuret N2 Other N3
23.57 13.49 52.62 16.59 17.30
15.10 15.96 31.46 19.89 32.69
1 From amino acid analysis data 2 From biuret solubJ.: prote in data (Biuret N = Biuret protein/6.25) 3 Detennined by total N - volatile N - amino acid N - biuret N and could iDclude nucleic
acid and other breakdown products.

48
3.1.3. AmiDO aeid composition .-
The free and total amino acid profiles of both grades of commereially produced
Nampla are shown in Figures :'. and 3, respectively. Both fmt grade and second grade
sauce contained high levels of histidine, lysine, glutamic aeid, alanine. glyeine and valine,
and very low level of arginine, cysteine (cystine) and tyrosine. The essential amino acids
such as lysine, histidine, phenylalanine, valine, leucine, isoleueine, methionine and
threonine were all present in both grades of sauce. Negligible amounts of cysteine
(cystine), arginine and tyrosine were present, probably due to the action of
microorganisms or chemical oxidation and/or deamination of the se amino acids.
Arginine, for example is used as a nitrogen source by sorne microorganisms (Jonsson et
al., 1983). These results are in agreement with the observations of Rosario and Basaran
(1984) who found high levels of essential amino aeids in Philippines fish sauce. They
are also in agreement with the observations of Kurokawa (1986) who reponed that
, ~
glutamic aeid, lysine and alanine were the predominant free ami no acids in Chinese fish ,
sauce. Furthennore, the level of free amino acids was greater in f1l'st grade Chinese sauce
compared to second grade and lower grade sauce.
The high level of glutamic aeid found in mast fish sauces may be due ta the
addition of artificial flvouring agents, such as monosodium glutamate (Tongthai and
Okada, 1981; Rosario and Basaran, 1984). However, this is controlled in regulatory Thai
standards by the ratio of glutamic aeid/total nitrogen WhlCh must be in the range of 0.4-
0.6.

49
( C _~o~n=œ=n~t~(P=m=o=lI~m~I~) ________________________ -= __ ~ 120r-
_ flra' gr.de _ •• cond gf.de
100
80
10
40
20
o a.p glu •• r thr gly al. .rg pro val met Ilu Ile ph. cp Iy. hl. tyr
Amlno acid
Figure 2. Free amino .,;id profile of commercially produced Nampl.
(
Content (JJmol/ml) 120r----------------------------------------------~
_ flra' gf.. _ •• cond gr ..
100
80
10
40
20
o a.p glu •• r thr gly al. .rg pro val met I.u Ile phe cy. Iy. hi. tyr
Amlno acid
( Figure 3. Total amino acid proftle of commercially produced Nampla

• <
-
50
3.1.4. Comparison of eommercially produced Nampla with tlle regulatory Thai
speciti.:ations
Il is evident from Table Il that the pH, sodium chloride content, total nitrogen and
ratio of glutamic acid to total nitrogen for both grades of fish sauce products complied
with Thailand regulatory specifications (Anon, 1983). However, while the amino acid
nitrogen in the first grade sauce complied with specifications, the amine aeid nitrogen was
less th an the regulatory specifications for second grade sauce.
3.1.5. Microbiologiea' .:omposition
The results of microbiological analysis for both grades of sauce are shown in
Table 12. Both aerobic and anaerobic plate counts were less than 103 CFUlml. The low
microbial counts observed are probably due to the high salt concentration in these
produets and the inhibitory effeet of salt on microbial growth. Slightly higher microbial
counts were obtained with TSA media compared to TSA containing 10% NaCl. Therefore.
the residual microorganisms could be classified as halotolerant rather than halophilic,
which is in agreement with the results observed by Crisan and Sands (1975) and
Raksakulthai (1987). However, Saisithi et al., (1966) isolated many halophilic strains
from Nampla while Fujii and Sakai (1984) isolated sorne halophilic baeteria from
Japanese fish sauce. Several acid producing halotolerant and halophilic bacteria were also
isolated from fish sauces produced in Southeast Asia (hoh et al., 1985a,b). While no
regulatory microbiological specifications could be found for Nampla, the low microbial
counts observed for both grades of Nampla in this study were similar to those observed
for other indigenous fish sauces (Fujii et a1.,1980; Itoh et al.,1985a; Kurokawa, 1986).

(
(
•
51
Table 11. Comparison of tirst grade and second grade commercially produced Nampla with regulatory Thai standards
Sauce grade
First Second
Standard1 Nampla Standard1 Nampla
pH 5-6 5.51 5-6 5.26
Sodium chloride (mg/ml) >230 245 >230 250
Total N (mgN/ml) >20 23.57 >15 15.10
Amino acid N (mgN/ml)2 >10 10.60 >7.5 6.66
Glutamic acidffotal N 0.4-0.6 0.62 0.4-0.6 0.46
1 Anon, 1983. 2 detennined by formol N - Ammonia N
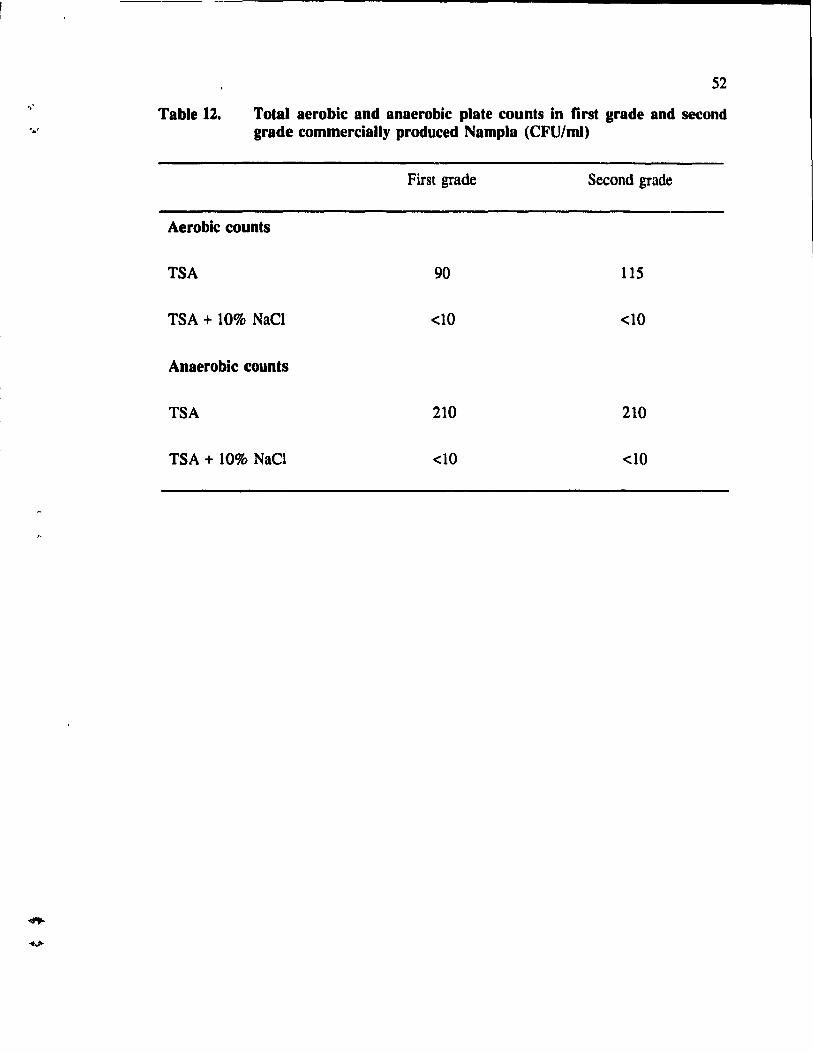
, f
,,'
52
Table 12. Total aerobic and anaerobic plate counts in tirst grade and second grade commercially produced Nampla (CFU/m1)
First grade Second grade
Aerobic counts
TSA 90 115
TSA + 10% NaCl <10 <10
Anaerobie counts
TSA 210 210
TSA + 10% NaCl <10 <10

53
3.2. Production of fish sauce from herring and usina 0.3% of trypsin and
chymotrypsin
3.2.1. Physieal changes
As the fennentation progressed. the texture of all 0.3% enzyme supplemented
herring sauces was more liquefied compared to sauces produced without enzyme (control).
The color of sauces produced with added enzymes was also darker than the control
sauces. However. the control sauce had a more fishy odor compared to sauces prepared
with enzyme supplementation.
3.2.2. pH change
The pH changes for ail herring sauces produced with various proportions of 0.3%
enzyme supplementation during the fennentation period ranged from 5.8-5.9 and did not
vary with time (Figure 4). The constant pH values may he attributed to the buffering
effect of peptides, free amino acids and ammonia in the fermented sauces.
3.2.3. Changes in degree of protein hydrolysis
Changes in the degree of protein hydrolysis of herring fish sauces throughout the
fennentation period are shown in Figure 5. During the fmt IWO weeks, the degree of
protein hydrolysis increased rapidly in ail sauces followed by a more graduai and constant
increase until day 42. The reduction in the rate of the degree of protein hydrolysis after
day 21 is probably due to the accumulation of amino acids and peptides (Orejana and
Liston, 1981), enzyme inactivation, or the substrate becoming limiting with rime. The
addition of various proponions of 0.3% trypsin and chymotrypsin resulted in significantly

54
higher protein hydrolysis throughout the fermentation period (p<0.01) indicating the
potential of ttypsin and chymotrypsin to accelemte the mte of fennentation. 8ased on
these results, a fermentation time of 42 days was used in all subsequent studies.
3.2.4. Chemical composition
The final chemical composition of herring sauces produced from various
proportions of 0.3% trypsin and chymotrypsin (after day 42) are summarized in Table 13.
The final pH value of all sauces mnged from 5.82-5.85. Herring sauce produced
with trypsin alone had a slightly higher salt content compared to the salt content of other
sauces.
Fish sauces prepared with the addition of enzymes contained significantly more
total nitrogen, more formol nitrogen and more soluble protein than the control sauce
(p<0.05) indicating increased proteolysis. Statistical analysis of enzyme treated sauces
indicated that trypsin and chymotrypsin added in the proponions of 50:50 and 0: 100
(trypsin:chymotrypsin) contained more total nitrogen, more formol nitrogen and more
soluble protein than the sauce treated with trypsin alone (p<O.05). However, volatile
nitrogen was not significantly different in any treatments (p>O.05).
Addition of enzymes at various proponions also resulted in significant increase in
free amino acid content of the sauces compared to the control sauce (p<O.05). However,
there was no statistical difference in the concentrations of free and total amino acids
between enzyme treated sauces (p>O.05).
' .....

(
7
8
5
.-3
2
1 .-~ ... 0
Figure 4.
(' ,
ss
pH
T:C - 0:0 ., 100:0
D 50:50 - 0:100
1 7 '4 21 28 35 42 Day.
pH changes during fermentation of herring sauces produced with various proportions of 0.3 % trypsin and chymotrypsin

Figure 5.
Formol nltrogen (mgN/ml) 12
T:C
~ 0:0
-+- 100:0
....... 0:10
~ 0:100
O'---~----~--~-----L--~~~~-o 7 21 28 36
Days
56
Changes in degree or protein hydrolysis during fermentation or herring sauces produced with "arious proportions of 0.3% trypsin and ch)'molrypsin

(
(
(
57
Table 13. Chemical composition of herring sauces produced with various proportions of 0.3% trypsin and chymotrypsin
Sauce type (trypsin:chymotl'ypsin)
0:0 100:0 50:50 0:100
pH 5.821 5.831 5.831 5.851
NaCI (%) 23.25b 24.381 23.45b 23.25"
Total N (mgN/ml) 16.52c 23.71 b 25.771 26.981
Formol N (mgN/ml) 7.43c 9.58b 10.331 10.361
Volatile N (mgN/ml) 0.971 0.9ga 1.031 1.0S1
Soluble prote in (mg/ml) 26.8OC 42.62b 47.17' 49.52'
Free AA1 (J.lmoVml) 250.55b 377.851 361.07' 340.62'
Total AA 1 (J.lmoVml) ND 904.68' 776.01 1 790.01'
Values in the same row follow by the same letter are not significantly different at the 5% level. Values are averages of duplicated batches. 1 AA = amine acid ND"", not determined
-
58
3.2.5. Amino acid composition
The free amino acid composition of the herring sauces produced from various
proportions of 0.3% enzyme supplementation after day 42 are shown in figures 6 and 7.
The level of free amino acids in most sauces produced with added enzyme was higher,
by comparison to the control sauce. Analysis of variance of the amino acid composition
of the various sauces indicated that sauces produced with enzyme supplement contained
significantly higher levels of aspanic acid. threonine, alanine, arginine, leucine. isoleucine
and phenylalanine compared to the control sauce (p<0.05). The distribution of free ami no
acids in ail sauces produced with enzyme supplementation were similar i.e. they contained
high levels of lysine, arginine, valine. isoleucine and alanine in varying amounts. Most
sauces contained low levels of cysteine, histidine, proline and tyrosine.
The total amino acid composition of herring sauces produced with 0.3% enzyme
supplementation are shown in Figures 8 and 9. AlI sauces produced with added enzymes
contained similar levels of total amino acids with glycine, alanine, valine, lysine and
isoleucine being the predominant ami no acids.

.~
"
Figure 6.
" , ,4 "
,f Figure 7.
S9
Content (umol/ml) 80~----~-------------------------------------'
80
40
20
o thr val met leu ne
Amino acld
T:C _ 0:0
_ 100:0
o 10:10 _ 0:100
phe hi.
Essential rree amino acid profile 01 berring sauces produced with various proportions 01 0.3 % trypsin and chymotrypsin
Content (umol/ml) 50~~~~~--~-----------------------------'
40
30
20
10
o •• p glu .er gly ala .rg pro
Amino acid
T:C _ 0:0
_ 100:0
o 10:10
_ 0:100
CV· tyr
Non-essential Iree amino acid profile 01 berring sauces produced with various proportions 01 0.3% trypsin and chymotrypsin

Figure 8.
Figure 9. .....
Content (umol/ml) 100~---------------------------------------------,
80
80
40
20
o thr val met leu Ile IYI
Amino .cld
TIC
_ tOO:O
c::J 10110 _ 0:100
ph. hil
60
Essential total amino acid profile of herring sauces produced with various proportions of 0.3% trypsin and chymotrypsin
Content (umol/ml) 140r-----~------------------------------------__,
120
100
80
60
40
20
o
-
li. ~
.ep ~ ~ ~ ~ ~ ~ ~ ~ ~ ~ ~
glu .er gly ala arg pro
Amino acid
T:C
_ 100:0
D 50:50
_ 0:100
~~
Cyl tyr
Non·essential total amino acid profile of herring sauces produced with various proportions of 0.3% trypsin and chymotrypsin
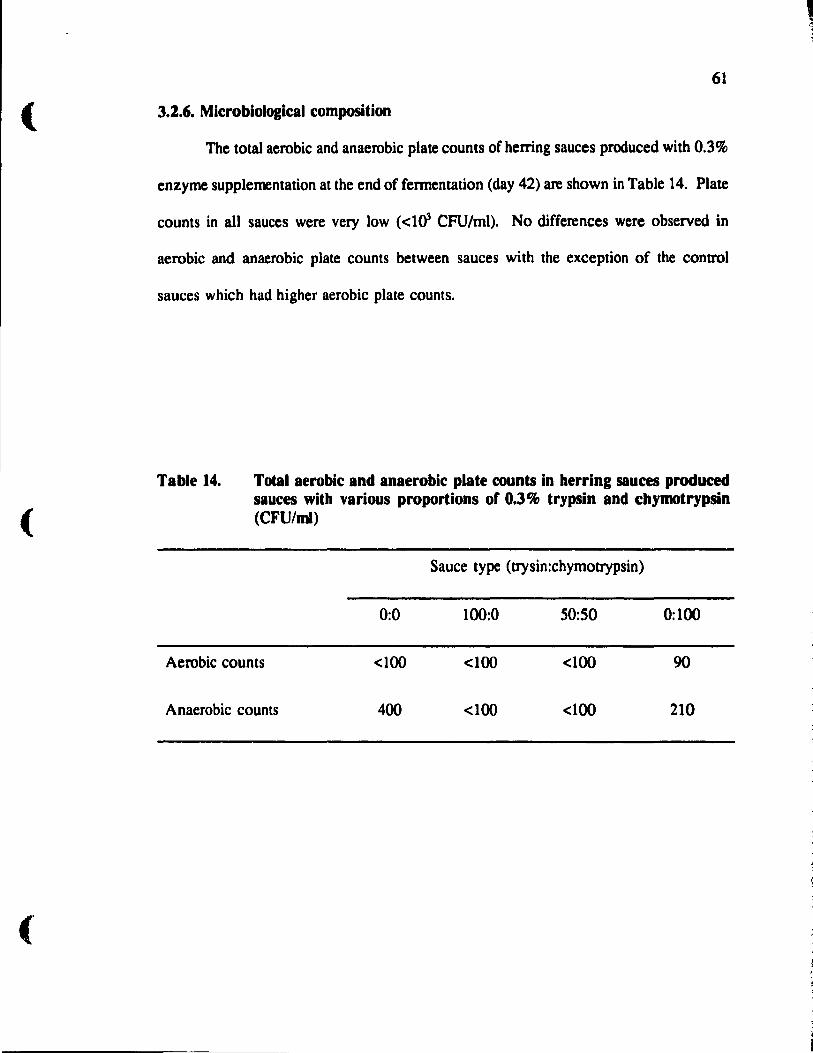
(
(
61
3.2.6. Microbiological composition
The total aerobic and anaerobic plate counts of heITing sauces produced with 0.3%
enzyme supplementation at the end of fennentation (day 42) are shown in Table 14. Plate
counts in all sauces were very low «1~ CFU/ml). No differences were observed in
aerobic and anaerobic plate counts between sauces with the exception of the control
sauces which had higher aerobic plate counts.
Table 14. Total aerobic and anaerobic plate counts in herring sauces produced sauces with various proportions of 0.3% trypsin and chymotrypsin (CFU/mI)
Sauce type (trysin:chymotrypsin)
0:0 100:0 50:50 0:100
Aerobic counts <100 <100 <100 90
Anaerobie counts 400 <100 <100 210
-
62
3.3. Production of fish sauce from herring and using various proportions of 0.6%
trypsin and chymotrypsin
Addition of enzymes has been shown to reduce the fennentation time for fish
sauce production using herring. In the prelimînary study, 0.3% of three proponions of
trypsin and chymotrypsin (100:0, 50:50 and 0:1(0) were evaluated. In this sludy, the
enzyme concentration was increased to 0.6% and five proponions of trypsin and
chymotrypsin (100:0, 75:25, 50:50, 25:75 and 0:100) were used.
3.3.1. pH change
The pH values of aIl herring sauces produced with 0.6% enzyme supplementation
increased gradually throughout fennentation period (Figure 10). This increase in pH can
be attributed to the fonnation of ammonia and amines, such as di- or trimelhylamine
(Orejana and Liston, 1979).
3.3.2. Formation of nitrogenous compounds
The degree of protein hydrolysis, measured as fonnol nitrogen, during the
fennentation of herring sauc~s prepared with various proportions of 0.6% trypsin and
chymotrypsin are shown in Figure Il. As observed previously with 0.3% enzyme
supplementation, the degree of protein hydrolysis in ail sauces produced with 0.6%
enzyme supplementation increased rapidly during the frrst two weeks and followed by a
more graduai and constant increase untit day 42. Statistical analysis showed that the
increase in enzyme concentration from 0.3% to 0.6% resulted in an increase in degree of
protein hydrolysis during the fust two weeks (p<O.OS) white it had no effeel after day 14.

63
The formation of total nitrogen, free ami no acids and volatile nittogen in herring
sauces produced with various propanions of 0.6% trypsin and chymotrypsin increased as
fermentation progressed (Figures 12, 13 and 14). Initially, the formation of total nitrogen
and free amino acids increased rapidly and then declined. However, the rate of increase
in volatile nitrogen was consistent throughout the fennentation period. Funhermore, the
formation of soluble protein and peptides increased and then decreased as the
fennentation progressed (Figure 15). During fennentation, proteolysis resulted in an
increase of smaller polypeptides as measured by biuret reaction. Biuret l'eagent reacts on
the peptide bonds except for dipeptide. However, as fennentation progressed the
concentration of peptides decreased while the concentration of free amino acids and
volatile bases increased due to the action of proteolytic enzymes. These results are aIso
similar to the observations of Raksakulthai (1987) in the fermentation of capelin fish
sauce.

..
pH 8.3
8.2
8.1
8
5.8
T:C
- '00:0
~ 71:21
-*" 10:10
-+ 21:71
.. 0:100
5.8 L_--J.. __ ---L.. __ -'---__ ..L.--_~~~~_ o 7 14 21 28 35 42
Daye
64
Figure 10. pH changes during fermentation of herring sauces produced with various proportions of 0.6% trypsin and chymotrypsin

. t
(
Formol nitrogen (mgN/ml) 12
10
8
6
4
7 14 21 28
Days
T:C
- 100:0
-&- 7&:2&
~ 50:50
-+- 2&:15
..... 0:100
35
65
42
Figure Il. Changes in degree of protein hydrolysis during fermentation of herring sauces procluced with various proportions of 0.6% trypsin and chymotrypsin

."....
Total N (mgN/ml) 30
1 .. 21 28
Day.
66
T:C
- 100:0
-e- 75:25
-*"" 50:50
-+- 25:75
......êr- 0:100
35 .. 2
Figure 12. Changes in total nitrogen during fermentation of herring sauces produced with various proportions of 0.6% trypsin and chymotrypsin

(
(
(
Free amino acide (umol/ml) 800
500
21
Day. 28
T:C
- 100:0
~ 75:25
~ 50:50
-+- 25:75
....e.- 0:100
35
67
Figure 13. Changes in (ree amino acid co ~nt ;, ing ft=rmentation of herring sauces produced with various t ~'p(). tions of 0.6% trypsin and chymotrypsin

~ . ,
Volatile N (mgN/ml) 1.4
1.2
68
Figure 14. Changes in volatile nitrogen during fermentation or herring sauces produced with various proportions orO.6% trypsin and chymotrypsin

(
,( -..
Soluble protein (mg/ml) 50
20
7 14 21 28
Daye
69
T:C
- 100:0
-e- 7&:21
~ 10:&0
+ 2&:71
+- 0:100
35 42
Figure 15. Changes in soluble protein during fermentation of berring sauces produced with various proportions of 0.6% trypsin and chymotrypsin
70
3.3.3. Chemial composition
The chemical composition of herring sauces produced with various proportions of
0.6% enzyme supplementation after day 42 are summarized in Table 15. The pH, sodium
chloride content and volatile nitrOgen were comparable in ail sauces (p>O.05). The
addition of 0.6% trypsin resulted in the lowest concentration of total nitrogen, fonnol
nitrogen and soluble protein (p<O.05) while sauces treated with other enzyme proponions
contained sunilar amounts of total nitrogen (p>O.05). The amount of fonnol nitrogen wall
greatest in sauce produced with an enzyme proponion of 25:75 while soluble protein was
greatest in sauce produced with an enzyme proportion of 50:5ù. Laboratory herring sauce
supplemented with an enzyme proponion of 25:75 contained significantly higher amount
of free amino acids than other enzyme proportions used in herring fish sauce fennentation
(p<0.05). However, Ihere was no significant difference in the total amino aeid
concentration between treatments (p>O.05).

(
(
(
71
Table 15. Chemical composition of final herring sauces produced with various proportions of 0.6 % trypsin and chymotrypsin
Sauce type (trypsin:chymotrypsin)
100:0 75:25 50:50 25:75 0:100
pH 6.16· 6.22· 6.21· 6.1~ 6.l~
Nael (%) 23.25· 23.25· 23.38· 23.25a 23.38·
Total NI 24.61 b 27.46· 26.57· 27.19a 27.62·
Fonnol NI 9.84c lO.l5bc 10.06bc 1O.48a 10.22·b
Volatile NI 1.12· 1.00· 0.95· 0.95a 1.17·
Sol. Protein2 38.08c 41.15·b 41.66' 40.51 ab 40.29b
Free AA3 443.04b 462.22b 466.12b 492.35a 459.67b
Total AA3 794.30' 932.00a 920.20' 1008.80a 999.00-
Values in the same row follow by the same letter are not significantly different at the 5% level. Values are average3 of duplicated batches. 1 Express as mgN/ml 2 Express as mg prote in/ml 3 Express as J.lmoVml
72
3.3.4. Comparison of nitrogenous compounds of herring sa .... ces produced with 0.3%
and 0.6% trypsin and chymotrypsin al the proportions of 100:0, 50:50 and
0:100
The result of statistical analysis of the nitrogenous compounds of herring sauces
produced with 0.3% and 0.6% enzyme concentration at the proponions of 100:0,50:50
and 0: 100 after day 42 are shown in Table 16. It is evident from Table 16 that an
increase in enzyme concentration from 0.3% to 0.6% has a pronounced effect on the
amount of nitrogenous compounds as shown by the increase in total nitrogen and free
amino acid and the decrease in soluble prote in (p<0.05). Since trypsin and chymotrypsin
are very active during the early stage of fish sauce fermentation (Ore jan a, 1978), the
addition of 0.6% enzyme concentration may enhance the hydrolysis of fish protein during
the frrst 14 days of fennentation.
3.3.5. Comparison of the chemical composition of herring sauces produced with
various proportions of 0.6% trypsin and chymotrypsin and tirst grade
commercially produced Nampla
A comparison of the chemical composition of herring sauces prepared with various
proportions of 0.6% enzyme concentration and first grade commercially produced Nampla
is shown in Table 17. The results show thal the pH value of commercially produced
Nampïa was significantly lower than laboratory produced herring sauces (p<O.OS). This
may be due to more volatile and non volatile fatty acids produced during the longer
fermentation time period of 6 months or more used in commercial sauce production.
These volatile and non volatile fauy acids contribute to the navor and arorna of fish sauce

73
( (Saisithi et al., 1966; Dougan and Howard, 1975; Chayovan et al., 1983a; Ooshiro et al.,
1981).
The sodium chloride content of commercially prcxiuced Nampla was slightly
higher than the laboratory produced sauces. This may attributed to a greater moisture
10ss during storage.
First grade commercially produced N ampla contained similar amounts of total
nitrogen compared to the sauces produced with trypsin alone (p>O.05) but contained
significantly less total nitrogen than herring sauces produced with other enzyme
proportions (p<O.05). However, commercially prcxiuced Nampla contained significantly
higher formol nitrogen compared to ail laboratory produced herring sauces (p<O.05).
The volatile nitrogen in commercially produced Nampla was approximately three
times higher than ail laboratory produced herring sauces. Amrnonia and other volatile
bases were reponed to contribute to the ammonia like aroma (Dougan and Howard, 1975).
Hence, fust grade commercially produced N arnpla may have stronger ammoniacal arorna
than herring sauces produced with various proportions of 0.6% trypsin and chymotrypsin.
Furthermore, first grade cornrnercially produced Narnpla contained significantly
less soluble protein than all laboratory produced sauces (p<0.05). However, herring
sauces supplemented with various proporations of 0.6% trypsin and chymotrypsin
contained significantly lower concentrations of free ami no acids (p<O.05) but comparable
levels of total ami no acids (p>O.05) compared to comrnercially produced Nampla.
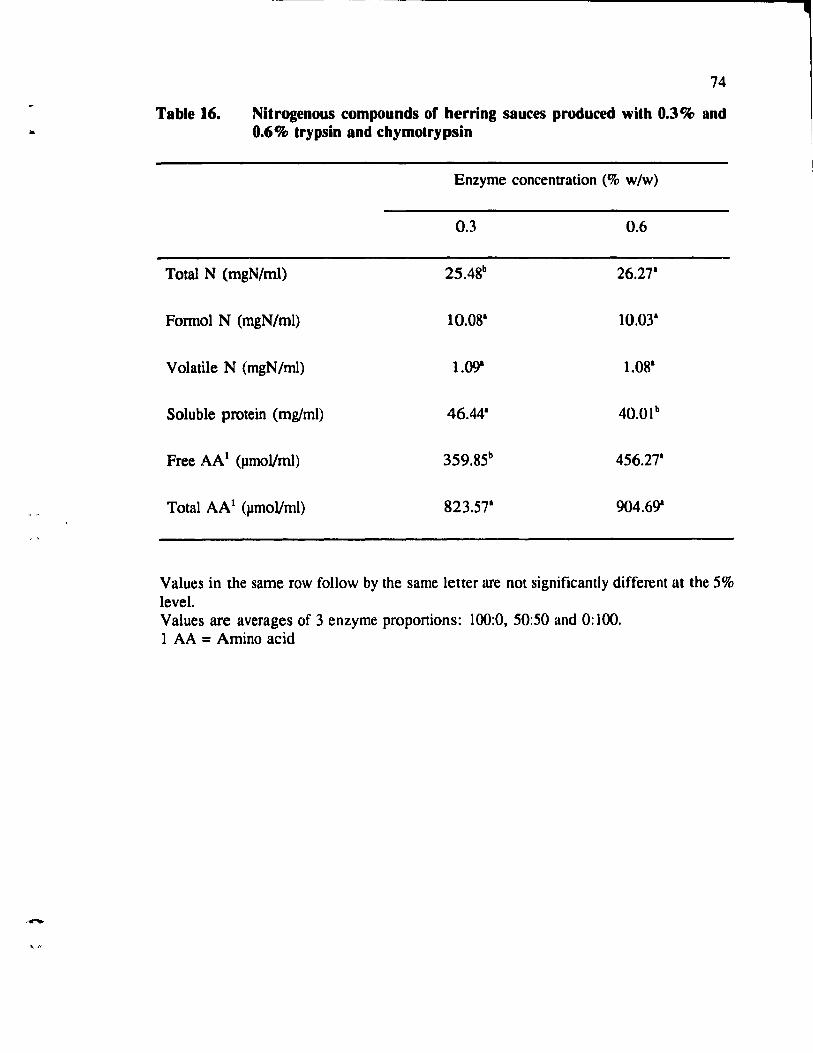
..
-
74
Table 16. Nitrogenous compounds of herring sauces produced with 0.3% and 0.6% trypsin and chymotrypsin
Enzyme concentration (% w/w)
0.3 0.6
Total N (mgN/ml) 25.4gb 26.271
Fonnol N (mgN/ml) 10.081 10.031
Volati.le N (mgN/ml) 1.091 1.081
Soluble prote in (mg/ml) 46.441 40.01 b
Free AA1 (pmoVml) 359.85b 456.271
Total AA1 (pmoVml) 823.571 904.691
Values in the same row follow by the same letter are not significantly different at the 5% level. Values are averages of 3 enzyme proponions: 100:0, 50:50 and 0:100. 1 AA = Amino acid
•

(
"
~
75
Table 17. Chemical composition of herring sauces produced with various proportions of 0.6 % trypsin and chymotrypsin and tirst grade commercially produced Nampla
Sauce type
100:01 75:251 50:501 25:751 0:1001 Nampla
pH 6.2· 6.2· 6.2· 6.2· 6.2· 5.5b
NaCI (%) 23.3b 23.3b 23.4b 23.4b 23.4b 24.5·
Total ~ 24.6b 27S 26.6' 27.2· 27.6' 23.6b
Formol N2 9.8c 10.2bc lO.1bc 10.5b 1O.2bc 13.8'
Volatile N2 1.1 b LOb 1.0b 1.0b 1.2b 3.2·
Soluble 38.11: 41.2·b 41.7' 40.5b 40.31 24.4d
protein3
Free AA4 443.01: 462.2bc 466.1 bc 492.4b 459.7bc 628.41
Total AA4 794.3' 932.21 920.21 1008.81 999.6· 774.oa
Values in the same row follow by the same letter are not significantly different at the 5% level. 1 trypsin:chymotrypsin 2 Express as mgN/ml 3 Express as mg proteill/ml 4 Express as pmol/ml AA = Amino acid

76
3.3.6. Distribution of nitrogenous compounds in herring sauces produced with
various proportions of 0.6% trypsin and chymotrypsin and tirst grade
commercially produced Nampla
The nitrogen distribution of aU laboratory produced herring sauces with 0.6%
enzyme supplementation and first grade conunercially produced Nampla are shown in
Table 18. The distribution of free amino acids, volatile nitrogen and soluble protein and
peptides was highest in the sauces produced with the enzyme proponions of 25:75, 100:0
and 50:50 trypsin:chymotrypsin, respectively. Although total nitrogen was greater in the
sauce produced with chymotrypsin alone, nitrogen was distributed less in the foml of free
ami no acids compared to a11 other sauces. A comparison of nitrogenous compounds
found in the hening sauces produced with various proponions of 0.6% enzyme
supplementation and first grade commercially produced Nampla (Table 18) indicated that
the longer fermentation/storage time period for commercially produced Nampla resulted
in more soluble protein and peptides being broken down into free amino acids and
volatile bases. This is evident by the presence of higher amounts of nitrogen in the form
of free amino acids and volatile nitrogen and the lower concentration of protelil and
peptides in the commercial prodl',t than that found in ail laboratory produced sauces.
Generally, a low concentration of vol .. tile nitrogen in hemng sauces is indIcative of less
breakdown of amino acids to ammonia and other volatile bases. The presence of high
volatile nitrogen (more than 25% of total nitrogen) indicates poorer quality fish sauce
(Sanchez and Klitsaneephaiboon, 1983). High grade fish sauce contains not less than
40% amino nitrogen and not more th an 60% of total nitrogen. However, the only enzyme
treated sauces which contaiw:J these levels of amino nitrogen was the herring sauce
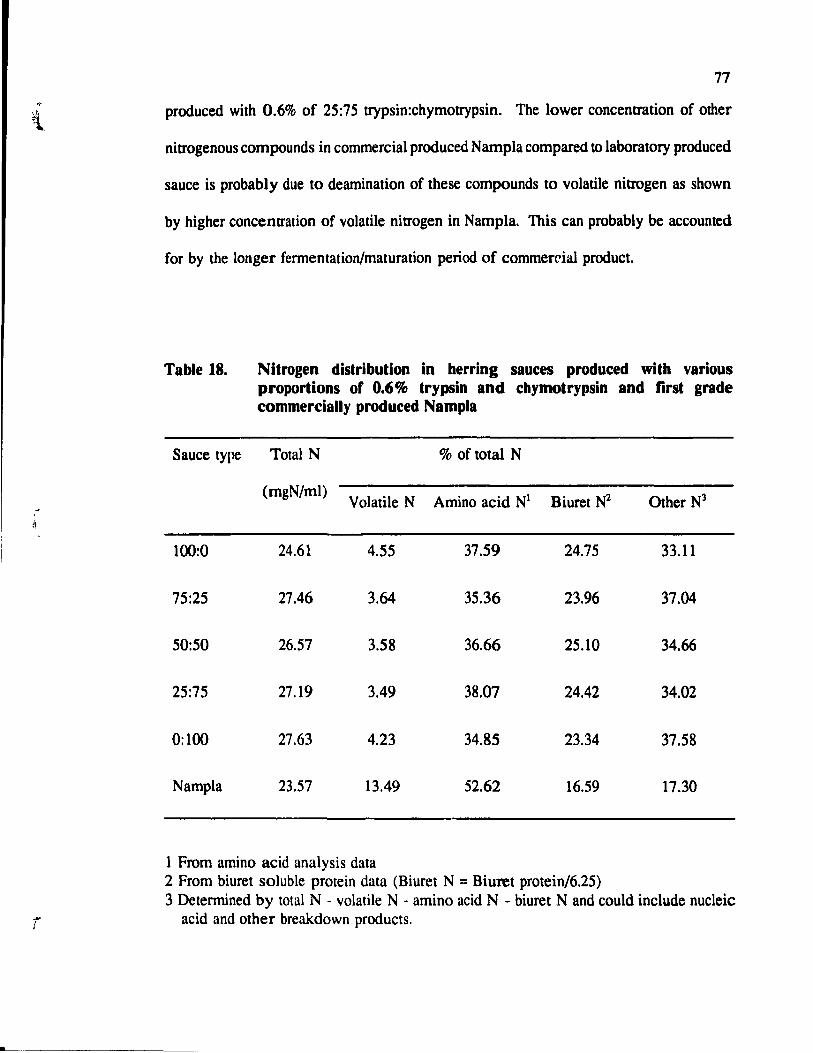
,1
r
•
77
produced with 0.6% of 25:75 trypsin:chymotrypsin. The lower concentration of other
nitrogenous compounds in commercial produced Nampla compared to laboratory produced
sauce is probably due to deamination of the se compounds to volatile nitrogen as shown
by higher concentration of volatile nitrogen in Nampla. This can probably be accounted
for by the longer fermentation/maturation period of commer~ial product.
Table 18. Nitrogen distribution in herring sauces produced with various proportions of 0.6 % trypsin and chymotrypsin and tirst grade commercially produced Nampla
Sauce type Total N % of total N
(mgN/ml) Volatile N Amino acid NI Biuret N2 Other N3
100:0 24.61 4.55 37.59 24.75 33.11
75:25 27.46 3.64 35.36 23.96 37.04
50:50 26.57 3.58 36.66 25.10 34.66
25:75 27.19 3.49 38.07 24.42 34.02
0:100 27.63 4.23 34.85 23.34 37.58
Nampla 23.57 13.49 52.62 16.59 17.30
1 From amino acid analysis data 2 From biuret soluble protein data (Biuret N = Biuret protein/6.25) 3 Determined by total N - volatile N - amino acid N - biuret N and could include nucleic
acid and other breakdown products.

" 3.3.7. Amino aeid composition
3.3.7.1. Free amino aeid
78
The free amine acid composition of labordtory produced herring sauces produced
with various proportions of 0.6% enzyme supplementation at the end of fermentation (day
42) are shown in Figures 16 and 17. AlI herring sauces had similar free amine aeid
compositions. A high level of lysine, isoleucine, valine, arginine and alanine and a low
level of proline, cysteine and t}Tosine were observed in a11 sauces. These observations
are in agreement with results obtained using 0.3% enzyme concentration. Analysis of
variance of the free ami no aeid composition among herring sauces produced from 0.6%
trypsin and chymotrypsin showed that the enzyme proportions of 100:0 and 25:75
(trypsin:chymotrypsin) resulted in a significantly higher levels of glutar.1ic aeid white the
enzyme proponions of 25:75 and 0: 100 gave a significantly higher level of proline and
phenylalanine compared to ail other enzyme proponions (p<0.05). In addition,
supplementation with trypsin alone resulted in a significantly lower level of histidine in
the end product than all other enzyme proponions (p<0.05).
The essential amine acids i.e. threonine, valine, methionine, leucine, isoleueine,
proline, lysine and histidine, required for a balanced diet, were present in the free form
at fairly high concentrations in all herring sauces produced with 0.6% enzyme
supplementation.
Free ami no acids not only contribute to the nutritive value of {ïsh sauce but a1so
to its flavor. Free ami no acids and nucleotides were suggested by Lee et aL, (1981;
1982a) to he the main taste active compounds in fennented sardine and anchovy. The
tas te active amino acids in fermented squid were glutamic aeid, alanine, leucine. serine,

79
( lysine, arginine and proline (Lee et al., 1982b). Chung and Lee (1976) reponed that the
most imponant taste compounds in fennented shrimp were the free amino acids, lysine,
proline, alanine, glycine, serine, glutamic acid and leucine. Konosu (1979) identified free
amino acids as taste-active compounds in squid, notably; proline, glycine, alanine and
serine. Lee and Sung (1977) concluded that the major taste-active compounds of brine
squid are the amino acids proline, leucine, serine, lysine, arginine and alanine. The free
amino acids lysine arginine and alanine were abundantly present in all herring sauces
produced with 0.6% enzyme supplementation and therefore may contribute to the taste
of fish sauce produced from herring.
(
( '.

.. Content (umol/ml)
70~----~~----~------------------------------~
60
50
40
30
20
10
o thr val met leu ile Iy.
Amlno acid
T:C _ 100:0
_ 75:25
CJ 50:&0 _ 2&:75
Imml 0:100
ph. hl.
80
Figure 16. Essential free amino acid profile of final herring sauces produced wUh various proportions of 0.6% trypsin and chymotrypsin
Content (umol/ml) 50~---------------------------------------------.
40
30
20
10
o a8p glu .er gly ala .rg
Amino acld pro
T:C _ 100:0
_ 75:25
o 50:50
_ 25:75
liillilI 0: 100
cyl tyr
Figure 17. Non-essential free amino acid profile of final herring sauces produced with various proportions of 0.6% trypsin and chymotrypsin

-"
-'
81
3.3.7.2. Comparison of free ami no aeid ~omposition of herring sauces produced with
0.3% and 0.6% trypsin ~nd chymotrypsin at the proportions of 100:0, 50:50
and 0:100
A comparison of the free amino acid composition of the final herring sauces
produced with 0.3 % and 0.6% enzyme concentration at the proportions of 100:0, 50:50
and 0:100 (trypsin:chymotrypsin) is shown in Table 19. It is evident that supplementation
with 0.6% trypsin and chymotrypsin had a significant effect on the amount of the amino
acids glutamic acid, glycine, alanine, arginine, valine, methionine, leucine, isoleucine,
phenylalanine and histidine in the end products (p<0.05). Since trypsin and chymotrypsin
are endopeptidases, the increase in enzyme concentration from 0.3% to 0.6% may
encourage higher proteolysis and production of more peptides which would serve as
substrates for other exopeptidases naturally present in fish.
3.3.7.3. Comparison of free amino aeid composition of herring sauces produced with
various proportions of 0.6% trypsin and chymotrypsin and the tirst grade
eommercially produced Nampla
A comparison of the free amino acid composition of final herring sauces produced
with various proponions of 0.6% enzyme concentration and first grade commercially
produced Nampla is shown in Table 20. The concentration of free amino acids, with the
exception of arginine, valine, methionine, isoleucine, phenylalnine, lysine and tyrosine
were significantly lower in laboratory produced sauces compared to first grade
commercially produced Nampla (p<O.05). The lower level of glutamic acid, alanine,
leucine, proline and serine, which are considered as tas te active amino acids in fish sauce,
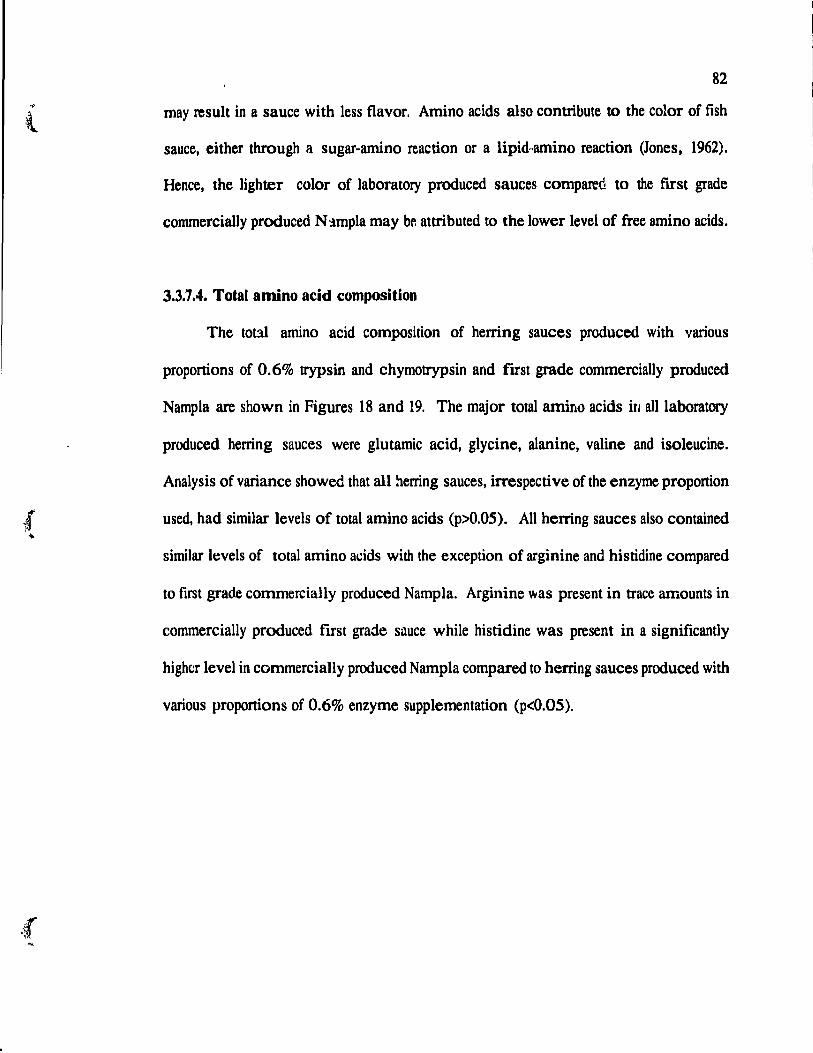
82
may result in a sauce with less flavor. Amino acids also contribute to the color of fish
sauce, either through a sugar-amino reaction or a lipid",amino reaction (Jones, 1962).
Hence. the lighter color of laboratory produced sauces compareQ to the first grade
commercially produced N -.tmpla may br. attributed to the lower level of free amino acids.
3.3.7.4. Total amino acid composition
The tot:ù amino acid composition of herring sauces produced with various
proportions of 0.6% trypsin and chymotrypsin and IU'st grade commercially produced
Nampla are shown in Figures 18 and 19. The major total amino acids in alilaboratory
produced herring sauces were glutamic acid, glycine, alanine, valine and isoleucine.
Analysis of variance showed that all herring sauces, irrespective of the enzyme proportion
used, had similar levels of total amino acids (p>O.05). AlI herring sauces also contained
similar I~vels of total amino acids with the exception of arginine and histidine compared
to first grade commercially produced Nampla. Arginine was present in trace amounts in
commercially produced frrst grade sauce white histidine was present in a significantly
highcr level in commercially produced Nampla compared to herring sauces produced with
various proportions of 0.6% enzyme supplementation (p<O.05).

'. "
-
Table 19.
83
Free amino acid composition o~ herring sauces produced with 0.3% and 0.6% trypsin and chymofrypsin
Amino acid (pmoVml) Enzyme ,'oncentration (% w/w)
0.3 0.6
asp 23.38- 23.071
glu 17.95b 22.041
ser 18.39- 21.411
thr 20.72- 24.761
gly 11.06b 19.741
ala 36.45b 42.88'
arg 37.17b 43.01'
pro 4.49- 10.021
val 34.2ct 53.761
met 9.59b 20.751
leu 12.55b 23.311
ile 35.57b 52.221
phe 17.58b 21.881
cys 3.04- 1.14b
lys 65.42- 57.351
his 5.8Qb 14.491
tyr 5.88- 4.47a
Values in the same row follow by the same letter are not significantly different at the 5% level Values are averages of 3 enzyme proportions: 100:0, 50:50 and 0:100.

;(
( ,
Table 20.
Amino
acid
asp
glu
ser
thr
gly
ala
arg
pro
val
met
leu
ile
phe
cys
lys
his
tyr
84
Free amino aeid composition of laboratory herring sauces produeed with various proportions of 0.6% trYP!iin and chymotrypsin and commercially produced Nampla
Sauce type
100:01 75:251 50:501 25:751 0: 1001 Nampla
23.09b 25.S6b 23.0Sb 22.71b 23,09b 46.79"
25.02b 22.21 c 20.22c 22.52c 20.88c 54.741
21.84b 22.0Sb 22.03b 22.03b 20.36b 33.20'
23.21b 23.80b 24.77b 26.11b 26.32b 49.771
17.92b 17.52b 23.98b 18.12b 17.32b 49.90'
43.66b 43.67b 42.77b 44.17b 42.21 b 75.421
42.501 44.41 1 44.551 47.971 41.981 traceb
8.9gc 9.55bc 9.86bc 11.17b 11.21b 24.731
51.901 53.311 53.141 57.371 56.261 5S.531
19.941 21.781 21.891 24.50' 20.411 14.761
23.33b 23.44b 21.S9b 25.12b 24.70b 36.09'
51.951 53.101 50.621 58.2S' 54.091 31.411
18.71c 22.281bc 22.S91b 25.8S' 24.061b 20.40bc
1.32b 1.16b 1.0Sb 1.24b l.04b 2.221
55.331 57.3S' 61.351 61.761 55.361 5S.40'
9.80b 15.45b 17.77b IS.llb 15.90b 103.761
4.551b 4.67ab 4.2gb 5.33' 4.581b 1.43c
Values (pmoVml) in the same row follo~ by the sarne letter are not significantly different
at the 5% level.
1 trypsin:chyrnotrypsin
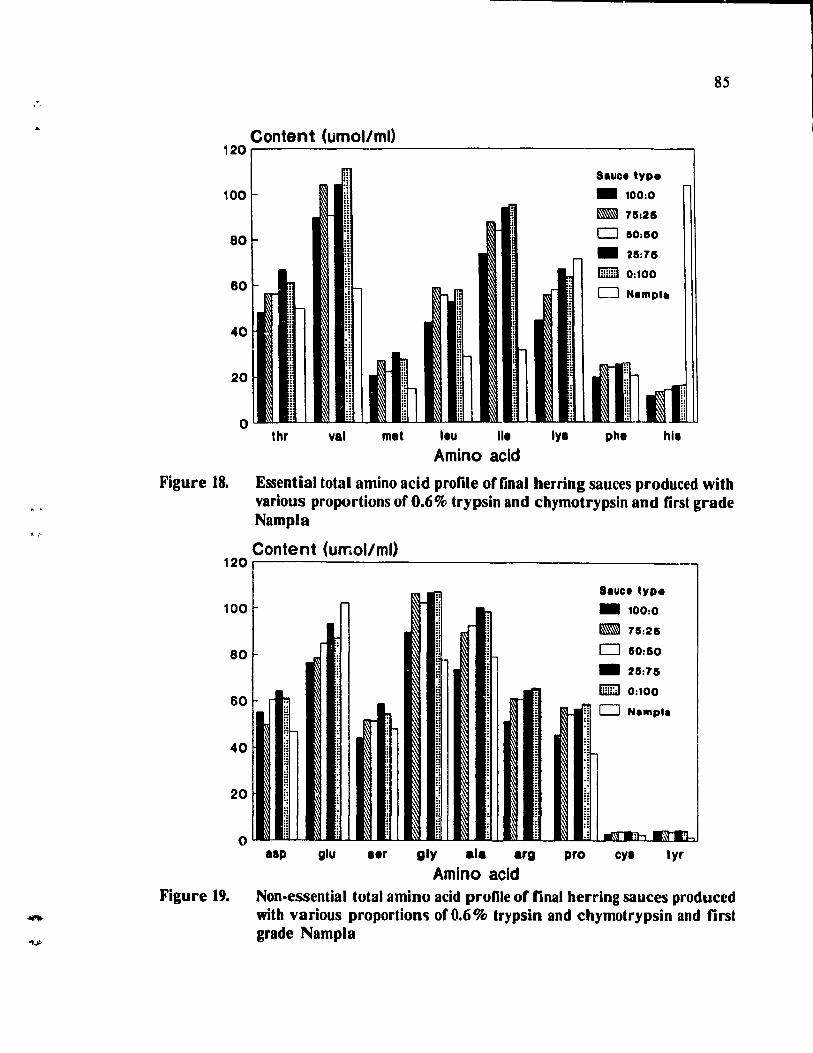
,( r
Content (umol/ml) 120r----------------------------------------------,
100
80
60
40
20
thr val met I.u Il.
Amino acld IYI
Sauce type _ 100:0
_ 715:25
o 50:150
_ 115:75
liiilliJ 0: 100
o Na"'pl.
ph. hi.
85
Figure 18. Essential total amino acid profile of final herring sauces produced with various proportions of 0.6% trypsin and chymotrypsin and first grade Nampla
Content (umol/ml) 120.-----------------------------------------------,
Sauce type
100 _ 100:0
_ 75:215
80 o 50:150
_ 25:75
liill:iJ 0: 100 60
CJ Na"'pla
40
20
o aep glu 1er gly ala arg pro Cyl tyr
Amino acid Figure 19. Non-essential total amino acid profile of final herring sauces produced
with various proportions of 0.6 % trypsin and chymotrypsin and first grade Nampla
86
3.3.8. Microbiological analysis
The total aerobic and a:1aerobic plate counts of herring sauces produced with
various proportions of 0.6% trypsin and chymotrypsin are shown in Tabl.es 21 and 22.
At the onset of fermentation, anaerobic plate counts in all sauces were slightly higher
compared to aerobic plate counts probably due to the closed system of the fermentation
container which would favor tne growth of anaerobic bacteria. However, both aerobic
and anaerobic plate counts were less than 103 CFU/ml after 7 days fermentation. Total
viable counts have been shown to decrease during fish sauce fermentation (Hamm and
Clague, 1950; Orejana and Liston, 1979). At the end of fermentation of laboratory
produced herring sauce (day 42), both aerobic and anaerobic plate counts were lower than
10 CFU/ml Le. similar to counts observed for commercially produceri Nampla. Since
mi~robial counts were very low at the initial stages of fermentation when proteolysis was
most rapid, it is unlikely that microorganisms contribute to proteolysis during fish sauce
fennentation.
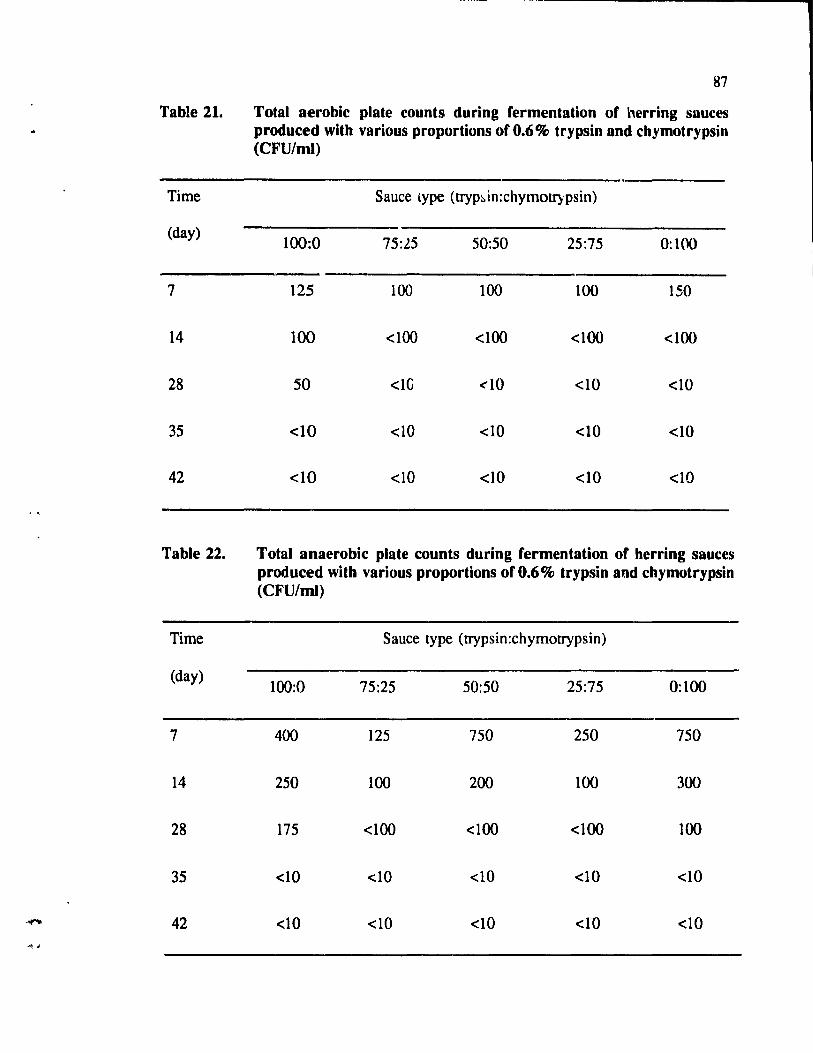
87
Table 21. Total aerobic plate counts during fermentation of herring sauces produced with various proportions of 0.6% trypsin and chymotrypsin (CFU/ml)
Time Sauce type (tryp~in:chymol1)'psin)
(day) 100:0 75:25 50:50 25:75 0:100
7 125 100 100 100 150
14 100 <100 <100 <100 <100
28 50 <1G <10 <10 <10
35 <10 <10 <10 <10 <10
42 <10 <10 <10 <10 <10
Table 22. Total anaerobic plate counts during fermentation of herring sauces produced with various proportions of 0.6% trypsin and chymotrypsin (CFU/mI)
Time Sauce type (trypsin:chymotrypsin)
(day) 100:0 75:25 50:50 25:75 0:100
7 400 125 750 250 750
14 250 100 200 100 300
28 175 <100 <100 <100 100
35 <10 <10 <10 <10 <10
"""'" 42 <10 <10 <10 <10 <10 .., .

(
(
(
88
3.3.9. Sellsory evaluation
The results of the sensory evaluation of tinal herring sauces produced with various
proportions of 0.6% trypsin and chyrnotrypsin and fll'st grade cornmercially produced
Narnpla are summarized in Tables 23 and 24. Statistical analysis of the sensory data
shows that there was a significant difference in color score (p<O.Ol). Panellists preferred
the clear, light brown color of laboratory produced fish sauces to the darker brown color
of fll'st grade commercially produced Nampla. While there was no significant difference
in the rneans for arorna and flavor between fish sauces (p>O.05), there was, however, a
highly significant difference between panellists (p<O.Ol). Three of the panellists preferred
the stronger arorna and flavor of first grade cornmercially produced Nampla to the milder
arorna and flavor of laboratory produced sauces. However, three panellists preferred the
rnilder aroma and flavor of laboratory produced sauces compared to the stronger arorna
and flavor of fmt grade cornrnercially produced Nampla. The rernaining three panellists
had no preference for either sauce. The darker color and stronger aroma and flavor of
fiTSt grade cornmercially produced Narnpla is probably due to the higher level of free
amino acids, volatile bases and volatile and non volatile fatty acids produced during the
longer fermentation/aging period. No significant difference was observed in the color,
arorna and flavor of laboratory produced sauces using various proponions of 0.6% trypsin
and chyrnotrypsins (p>O.05).

89 ...
Table 23. Analysis of variance on preference of color, aroma and navor of • herring sauces produced with various proportions of 0.6 % trypsin and
chymotrypsin and tirst grade commercially produced Nampla
SouTce df ColoT MS Aroma MS Flavor MS
Panelist 8 13.15" 14.56" 21.23"
Sauce type 5 38.75" 0.67111 0.2801
Error 40 4.14 1.26 6.18
Residual 54 0.27 1.45 6.18
MS = Mean Square ** significantly different at the 1 % level ns not significantly different at the 5% level
,-,

(
(
(
90
Table 24. Means of preference scores of color, aromQ and flavor of herring sauces produced with various proportions of 0.6% trypsin and chymotrypsin and first grade commercially produced Nampla
Treatment Color Aroma Flavor
1 ()():O (T:C) 7.40' 5.47' 6.79'
75:25 (T:C) 7.40' 5.26' 6.95'
50:50 (T:C) 7.29' 5.3~ 6.62'
25:75 (T:C) 7.27' 5.43' 6.44'
0:100 (T:C) 7.24' 5.32' 6.90'
Nampla 3.73b 5.13' 6.88'
Means scores range from O-dislike extremely to 10-1ike extremely. Values in the same column follow by the sarne lener are not significantly different at the 5% level. Values are averages of 18 observations. T:C = trypsin:chyrnotrypsin

91
CHAPTER4
SUMMARY AND CONCLUSION
The quality of first graàe commercially produced Nampla was superior than
second grade Nampla in terms of its higher total nitrogen. fonnol nitrogen, free and total
amino acid content. Overall, the quality of first grade sauce met aIl the regulatory
specifications of Thailanci while second grade sauce comained only less amino nitrogen
than the required regulatory specifications.
In the preparation of fish sauces using herring, enzyme supplementation with
trypsin and chymotrypsin has the potential to accelerate the rate of fish sauce
fennentation. The degree of protein hydrolysis increased significantly (p<O.Ol) compared
to control sauces (no added enzyme) IUld the enzyme supplemented sauces contained
higher amounts of formol nitrogen, total nitrogen, soluble protein and free afiÙno acid
compared to control sauces (p<0.05). An increase in ~î1zyme concentration from 0.3%
to 0.6% further increased the level of total nitrogen and free amino acids in the end
products (p<0.05). Changes in the nitrogenous composition of sauces produced with
various proportions of 0.3% and 0.6% enzyme supplementation occurred mainly during
the initial stages of fermentation (14 days) as shown by the rapid increase in formol
nitrogen, total nitrogen and free amino acids. Microbial counts were very low at the
onset of fermentation, confirming that microorganisms did not appear to play a significant
role in proteolysis of fish sauce fermentation.
The addition of trypsin alone produced less favorable results with increasing
proportions of chymotrypsin te trypsin giving the most favorabk results. With respect

92
to the contents of total nitrogen, fonnol nltrogen and free amino acids, the optimum
results were obtained using 0.6% of 25 :75 trypsin:chymotrypsin. In tenns of cost, this
proportion is also more viable since chymotrypsin is less expensive than trypsin.
A comparison of the chemical composition of herring fish sauces produced with
various proportions of 0.6% trypsin and chymotrypsin and first grade commercially
produced Narnpla showed that laboratory produced fish sauce was comparable in tenns
of its total nitrogen and total ami no acid content. However. it comained significantly less
amounts of formol nitrogen. free amino acid and volatile bases (p<O.05). Analysis of the
free amino acid profile indicated that herring sauces produced with various proponions
of 0.6% enzyme supplementation contained significantly less of the free amine acids
aspartic acid, glutamic acid. serine, threonine, glycine, alanine, praline, leucine, cysteine
and histidine compared to the first grade commercially produced Nampla. This may
contribute to the lighter color and less flavor and aroma of laboratory produced fish
sauces in the sensory evaluation with first grade commercially produced sauce. However,
the results of the sensory evaluation showed that panellists preferred the lighter color of
herring sauces produced with various proponions of 0.6% rrypsin and chymotrypsin to
the darker col or of first grade Nampla. Nampla had a stronger aroma and flavor than the
laboratory produced hemng sauces. However, there was no significant difference in the
preference score of aroma and flavor (p>O.05). Furthermore, no significant difference was
observed in the preference of color, aroma and flavor among herring sauces produced
from various proponions of 0.6% enzyme suppiementation.
In conclusion, supplementation with trypsin and chymotrypsin has the potential to
{ accelerate fish sauce fermentation. In this study, a consumer acceptable fish sauce was

_.,
93
produced within 2 months compared to 6-12 months used commercinlly. However, fish
sauces produced by accelerating the rate of proteolysis did not give the typical aroma and
flavor of the commercial product. This may be d11e to a shorter femlentation/aging time
i.e. 2 months compared to 6-12 months or the type of fis h used in this stud y Le. herring.
Further studies are needed to determine the optimum concentration and proportion of
enzymes to accelerate fish sauce fermentation which have the desired aroma and flavor
characteristics of the commercial product. A combination of endopeptidases (trypsin and
chymotrypsin) and exopeptidases, such as cathepsin, warrants investigatIon. Such a
combination may result in more protein breakdown and produce m<:re flavol' and aroma
producing amino acids and nitrogenous compounds. Further studies are also required to
determine the commercial viability of accelerating fish sauce fennentation with
commercial enzymes due to the relatively high cost of both trypsin and chymotrypsin.

(
(
(
94
REFERENCES
Amano, K. 1962. The influence of fennentation on the nutritive value of fish with special reference to fennented fish products of Southeast Asia. In Fish in Nutrition, Heen, E. and Kreuzer, R. (eds.), Fishing News (Books) Ltd., London, pp.180-200.
Anon. 1983. Standard for local fish sauce. Thaï Industrial Standards Institute, Ministry of Industry, Bangkok, Thailand.
A.a.A.C. 1980. Official Methods of Analysis. 131h edn. Association of Official Agricultural Chemists, Washin!;ton D.C.
A.P.H.A. 1984. Compendium of Methods for the Microbiological Examination of Foods. 2Dd ed. American Public Health Association, Washington D.C.
Bain, N., Hodgkiss, W.and Shewan, J.M. 1957. Bacteriology of salt used in fish curing. Intem. Symp. on Food Mierobiol., Eddy, B.P. (ed.), Cambridge, London, pp. 1-11.
Beckman Instruments. 1989. Dabs-Amino Acid Kit Instruction Manual. Beckman Instruments, Altex Division.
Beddows, c.a., Ismail, M. and Steinkraus, K.H. 1976. The use of bromelain in the hydrolysis of mackerel and the investigation of fermented fish aroma. J. Food Technol. Il, 379-388.
Beddows, c.a. and Ardeshir, A.a. 1979a. The production of soluble fish protein solution for use in fish sauce manufacture. 1. The use of added enzymes. J. Food Technol. 14, 603-612.
Beddows, c.a. and Ardeshir, A.a. 1979b. The production of soluble fish protein solution for use in fish sauce manufacture. II. The use of aeids at ambient temperature. J. Food Technol. 14, 613-623.
Beddows, c.a., Ardeshir, A.a. and bin Daud, W,J. 1979. Biochemical Changes occurring during the manufacture of budu. J. Sci. Food Agrie. 30, 1097-1103.
Beddows, c.a., Ardeshir, A.G. and bin Oaud, WJ. 1980. Development and origin of the volatile fauy acids in budu. J. Sei. Food Agric. 31, 86-92.
Beddows, c.a. 1985. Fennented fish and fish products. In Microbiology of Fennented Foods, Vo1.2, Wood, BJ.B. (ed.), Elsevier Applied Science, New York, pp. 1-39.
Boudreau, M.M. 1990. Harvesting underutilized species. Entrefilets. l1,7.

. .
95
Burkholder, L., Burkholdt:i 1l.R., Chu, A., Kostyk, N. and Roels, a.A. 1968. Fish fennentation. FOO( :mol. 22, 1278-1284.
Campbell-Plat, G. 1987. Fennented Foods of the World. Butterwonhs, London, pp. 68-69.
Chayovan, S., Rao, R.M., Liuzzo, J.A. and Khan, M.A. 1983a. Fatty aeids and sensory aceeptance of a dietary sodium-potassium fish sauce. 1. Agric. Food Chem. 31, 14-17.
Chayovan, S., Rao, R.M., Liuzzo, J.A. and Khan, M.A. 1983b. Che mie al characterization and sensory evaluation of a dietary sodium-potassium fish sauce. J. Agrie. Food Chem. 31, 859-863.
Chung, S.Y. and Lee, E.H. 1976. The taste compound of fennented Acetes chinensis. Bull. Korean Fish. Soc. 9, 79-110.
Christian, J.H.B. and Waltho, J. 1962. The water relations of Staphylococei and micrococci. 1. Appl. Bacl. 25, 369-377.
Cooper, T.G. 1977. The Tool of Biochemistry. Wiley-Interscience Publication, New York. pp.51-53.
Cris an, E.V. and Sands, A. 1975. Microflora of four fermented fish sauces. Applied Microbiol. 29, 106-108 .
Dougan, J. and Howard, G.E. 1975. Sorne flavouring constituents of fennented fish sauces. J. Sci. Food Agrie. 26, 887-894.
Feron, V.J., Van Ber.k, L., Slump, P. and Beems, R.B. 1978. Toxicologieal aspects of alkali treatments of food proteins. Proc. Fed. Biochem. Soc. 44, 139-147.
Fujii, T. Basuki, S.B. and Tozawa, H. 1980. Chemical composition and microflor'a of fish sauce 'patis'. Bull. Jpn. Soc. Sei. Fish. 46, 1235-1240.
Fujii, T. and Sakai, H. 1984. Mierobiological studies on ripening of fish sauce.II. Chemical composition and microflora of fish sauce 'shotturu'. Bull. Jpn. Soc. Sei. Fish. 50, 1061-1066.
Gildberg, A., Espejo-Hermes, E. and Orejana, F.M. 1984. Acceleration of autolysis during fish sauce fermentation by adding aeid and reducing the salt content. 1. Sei. Food Agric. 35, 1363-1369.
Giovanni, M.E. and Pangborn, R.M. 1983. Measurement of taste intensity and degree of liking of beverages by graphie seales and magnitude estimation. 1. Food Sei. 48, 1175-1182.

(
1 -..
96
Guevara, G., Matias, V.C. and Delta-Pena, P.O. 1972. Fish fennentation with the use of papain. Philipp. 1. Fish. 10, 30-38.
Hamm, W.S. and Clague, J.A. 1950. Temperature and salt purity effects on the manufacture of fish paste and sauce. Researeh Report No. 24. Fish and Wildlife Service, U.S. Dept. of Interior.
Hayashi, R. and Kameda, 1. 1980. Racemication of amino aeid residues during alkalitreatment of prote in and its adverse effect on pep sin digestibility. Agric. Biol. Chem. 44, 891-895.
Itoh, H., Hadioetomo, R.S., Nkkuni, S. and Okada, N. 1985a. Studies on lactic aeid bacteria in fish sauces (partl)-Chemical composition and microflora of fish sauces. Rept. Natl. Food Res. Inst. 47, 23-30.
Itoh, H., Hadioetomo, R.S., Nkkuni, S. and Okada, N. 1985b. Studies on lactic aeid bacteria in fish sauces (part2)-ldentification of salt-tolerance and add-producing bacteria from fish sauces. Rept. Nad. Food Res. Inst. 47, 31-40.
Jacquot, R. 1961. Organic eonstituents of fish and other aquatir animal foods. In Fish as Foods, VoLl, Brogstrom, G. (ed.), Academie Press, New York, pp. 145-209.
Jansen, G.R. and Howe, E.E. 1964. World problems in protein nutrition. Tile Amer. J. Clinical Nutrition. 15, 262-274.
Jones, N.R. 1962. Browning reaetions in dried fish produets. Rec. Advance Food Sei. 2, 74-80.
Jonsson, S, Ciausen, E. and Raa, J. 1983. Amino aeid degradation by a Lacrobacillus plantarum strain from fish. Syst. Appl. Microbiol. 4, 148-154.
Kasemsam, B. 1963. Studies on fish sauce fer,nentation. M.S. thesis, University of Washington, Seattle, Washington.
Kashiwada, K. 1952. Studies on the enzymes of skipjack entrails. 1. on the seasor.al variation of proteolytie enzyme activity in pyrolic caeea. Bull. Jap. Soc. Sei. Fish. 18, 151-154.
Kapoor, B.G., Smith, H. and Vereghina, I.A. 1975. The alimentary canal and digestion in teleosts. Adv. Mar. Biol. 13, 109-239.
Konosu, S. 1979. The taste of fish and shellfish. In Food Taste Chemistry, Boudreau, J.C. (ed.), Am. Chem. Soc. Symp. Ser. 115. pp. 185-203.
Kurokawa, T. 1986. Chemieal composition of Chinese fish sauce. Nippon Shokuhin Kogyo Gakkaishi 33, 144-148.
r
..
-, )
97
Lee, E.H. and Sung, N.J. 1977. The taste eompounds of fennented squid. Korean J. Food Sei. Teehnol.9, 255-263 .
Lee, E.H., Cho, S.Y., Cha, Y.J., Jeon, J.K. and Kim, S.K. 1981. The effeet of antioxidants on the fermented sardine and taste eompounds of product. Bull. Korean Fish. Soc. 14,201-211.
Lee, E.H., Kim, S.K., Jeon, J.K., Kim, S.H. and Kim, J.G. 1982a. The taste eompounds of fennented anchovy. Bull. Nat. Fish. Univ. Busan 22, 13-18.
Lee, Y.Z., Simpson, B.K. and Haard, N.F. 1982b. Supplementation of squid fermentation with proteolytic: enzymes. 1. Food Biochem. 6, 127-134.
Mackie, lM., Hardy, R. and Hobbs, M. 1971. Fennented fish products. FAO Fisheries Report No. 100.
Mclver, R.C., Brooks, R.I. and Reineccius, G.A. 1982. Flavor of fermented fish sauce. J. Agrie. Food Chem. 30, 1017-1020.
Miyazawa, K., Van Le, C., Ito, K. and Matsumoto, F. 1979. Studies on fish sauce. 1. Fac. Appl. Biol. SeL, Hiroshima Univ. 18, 55-63.
Morris, J.G. 1983. The metabolism, growth and death of bacteria. In Toply and Wilson's Principles of Bacteriology, Virology and Immunity, Vol. 1, Wilson, G. and Dick, H.M. (eds.), 7th edn., Williams and Wilkins, Baltimore, pp. 39-69.
Murayama, S., Calvez, D.L. and Nitayachin, P. 1962. Study on the production of fish sauce-I Effect of commercial proteolytic enzyme on the production of fish sauce. Bull. Tokai. Reg. Fish. Lab. 32, 155-162.
Mycek, M.J. 1970. Cathepsins. In Methods in Enzymology, Vo1.l9, Proteolytic Enzymes, Perlmann, G.E. and Lor~nd, L. (eds.), Academie Press. New York, pp. 285-315.
Nakano, T., Watanabe, H.. Hata, M., Duong van Qua and Miura, T. 1986. An application of protease produced by a moderately ;lalophilic marine bacterium to fish sauce processing. Bull. Jpn. Soc. Sei. Fis. 52, 1581-1587.
Noda, M., Vo Van, T., KUliakabe, 1. and Murak:tmi, K. 1982. Substrate specificity and salt inhibition of five proteinases isolated from the pyrolic caeca and stomach of sardine. Agric. Biol. Chem. 46, 1565-1569.
Ok, T., Matsukura, T., Ooshiro, Z., Hayashi, S. and Itakura. T. 1982a. Protease formation by two moderately halophilie Baci/lus strains isolated from fish sauce. Nippon Shokuhin Kogyo Gakkaishi 29, 618-622.

{ ...
98
Ok, T., Matsukura, T., Ooshiro, Z., Hayashi, S. and Itakura, T. 1982b. Study on the use of halophilic bacteria in production of fish sauce. Nippon Shokuhin Kogyo Gaklcaishi 29, 623-627.
Ooshiro, Z., Ok, T., Une, H., Hayashi, S. and Itakura, T. 1981. Study on use of commercial proteolytic enzymes in production of fish sauce. Mem. Fac. Fish., Kagoshima Univ. 30, 383-394.
Orejana, F.M. 1978. Proteolysis and control mechanisms in fish sauce fermentation. Ph.D. thesis, University of Washington, Seattle, Washington.
Orejana, F.M. and Liston, 1. 1979. Protein and lipid hydrolysis in Philippine fish sauce (patis) prepared from irradiated and non irradiated anchovies. Phil. J. Food Sei. Technol. 3, !7-30.
Orejana, F.M. and Liston, J. 1981. Agents of proteolysis and its inhibition in patis (fish sauce) fermentation. J. Food Sei. 47,198-203.
Orejana, F.M. 1983. Fermented fish products. In Handbook of Tropical Foods. Harvey, T. and Chan, J.R. (eds.), Marcel Deklcer, Inc., New York, pp. 255-295.
Raksakulthai, N., Lee, Y.Z. and Haard, N.F. 1986. Effect of enzyme supplements on the production of fish sauce from male capelin Mal/orus villosus. Cano Inst. Food Sci. Technol. J. 19, 28-33 .
Raksakulthai, N. 1987. Role of protein degradation in fennentation of fish sauce. Ph.D. thesis, Memorial University of Newfoundland, St. John's, Newfoundland, Canada.
Rosario, R.R. deI and Basaran, A.S. 1984. Composition of Philippine fish sauce (patis). Phil. Agr. 67, 373-378.
Rosario, R.R. deI and Maldo, S.M. 1984. Biochemistry of patis fonnation. 1. Activity of cathepsins in patis hydrolysates. Phil. Agr. 67, 167-175.
Rosé, E. 1918. Recherches sur la fabrication et la composition climique du Nuoc-marn. Bull. Econ. Indoch. 129, 155-190.
SAS. 1985. SAS User's Guide:Statistics. Version 5 edn., SAS Institute Inc., Cary, North Carolina.
Sanceda, N.G., Kurata, T. and Arakawa, N. 1983. Volatile compounds in the acidic fraction of the steam distillate of Philippine fish sauce (patis). Phil. Agr. 66, 176-182.
Sanceda, N.G., Kurata, T. and Arakawa, N. 1984. Fractionation and distillation of volatile compounds in patis, a Philippine fish sauce. Agric. Biol. Chem. 48, 3047-3052.

'" 1.
99
Sanceda, N.G., Kurata, T. and Arakawa, N. 1986. Formation of volatile acids in the various stages of fish sauce fermentation. Nippon Shokuhin Kogyo Gakkaishi 33, 285-290.
Saisithi, P., Kasemsarn, B., Liston, J. and Dollar, A.M. 1966. Microbiology and chemistry of fermented fish. J. Fond Sci. 31, 105-110.
Saisithi, P. )967. Studies on the origins and development of the typical flavor and aroma of Thai fish sauce. Ph.D. thesis, University of Washington, Seattle, Washington.
Sanchez, P.C. and Klitsaneephaiboon, M. 1983. Traditional fish sauce (patis) fennentatiol1 in the Philippines. Phil. Agr. 66, 251-269.
Shewan, J.M. 1962. The bacteriology of fish and spoiling fish and sorne related chemical changes. Recent Adv. Food Sei. l, 167-193.
Siebert, G. and Schmitt, A. 1965. Fish tissue enzymes and their role in the deterioration changes in fish. In Teehnology of Fish Utilization. Kreuzer, R. (ed.), Fishing News (Books) Ltd., London, pp. 47-52.
Simpson, B.K. and Haard, N.F. 1987. Cold-adapted enzymes from fish. In Food biotechnology. Knorr, D. (ed.), Marcel Dekker, Ine., New York, pp. 495-527.
Steinkraus, K.H. 1983. Hand book of indigenous fermented foods. Marcel Dekker Ine., New York, p.487-526.
Steel, R.G"D. and Torrie, J.H. 1980. Principle dnd procedures of statisties. 2nd edn. McGraw-Hill Book Company, New York.
Subba Rao, G.N. 1967. Fish processing in the Indo-Pacifie area. Regional Studir.s No.4. FAO Regional Office for the Asia and Far East, Bangkok, Thailand.
Tongthai, C. and Okada, H. 1981. Change of nitrogenous compounds during numpla fermentation. In Microbial Utilization of Renewable Resources. VoU, Taguchi, H. (ed.), ICME Faculty of Engineering, Osaka University, Osaka, lapan, pp.lOl-107.
Uyenco, V., Lawas, 1., Briones, P.R. and Taruc, R.S. 1953. Mechanics of bagoong (fish paste) and patis (fish sauce) processing. Indo-Pacifie Fisheries Council Processing. FAO Regional Office for Asia and the Far-East, Bangkok, pp.210-222.
Van Veen, A.G. 1965. Fennented and dried seafood produets in Southeast Asia. In Fish as Food, Vol. 3, Brogstrom, G. (ed.), Academic Press, New York, pp.227-250.
Voskresensky, N.A. 1965. Salting of herring. In Fish as Foods, Vol. 3, Borgstrom, G. (ed.), Academie Press, New York, pp. 107-131.
_JI

100
Vo Van, T., Kusakabe, 1. and Murakami, K. 1983. Purification and sorne properties of two aminopeptidase from sardine. Agrie. Biol. Chem. 47, 2453-2459.
Vo Van, T., Kusakabe, 1. and Murakami, K. 1984. The &îninopeptidase aetivity in fish sauce. Agric. Biol. Chem. 48, 525-527.
Yoshinaka, R., Sato, M., Tsuchiya, N. and Ikeda, S. 1983. Production offish sauce from sardine by utilization of its visceral enzymes. Bull. Jpn. Soc. Sei. Fish. 49,463-469.