
Accelerating the deployment of technology to business opportunities-chevron Texaco
15
© ChevronTexaco 2004 Accelerating the Deployment of Technology to Business Opportunities Kevin Kimber – ChevronTexaco David Matheson - SmartOrg Value-Based Management Systems
Transcript of Accelerating the deployment of technology to business opportunities-chevron Texaco
© ChevronTexaco 2004
Accelerating the Deployment of Technology to Business Opportunities
Kevin Kimber – ChevronTexaco
David Matheson - SmartOrg
Value-Based Management Systems
2
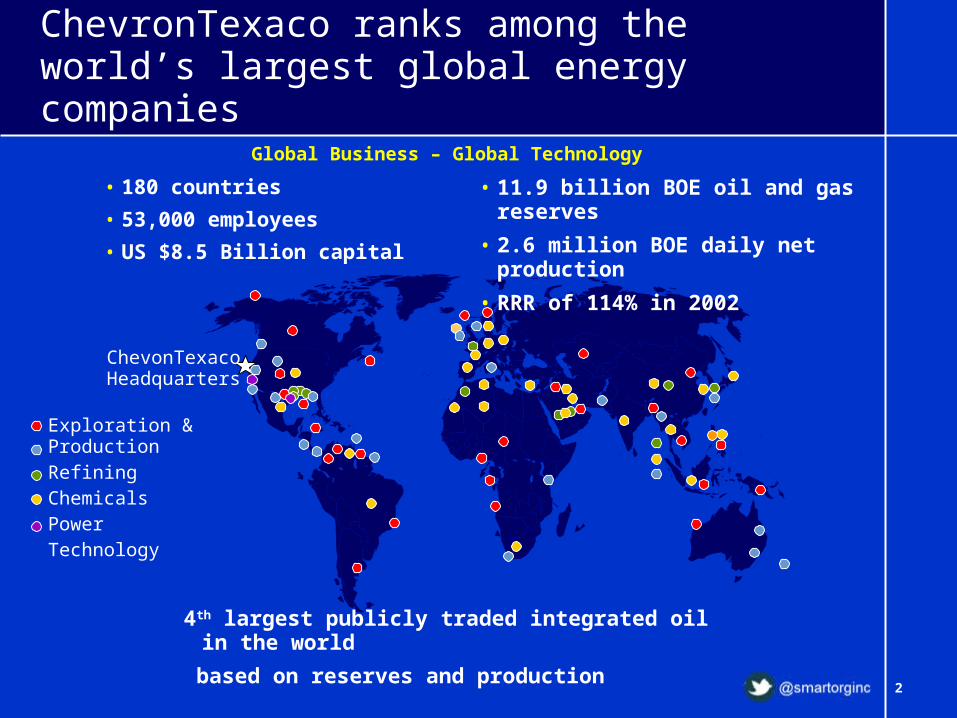
Exploration & ProductionRefiningChemicalsPowerTechnology
ChevronTexaco ranks among the world’s largest global energy companies
ChevonTexaco Headquarters
• 180 countries
• 53,000 employees
• US $8.5 Billion capital
• 11.9 billion BOE oil and gas reserves
• 2.6 million BOE daily net production
• RRR of 114% in 2002
4th largest publicly traded integrated oil in the world
based on reserves and production
Global Business – Global Technology
3
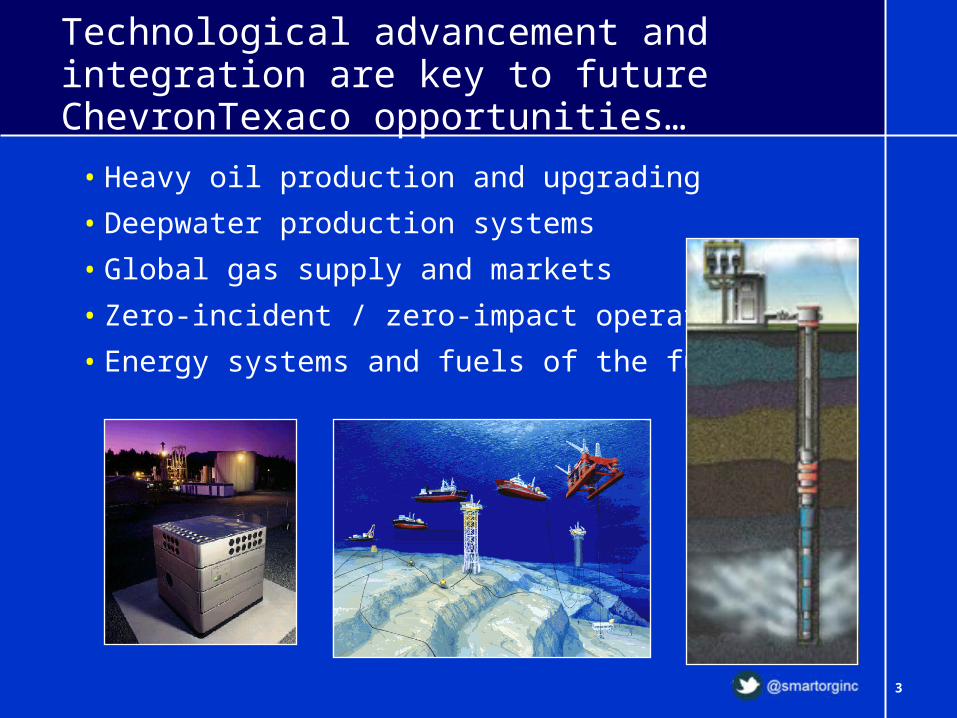
Technological advancement and integration are key to future ChevronTexaco opportunities…
• Heavy oil production and upgrading
• Deepwater production systems
• Global gas supply and markets
• Zero-incident / zero-impact operations
• Energy systems and fuels of the future
4
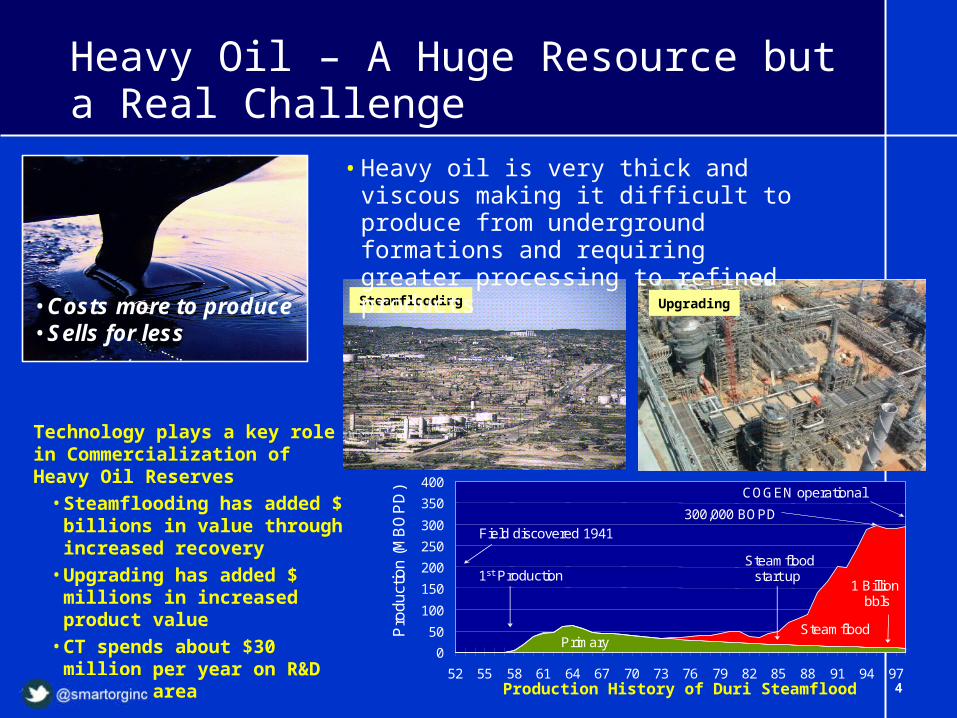
Heavy Oil – A Huge Resource but a Real Challenge
UpgradingSteamflooding
Technology plays a key role in Commercialization of Heavy Oil Reserves
• Steamflooding has added $ billions in value through increased recovery
• Upgrading has added $ millions in increased product value
• CT spends about $30 million per year on R&D in this area
• Heavy oil is very thick and viscous making it difficult to produce from underground formations and requiring greater processing to refined products
• Costs more to produce• Sells for less
0
50
100
150
200
250
300
350
400
52 55 58 61 64 67 70 73 76 79 82 85 88 91 94 97
SteamfloodPrimary
Pro
duct
ion
(MB
OP
D)
Field discovered 1941
1st Production Steamflood
start up1 Billion
bbls
300,000 BOPD
COGEN operational
Production History of Duri Steamflood
5
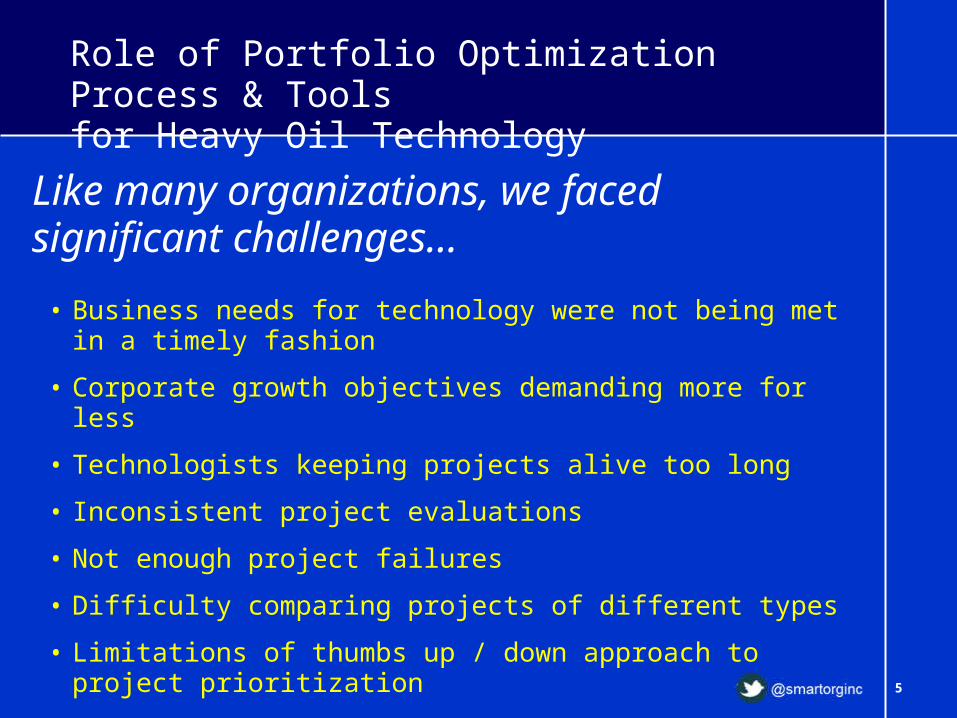
Role of Portfolio Optimization Process & Toolsfor Heavy Oil Technology
Like many organizations, we faced significant challenges…
• Business needs for technology were not being met in a timely fashion
• Corporate growth objectives demanding more for less
• Technologists keeping projects alive too long
• Inconsistent project evaluations
• Not enough project failures
• Difficulty comparing projects of different types
• Limitations of thumbs up / down approach to project prioritization
6
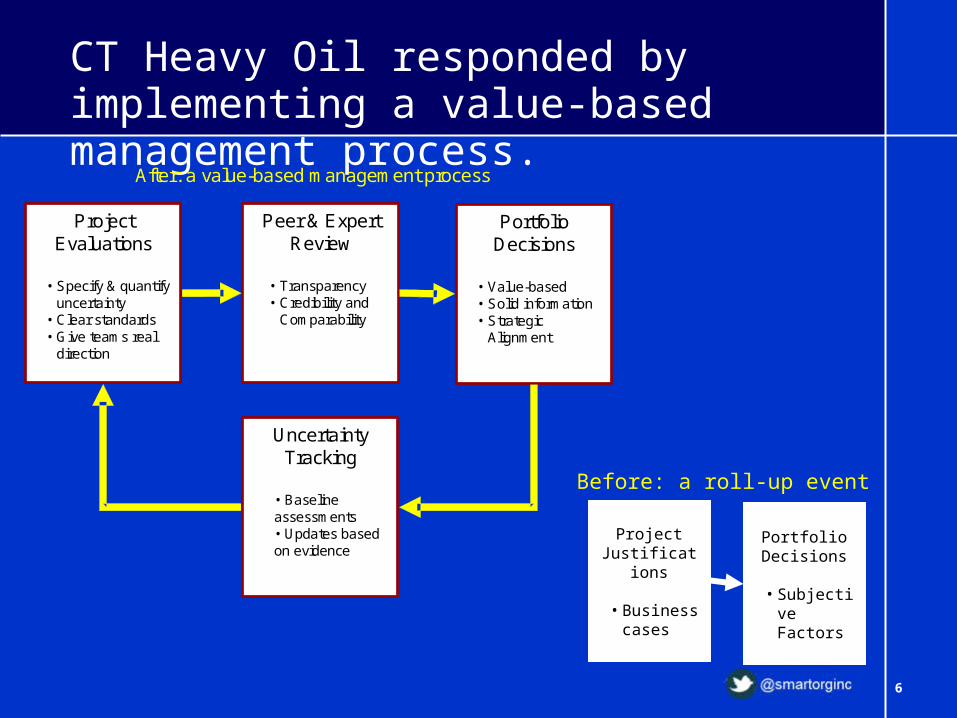
CT Heavy Oil responded by implementing a value-based management process.
Project Justifications
• Business cases
Portfolio Decisions
• Subjective Factors
Before: a roll-up event
Project Evaluations
• Specify & quantify uncertainty
• Clear standards• Give teams real
direction
Peer & Expert Review
• Transparency• Credibility and
Comparability
Portfolio Decisions
• Value-based• Solid information• Strategic
Alignment
Uncertainty Tracking
• Baseline assessments• Updates based on evidence
After: a value-based management process
7
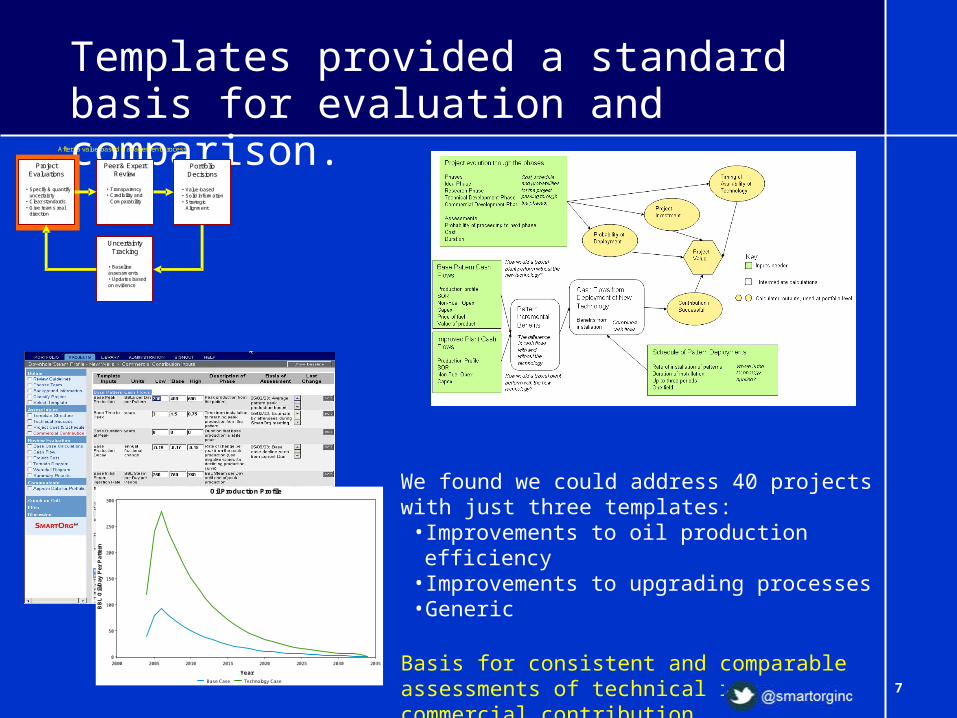
Templates provided a standard basis for evaluation and comparison.
We found we could address 40 projects with just three templates:•Improvements to oil production efficiency•Improvements to upgrading processes•Generic
Basis for consistent and comparable assessments of technical risk and commercial contribution
Oil Production Profile
2000 2005 2010 2015 2020 2025 2030 2035
Year
0
50
100
150
200
250
300
BB
L O
il/D
ay
Pe
r P
att
ern
Base Case Technology Case
Project Evaluations
• Specify & quantify uncertainty
• Clear standards• Give teams real
direction
Peer & Expert Review
• Transparency• Credibility and
Comparability
Portfolio Decisions
• Value-based• Solid information• Strategic
Alignment
Uncertainty Tracking
• Baseline assessments• Updates based on evidence
After: a value-based management process
8
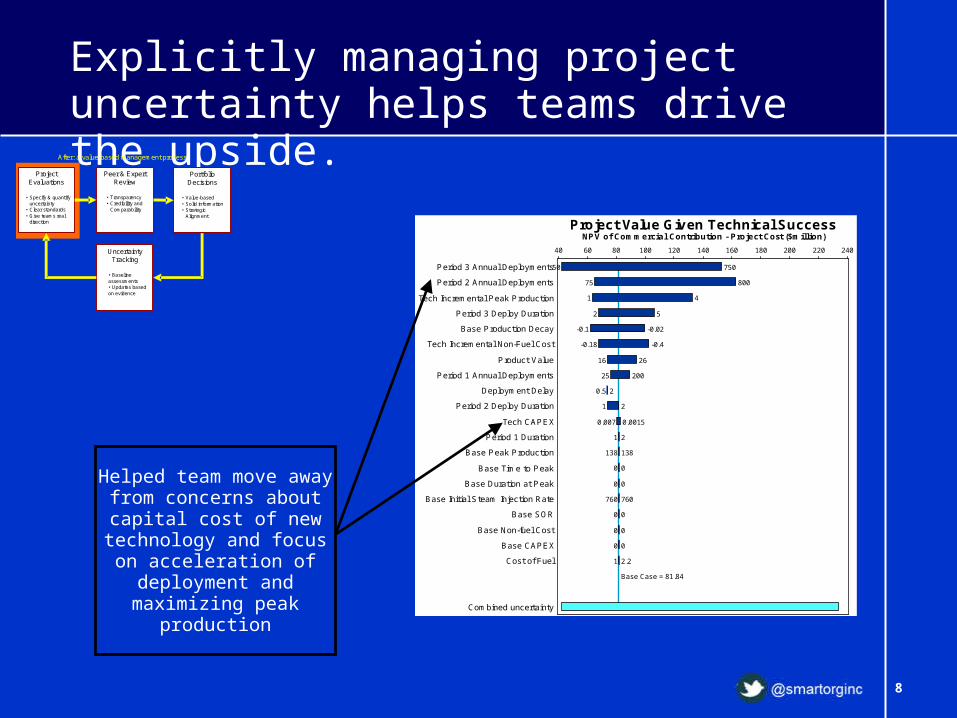
Explicitly managing project uncertainty helps teams drive the upside.
Project Value Given Technical SuccessNPV of Commercial Contribution - Project Cost ($million)
Combined uncertainty
Cost of Fuel
Base CAPEX
Base Non-fuel Cost
Base SOR
Base Initial Steam Injection Rate
Base Duration at Peak
Base Time to Peak
Base Peak Production
Period 1 Duration
Tech CAPEX
Period 2 Deploy Duration
Deployment Delay
Period 1 Annual Deployments
Product Value
Tech Incremental Non-Fuel Cost
Base Production Decay
Period 3 Deploy Duration
Tech Incremental Peak Production
Period 2 Annual Deployments
Period 3 Annual Deployments
40 60 80 100 120 140 160 180 200 220 240
1 2.2
0 0
0 0
0 0
760 760
0 0
0 0
138 138
2 1
0.007 0.0015
2 1
2 0.5
25 200
16 26
-0.18 -0.4
-0.1 -0.02
5 2
1 4
75 800
50 750
Base Case = 81.84
Helped team move away from concerns about capital cost of new technology and
focus on acceleration of deployment and maximizing
peak production
Project Evaluations
• Specify & quantify uncertainty
• Clear standards• Give teams real
direction
Peer & Expert Review
• Transparency• Credibility and
Comparability
Portfolio Decisions
• Value-based• Solid information• Strategic
Alignment
Uncertainty Tracking
• Baseline assessments• Updates based on evidence
After: a value-based management process
9
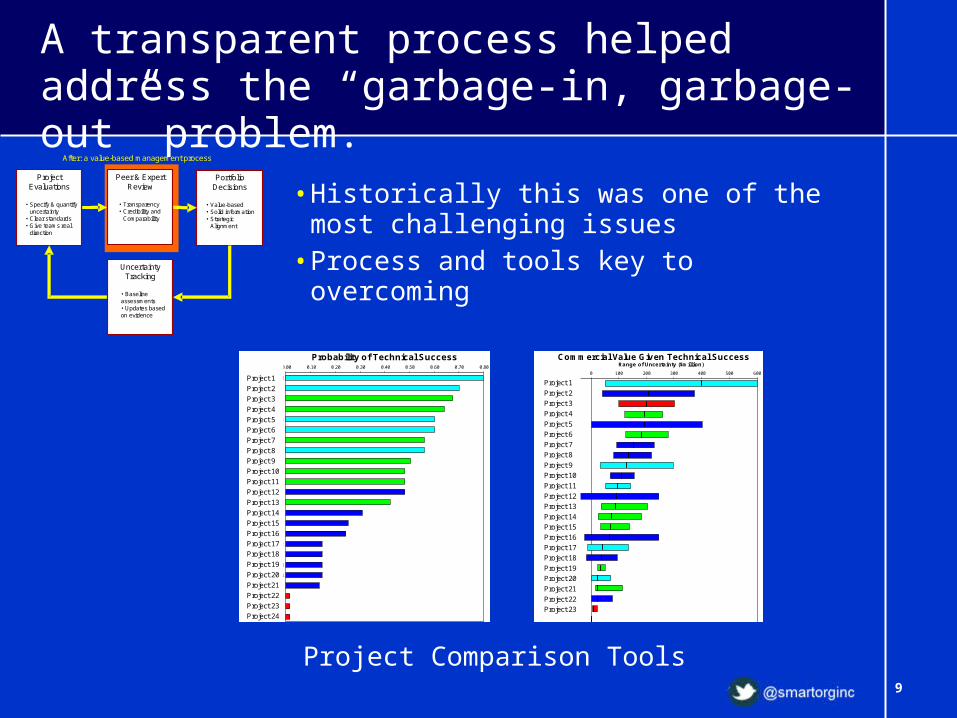
A transparent process helped address the “garbage-in, garbage-out” problem.
Commercial Value Given Technical Success Range of Uncertainty ($million)
Improving Computational Capability
Shearing
LSTS
Performance Prediction
Dow nhole Steam Prof ile Control
2D NMR
Thin Sand Thermal
Dow nhole Steam Prof ile - New Wells
Catalyst
Remote Sensing
Steam Inj Well BP
Steam Distribution
Bio-Upgrading
Heat Management
Improve Hydrocoking Process
Well Gauging
High Mobility Ratio Waterf lood
HOSGD
Reservoir Opportunity Identif ication
VAPEX
Cold Flow
Heavy Oil Chemistry
Sulfur & Metals Removal
CASH
-100 0 100 200 300 400 500 600
Project 1
Project 2
Project 3
Project 4
Project 5
Project 6
Project 7
Project 8
Project 9
Project 10
Project 11
Project 12
Project 13
Project 14
Project 15
Project 16
Project 17
Project 18
Project 19
Project 20
Project 21
Project 22
Project 23
Probability of Technical Success
Shearing
Heavy Oil Chemistry
Improving Computational Capability
Bio-Upgrading
Thin Sand Thermal
Sulfur & Metals Removal
VAPEX
Catalyst
High Mobility Ratio Waterf lood
LSTS
Improve Hydrocoking Process
Performance Prediction
HOSGD
Steam Inj Well BP
Reservoir Opportunity Identif ication
Cold Flow
CASH
2D NMR
Dow nhole Steam Prof ile - New Wells
Heat Management
Remote Sensing
Steam Distribution
Well Gauging
Dow nhole Steam Prof ile Control
0.00 0.10 0.20 0.30 0.40 0.50 0.60 0.70 0.80
Project 1
Project 2
Project 3
Project 4
Project 5
Project 6
Project 7
Project 8
Project 9
Project 10
Project 11
Project 12
Project 13
Project 14
Project 15
Project 16
Project 17
Project 18
Project 19
Project 20
Project 21
Project 22
Project 23
Project 24
• Historically this was one of the most challenging issues
• Process and tools key to overcoming
Project Evaluations
•Specify & quantify uncertainty
•Clear standards•Give teams real
direction
Peer & Expert Review
• Transparency• Credibility and
Comparability
Portfolio Decisions
• Value-based• Solid information• Strategic
Alignment
Uncertainty Tracking
•Baseline assessments•Updates based on evidence
After: a value-based management process
Project Comparison Tools

10
Using value as the primary decision criteria helps people make and accept decisions.
0 50 100 150 200 250 300 350 400
Expected Commercial Contribution (NPV Given Technical Success $million)
0.0
0.1
0.2
0.3
0.4
0.5
0.6
0.7
0.8
0.9
1.0
Pro
ba
bil
ity
of
Te
ch
nic
al
Su
cc
es
s
LSTS
Dow nhole S
Steam Dist
Dow nhole SHeat Manag
Shearing Heavy Oil
Sulfur & M
Improving
High Mobil
Cold Flow
VAPEXCatalyst
Remote Sen
Performanc
HOSGD
Improve Hy
CASH
Reservoir
Well Gaugi
2D NMR
Thin Sand
Steam Inj
Bio-Upgrad
Bread & Butter Pearls
White Elephants Oysters
0 5 10 15 20 25 30 35
Cumulative Portfolio Cost (NPV $million)
0
100
200
300
400
500
600
700
800
900
1000
1100
Cu
mu
lati
ve
Po
rtfo
lio
Va
lue
(N
PV
$ m
illi
on
)
Dow nhole S
Steam DistDow nhole S
Heat Manag
Well Gaugi
Remote Sen
Cold Flow
Reservoir
HOSGD2D NMR
High MobilVAPEXHeavy Oil
Improve HyCatalystSteam Inj Performanc
Sulfur & M
CASHLSTSThin Sand Shearing Bio-UpgradImproving
Project Evaluations
•Specify & quantify uncertainty
•Clear standards•Give teams real
direction
Peer & Expert Review
• Transparency• Credibility and
Comparability
Portfolio Decisions
• Value-based• Solid information• Strategic
Alignment
Uncertainty Tracking
•Baseline assessments•Updates based on evidence
After: a value-based management process
Portfolio Evaluation Tools
CFO Chart
Innovation Screen
11
Project Evaluations
•Specify & quantify uncertainty
•Clear standards•Give teams real
direction
Peer & Expert Review
• Transparency• Credibility and
Comparability
Portfolio Decisions
• Value-based• Solid information• Strategic
Alignment
Uncertainty Tracking
•Baseline assessments•Updates based on evidence
After: a value-based management process
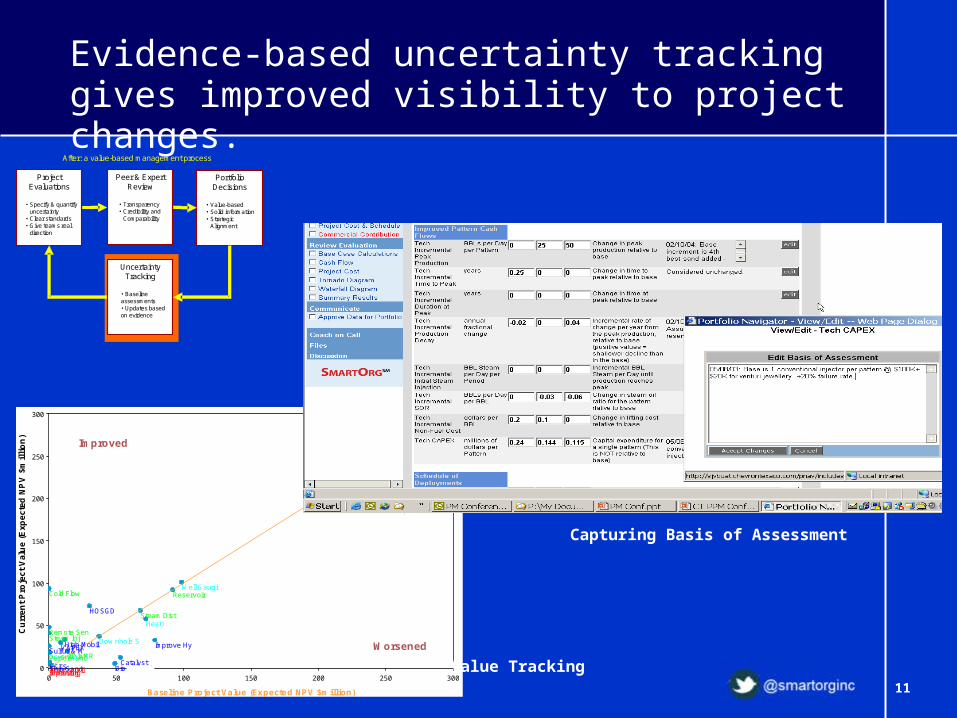
Evidence-based uncertainty tracking gives improved visibility to project changes.
0 50 100 150 200 250 300
Baseline Project Value (Expected NPV $million)
0
50
100
150
200
250
300
Cu
rre
nt
Pro
jec
t V
alu
e (
Ex
pe
cte
d N
PV
$m
illi
on
)
CASH
Well GaugiCold Flow Reservoir
HOSGDSteam Dist
Heat ManagRemote SenSteam Inj Dow nhole SHigh Mobil Improve HyVAPEXSulfur & M
2D NMRDow nhole SPerformancCatalyst
Bio-UpgradLSTSThin Sand Heavy Oil Improving Shearing
Improved
Worsened
Capturing Basis of Assessment
Value Tracking
12
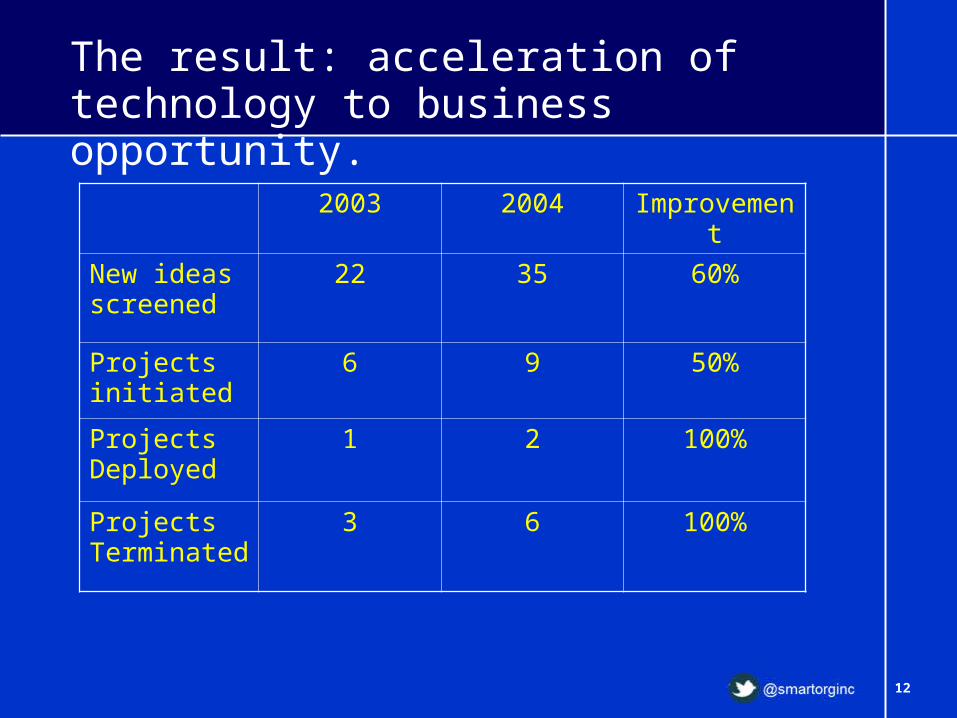
The result: acceleration of technology to business opportunity.
2003 2004 Improvement
New ideas screened
22 35 60%
Projects initiated
6 9 50%
Projects Deployed
1 2 100%
Projects Terminated
3 6 100%
13
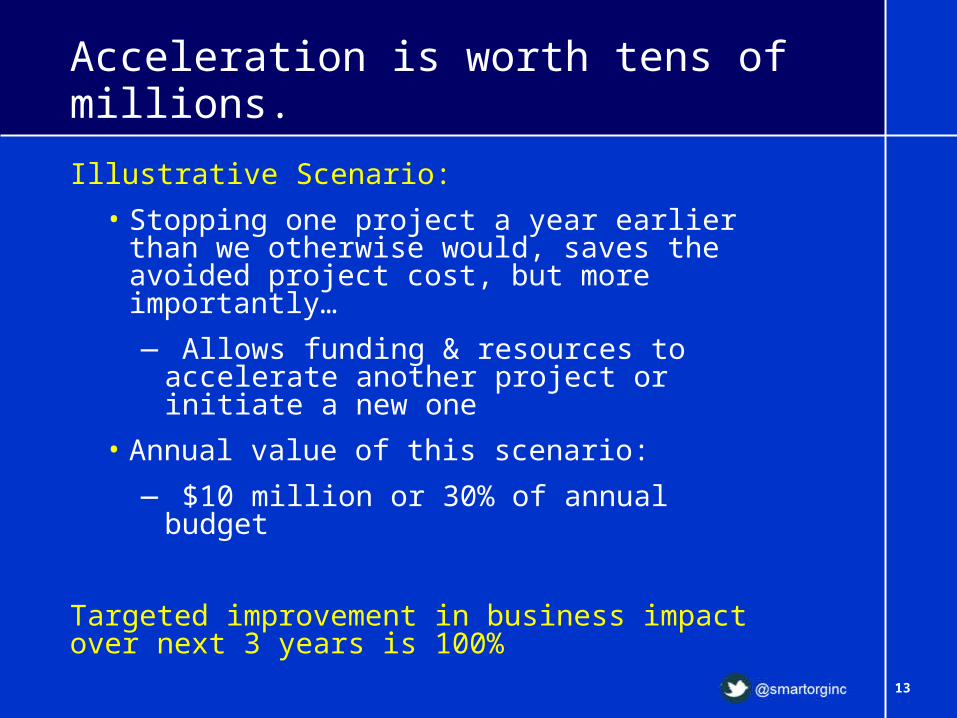
Acceleration is worth tens of millions.
Illustrative Scenario:
• Stopping one project a year earlier than we otherwise would, saves the avoided project cost, but more importantly…
— Allows funding & resources to accelerate another project or initiate a new one
• Annual value of this scenario:
— $10 million or 30% of annual budget
Targeted improvement in business impact over next 3 years is 100%
14
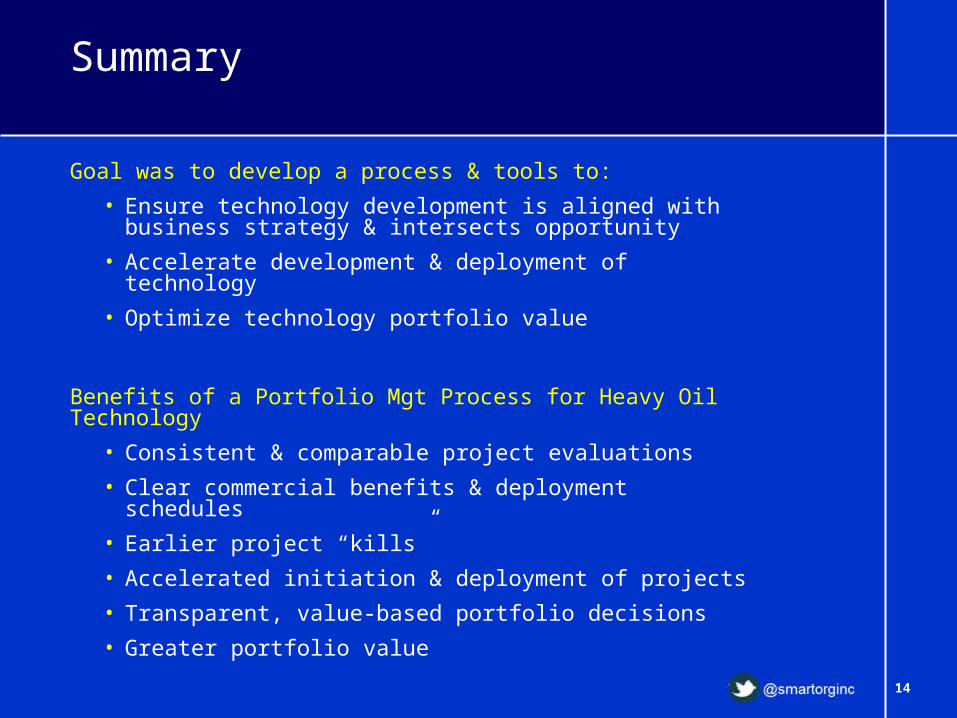
Summary
Goal was to develop a process & tools to:
• Ensure technology development is aligned with business strategy & intersects opportunity
• Accelerate development & deployment of technology
• Optimize technology portfolio value
Benefits of a Portfolio Mgt Process for Heavy Oil Technology
• Consistent & comparable project evaluations
• Clear commercial benefits & deployment schedules
• Earlier project “kills”
• Accelerated initiation & deployment of projects
• Transparent, value-based portfolio decisions
• Greater portfolio value
15Value-Based Management Systems
SmartOrg® provides software and services to help companies evaluate their opportunities and make the best decisions about where to invest, especially when the future is clouded with uncertainty. Customers use SmartOrg® to build their capability in driving innovation from idea to commercial results and in selecting projects, improving returns in their portfolio.
SmartOrg® helps companies to attain the highest value from projects and portfolios.
855 Oak Grove, Suite 202Menlo Park, CA 94025 USAT: [email protected]
www.linkedin.com/company/smartorg
@smartorginc
About SmartOrg


