Accelerating biological screenings through the combination ...
135
Accelerating biological screenings through the combination of high-throughput and modeling Sebastian Hans - Dissertation
Transcript of Accelerating biological screenings through the combination ...

Accelerating biological screenings through the combination of high-throughput and modeling
Sebastian Hans - Dissertation

Accelerating biological screenings through the combination of
high-throughput and modeling
vorgelegt von
M.Sc.
Sebastian Hans
ORCID: 0000-0002-5346-869X
an der Fakultät III – Prozesswissenschaften
der Technischen Universität Berlin
zur Erlangung des akademischen Grades
Doktor der Ingenieurwissenschaften
-Dr. Ing.
genehmigte Dissertation
Promotionsausschuss:
Vorsitzender: Prof. Dr. Lorenz Adrian
Gutachter: Prof. Dr. Peter Neubauer
Gutachter: Prof. Dr. Johannes Kabisch, Technische Universität Darmstadt
Gutachter: Dr. Mariano Nicolas Cruz-Bournazou, DataHow AG
Tag der wissenschaftlichen Aussprache: 12. April 2021
Berlin, 2021

Accelerating biological screenings through the combination of high-throughput and modeling
II I - Abstract
I Abstract
One of the greatest challenges facing our society today is the shift to a resource and
environmentally friendly, green circular economy. Biotechnological products and processes
play a central role in this transformation and acceleration and intensifying bioprocess
development is an essential contribution to the economy of tomorrow. Automation,
digitalization, and virtual prototypes are common tools of product development in many
economic sectors. Their application in biotechnology, however, is hampered, mainly by the
complexity of biotechnological processes and products. The majority of biotechnological cell
and process models have to be adapted to the specific task at hand, which is time-consuming
and data-intensive, and models are not universally applicable, as it is possible for example in
mechanics.
This work encompasses the development of three major technologies of model-based
operation of high throughput experiments to accelerate bioprocess development. First,
operation of turbidostat cultivations in 96-well plates. This allows for: i) a better control of the
pre-culture and a highly flexible inoculation strategy, ii) screening for fast growing mutants
under controlled conditions, and iii) high throughput evolution experiments. Second,
development of a model-based screening framework that enables an automated operation of
multiple strains in parallel with significant different phenotypes. Third, tailoring of multivariate
analysis tools to improve process monitoring during parallel fed-batch experiments and to
automatically detect outliers and process failures.
The added value of the high-throughput turbidostat cultivations is demonstrated with a
variety of Escherichia coli strains using a simple growth model in multi-well plates. Centralized
data management, a minimal knowledge-based model and integration of advanced operation
tools for automated task execution by Liquid Handling Stations (LHS) were the basis to
produce multiple competent strains on a LHS and to transform them. For the model-based
screening experiments a mechanistic model, consisting of five differential equations and 18
parameters, was used in a study with eight different E. coli strains in 24 parallel cultivations for
process planning and on-line process adaptation. Through iterative online model fitting, it was
possible to predict the optimal feed start with less than one minute difference. The model was
suitable to predict process conditions to prevent overfeeding or starvation of cells and the
experiment was sufficient to determine qualitative differences between the strains. The entire
experiment was conducted in a fully automated bioprocess facility consisting of two LHS and
one Mini-Bioreactor System (MBR). Finally, principal component analysis (PCA) was used to
detect process and measurement errors and was able to identify the most important process
failures. In this way, high quality of data can be guaranteed, which is imperative for successful
model calibration.

Accelerating biological screenings through the combination of high-throughput and modeling
II - Zusammenfassung III
II Zusammenfassung
Eine der größten Herausforderungen unsere Gesellschaft ist der Wandel hin zu einer
ressourcen- und umweltschonenden Kreislaufwirtschaft. Biotechnologische Produkte und
Prozesse spielen bei dieser Transformation eine zentrale Rolle und die Beschleunigung und
Intensivierung der Bioprozessentwicklung ist ein wesentlicher Beitrag hierzu. Automatisierung,
Digitalisierung und virtuelle Prototypen sind in vielen Wirtschaftsbereichen gängige Tools der
Produktentwicklung, jedoch kaum in der Biotechnologie. Dies ist maßgeblich in der
Komplexität biotechnologischer Prozesse und Produkte begründet. Eine Vielzahl
biotechnologischer Zell- und Prozessmodelle haben gemeinsam, dass ihre Anpassung an die
jeweilige Aufgabenstellung zeit- und datenintensiv ist und diese nicht universell einsetzbar
sind, wie es beispielweise in der Mechanik möglich ist.
Diese Arbeit umfasst die Entwicklung von drei Haupttechnologien des modellbasierten
Betriebs von Hochdurchsatz-Experimenten zur Beschleunigung der Bioprozessentwicklung.
Erstens ermöglicht der Betrieb von Turbidostat-Kulturen in 96-Well-Platten: i) eine bessere
Kontrolle der Vorkultur und eine hochflexible Inokulationsstrategie, ii) das Screening nach
schnell wachsenden Mutanten unter kontrollierten Bedingungen und iii) ein Hochdurchsatz-
Evolutionsexperiment. Zweitens wurde ein modellbasiertes Screening-Framework entwickelt,
das eine automatisierte Untersuchung von mehreren Stämmen mit signifikant
unterschiedlichen Phänotypen parallel ermöglicht. Drittens wurden multivariate
Analysewerkzeuge angepasst, um die Prozessüberwachung von parallelen Fed-Batch-
Experimente und die Erkennung von Ausreißern und Prozessfehlern zu verbessern.
Der Mehrwert des Turbidostat wird anhand der Transformation mehrerer E. coli -Stämme
demonstriert. Mit einem einfachen Wachstumsmodell, einem zentralen Datenmanagement,
und Automatisierung der nötigen Prozessschritte durch LHS wurden die Stämme parallel
kompetent gemacht und transformieren. Für das modellbasierte Screening wurde ein
mechanistisches Modell, das aus fünf Differentialgleichungen und 18 Parametern besteht, in
der Case-Study mit acht verschiedenen E. coli Stämmen in 24 parallelen Kultivierungen zur
Prozessplanung und Online-Prozessanpassung verwendet. Durch iterative online
Modellanpassung war es möglich, den optimalen Feed-Start auf die Minute genau
vorherzusagen. Das Modell war zudem geeignet, die Prozessbedingungen so einzustellen,
dass Überfütterung oder Hunger der Zellen ausblieben. Das so designte Experiment war
geeignet, um qualitative Unterschiede zwischen den Stämmen zu bestimmen und wurde in
einer vollautomatischen Bioprozessanlage, bestehend aus zwei LHS und einem Mini-
Bioreaktorsystem (MBR), durchgeführt. Schließlich wurde eine Hauptkomponentenanalyse
(PCA) zur Erkennung von Prozess- und Messfehlern eingesetzt, um die wichtigsten
Prozessfehler zu identifizieren. Auf diese Weise kann eine hohe Datenqualität gewährleistet
werden, wie sie für eine erfolgreiche Modellkalibrierung notwendig ist.

Accelerating biological screenings through the combination of high-throughput and modeling
IV III - List of Contents
III List of Contents
I Abstract....................................................................................................................... II
II Zusammenfassung .................................................................................................... III
III List of Contents ......................................................................................................... IV
IV Acknowledgements ................................................................................................... VI
V List of Abbreviations ................................................................................................. VII
VI List of Publications .................................................................................................. VIII
1 Introduction ................................................................................................................. 1
2 Scientific Background.................................................................................................. 3
2.1 Bioprocess Development ..................................................................................... 3 2.1.1 Cultivation methods .................................................................................... 3 2.1.2 Liquid Handling Stations and data handling ............................................... 5 2.1.3 High-throughput mL cultivation systems ..................................................... 7
2.2 Modelling in Bioprocess Development ................................................................. 9 2.2.1 Mechanistic Models .................................................................................... 9 2.2.2 Flux Balance Models .................................................................................11 2.2.3 Data driven modelling approaches ............................................................12 2.2.4 Hybrid models ...........................................................................................13
3 Research questions (RQ) .......................................................................................... 14
RQ 1: How can dynamic data input within a statically working LHS be achieved? ....14 RQ 2: How can multiple parallel bioprocess be monitored? ......................................14 RQ 3: Can online model adaptation and dynamic redesign be used for continuous
growth alignment? .........................................................................................................14 RQ 4: How can high-quality parameter fitting with potentially inadequate data be
ensured? 14 RQ 5: An autonomously working bioprocess development facility. ............................15
4 Results ...................................................................................................................... 16
4.1 Automated Cell Treatment for Competence and Transformation of Escherichia coli
in a High-Throughput Quasi-Turbidostat Using Microtiter Plates ...............................17 Abstract: 17 4.1.1 Introduction ...............................................................................................18 4.1.2 Materials and Methods ..............................................................................20 4.1.3 Results ......................................................................................................22 4.1.4 Discussion ................................................................................................28 4.1.5 Conclusions ..............................................................................................30 Supplementary Materials ..........................................................................................30 Funding 30 Acknowledgments.....................................................................................................30 Conflicts of Interest ...................................................................................................30 4.1.6 References ...............................................................................................30
4.2 Integrated Robotic Mini Bioreactor Platform for Automated, Parallel Microbial
Cultivation With Online Data Handling and Process Control......................................35 Abbreviations ............................................................................................................36 4.2.1 Introduction ...............................................................................................36 4.2.2 Material and methods ................................................................................38 4.2.3 Results ......................................................................................................45 4.2.4 Discussion ................................................................................................54 Funding 55

Accelerating biological screenings through the combination of high-throughput and modeling
III - List of Contents V
Acknowledgement ....................................................................................................56 Conflicts of Interest ...................................................................................................56 4.2.5 References ...............................................................................................56
4.3 Automated Conditional Screening of Multiple Escherichia coli Strains in Parallel
Adaptive Fed-Batch Cultivations ...............................................................................60 4.3.1 Introduction ...............................................................................................61 4.3.2 Materials and Methods ..............................................................................63 4.3.3 Results ......................................................................................................68 4.3.4 Discussion ................................................................................................76 4.3.5 Conclusions ..............................................................................................78 Supplementary Materials: .........................................................................................78 Funding 79 Acknowledgments.....................................................................................................79 Conflicts of Interest ...................................................................................................79 4.3.6 References ...............................................................................................79
4.4 Monitoring Parallel Robotic Cultivations with Online Multivariate Analysis ..........83 Abstract 83 4.4.1 Introduction ...............................................................................................84 4.4.2 Materials and Methods ..............................................................................87 4.4.3 Results ......................................................................................................91 4.4.4 Discussion ................................................................................................97 4.4.5 Conclusions ..............................................................................................99 Supplementary Materials ........................................................................................ 100 Funding 100 Acknowledgments................................................................................................... 100 Conflicts of Interest ................................................................................................. 100 4.4.6 References ............................................................................................. 100
5 Discussion .............................................................................................................. 105
RQ 1: How can dynamic data input within a statically working LHS be achieved? .. 105 RQ 2: How can multiple parallel bioprocess be monitored? .................................... 106 RQ 3: Can online model adaptation and dynamic redesign be used for continuous
growth alignment? ....................................................................................................... 107 RQ 4: How can high-quality parameter fitting with potentially inadequate data be
ensured? 107 RQ 5: An autonomously working bioprocess development facility ........................... 108
6 Conclusions and Outlook ........................................................................................ 110
7 References ............................................................................................................. 112

Accelerating biological screenings through the combination of high-throughput and modeling
VI IV - Acknowledgements
IV Acknowledgements
I am very grateful for your great care and support over the many years that I have been at
the Chair of Biochemical Engineering. Starting with Prof. Dr. Peter Neubauer, who put his trust
in me even before I was enrolled as a biotechnology student at the TU Berlin. I would like to
thank Dr. Stefan Junne and Dr. Anja Lemoine, who introduced me to the depths of modelling
during my master thesis. I learned an enormous amount from Florian Glauche about data
processing and the use of pipetting robots. Florian, this work would not have been possible
without your involvement and extensive preliminary work.
Dr. Mariano Nicolas Cruz-Bournazou supervised me from the first to the last day of this
work. Nico, you are the spiritual father of this work. It makes me proud every day to be able to
fill this vision with life and to develop it further together with you.
I would like to thank all the students, PhD students and post-docs who have accompanied
me on my way here since 2013 at the Chair of Biochemical Engineering, first and foremost
Terrance Wilms, Benjamin Haby and Davie Nickel, Emmanuel Anane, Erich (now it's your turn)
and all project members of the LEANPROT project in particular Agnieszka Gawin and Karl
Peebo. Especially, I would like to thank Robert Giessmann, without whom I would not have
survived some night shifts.
I would like to thank my family very much. To my parents, whose support I never had to
worry about. To my wife, who is probably even happier than I am that this chapter has come
to an end, and to my children.
A special thanks goes to the co-authors of my Papers Benjamin Haby, Christian Ulmer,
Harini Narayanan, Irmgard Schäffl, Matthias Gimpel, Florian Glauche, Emmanuel Anane,
Annina Sawatzki, Niels Krausch, Trygve Brautaset, Tilman Barz, Peter Neubauer, Mariano
Nicolas Cruz-Bournazou. Working with you guys has always been great.
I acknowledge financial support by the German Federal Ministry of Education and
Research (BMBF) within the European program EraSysApp (project no. 031L0018A,
LEANPROT project) managed by the Projektträger Jülich (PtJ).

Accelerating biological screenings through the combination of high-throughput and modeling
V - List of Abbreviations VII
V List of Abbreviations
µ Growth rate
µ𝑚𝑎𝑥 Maximum Growth Rate
API Application Programming Interface
DBMS Data Base Management System
DO Dissolved Oxygen
DoE Design of Experiments
DOT Dissolved Oxygen Tension
FBA Flux Balance Analysis
GSM Genome Scale Model
LHS Liquid Handling Station
LTU Linear Transfer Unit
MWP Multi Well Plate
MVDA Multivariate Data Analysis
NIR Near Infrared
NN-ODE Neural Network Ordinary Differential equation
OD600 Optical Density at 600 nm
ODE Ordinary Differential Equation
OPC Open Platform Communication
PCA Principal Component Analysis
RHS Right-hand side
SiLA Standard in Laboratory Automation
SQL Structured Query Language
SSGSA Steady-State Growth Space Analysis
STR Stirred Tank Reactor
UV Ultraviolet
VIS Visual spectrum

Accelerating biological screenings through the combination of high-throughput and modeling
VIII VI - List of Publications
VI List of Publications
First author publications:
i. Hans S, Gimpel M, Glauche F, Neubauer P, Cruz-Bournazou MN, Automated Cell
Treatment for Competence and Transformation of Escherichia coli in a High-
Throughput Quasi-Turbidostat Using Microtiter Plates. Microorganisms. 2018; 6(3).
doi:10.3390/microorganisms6030060, accepted manuscript
ii. Haby B*, Hans S*, Anane E, Sawatzki A, Krausch N, Neubauer P, Cruz Bournazou
MN, Integrated Robotic Mini Bioreactor Platform for Automated, Parallel Microbial
Cultivation With Online Data Handling and Process Control, SLAS Technol. Transl.
Life Sci. Innov. 2019; 24(9). doi:10.1177/2472630319860775, accepted manuscript
iii. Hans S, Haby B, Krausch N, Barz T, Neubauer P, Cruz-Bournazou MN, 2020.
Automated Conditional Screening of Multiple Escherichia coli Strains in Parallel
Adaptive Fed-Batch Cultivations. Bioengineering 2020; 7(4)
doi:10.3390/bioengineering7040145, accepted manuscript
iv. Hans S*, Ulmer C*, Narayanan H, Brautaset T, Krausch N, Neubauer P, Schäffl I,
Sokolov M, Cruz Bournazou M.N, Monitoring Parallel Robotic Cultivations with
Online Multivariate Analysis, Processes. 2020; 8(5). doi:10.3390/pr8050582,
accepted manuscript
*equal contribution
Further publications
v. Sawatzki A, Hans S, Narayanan H, Haby B, Krausch N, Sokolov M, et al.
Accelerated Bioprocess Development of Endopolygalacturonase-Production with
Saccharomyces cerevisiae Using Multivariate Prediction in a 48 Mini-Bioreactor
Automated Platform. Bioengineering. 2018; 5(4).
doi:10.3390/bioengineering5040101
vi. Gawin A, Peebo K, Hans S, Ertesvåg H, Irla M, Neubauer P, et al. Construction
and characterization of broad-host-range reporter plasmid suitable for on-line
analysis of bacterial host responses related to recombinant protein production.
Microb Cell Fact. 2019; 18(1). doi:10.1186/s12934-019-1128-7
vii. E. Anane, Á.C. García, B. Haby, S. Hans, N. Krausch, M. Krewinkel, P.
Hauptmann, P. Neubauer, M.N. Cruz Bournazou, A model-based framework for
parallel scale-down fed-batch cultivations in mini-bioreactors for accelerated
phenotyping, Biotechnol. Bioeng. 2019; 116(11). doi:10.1002/bit.27116.
viii. Krausch, N., Hans, S., Fiedler, F., Lucia, S., Neubauer, P., Cruz Bournazou, M.N.,
2020. From Screening to Production: a Holistic Approach of High-throughput
Model-based Screening for Recombinant Protein Production, Computer Aided
Chemical Engineering. 2020; 48. doi:10.1016/B978-0-12-823377-1.50288-3

Accelerating biological screenings through the combination of high-throughput and modeling
1 Introduction
1 Introduction
The development of biotechnological products is a compartmentalized and long-term
process. Over the various stages of the product’s lifecycle, such as discovery and
development, bioprocess development, down streaming, and later production, - numerous
professionals from bioinformaticians, molecular- and microbiologists, (bio-) process engineers
to chemists and technicians are involved and the focus of development and optimization differs
between the involved entities. While for a successful product development all stages of the
product life cycle need to be efficient, bioprocess development plays an especially vital role.
Here it is often decided whether a promising product is suitable for profitable production and
marketing. Products with bad up-stream characteristics can often not be produced at all or only
at very high prices. Through unaudited determination of crucial bioprocess parameters
development becomes even more difficult. Bioprocess parameters like host and vector
backbone are commonly already defined in the early product identification and development
phase and partly not mandatory. Such decisions are often made based on expert knowledge
(Neubauer et al., 2017) or lab internal blueprints.
Reasons for unaudited determination of process parameters can be personal experience
or preferences as well as a lack of testing capacities and skills. The screening capabilities of
many big players in biotechnology have advanced during the last decade through increasing
automation, the spread of liquid handling stations and other laboratory robots, as well as the
growing connectivity of screening and analytic devices. However, the expected advances in
efficiency, robustness and speed during bioprocess development were not completely fulfilled.
The laborious planning and evaluation of automated screening experiments could be one
reason for this, as well as the requirement of preliminary information about the observation
object (mostly the host), which is often not present. This leads to long idle times of expensive
machines, experiments which are carried out with less informative value or screening
campaigns which are considered as too costly. To overcome these high (entry) barriers, simple
tools for planning experiments are needed and the dependency on preliminary information
needs to be reduced as much as possible.
For the planning of an experiment a number of tools are available. Methods like Design of
Experiments (DoE) are suitable to increase the information content of experimental data and
to facilitate its evaluation. However, prior knowledge of the object of study is necessary to limit
the design space. Knowledge based models can help to reduce the knowledge gap prior to the
experiment. Unfortunately, such models are usually only useful if they have been previously
calibrated to the specific system, a process that involves pre-testing and loss of time, even if
the model calibration can be reduced to only one experiment with sufficient automation (Cruz
Bournazou et al., 2017).
Therefore, the goal needs to be to design software that is able

Accelerating biological screenings through the combination of high-throughput and modeling
1 - Introduction 2
i.) to plan experiments
ii.) to perform experiments autonomously
iii.) to monitor and, if necessary, adjust the experiments and
iv.) to evaluate the outcome.
The points i.)-iii.) are the core of this thesis using Escherichia coli and two selected phases
of bioprocess development, namely the library screening and the conditional screening, as
case study. The integration of expert knowledge into the executing facility in form of
mathematical models was a decisive step for the success of this work.

Accelerating biological screenings through the combination of high-throughput and modeling
3 Scientific Background
2 Scientific Background
In the last decades, research has discovered an enormous amount of molecules, organisms
and synthetic pathways and developed basic methods for their use. This leads to an almost
infinite number of possible combinations on the road to new bioproducts. Even if the
combinations are reduced to the supposedly reasonable ones, the number of necessary
studies remaining cannot be mastered in traditional, manual, or partially automated manner.
Reducing the parameters to be optimized to a manageable number leads to sub-optimal or
unusable results. Automation can significantly expand the scope of testing. However, in
bioprocess engineering, even with intensive automation not all desired combinations can be
tested. High-Throughput Bioprocess Development (HTBD) addresses this issue by developing
tools to intensify automated studies and intelligent study design selection.
This offers completely new sustainable solutions in the fields of pharma/medicine,
chemistry, nutrition, environment, and energy. Among other things, biotechnological products
can lead to the replacement of chemical syntheses of basic substances up to complex
polymers (BMBF, 2010; EPSO, 2011; Zweck et al., 2015; Meyer, 2017).
2.1 Bioprocess Development
Product and process development in the field of biotechnology currently require an
enormous expenditure of time, personnel and initial investment compared to other industries
and are dominated by natural sciences at the beginning of the process, with an increasing
engineering focus in the later phases of the product life-cycle. The missing interaction between
the different fields, the changing focus and priority during development and varying applied
methods are reasons for the missing efficiency and futile cycles (i.e., trial and error) in the
development of biotechnological processes.
2.1.1 Cultivation methods
The kind of bioprocessing almost always has a major influence on product quantity and
quality. Optimizing this is therefore a central element in any successful bioproduct
development.
2.1.1.1 Batch cultivation
The cultivation of cells in a batch process is the simplest way to cultivate cells from picolitre
(Agresti et al., 2010; Kaganovitch et al., 2018) to m3 scale. All required cultivation components
are filled into a container and incubated for a certain time. In biological batch cultivation gas
and energy input is usually intended and desired. In general, a distinction needs to be made
between batch cultivations in small scales (no process control, less observation) and in larger
scales with common bioreactors (high process control, established online observation).
Smaller cultivations are tempered and shaken from the outside. The shaking serves to set the

Accelerating biological screenings through the combination of high-throughput and modeling
2 - Scientific Background 4
liquid in motion and increase the surface on which a gas exchange with the ambient air can
take place. In larger scales, mechanical and thermal energy as well as gases are often supplied
directly into the reactors.
Due to their simplicity, small-scale batch processes can be set up quickly, parallelized,
automated, and scaled over a wide range. Therefore, they are very common in the early
development and screening phase, with the focus lying on screening many variants. Batch
processes are usually less productive compared to other cultivation methods due to limited
reaction rate control (Enfors, 2019). Since all substrates are present in the medium at the
beginning, it is not possible to add high amounts of substrates without inhibiting effects. In
addition, the substrates are consumed by the cells at the maximum possible uptake rate and
the cells enter the overflow metabolism. As a consequence, organic acids are produced, which
inhibit growth and thus the biomass synthesis (Luli and Strohl, 1990; Nakano et al., 1997) and
recombinant protein production (Bauer et al., 1990; Jensen and Carlsen, 1990; Shiloach et al.,
1996; Ruano et al., 2016). By selecting the carbon source in the medium, the growth rate can
be reduced, with positive effects on the maximum possible biomass concentration (Lee, 1996).
Furthermore, sugar release systems can be incorporated into batch cultivation. By diffusion or
enzymatic digestion glucose molecules are continuously released in the medium (Jeude et al.,
2006; Panula-Perälä et al., 2008). This allows the cultivation of cells with a constant feed and
leads to positive effects on biomass and recombinant protein production (Krause et al., 2010;
Šiurkus et al., 2010; Toeroek et al., 2015) while keeping the simplicity of the batch process.
2.1.1.2 Fed-batch cultivation
A fed-batch cultivation differs from a batch cultivation by the continuous feeding of nutrients.
This is accompanied by a significant increase in volume over the cultivation period.
Significantly more equipment is required for a fed-batch cultivation, and the process cannot be
reduced in scale and parallelized as easily as a batch process. However, the continuous
feeding of a culture growing on limitation has enormous advantages for metabolic reaction
control, biomass synthesis and the production of recombinant proteins. Due to the significantly
better production properties, a majority of industrial bioprocesses are operated as fed-batch
cultivation (Mears et al., 2017).
2.1.1.3 Continuous cultivation
In a continuous cultivation feed is added while culture liquid is removed simultaneously. As
the culture medium is regularly diluted and replaced, the culture is kept in a constant state over
a long period of time. A wide range of conditions can be kept stable. Depending on process
control strategy, different types of continuous cultivation processes are distinguished.
The chemostat is the most used continuous cultivation method. The process control is
based on the dilution rate and is adjusted to a desired growth rate (µ). Thereby, the composition

Accelerating biological screenings through the combination of high-throughput and modeling
5 Scientific Background
of the culture liquid (e.g., substrate, biomass concentration) is stable over a long period and
can be used for intensive observation or sampling. Depending on which parameter the dilution
rate is controlled by, the process is called a DO-stat (controlled by oxygen saturation),
pH-auxostat (Martin and Hempfling, 1976), CO2-auxostat (Watson, 1969), permittistat
(electrical capacity of the culture) (Markx et al., 1991) or turbidostat (in the outlet) (Bryson and
Szybalski, 1952). A special challenge in chemostat cultivation is the operation near the
maximum growth rate (µmax), with the risk that the dilution exceeds the possible maximum
growth rate and the cells are washed out. The turbidostat takes exactly this problem into
account and enables chemostat experiments close to or at µmax.
However, after a change to a different growth rate the culture requires several generations
to achieve extra- and intracellular stability. The screening of a broad steady-state growth space
analysis (SSGSA) is therefore a very time-consuming process. Changestat cultivations keep
the change in growth rate constant (ascending µ: accelrostat, A-stat; descending µ:
decelerationstat, De-stat; ) (Paalme et al., 1995). With Changestat cultivations, SSGSA can
be performed in a reasonable time (Subramanian et al., 2017) and are a suitable tool for
process optimization (Glauche et al., 2017). Further Changestat variants are the D-Stat (one
cultivation parameter is changed, dilution rate remains constant) and the Auxoaccelerostat.
Apart from research for industrial applications of continuous cultivation, sustained
operation with consistent product quality, reduced equipment size, high-volumetric
productivity, streamlined process flow, low-process cycle times, and reduced capital and
operating cost (Konstantinov and Cooney, 2015) can be facilitated with the chemostat.
Furthermore, process dependent issues like product toxicity for the host, product inhibition or
a rapid catabolism of the product (Villadsen et al., 2011) can be addressed and solved as well.
2.1.2 Liquid Handling Stations and data handling
Liquid Handling Stations (LHS) are complex facilities for transporting and manipulating
liquids. Their development dates back to the 1990s (Freeman and Yeudall, 1986; Pfost et al.,
1989). They have one or more pipetting units and are often also capable of moving labware
such as Multi Well Plates (MWP). Some pipetting units can be installed stationary within the
LHS (e.g.: CyBiWell Analytik Jana). In this case, the labware is transported to the pipetting
unit. Alternatively, the pipetting units can be movable (e.g.: Beckman Coulter, Eppendorf,
Hamilton, Tecan, m2pLabs, OpenTron). In these instruments, the ability to transport labware
is no longer necessary, but often present. The pipetting units can comprise of 1 to 1536
channels. Generally, units with two to eight channels can process individual volumes in
parallel, while pipetting units with more than eight channels can process only one volume at a
time. Devices that can process 96 individual values are available but not widely used (e.g.:
DynamicDevices). While interacting with liquids is the core functionality of LHS, further

Accelerating biological screenings through the combination of high-throughput and modeling
2 - Scientific Background 6
functions can be implemented. These are mostly enabled by devices placed next to or directly
in the LHS and can include almost the entire spectrum of laboratory devices.
LHS are very good at processing previously defined tasks. However, they reach their limits
if details of the task are not fixed at the time of the process start (call of a method) or change
during its run. There are several workarounds to solve the problem of missing input at the start
of the method. Almost all LHS control software have the possibility to read from external files.
A static reference to a file in a LHS method can be used as a pointer to the respective
information. Regardless of the LHS software, the file can be constantly manipulated to provide
missing or updated information. However, this requires a good management of the read and
write rights and network access to the file system, in particular if the information is generated
by applications that are not executed on the actual computer. In addition, traceability is more
difficult because the old information is overwritten.
The storage of process control information and all kinds of measurements with a traceable
history is mandatory for the evaluation of bioprocesses. In networked systems consisting of
LHS, laboratory devices, microservices and software solutions (e.g.: Electronic Lab Journals
(ELN), Manufacturing Execution Systems (MES) or Laboratory Information and Management
System (LIMS)), centralized and uniform collection of all relevant data is a challenge. Even if
a number of these entities run on the same system, a data and data exchange concept is
necessary. Databases provide a good tool for this purpose. Depending on the task there are
different types of databases available. The storage and retrieval of data is handled by an
interface, the Data Base Management System (DBMS). The user or the application directs the
queries to the DBMS. For relational databases the standardized Structured Query Language
(SQL) is mostly used. In relational databases, complex data and relationships can be easily
mapped using data models. For retrieving or writing data from a LHS method, separate
interfaces (drivers) are necessary to exchange data with the DBMS. Rarely are database
queries directly possible in the LHS software.
However, designing SQL queries for reading and storing data can be difficult and requires
detailed knowledge of the underlying data model and still requires writing specific drivers for
software and devices. Communication Standards like SiLA or OPC has already entered the
laboratory environment and are design for network communication. Together with data
standards such as AnIML or Allotrope, progress is being made towards easier networking of
future laboratories.

Accelerating biological screenings through the combination of high-throughput and modeling
7 Scientific Background
2.1.3 High-throughput mL cultivation systems
Microbial cultures are carried out in all scales which are able to host a cell. The cultivation
systems differ greatly in regard to process control, monitoring, technical equipment, and
handling. Generally speaking, the degree of process control and monitoring increases with the
size of the system and the possibilities of automatization and parallelisation decrease.
2.1.3.1 Multi Well Plate based bioreactors
Multi Well Plates (MWP) are widely used in the early screening phase (Junker and Wang,
2006; Funke et al., 2009) and have become standard practice in the industry (Duetz, 2007).As
automated handling of MWP is the original purpose of LHS it is not surprising that LHS are
also suitable for the cultivation of microbes in MWP (Cancer et al., 2004; Zimmermann and
Rieth, 2006; Knepper et al., 2014; Glauche et al., 2015). Nevertheless, cultivations performed
in this environment are hardly comparable to industrial processes, since for example active pH
control, fed-batch or continuous process conditions are missing (Buchenauer et al., 2009;
Scheidle et al., 2010). Due to the small volume of MWP, sampling is limited, too. Only optical
measurements (e.g. optical density (OD) or fluorescence) can be determined non-invasively.
With adapted MWP for non-invasive pH or DO measurement, these parameters can be
determined without sampling, but simultaneously contact-free OD determination is lost (John
et al., 2003; Arain et al., 2006).
Gas exchange in open and shaken systems like MWPs is limited (Duetz and Witholt, 2004).
To avoid evaporation, the plates are sealed with foils and the oxygen transfer decreases
further, which can present a problem for aerobic growth. However, there are notable
differences in regard to gas permeability of different MWP foils and caps (Duetz et al., 2000;
Zimmermann et al., 2003). In addition, alternative well geometries have been developed to
increase the gas transfer rate (Funke et al., 2009).
A complete cultivation system based on MWP with integrated gas supply, temperature and
control as well as integrated monitoring DO, pH and OD was developed as bioLector® (Kensy
et al., 2009) and also integrated into LHS (Huber et al., 2009; 2011; Unthan et al., 2015;
Blesken et al., 2016). By using MWP with microfluidic channels, continuous feed and pH
control have been applied (Buchenauer et al., 2009; Funke et al., 2010) and this system is
commercially available as the bioLector® Pro (Blesken et al., 2016).
The described systems have a similar functionality as benchtop stirred tank reactors, with
a significantly higher throughput and the number of possible and performed experiments
constantly increasing in the last decade. A disadvantage of the MWP based bioreactor is the
comparatively small cultivation volume, which limits sampling. This could also be a reason why
the expected acceleration in bioprocess development has not happened despite the
development of complex MWP systems.

Accelerating biological screenings through the combination of high-throughput and modeling
2 - Scientific Background 8
2.1.3.2 Milliliter stirred tank reactors
The Stirred Tank Reactor (STR) is the industrial standard in later bioprocess development
stages. The bioprocess within a STR can be automated very well, which does only partly apply
to the tasks outside of the bioprocess (e.g.: inoculation, sampling, sterilization). The process
control and monitoring in STRs is high, as well as the effort required for parallelization and
miniaturisation.
To increase the degree of automation outside the bioprocess, bioreactor integration into a
LHS is beneficial. The HEL BioXplorer100 system is a minimization of an STR and has already
been successfully integrated into LHS (HEL, 2019). With up to 150 mL working volume and 8
parallel reactors it is one of the larger systems that can be integrated into LHS. The
bioREACTOR 48 from 2mag with its 48 parallel 10 mL reactors is also an attempt to mimic a
benchtop STR that can be integrated into LHS (Puskeiler et al., 2005; Weuster-Botz, 2005;
Knorr et al., 2007; Haby et al., 2019). However, its compact dimensions change the possibilities
of process control and monitoring since the conventional actuators and sensors cannot be
used. Although probes for online DO and pH are available, no other online measurements can
be made, and the addition of feed or other supplements is only possible on a pulse basis.
Linear feed approaches are very complex and have widely not been accepted (Gebhardt et
al., 2011; Schmideder et al., 2015). The degrees of freedom in process control are further
limited. Temperature, stirrer speed and gassing have to be the same for all included
bioreactors. This disadvantage has been reduced with the bioREACTOR 8.
A compromise between the two systems mentioned above is the ambr15® system.
Temperature, gas supply and stirrer speed are fixed for all 24 cultures, but pH control and feed
can be added continuously to the vessels available at working volumes from 10 ml to 15 ml.
Other miniaturized bioreactor systems that cannot be integrated into an LHS, whose operating
effort is high and the volume is less comparable to benchtop STRs, have disappeared from
the market. Examples are the DASbox System (Eppendorf) or the 24microreactor from PAL,
although both were used in a wide range of bioprocess developments (Warr et al., 2013; Warr,
2014; Vital-Jacome et al., 2016; Koenig et al., 2018; Sousa et al., 2018; Kopp et al., 2019).
The ambr250® system is comparable to the DASbox in terms of equipment and technology,
but it is delivered directly with its own automation system and is very successful on the market
for industrial bioprocess development (Ritz et al., 2017; Manahan et al., 2019).

Accelerating biological screenings through the combination of high-throughput and modeling
9 Scientific Background
2.2 Modelling in Bioprocess Development
From the philosophers of antiquity to the discovery of DNA by Watson and Crick to the most
complex biochemical pathways, models have always been an important tool to make reality
more tangible. Models never represent the whole reality, but represent it in a simplified way
and are characterized by illustration, reduction and pragmatism (Stachowiak, 1973). Helpful
models are characterized by a balanced relationship between simplification and complexity
without ignoring important points of the respective problem. This explains why there is no single
model for any organism, but rather a multitude of models that are meticulously tailored for
different purposes.
Mathematical models are no exception in this context. They can help to represent
knowledge and observations in equations. A distinction must be made between knowledge-
based approaches, such as mechanistic or flux balance models, and data driven approaches,
e.g. statistical regressions, principal component analysis or neural networks. The advantage
of knowledge-based models is that they try to represent the existing state of knowledge
mathematically. Pathways, mass balances, kinetic reaction rates or regulatory mechanisms
can be mathematically formulated and calculated. Therefore knowledge-based models can be
calibrated with relatively few data and a meaning can be assigned to the model parameters.
This makes knowledge-based models very well suited to support screening processes and to
facilitate the selection of clones.
Furthermore, depending on the application and the state of knowledge, different models
can be created and compared. Model discrimination compares different models and evaluates
them to a specific question. During model discrimination, different hypotheses on the same
subject are investigated. The different outputs of the models are compared and, depending on
how well the fit matches with the measured data, a hypothesis can be disproved or supported.
Model discrimination can also be used to decide which models in a set to apply to a given
dataset to avoid overfitting and ill conditions in the parameter set.
2.2.1 Mechanistic Models
Mechanistic models in chemistry and biochemistry consist of mass balance equations and
specific (kinetic) rates to map metabolic interactions (Almquist et al., 2014). The concentration
changes of the observed metabolites are usually formulated as ordinary differential equations
(ODE) in the form of 𝑑𝑡
𝑑𝑡= 𝑟, where 𝑟 is the right-hand side (RHS) of the equation, representing
the kinetic reaction rate. The knowledge-based approach is very well suited to predict the
behavior of cells in the bioprocesses. A complete picture of the whole biochemical network is
usually not necessary to obtain a good representation of the bioprocess. For this reason,
reduced or less complex mechanistic models, which can be calibrated with a manageable
amount of data and are computed quickly, are most often used in bioprocess development. As

Accelerating biological screenings through the combination of high-throughput and modeling
2 - Scientific Background 10
early as 1973, Yoshida et al. published a first fed-batch model showing the growth of Candia
tropicalis as a function of the feeding rate (Yoshida et al., 1973). Since then, many different
bioprocess models have been published, which describe the cell behaviour with different
focuses.
The organism this work focuses on is Escherichia coli. E. coli is probably the most utilized
procaryotic organism in biotechnology and therefore well understood and examined. E. coli is
used as a host for gene expression (Wang and Kushner, 1991; Hannig and Makrides, 1998;
Rydenfelt et al., 2015), production of recombinant proteins (Hsu et al., 2014; McKinstry et al.,
2014; Rosano and Ceccarelli, 2014) and other biochemical products like biofuels (Dugar and
Stephanopoulos, 2011; Hollinshead et al., 2014). E. coli features many characteristics that
make it especially applicable in biotechnology. It is one of the fastest growing bacteria with a
generation time of 20 min (Sezonov et al., 2007) be cultivated in high cell density up to
190 𝑔 ∗ 𝐿−1 (Shiloach and Fass, 2005) and various tools for easy and fast transformation (Pope
and Kent, 1996).
The overflow metabolism of E. coli is associated with inadequate bioprocesses and is
undesirable in industrial applications (Axe and Bailey, 1995). Therefore, a trade-off between
fast growth and high production while mantaining substrate limited conditions is required.
Different model approaches focus on reflecting the production of acetate. In 1999, Xu el. al.
published a model in which the production of acetate always starts if the glucose uptake rate
exceeds a fixed assumed maximum respiratory capacity (Xu et al., 1999). The concept was
further developed in 2001 by Lin et al (Lin et al., 2001b). In this model, the authors assume a
dynamically changing capacity limit for glucose and oxygen uptake. By considering the
metabolic changes of E. coli during fed-batch cultivation, the dynamics of acetate
measurements were followed better. The concept of Basan et al. also describes the overflow
metabolism of E. coli depending on the availability of a single carbon source (Basan et al.,
2015). The acetate production is shown as a function of the cost for proteome formation and
the energy requirement is calculated as a function of the growth rate. The shift of the overflow
metabolism towards lower growth rates due to increasing metabolic burden by recombinant
protein production can be well represented in this model. However, only batch data were used
for the model development. A shift of the acetate production during a long cultivation period as
assumed by Lin et al. 2001b was not shown.
All these models have in common that constraints were built in to simulate the different
phenotypic effects. The models of Cruz et al. and Anane et al. substitute these discontinuities
by a cyclic acetate production (Anane et al., 2017; Cruz Bournazou et al., 2017) adapted from
the Xu and Lin models. This model is easier to apply in the planning of new bioprocesses,
since unphysiological jumps in the simulation results are excluded. This model assumes that

Accelerating biological screenings through the combination of high-throughput and modeling
11 Scientific Background
acetate is constantly formed and absorbed in an intracellular cycle. Phenotypic acetate
formation occurs only when acetate production exceeds the absorption capacity.
For industrial applications, models that incorporate protein production are of high interest
(Lin et al., 2001a). Neubauer et. al published a model with recombinant protein production as
early as 2003, and included the effects of plasmid free populations to the product formation
rate (Neubauer et al., 2003). Whereas here the protein production rate is solved via a yield
coefficient, Calleja et al. modelled the kinetic dependencies of recombinant protein production
on the inducer IPTG (Calleja et al., 2016).
The models described so far consist of relatively few parameters and state variables and
are less complex. For the simulation of bioprocesses, they represent the most important
information and interrelationships are covered. The calibration can be carried out with
moderate computation power and data. However, the macro-kinetic formulations are
insufficient if we aim a system-wide approach, which includes metabolic engineering among
others. A first approach in this direction was made by Chassagnole et al. already in 2002 by
modelling the glycolysis and the pentose-phosphate pathway (Chassagnole et al., 2002). With
the increasing knowledge about metabolic pathways, interrelationships and the emergence of
the omics technologies, the size of the system wide modelling approaches continually
increases (Costa et al., 2010; Tohsato et al., 2013; Khodayari et al., 2014). With 337 state
variables, the model of Khodayari and Maranas is currently the most complex kinetic model
for E. coli (Khodayari and Maranas, 2016).
2.2.2 Flux Balance Models
In the flux balance analysis (FBA), stoichiometric relationships are considered in the form
𝑆 ∗ �⃗� = 0. The matrix 𝑆 contains the stoichiometric relations and the vector 𝑣 the conversion
rates. Solving these systems for an unknown �⃗� usually represents the solution of the metabolic
network in steady state conditions. Metabolic networks used for FBA usually are complex
networks with more than one solution for 𝑆 ∗ �⃗� = 0. Therefore, the vector �⃗� is mostly
constrained and such models are called constraint based metabolic models. Depending on the
research questions, genetic knockouts can be simulated, mass flows can be optimised or
unphysiological solutions can be avoided by limiting the reaction rates of �⃗�.
Partly, the metabolic network can be generated automatically based on the genome
sequence data with sufficient accuracy (Henry et al., 2010). Therefore, established models can
include much larger metabolic networks compared to mechanistic models. The largest
metabolic networks can comprise over 1000 reactions and summarise the entire known
knowledge of metabolic networks. The development of new models goes hand in hand with
the creation of new knowledge. The development of the omics technologies in the last two
decades has extremely accelerated this process. Between one of the first large E. coli genome
scale models (GSM), the iJE660 GSM, and the current largest model, the iML1515, an

Accelerating biological screenings through the combination of high-throughput and modeling
2 - Scientific Background 12
extension or new GSM was published on average every three and a half years and the number
of genes considered doubled in this time. (Edwards and Palsson, 2000; Reed et al., 2003;
Feist and Palsson, 2008; Orth et al., 2011; Monk et al., 2017). The use of GSM is broad and
includes applications in systems biology such as metabolic engineering, prediction of gene
function, discovery of new microbial community-wide metabolic activities, but also the
identification of drug targets in microbial pathogens (Kim et al., 2017).
Flux balance analyses and pure metabolic network models have some disadvantages
compared to kinetic modelling. They represent the steady state and cannot calculate
metabolite concentrations (Orth et al., 2010; Øyås and Stelling, 2018). This limits the
applications of FBA for questions in bioprocess development, especially in conditional
screening and for the use of model predictive control. Dynamic FBA tries to overcome the issue
of pure steady state calculations (Mahadevan et al., 2002).
The fitting of kinetic models can be improved if FBA results are used as additional
constraints or to estimate initial values (Feng et al., 2012; Khodayari et al., 2014). Furthermore,
metabolic network models are used to train machine learning (ML) models. Here, GSM serves
as an additional input (fluxomic) together with other omics data. The application of GSM in the
field of ML has been summarised in detail in the past (Camacho et al., 2018; Zampieri et al.,
2019).
2.2.3 Data driven modelling approaches
Data driven models do not require any previous knowledge of the system under
investigation. However, previous knowledge is advantageous here as well. In supervised
learning, the input data are evaluated, labelled or classified according to existing knowledge.
The aim is to correlate input and output data as precisely as possible and to be able to draw
conclusions about new, unknown data. If the expected results are not made available to the
model in any way for training purposes, this is referred to as unsupervised learning (Tarca et
al., 2007).
Principal components analysis (PCA) belongs to the unsupervised data-driven modelling
methods and is a special form of factor analysis. The correlations of the variables of the input
data set are minimised by multiple orthogonal transformations and represented with a few new
factors, the principal components. It is therefore a suitable method for presenting and
clustering complex multidimensional data, and to reduce dimension and complexity of
datasets. PCA is used in almost all areas of biotechnology and bioprocess engineering: in the
examination and evaluation of omics and multi-omics data (Argelaguet et al., 2018), as soft
sensors for bioprocesses (Randek and Mandenius, 2018) as well as for bioprocess evaluation
(Kroll et al., 2017; Sawatzki et al., 2018; Narayanan et al., 2020) and monitoring
(Rajamanickam et al., 2017), for downstream optimisation (Edwards-Parton et al., 2008), and

Accelerating biological screenings through the combination of high-throughput and modeling
13 Scientific Background
for the evaluation of sensor data especially with spectra methods (Claßen et al., 2017; Doppler
et al., 2020).
Supervised learning methods also have a wide range of applications in biotechnology and
especially in bioprocess engineering. Support vector machines (SVMs) and artificial neuronal
networks (ANN) are frequently used e.g. for the prediction of product formation (Cui et al.,
2017), as soft sensors (Vaitkus et al., 2020; Zhu et al., 2020) and for the interpretation of
complex spectral measurements like UV/VIS , RAMAN or NIR (Reddy and Bhargava, 2010;
Takahashi et al., 2015; Zareef et al., 2020)
2.2.4 Hybrid models
Not all aspects of a metabolic network or bioprocess can always be represented with one
single type of model. Knowledge-based models often reach the limits of complexity or
knowledge. Data driven modelling approaches often lag in sufficient data for high quality
models. The use of hybrid models enables the best possible model to be generated from
different methods and available data (Feyo De Azevedo et al., 1997).
One example is the before mentioned use of GSM as fluxomic data in the establishment of
multiomics models. Hybrid models were already used in the past millennium to monitor and
optimise bioprocesses (Schubert et al., 1994; Feyo De Azevedo et al., 1997). Kinetic models
combined with ANN have been used several times for the modelling of bioprocesses (Fellner
et al., 2003; Zhang et al., 2019). Stosch et al. used a lean metabolic network, in which the
material flows are determined via PCA, for bioprocess monitoring and optimisation (Stosch et
al., 2012). Oscillations in yeast glycolysis was the object of study by Yazdani et al. Here, the
ODE system was directly incorporated into the deep learning framework by including the ODE
residues in the loss function (Yazdani et al., 2020). In all these cases, the fit or prediction of
the model was significantly improved compared to the pure knowledge-based approaches.
However, in the previews mentions studies, the information of the knowledge-based models
is used as inputs for the data driven approaches and the states are directly estimated. Neural
Network ODE (NN-ODE) represent a different approach. The basic model structure is similar
to mechanistic models, however, some (or all) reaction rates of the RHS are formulated as NN
outputs instated of kinetic formulations (Lagaris et al., 1998). Even though NN-ODE have the
power to improve lean mechanistic bioprocess models, they have never been applied in this
field so far.

Accelerating biological screenings through the combination of high-throughput and modeling
3 - Research questions (RQ) 14
3 Research questions (RQ)
The overall aim of this thesis is to accelerate bioprocess development through combination
of automation and modelling towards smart bioprocess facilities. The basic consideration is
that only smart facilities can achieve the throughput required for today's bioprocess
engineering in a reasonable amount of time. How to efficiently introduce well-adapted and
tailored models into the different stages of bioprocess engineering is one of the driving motives
of this work. For this purpose, the following subproblems are identified:
RQ 1: How can dynamic data input within a statically working LHS be achieved?
Even though the use of models is the path to intelligent process automation, hardware
automation is a fundamental prerequisite. For isolated systems with static tasks, such as LHS,
this is a solved problem. However, it becomes more complex when fundamental process
dynamics have to be adapted during the process. The possibilities of LHS are manifold and
can range from very simple to highly complex operations. However, the used control software
of the LHS is not suitable for reacting to new inputs and adapting the running protocols. It is
designed for tasks where all necessary steps and pipetting volumes are fixed at the start of the
method.
RQ 2: How can multiple parallel bioprocess be monitored?
Bioprocess monitoring is a common application of mostly data-driven models. Based on
historical data, models are trained and used for process prediction or observation. Errors in
process control are thus quickly detected. For new strains, the necessary historical data are
not available to create these models. However, especially in screening, process errors should
be detected quickly to intervene in time and to avoid having to repeat the experiment.
RQ 3: Can online model adaptation and dynamic redesign be used for continuous
growth alignment?
To accelerate bioprocess development the automation of library screening is an essential
step. While automated transformation of E. coli is not a major challenge anymore, generating
competent cells simultaneously for multiple strains is. Here, the growth of the different strains
must be aligned to create a uniform harvest time.
RQ 4: How can high-quality parameter fitting with potentially inadequate data be
ensured?
Effective parameter adaptation requires sufficient data, which is often not available in the
early stages of of a bioprocess. However, many crucial predictions must be made as precisely
as possible, especially at the beginning of the process. The model calibration must therefore
produce a robust result even without sufficient data.

Accelerating biological screenings through the combination of high-throughput and modeling
15 Research questions (RQ)
RQ 5: An autonomously working bioprocess development facility.
The design of bioprocesses is a complex task, dependent on the possibilities of process
monitoring, information on the system used (host, vector, bioreactor, etc.) and experience of
the operator. For fast and efficient screenings, robust bioprocesses should be scheduled and
executed as automatized as possible without the need of historical data.

Accelerating biological screenings through the combination of high-throughput and modeling
4 - Results 16
4 Results
In this work, the added value of combined automation and modelling is shown. A large
number of parallel cultivations is managed without the need for preliminary experiments or
knowledge about the used strains. This was made possible by the development of a system
composed of two LHS and one MBR, which enables complex operations for bioprocess
control.
Paper I (Automated Cell Treatment for Competence and Transformation of Escherichia coli
in a High-Throughput Quasi-Turbidostat Using Microtiter Plates) shows the successful
application of a growth model to keep the cells in the exponential growth phase. The model is
used to predict the biomass concentration and the needed operations are directly executed by
the LHS.
The used model is quite simple, the prediction horizon is short and biomass is taken into
account. The entire experiment can be executed on a single LHS, which makes the
requirements for data handling and automation manageable. In Paper II (Integrated Robotic
Mini Bioreactor Platform for Automated, Parallel Microbial Cultivation With Online Data
Handling and Process Control) a facility is described composed of two LHS, one MBR, full
integrated data flow and process automation.
This facility is used for strain characterisation in paper III (Automated conditional screening
of Escherichia coli knockout mutants in parallel adaptive fed-batch cultivations). Here, the
complexity of the model used and the forecast period increases. The presented cycle of data
collection, model adaptation and recalculation of the bioprocess design allowed a robust
experiment for 8 different strains simultaneously without a manual review.
The adaption of mechanistic models to specific hosts is a computationally intensive and
time-consuming process. This is fine for forecasting applications with a target duration of
several hours, but not for process monitoring with the aim to detect accidents or operation
failures. For such purposes models are needed that require minimal data and can be adapted
rapidly. Such an application is descripted in paper IV (Monitoring Parallel Robotic Cultivations
with Online Multivariate Analysis) with the use of a PCA model for process observation.

Accelerating biological screenings through the combination of high-throughput and modeling
17 Paper I - Automated Cell Treatment for Competence and Transformation of …
4.1 Automated Cell Treatment for Competence and Transformation of Escherichia coli in a High-Throughput Quasi-Turbidostat Using Microtiter Plates
Microorganisms 2018, 6(3), 60; doi:10.3390/microorganisms6030060, Accepted: 22 June 2018 / Published: 25 June 2018, accepted manuscript Copyright © 2020 by the authors – CC BY 4.0
Sebastian Hans1, Matthias Gimpel1, Florian Glauche1, Peter Neubauer1 and Mariano Nicolas Cruz-Bournazou1* 1 Technische Universität Berlin, Institute of Biotechnology, Chair of Bioprocess Engineering,
Ackerstraße 76, 13355 Berlin, Germany * Correspondence: [email protected] (M.N.C.B.)
Abstract: Metabolic engineering and genome editing strategies often lead to large strain
libraries of a bacterial host. Nevertheless, the generation of competent cells is the basis for
transformation and subsequent screening of these strains. While preparation of competent
cells is a standard procedure in flask cultivations, parallelization becomes a challenging task
when working with larger libraries and liquid handling stations as transformation efficiency
depends on a distinct physiological state of the cells. We present a robust method for the
preparation of competent cells and their transformation. The strength of the method is that all
cells on the plate can be maintained at a high growth rate until all cultures have reached a
defined cell density regardless of growth rate and lag phase variabilities. This allows sufficient
transformation in automated high throughput facilities and solves important scheduling issues
in wet-lab library screenings. We address the problem of different growth rates, lag phases,
and initial cell densities inspired by the characteristics of continuous cultures. The method
functions on a fully automated liquid handling platform including all steps from the inoculation
of the liquid cultures to plating and incubation on agar plates. The key advantage of the
developed method is that it enables cell harvest in 96 well plates at a predefined time by
keeping fast growing cells in the exponential phase as in turbidostat cultivations. This is done
by a periodic monitoring of cell growth and a controlled dilution specific for each well. With the
described methodology, we were able to transform different strains in parallel. The
transformants produced can be picked and used in further automated screening experiments.
This method offers the possibility to transform any combination of strain- and plasmid library
in an automated high-throughput system, overcoming an important bottleneck in the high-
throughput screening and the overall chain of bioprocess development.
Own Contributions: Conceptualization, Methodology, Formal Analysis, Investigation, Resources, Data
Curation, Writing-Original Draft, Visualization
Author Contributions: Conceptualization, MNC-B, SH and MG; Methodology, SH; Validation, MG, FG
and MNC-B; Formal Analysis, SH; Investigation, SH, MG and MNC-B; Resources, SH; Data Curation,
SH; Writing-Original Draft Preparation, SH; Writing-Review & Editing, MG, FG, MNC-B and PN;
Visualization, SH; Supervision, MG, FG, MNC-B and PN; Project Administration, MNC-B and PN

Accelerating biological screenings through the combination of high-throughput and modeling
Paper I - Automated Cell Treatment for Competence and Transformation of … 18
4.1.1 Introduction
The vast number of factors that influence the expression of recombinant protein production
in bioprocesses makes screening a challenging task in bioprocess development [1]. The
choice of the strain is typically made at early stages in product development and is therefore
excluded in the following steps [2,3].
With the increasing number of tools to manipulate DNA, new options are available in the
field of metabolic engineering, and genome editing [4,5]. On that node, the expression host
gets more in focus of the optimization processes [6]. Metabolic engineering to increase the
production of small molecules is a common task for various hosts [7,8,9,10]. The availability of
a variety of expression plasmids with low (e.g., pSC101 [11]), medium (pBR322 [12]) or high
(e.g., pUC18/19 [13]) copy numbers as well as different constitutive and inducible promoter
systems (e.g., PT7 [14], Plac, [15], PBAD [16], Pm/Xyls System [17]), controlling target gene
expression, enlarge the search region for the optimal bioprocess even further.
Beyond the field of bioprocess development, studying knockout mutants helps to get a
deeper understanding of gene functions and regulatory processes. With the use of fluorescent
reporter systems, genetic networks can be studied. The largest available set of Escherichia
coli (E. coli) strains with unknown behavior is the Keio Collection [18,19]. The Keio Collection
is a library of 3864 E. coli K-12 single knockout strains. Similar collections are also described
for Bacillus subtilis [20], Pseudomonas aeruginosa [21], Acinetobacter baylyi [22] and
Saccharomyces cerevisiae [23]. With the use of fluorescent reporter systems, genetic
networks can be studied in these strain libraries in vitro online and without extensive analytics
[24]. Nevertheless, a systematic study of these collections with a reporter system is very
difficult without automated treatment. Hence, there is a need for automated and high
throughput treatment for cell competence and transformation.
The easy handling and the well-established molecular and microbiological methods made
E. coli into one of the most commonly used organisms for heterologous protein production.
Until the end of 2011, over 200 biopharmaceuticals have gained regulatory approval, nearly
one third of them are produced in E. coli [2], demonstrating its importance for biotechnology.
The first step in the process of manipulating cells is their treatment for competence. In E. coli
there are mainly two different methods for competent cell preparation available: chemical
treatment with CaCl2 [25,26,27,28] or the use of electricity [29,30]. As the competence
depends on the physiological state of the cell, for both methods, the cultures must be harvested
at a certain turbidity (optical density, OD) during the exponential growth phase. What is a basic
task in laboratory with a well-known strain, could be a challenging task in a high throughput
screening with a vast number of strains of unknown growth behavior. Whereas the problem of
automated competence treatment has been solved when using a single strain [31,32],

Accelerating biological screenings through the combination of high-throughput and modeling
19 Paper I - Automated Cell Treatment for Competence and Transformation of …
completely different problems arise when using entire strain libraries. Normally, a batch culture
is chosen to start the treatment of cells for competence. The cells are more or less monitored
until a certain OD is reached. Even though automated frameworks exist to harvest the culture
at a desired biomass concentration [33], different growth rates, starting ODs and lag-phases
make it difficult to reach the same OD at the same time when transforming different clones
(Figure 1a). From the perspective of bioprocess engineering, the method of choice to maintain
the cells at a given condition would be a continuous cultivation [34]. The most used system
(due to its simplicity and robustness) is the chemostat, where the growth rate is determined by
the dilution rate. An extension of the chemostat is the turbidostat method. Here, the OD is
continuously monitored and the dilution is controlled by the OD signal. Such a system enables
cultivation close to the maximum growth rate at a specified OD (Figure 1b). However, the
experimental setup for such a system is complex, consumes relatively high amounts of media,
is prompt to faults in pumps or sensors, and its miniaturization and parallelization is challenging
[35]. Even though miniaturized turbidostats have been realized [36,37] the experimental setup
is still laborious and the parallelization does not reach the throughput of a 96-microwell plate.
Figure 1. Illustrated overview of possible cultivation modes for the preparation of competent cells. Values for initial biomass and µ were chosen randomly; red line: threshold for harvesting (Optical Density (OD) = 0.8). The used models could be seen in the appendix. (a) Batch cultivation; (b) chemostat cultivation; (c) quasi-turbidostat cultivation.
To ensure a constant quality of DNA transformation, we developed a new strategy for
optimal preparation of competent E. coli cells based on a CaCl2 treatment. Here, optimal
means that all cells are in the exponential growth phase, the OD is equal, and the desired
conditions are maintained up to the selected harvesting time. This new method is an
automated, high throughput quasi-turbidostat, developed for 96 well plates (Figure 1c).
Furthermore, as proof of concept, we compare the results obtained from manual and
automated transformation of different E. coli strains.

Accelerating biological screenings through the combination of high-throughput and modeling
Paper I - Automated Cell Treatment for Competence and Transformation of … 20
4.1.2 Materials and Methods
4.1.2.1 Experimental Platform
As experimental platform a Hamilton Mircolab Star (Hamilton Bonaduz AG, Bonaduz,
Switzerland) is used as described in [38]. Figure 2 gives an overview of the deck layout; the
method is archived in the Supplementary Materials (Source Code S1/ Source Code S2). A
freedom EVO 200 liquid handling platform from Tecan (Tecan, Männedorf, Switzerland, see
Figure S3) is placed back-to-back with the Hamilton platform. Both liquid handlers are
connected by a linear transfer unit, controlled by the Hamilton Venus ONE software.
Figure 2. Deck layout of the used Hamilton Microlab Star liquid handling station. In this platform a FAME incubator (Hamilton), a Shaker (inheco Industrial Heating and Cooling GmbH, Planegg, Germany), a vacuum station, two terminable racks (each for five SBS labware) and a Synergy MX II plate reader (BioTek, Bad Friedrichshall, Germany) are mounted. Red: used Labware/Hardware; Blue: provided liquid solutions.
All cultivations are carried out in U-shaped microtiter plates (Greiner Bio-One,
Frickenhausen, Germany), incubated at 37 °C and aerated by shaking at 1000 rpm at an
amplitude of 2 mm in a FAME incubator (Hamilton). TY medium (16 g/L tryptone; 10 g/L yeast
extract; 5 g/L NaCl) is used for all cultivations. The cellular growth is monitored by measuring
the OD at 600 nm, in 96 well plates as described earlier [38].
The platform is connected to the iLab-Bio database (infoteam Software AG, Bubenreuth,
Germany). All generated data and needed set points are stored in and read from this database
[39].
4.1.2.2 Strains, Cell Competence and Transformation
For the manual preparation of competent cells, E. coli TG1 (see Table 1 for all strains) was
cultivated in 10 ml of TY medium at 37 °C until an OD600 of approximately 0.8. Cells were
harvested from 200 µL culture by centrifugation, resuspended in 200 µL ice-cold CaCl2

Accelerating biological screenings through the combination of high-throughput and modeling
21 Paper I - Automated Cell Treatment for Competence and Transformation of …
solution (100 mM CaCl2, 50 mM Tris-HCl pH 7.5), and incubated on ice for 30 min. Finally, the
cell pellet was obtained by centrifugation and resuspended in 100 µL ice-cold CaCl2 solution
and left on ice for at least 2 h.
Table 1. List of used strains.
Strain Genotype Source
E. coli TG 1 K-12 supE hsd Δ5thi Δ[lac-proAB] F′ [traD36 proAB lacIq lacZ ΔM15]
[40]
E. coli TG 90 K-12 supE hsd Δ5thi Δ[lac-proAB] F′ [traD36 proAB lacIq lacZ ΔM15] pcnB80 zad::TnlO
[41]
E. coli BW25113
K-12 lacI+ rrnBT14 ΔlacZWJ16 hsdR514 ΔaraBADAH33 ΔrhaBADLD78 rph-1 Δ(araB–D)567 Δ(rhaD–B)568 ΔlacZ4787(::rrnB-3) hsdR514 rph-1
[42]
As no ice is available at the liquid handling platform, the competence protocol was adjusted
as follows: 4 °C cold solutions were used and all incubation steps were carried out at 4 °C.
Automated cell treatment is described in the results section (Section 3.2, Section 3.3 and
Section 3.4).
Manual transformation was carried out as follows: 20 µL competent cells were incubated
with 1 ng pUC19 [13] for 30 min, on ice or at 4 °C, respectively. Afterwards, cells were heat
shocked for 2 min at 42 °C, 180 µL TY added, shaken at 37 °C for one hour, spread on an
agar plate with 125 µg mL−1 ampicillin and incubated at 37 °C overnight. For the automated
transformation protocol see the results in Section 3.5.
For the determination of the optimal harvesting point for the preparation of competent cells,
the E. coli strain BW25113 was cultivated in 10 mL TY medium at 37 °C. After 0.5; 1; 1.5; 2;
2.5; 3; 4; 5; 6; and 16 h OD600 was measured and equal numbers of cells were harvested
(200 µL × 0.8 OD600). Competent cells were prepared as above. 50 µL of competent cells
were used for transformation with 1 ng pUC19 as described above.
4.1.2.3 Computational Methods
All computation steps were performed in MATLAB 2016a (Natick, MA, USA). Based on the
equation given by Enfors and Häggström 2010 [43] the growth rate is calculated by Equation
(1)
µ =𝑙𝑛 (
𝑋𝑘𝑋𝑘−1
)
𝑡𝑘 − 𝑡𝑘−1
(1)
where µ is representing the specific growth rate [h−1], X the biomass as OD600 and t the
time [h]. Based on Equation (1), the biomass for the next hour is estimated with
𝑋𝑘+1 = 𝑋𝑘 𝑒µ(𝑡𝑘+1−𝑡𝑘) (2)

Accelerating biological screenings through the combination of high-throughput and modeling
Paper I - Automated Cell Treatment for Competence and Transformation of … 22
The biomass (𝑋𝑘) at tk to reach the desired biomass at tk+1 (XThreshold) is calculated with
Equation (3).
𝑋𝑘 =𝑋𝑡ℎ𝑟𝑒𝑠ℎ𝑜𝑙𝑑
𝑒µ(𝑡𝑘+1−𝑡𝑘) (3)
The dilution factor is calculated with Xk from Equation (3) divided by the actual measured
biomass.
4.1.3 Results
The aim of this study is the development of a protocol on the liquid handling platform, to
generate competent cells, and transform them directly with one or more plasmids. One of the
main problems when transforming different strains with unknown growth characteristics in
parallel is the correct harvesting point for all clones. Additionally, this point must be reached at
the same time by all cultures to allow running subsequent procedures in parallel.
We compare the quasi-turbidostat method against the traditional batch cultivation to reach
the optimal harvesting point. Due to the complexity and fault promptness of integrated high
throughput robots, the focus is set on robustness (maximizing the production of competent
cells for sufficient transformation). For the development of our method, we used E. coli as a
case study.
4.1.3.1 Determination of the Optimal Harvest Conditions
The use of highly competent cells facilitates transformation. Due to their high transformation
efficiency, low plasmid DNA concentrations or ligation mixtures result in a high number of
CFUs. The optimal harvest point for preparation of competent E. coli cells is assumed to be
from the early to mid-exponential growth phase [44]; probably the best competence is obtained
with cells growing at their maximum specific growth rate. This can also be seen by the number
of colonies obtained after transformation of E. coli BW25113 harvested at different growth
phases in a typical batch shake flask experiment (Figure 3a). As expected, mid log phase
cultures with an OD600 between 0.7 and 1.4 proved to be optimal. In contrast, cells from the
early or late exponential phase (OD600 0.3 and 2.7) resulted in slightly less colonies and cells
from either the lag phase or the stationary phase resulted in significantly less colonies.
Interestingly, at the same time the number of satellite colonies resulting from not transformed
cells growing in the vicinity of real transformants increased over the growth curve (Figure 3b).

Accelerating biological screenings through the combination of high-throughput and modeling
23 Paper I - Automated Cell Treatment for Competence and Transformation of …
Figure 3. E. coli BW25113 was grown in TY medium, equal numbers of cells were harvested at different time points, competent cells were prepared and transformed with 1 ng pUC19 as described in materials and methods. (a) Black line: growth curve; dotted line: growth rate [h−1]; grey bars: number of transformants. Resulting colonies were counted after overnight incubation at 37 °C. A correlation between transformation efficiency and growth rate can be detected (b) grey bars: number of transformants; black bars: number of satellite colonies. Comparison of transformants and satellite colonies obtained after transformation of competent cells as in (a). A lower number of satellite colonies indicates higher quality of the competent cells.
In other words, by creating a system where cells are maintained at maximum growth rate
until the harvesting point has been reached, we obtain a highly effective transformation system
that is also flexible to cope with the needs of other units, personnel, or sudden faults in the
system. As shown in materials and methods, the setpoint for biomass concentration was set
to 0.8 to assure no oxygen limitation minimized the cultivation time but also to assure that the
cell density was high enough to compensate for low transformation efficiencies. Nevertheless,
high transformation efficiencies are not necessary for most applications as for all further steps
a few positive transformants are sufficient.
4.1.3.2 Competent Cells with Batch Cultivation
First, batch cultivations with an adapted sampling were performed. To solve the problem of
different lag-phases and stating ODs, precultures were performed for 8 h. Afterwards, the
OD600 was measured and a new cultivation with fresh medium was prepared. From the
precultures, 10 µL were taken by the robot as inoculum for the new main cultivation plate. In
this second plate OD600 was monitored every hour. If the mean of all cultivations reaches a
threshold of 0.4, the monitoring interval was shortened to 30 min. After the mean of all
performed cultivations reached a threshold of 0.7, the cells were harvested.
Examples for measured OD600 values are shown in Figure 4. The OD600 after the
precultures were 2.50, 2.48, and 3.36 for the E. coli strains TG1, TG90, and BW25113,
respectively. For the main cultivation, 10 µL of each culture were taken. This corresponds to a

Accelerating biological screenings through the combination of high-throughput and modeling
Paper I - Automated Cell Treatment for Competence and Transformation of … 24
1:20 dilution. After the second measurement, during the main cultivation, the mean OD of all
cultures was 0.37 and therefore below the threshold for adapting the sampling mode. Hence,
the next sample was taken one hour later. However, the E. coli TG1 and TG 90 were already
over the threshold of 0.4. For these two strains the sampling point one hour later was already
suboptimal. At the third measurement, the E. coli strains TG 1 and TG 90 were—with 1.11 and
1.02—out of the optimal range for harvesting, only the E. coli BW25113 strain was at the
intended point with a mean of 0.82. Since only one of the strains reached an optimal threshold
of 0.8 with the batch cultivation method, the adaptation of the experiment to the strains’ growth
conditions must have been insufficient. Obviously, the chosen thresholds were not optimal,
leading to a suboptimal harvest time. Additionally, this method requires continuous re-tuning,
making it time intensive and not proper for a high-throughput system.
Figure 4. Batch cultivation approach for harvesting of competent cells with Preculture (0–8 h) and a main cultivation (8–10 h). Lower dotted red line: threshold of sampling interval adaptation; upper red line threshold for harvesting. The square of E. coli TG 90 is mostly hidden under the circle of E. coli TG 1.
4.1.3.3 Competent Cells in the Quasi-Turbidostat
As mentioned before, the ideal solution to this issue would be a parallel turbidostat system.
Therefore, we developed a quasi-turbidostat on a 96-well plate using the liquid handling
platform. For the quasi-turbidostat, no preculture is needed. The cultivation is operated in a
loop with one-hour cycles containing the following steps (I) sampling, (II) OD600 measurement,
and (III) dilution (Figure 5).

Accelerating biological screenings through the combination of high-throughput and modeling
25 Paper I - Automated Cell Treatment for Competence and Transformation of …
Figure 5. Robotic platform and workflow used for the quasi-turbidostat cultivation for the preparation of competent cells. The incubator is mounted on the left site of the liquid handling station, the plate reader is mounted on the right site. During the quasi-turbidostat cycle, the cells are transferred from the incubator to the liquid handler, a sample is taken, diluted, and measured in the plate reader. Afterwards, the OD600 values are transferred into the database and the execution of the script is triggered. The script calculates the current dilution of the quasi-turbidostat cultivations and sends the set points back to the database. Subsequently, the liquid handler reads the set points for the database and executes the dilution step. The cells are incubated for one hour until the next cycle is started.
The first 20 µL sample is taken directly after inoculation, 1:5 diluted, OD600 is measured,
and the measured values are transferred into the database. Afterwards, the execution of a
MATLAB (Mathworks) script is triggered (Source Code S4). During the execution of the script,
the program reads the OD600 values from the database and the required biomass to reach
the targeted OD600 in one hour is calculated based on Equation (3). Depending on the
calculated OD600 values (X0), volumes for removing cell suspension and adding fresh
medium are sent as setpoints to the database. These setpoints are read out and used by the
pipetting robot to perform the dilution step. If no dilution is necessary, only the sampling volume
is added to assure a constant cultivation volume of 170 µL over the whole cultivation.
In Figure 6, exemplary the OD600 measurements of E. coli TG1, TG 90, and BW25113
cultures are shown. After the second measurement, the first dilution was calculated. The
growth rates at this time were 1.37, 1.28, and 1.32 h−1 with OD600 values of 0.30, 0.28 and
0.44, respectively. Assuming a constant growth rate, one hour later the OD600 was estimated
to be 1.17, 0.99, and 1.65 h−1, respectively, by applying Equation (2). Therefore, from the
beginning, a dilution for all strains was needed. At the third measurement, the OD600 of E. coli
BW15113 was 0.76 and thus very close to the threshold. On the contrary, the growth rates of
E. coli TG 1 and TG 90 were lower than assumed, as the OD600 values of these strains were
only 0.68 and 0.56, respectively, and thus clearly below the targeted OD600 value. The same
behavior is observed at the fourth sampling point after three hours. However, the distances to

Accelerating biological screenings through the combination of high-throughput and modeling
Paper I - Automated Cell Treatment for Competence and Transformation of … 26
the target value were lower. The observed OD600 values were 0.74 and 0.73 for E. coli TG 1
and TG 90, respectively. The E. coli BW25513 strain was, with an OD600 of 0.82, again the
best matching strain. During samplings four and five (hours three to four) all growth rates
stayed constant compared to the former interval. The OD values at the last sampling point
were 0.80, 0.79, and 0.78 for E. coli TG 1, E. coli TG 90, and E. coli BW25113, respectively.
This was a very low deviation from the threshold for all strains and the signal to continue with
the cell treatment was given.
Figure 6. Quasi-turbidostat approach for harvesting of competent cells in a defined physiological state. Biomass is measured every hour. Depending on µ and biomass a dilution of the culture is performed.
4.1.3.4 Cell Treatment for Competence
For automated cell harvest the cultivation plate was transferred to a position of the 4 °C
rack on the liquid handler (Figure 2) to cool down the cells. The whole available culture volume
was taken and transferred to a 0.2 µm 96 well filter plate. This filter plate was placed on a
vacuum station, integrated on the liquid handler (Figure 2). Over a time of 60 sec, a vacuum
of 300 mbar was created to remove the medium from the cells. Afterwards, the cells were
resuspended with cold CaCl2. This step was repeated three times before transferring the cells
into a 96 well PCR plate to enhance the temperature transfer.
3.5. Transformation
After the incubation time of two hours at 4 °C, plasmid DNA was dispensed into the
incubated cell suspension. The cells were further incubated for 30 min at 4 °C, and
subsequently a heat shock at 42 °C for 2 min was performed by moving the PCR plate from
the 4 °C rack to the 42 °C rack. And afterwards back to the position on the 4 °C rack. While
keeping the cells cooled, a new U-shaped plate with fresh medium was prepared and the whole

Accelerating biological screenings through the combination of high-throughput and modeling
27 Paper I - Automated Cell Treatment for Competence and Transformation of …
batches from the PCR plate were transferred into this medium. The U-shaped plate was then
cultivated for one hour. Finally, 200 µL of each culture were dispensed on TY agar, which was
prepared in 6 well plates. These agar plates were shaken to spread the liquids even over the
whole area of the wells. Afterwards, the agar plates were transferred into an incubator and
cultivated for at least 12 h at 37 °C.
On all plated wells, the number of observed colonies was high enough for colony picking.
In Figure 7, the wells of (a) a manual transformation on ice and (b) with 4° C treatment, (c) the
automated treatment with the batch cultivation, and (d) the treatment with the quasi-turbidostat
method is shown to be exemplary for the E. coli BW25113 strain.
Figure 7. Spread cells after treatment for competence and transformation in 6-well plates (a) manually on ice; (b) manually at 4 °C instead keeping cell on ice; (c) automated treatment with a batch for cell harvesting; (d) automated treatment with quasi-turbidostat for cell harvesting.

Accelerating biological screenings through the combination of high-throughput and modeling
Paper I - Automated Cell Treatment for Competence and Transformation of … 28
No significant differences were observed by comparing the manual cell treatment on ice
with the storage at 4 °C. Both methods lead to 30–50 transformed cells per well and thus we
conclude that the use of 4 °C instead of keeping the cells on ice has no negative influence on
the transformation efficiency. Moreover, the results show that with the applied shaking protocol
the cells are equally spread over the area of the well without the use of a spatula, indicating
that shaking the plates only in a one-dimensional movement is sufficient for spreading.
Differences between the automated and manual treatments (comparison of Figure 7b with
Figure 7c or Figure 7d) are mainly caused by the different volumes used for plating. Both
methods on the liquid handling platform are suitable for the treatment of competent cells and
the transformation. Accordingly, as the results of both automated approaches show, there are
enough colonies for colony picking. Apart from this, there were no significant differences
observed for the E. coli BW15113 between the batch treatment and the quasi-turbidostat
method. However, the quasi-turbidostat provides a way to guarantee that clones with different
specific growth rates are harvested in the growing state at similar cell densities.
4.1.4 Discussion
The development of an automated method to obtain competent cells when whole strain
libraries need to be transformed is a decisive step towards fully automated screening
processes. This closes the gap between existing strain and vector libraries and high-
throughput screening processes. To our knowledge, this is the first description of a turbidostat
implementation in a 96 well plate and therefore, also an important step for the development of
advanced screenings and phenotyping applications. The system was tested in an automated
robotic facility, so it can be directly included in a broader process development framework
reaching up to scale-down experiments at mL scale [45,46]. In order to increase a liquid
handling facility towards an automated bioprocess development platform by [47,48], this
method can be further connected to automated image analysis, colony counting, and clone
picking.
For the development of this method we compared two different strategies for cell harvesting,
a classical batch approach and a novel quasi-turbidostat approach. With the latter one we were
able to harvest strains with different growth characteristics at the best harvesting point (i.e.,
cell density and growth stage), independent from the source of the strains; e.g., an agar plate,
cryo-stock or another liquid culture.
The batch approach is simple to implement, but due to the different growth characteristics
of the hosts, changing harvesting points, sensitivity to faults in the system as well as initial
concentrations, and low time flexibility it is not suitable for use in a high throughput.

Accelerating biological screenings through the combination of high-throughput and modeling
29 Paper I - Automated Cell Treatment for Competence and Transformation of …
The use of the quasi-turbidostat provides some important advantages compared to the
batch method. The sampling point for all strains was reached perfectly after four hours. The
only adjustable parameter is the cycle time, which can automatically be adjusted to each well
for a wide coverage of fast and slow growing cells. In the case study, the cycle time was one
hour, therefore a minimal growth rate of 0.1 h−1 is needed, but an automated adjustment of
the cycle time, to cover also slower and faster growing cells is straight forward.
However, the samples had to be diluted already after the first analytical cycle. Therefore,
we expected to reach the threshold for all strains directly after the first cycle. As shown above
(Figure 2b), this was not the case. Our method requires a constant growth rate to get optimal
results. During the first two cycles, until hour three, we saw a decrease in the growth rate of
the E. coli strains TG1 and TG90 mainly caused by inaccuracies of the OD measurement at
low values. Our method calculated the dilutions with an unprecise µ and therefore reached
suboptimal results. Whether the decrease in the growth rate is caused by measurement errors
or by a physiological background could be in the focus of further investigations. It is known that
acetic acid has a negative influence on the glucose uptake rate at high levels and therefore is
known to reduce the maximum specific growth rate [45,49]. Hence, the acetic acid
concentration is also diluted in every cycle and should not reach a critical concentration. It has
been reported that the maximum glucose uptake rate decreases significantly over the time in
glucose limited fed-batch cultivation with a constant feed profile: i.e., at lower specific growth
rates [50,51].
To ensure a sufficient transformation efficiency especially when using low plasmid
concentrations or ligation mixtures, it is important to harvest all cells during the optimal growth
phase. The benefit of the quasi-turbidostat compared to the batch method is that the former
ensures this because it keeps strains with different growth rates in the logarithmic growth
phase until all cells reach the optimal harvesting point for the preparation of competent cells
and their subsequent transformation.
To maximize our throughput and keeping the system as simple as possible, we used 96
well plates for cultivation and cell treatment. The use of enhanced high throughput cultivation
systems like minibioreactor systems (MBRs) [52] could be alternatively considered if higher
titers are required, and applications based on the online biomass signal have already been
reported [33]. Nevertheless, this would increase the complexity of the system. Apart from that,
our developed quasi-turbidostat method could be adapted to MBR with online biomass
monitoring. Other systems that are very well suited for the quasi-turbidostat method are:
BioLector [53], m2p, HEL minireactors, etc.
In addition, the development of a high-throughput method protocol for competent cell
treatment and transformation, also describes a method that does neither need ice nor
centrifugation. In contrast to the manual preparation of competent cells where centrifugation is

Accelerating biological screenings through the combination of high-throughput and modeling
Paper I - Automated Cell Treatment for Competence and Transformation of … 30
used for harvesting and washing steps, no centrifuge is needed for the automated protocol.
Also, filtration has several advantages compared to centrifugation; (1) washing steps are more
accurate as the media can be removed thoroughly without touching the cell pellet; (2) a vacuum
station can be easier integrated in a liquid handling station as it needs less space and no
hardware modifications and thus (3) investment costs are significantly lower.
The protocol is also very useful for laboratories with limited equipment or for a parallel
treatment of cells manually.
4.1.5 Conclusions
The developed method is able to treat E. coli cells for competence and transform them with
a certain vector and could be adapted to other strains with a similar protocol.
As show in Figure 4, the results are good enough to transfer the cells for further colony
picking. Our automated method ended with the incubation of the spread agar plates. The
created strain library is the basis of further automated screening and strain engineering
methods [46,54]. Furthermore, the method could be adapted to other organisms.
Supplementary Materials
The following are available online at https://www.mdpi.com/2076-2607/6/3/60/s1, Source
Code S1: Hamilton Script Overview, Source Code S2: Hamilton Script detail, Figure S3: Tecan
LHS, Source Code S4: MATLAB Source Code.
Funding
This research was funded by German Federal Ministry of Education and Research (BMBF)
grant number 031L0018A.
Acknowledgments
The authors acknowledge financial support by the German Federal Ministry of Education
and Research (BMBF) within the European program EraSysApp (project no. 031L0018A,
LEANPROT project) managed by the Projektträger Jülich (PtJ). We would like to thank Robert
Giessmann for fruitful discussions during the development of the quasi-turbidostat method.
Conflicts of Interest
The authors declare no conflict of interest.
4.1.6 References
1. Neubauer, P.; Cruz, N.; Glauche, F.; Junne, S.; Knepper, A.; Raven, M. Consistent
development of bioprocesses from microliter cultures to the industrial scale. Eng. Life
Sci. 2013, 13, 224–238.

Accelerating biological screenings through the combination of high-throughput and modeling
31 Paper I - Automated Cell Treatment for Competence and Transformation of …
2. Berlec, A.; Štrukelj, B. Current state and recent advances in biopharmaceutical
production in Escherichia coli, yeasts and mammalian cells. J. Ind. Microbiol.
Biotechnol. 2013, 40, 257–274.
3. Schmidt, F.R. Optimization and scale up of industrial fermentation processes. Appl.
Microbiol. Biotechnol. 2005, 68, 425–435.
4. Sun, J.; Wang, Q.; Jiang, Y.; Wen, Z.; Yang, L.; Wu, J.; Yang, S. Genome editing and
transcriptional repression in Pseudomonas putida KT2440 via the type II CRISPR
system. Microb. Cell Fact. 2018, 17, 41.
5. Maeda, T.; Sanchez-Torres, V.; Wood, T.K. Metabolic engineering to enhance bacterial
hydrogen production. Microb. Biotechnol. 2008, 1, 30–39.
6. Sagt, C.M.J. Systems metabolic engineering in an industrial setting. Appl. Microbiol.
Biotechnol. 2013, 97, 2319–2326.
7. Kim, S.-J.; Kim, J.-W.; Lee, Y.-G.; Park, Y.-C.; Seo, J.-H. Metabolic engineering of
Saccharomyces cerevisiae for 2,3-butanediol production. Appl. Microbiol. Biotechnol.
2017, 101, 2241–2250.
8. Erb, T.J.; Jones, P.R.; Bar-Even, A. Synthetic metabolism: Metabolic engineering
meets enzyme design. Curr. Opin. Chem. Biol. 2017, 37, 56–62.
9. Stefanovic, E.; Fitzgerald, G.; McAuliffe, O. Advances in the genomics and
metabolomics of dairy lactobacilli: A review. Food Microbiol. 2017, 61, 33–49.
10. Kruyer, N.S.; Peralta-Yahya, P. Metabolic engineering strategies to bio-adipic acid
production. Curr. Opin. Biotechnol. 2017, 45, 136–143.
11. Wang, R.F.; Kushner, S.R. Construction of versatile low-copy-number vectors for
cloning, sequencing and gene expression in Escherichia coli. Gene 1991, 100, 195–
199.
12. Bolivar, F.; Rodriguez, R.L.; Greene, P.J.; Betlach, M.C.; Heyneker, H.L.; Boyer, H.W.;
Crosa, J.H.; Falkow, S. Construction and characterization of new cloning vehicle. II. A
multipurpose cloning system. Gene 1977, 2, 95–113.
13. Yanisch-Perron, C.; Vieira, J.; Messing, J. Improved Ml3 phage cloning vectors and
host strains: Nucleotide sequences of the M13mp18 and pUC19 vectors. Gene 1985,
33, 103–119.
14. Studier, F.W.; Moffatt, B.A. Use of bacteriophage T7 RNA polymerase to direct
selective high-level expression of cloned genes. J. Mol. Biol. 1986, 189, 113–130.
15. Gronenborn, B. Overproduction of phage lambda repressor under control of the lac
promotor of Escherichia coli. Mol. Gen. Genet. 1976, 148, 243–250.
16. Guzman, L.-M.; Belin, D.; Carson, M.J.; Beckwith, J. Tight Regulation, Modulation, and
High-Level Expression by Vectors Containing the Arabinose P BAD Promoter. J.
Bacteriol. 1995, 177, 4121–4130.

Accelerating biological screenings through the combination of high-throughput and modeling
Paper I - Automated Cell Treatment for Competence and Transformation of … 32
17. Gawin, A.; Valla, S.; Brautaset, T. The XylS/Pm regulator/promoter system and its use
in fundamental studies of bacterial gene expression, recombinant protein production
and metabolic engineering. Microb. Biotechnol. 2017, 10, 702–718.
18. Baba, T.; Ara, T.; Hasegawa, M.; Takai, Y.; Okumura, Y.; Baba, M.; Datsenko, K.A.;
Tomita, M.; Wanner, B.L.; Mori, H. Construction of Escherichia coli K-12 in-frame,
single-gene knockout mutants: The Keio collection. Mol. Syst. Biol. 2006, 2, 2006.0008.
19. Yamamoto, N.; Nakahigashi, K.; Nakamichi, T.; Yoshino, M.; Takai, Y.; Touda, Y.;
Furubayashi, A.; Kinjyo, S.; Dose, H.; Hasegawa, M.; et al. Update on the Keio
collection of Escherichia coli single-gene deletion mutants. Mol. Syst. Biol. 2009, 5,
335.
20. Kobayashi, K.; Ehrlich, S.D.; Albertini, A.; Amati, G.; Andersen, K.K.; Arnaud, M.; Asai,
K.; Ashikaga, S.; Aymerich, S.; Bessieres, P.; et al. Essential Bacillus subtilis genes.
Proc. Natl. Acad. Sci. USA 2003, 100, 4678–4683.
21. Jacobs, M.A.; Alwood, A.; Thaipisuttikul, I.; Spencer, D.; Haugen, E.; Ernst, S.; Will, O.;
Kaul, R.; Raymond, C.; Levy, R.; et al. Comprehensive transposon mutant library of
Pseudomonas aeruginosa. Proc. Natl. Acad. Sci. USA 2003, 100, 14339–14344.
22. De Berardinis, V.; Vallenet, D.; Castelli, V.; Besnard, M.; Pinet, A.; Cruaud, C.; Samair,
S.; Lechaplais, C.; Gyapay, G.; Richez, C.; et al. A complete collection of single-gene
deletion mutants of Acinetobacter baylyi ADP1. Mol. Syst. Biol. 2008, 4, 174.
23. Giaever, G.; Nislow, C. The yeast deletion collection: A decade of functional genomics.
Genetics 2014, 197, 451–465.
24. Cox, R.S.; Dunlop, M.J.; Elowitz, M.B. A synthetic three-color scaffold for monitoring
genetic regulation and noise. J. Biol. Eng. 2010, 4, 10.
25. Singh, M.; Yadav, A.; Ma, X.; Amoah, E. Plasmid DNA Transformation in Escherichia
Coli: Effect of Heat Shock Temperature, Duration, and Cold Incubation of CaCl 2
Treated Cells. Shock 2010, 6, 561–568.
26. Mandel, M.; Higa, A. Calcium-dependent bacteriophage DNA infection. J. Mol. Biol.
1970, 53, 159–162.
27. Hanahan, D.; Jessee, J.; Bloom, F.R. bacteria. In Bacterial Genetic Systems; Methods
in Enzymology; Academic Press: Cambridge, MA, USA, 1991; Volume 204, pp. 63–
113.
28. Cohen, S.N.; Chang, A.C.Y.; Hsu, L. Nonchromosomal Antibiotic Resistance in
Bacteria: Genetic Transformation of Escherichia coli by R-Factor DNA. Proc. Natl.
Acad. Sci. USA 1972, 69, 2110–2114.
29. Forster, R.L.S.; Bevan, M.W.; Harbison, S.; Gardnerl, R.C. High efficiency
transformation of E.coli by high voltage electroporation. Nucleic Acids Res. 1988, 16,
291–303.
30. Taketo, A. DNA transfection of Escherichia coil by electroporation. Biochim. Biophys.
Acta (BBA)-Gene Struct. Expr. 1988, 949, 318–324.

Accelerating biological screenings through the combination of high-throughput and modeling
33 Paper I - Automated Cell Treatment for Competence and Transformation of …
31. Hughes, S.R.; Dowd, P.F.; Hector, R.E.; Riedmuller, S.B.; Bartolett, S.; Mertens, J.A.;
Qureshi, N.; Liu, S.; Bischoff, K.M.; Li, X.-L.; et al. Cost-Effective High-Throughput Fully
Automated Construction of a Multiplex Library of Mutagenized Open Reading Frames
for an Insecticidal Peptide Using a Plasmid-Based Functional Proteomic Robotic
Workcell with Improved Vacuum System. JALA J. Assoc. Lab. Autom. 2007, 12, 202–
212.
32. Finley, J.B.; Qiu, S.H.; Luan, C.H.; Luo, M. Structural genomics for Caenorhabditis
elegans: High throughput protein expression analysis. Protein Expr. Purif. 2004, 34,
49–55.
33. Rohe, P.; Venkanna, D.; Kleine, B.; Freudl, R.; Oldiges, M. An automated workflow for
enhancing microbial bioprocess optimization on a novel microbioreactor platform.
Microb. Cell Fact. 2012, 11, 144. [Green Version]
34. Neubauer, P.; Cruz-Bournazou, M.N. Continuous Bioprocess Development: Methods
for Control and Characterization of the Biological System. In Continuous
Biomanufacturing: Innovative Technologies and Methods; John Wiley & Sons:
Hoboken, NJ, USA, 2017.
35. Schmideder, A.; Severin, T.S.; Cremer, J.H.; Weuster-Botz, D. A novel milliliter-scale
chemostat system for parallel cultivation of microorganisms in stirred-tank bioreactors.
J. Biotechnol. 2015, 210, 19–24.
36. Hoffmann, S.A.; Wohltat, C.; Mu, K.M.; Arndt, K.M. A user-friendly, low-cost turbidostat
with versatile growth rate estimation based on an extended Kalman filter. PLoS ONE
2017, 12, e0181923.
37. Takahashi, C.N.; Miller, A.W.; Ekness, F.; Dunham, M.J.; Klavins, E. A low cost,
customizable turbidostat for use in synthetic circuit characterization. ACS Synth. Biol.
2015, 4, 32–38.
38. Knepper, A.; Heiser, M.; Glauche, F.; Neubauer, P. Robotic Platform for Parallelized
Cultivation and Monitoring of Microbial Growth Parameters in Microwell Plates. J. Lab.
Autom. 2014, 19, 593–601. [Green Version]
39. Schmid, I.; Aschoff, J. A scalable software framework for data integration in bioprocess
development. Eng. Life Sci. 2017, 17, 1159–1165.
40. Baer, R.; Bankier, A.T.; Biggin, M.D.; Deininger, P.L.; Farrell, P.J.; Gibson, T.J.; Hatfull,
G.; Hudson, G.S.; Satchwell, S.C.; Seguin, C.; et al. DNA sequence and expression of
the B98-8 Epstein-Barr virus genome. Nature 1984, 310, 207–211.
41. Gonzy-Tréboul, G.; Karmazyn-Campelli, C.; Stragier, P. Developmental regulation of
transcription of the Bacillus subtilis ftsAZ operon. J. Mol. Biol. 1992, 224, 967–979.
42. Datsenko, K.A.; Wanner, B.L. One-step inactivation of chromosomal genes in
Escherichia coli K-12 using PCR products. Proc. Natl. Acad. Sci. USA 2000, 97, 6640–
6645.

Accelerating biological screenings through the combination of high-throughput and modeling
Paper I - Automated Cell Treatment for Competence and Transformation of … 34
43. Enfors, S.-O.; Häggström, L. Bioprocess Technology: Fundamentals and Applications;
Royal Institute of Technology: Stockholm, Sweden, 2000; ISBN 91-7170-511-2.
44. Szostková, M.; Horáková, D.; Němec, M. The influence of the growth phase of enteric
bacteria on electrotransformation with plasmid DNA. Folia Microbiol. 1999, 44, 177–
180.
45. Anane, E.; Lopez Cárdenas, D.C.; Neubauer, P.; Cruz Bournazou, M.N. Modelling
overflow metabolism in Escherichia coli by acetate cycling. Biochem. Eng. J. 2017, 125,
23–30.
46. Cruz Bournazou, M.N.; Barz, T.; Nickel, D.B.; Lopez Cárdenas, D.C.; Glauche, F.;
Knepper, A.; Neubauer, P. Online optimal experimental re-design in robotic parallel fed-
batch cultivation facilities. Biotechnol. Bioeng. 2017, 114, 610–619.
47. Neubauer, P. Editorial: Towards faster bioprocess development. Biotechnol. J. 2011,
6, 902–903
48. Neubauer, P.; Glauche, F.; Cruz-Bournazou, M.N. Editorial: Bioprocess Development
in the era of digitalization. Eng. Life Sci. 2017, 17, 1140–1141.
49. Kleman, G.L.; Strohl, W.R. Acetate metabolism by Escherichia coli in high-cell-density
fermentation. Appl. Environ. Microbiol. 1994, 60, 3952–3958.
50. Lin, H.Y.; Mathiszik, B.; Xu, B.; Enfors, S.O.; Neubauer, P. Determination of the
maximum specific uptake capacities for glucose and oxygen in glucose-limited fed-
batch cultivations of Escherichia coli. Biotechnol. Bioeng. 2001, 73, 347–357.
51. Brand, E.; Junne, S.; Anane, E.; Nicolas, M.; Bournazou, C.; Neubauer, P. Importance
of the cultivation history for the response of Escherichia coli to oscillations in scale-
down experiments. Bioprocess Biosyst. Eng. 2018, 1–9.
52. Hemmerich, J.; Noack, S.; Wiechert, W.; Oldiges, M. Microbioreactor Systems for
Accelerated Bioprocess Development. Biotechnol. J. 2018, 13, 1–25.
53. Kensy, F.; Zang, E.; Faulhammer, C.; Tan, R.; Büchs, J. Validation of a high-throughput
fermentation system based on online monitoring of biomass and fluorescence in
continuously shaken microtiter plates. Microb. Cell Fact. 2009, 8, 31.
54. Glauche, F.; Pilarek, M.; Bournazou, M.N.C.; Grunzel, P.; Neubauer, P. Design of
experiments-based high-throughput strategy for development and optimization of
efficient cell disruption protocols. Eng. Life Sci. 2017, 17, 1166–1172.

Accelerating biological screenings through the combination of high-throughput and modeling
35 Paper II - Integrated Robotic Mini Bioreactor Platform for Automated, Parallel …
4.2 Integrated Robotic Mini Bioreactor Platform for Automated, Parallel Microbial Cultivation With Online Data Handling and Process Control
SLAS TECHNOLOGY: Translating Life Sciences Innovation. 2019;24(6):569-582. DOI: 10.1177/2472630319860775, Accepted: Jun 9, 2019. / Published July 9, 2019, accepted manuscript Copyright © 2019 Society for Laboratory Automation and Screening
Benjamin Haby1*, Sebastian Hans1*, Emmanuel Anane1, Annina Sawatzki1, Niels Krausch1, Peter Neubauer1, Mariano Nicolas Cruz Bournazou1+
1Chair of Bioprocess Engineering, Institute of Biotechnology, Technische Universität Berlin, Germany + Dr.-Ing. Mariano Nicolas Cruz Bournazou ([email protected]) *These authors contributed equally to this work.
Abstract During process development, the experimental search space is defined by the
number of experiments that can be performed in specific time frames but also by its
sophistication (e.g., inputs, sensors, sampling frequency, analytics). High-throughput liquid-
handling stations can perform a large number of automated experiments in parallel.
Nevertheless, the experimental data sets that are obtained are not always relevant for
development of industrial bioprocesses, leading to a high rate of failure during scale-up. We
present an automated mini bioreactor platform that enables parallel cultivations in the milliliter
scale with online monitoring and control, well-controlled conditions, and advanced feeding
strategies similar to industrial processes. The combination of two liquid handlers allows both
automated mini bioreactor operation and at-line analysis in parallel. A central database
enables end-to-end data exchange and fully integrated device and process control. A model-
based operation algorithm allows for the accurate performance of complex cultivations for
scale-down studies and strain characterization via optimal experimental redesign, significantly
increasing the reliability and transferability of data throughout process development. The
platform meets the tradeoff between experimental throughput and process control and
monitoring comparable to laboratory-scale bioreactors.
Own Contributions Conceptualization, Methodology, Validation, Formal Analysis, Investigation,
Resources, Data Curation, Writing-Original Draft and Visualization
Author Contributions: Conceptualization, SH, BH and MNC-B; Methodology, SH and BH; Validation,
SH and BH; Formal Analysis, SH; Investigation, SH, BH and AS; Resources, SH, B-H AS and NK; Data
Curation, SH and BH; Writing-Original Draft Preparation, BH and SH; Writing-Review & Editing, NK, AS,
PN, and MNC-B; Visualization, SH and BH; Supervision, MNC-B and PN; Project Administration, MNC-B
and PN Funding: PN

Accelerating biological screenings through the combination of high-throughput and modeling
Paper II - Integrated Robotic Mini Bioreactor Platform for Automated, Parallel …
36
Abbreviations
DOT, Dissolved Oxygen Tension MWP, Micro Well Plate
HT, High-Throughput OD600, Optical Density;
LHS, Liquid Handling Station SiLA, Standardization in Lab Automation
MBR, Mini-BioReactor
4.2.1 Introduction
High Throughput Screening (HTS) facilities have evolved to perform thousands of
experiments in parallel generating experimental data at incredible speed. These Liquid
Handling Stations (LHS) have accelerated drug discovery, sequencing, protein design, and
analytics among others. Unfortunately, typical screening procedures do not provide sufficient
information to assess cell performance at industrial process conditions [1]. The big difference
in environments during cultivation in Micro Well Plates (MWPs) and biomanufacturing in large
fed-batch reactors is an important factor for failure in bioprocess development [2]. It is essential
that strain and process engineering are done considering industrial conditions, since cultivation
regimes have a significant effect on the metabolism of the producer strain [3]. Hence keeping
conditions comparable to the production scale while going through the development stages
(from µL to L systems) decreases the risk of failure during scale-up [4].
In contrast, early process development is currently mainly focused on miniaturization and
throughput maximization sacrificing monitoring and control of the cultivations [5]. By this,
development often follows a trial and error strategy based on batch experiments with end-point
evaluations [6,7]. Today MWPs are the preferred vessels for small scale microbial cultivation
[8] and its application for screening has become standard practice in industry [9]. Using MWPs
as cultivation systems has several drawbacks, as are unknown conditions inside the wells (by
the lack of sensors) and a limited sampling capacity, due to the small volumes (mostly one
sample). Such experiments are hardly comparable to industrial processes, since monitoring
and active controls (e.g. pH) [10] as well as typical perturbations at industrial scale (e.g. reactor
heterogeneities) [11] are missing. Furthermore, cultivations in batch are known to lead to
different outcomes in the screening phase compared to typical fed-batch in biomanufacturing.
There are different automated approaches, which are tackling HT screenings in MWPs for
early process development. Some examples are: the automated enzyme characterization of
mutant libraries, with cell growth and protein production in MWPs [12]; the integration of the
BioLector® (m2p-labs, Baesweilter, Germany), for up to 48 parallel cultivations in a modified
MWP with feeding, online monitoring, event triggers [13], and analysis after cultivation [14]; the
BioLector® Pro with feeding and pH control via microfluidic addition of fluids for each cultivation

Accelerating biological screenings through the combination of high-throughput and modeling
37 Paper II - Integrated Robotic Mini Bioreactor Platform for Automated, Parallel …
well in up to 32 parallel cultivations [15]; and parallel laboratory evolution in MWPs at different
stress conditions [16].
Still, the experimental conditions in MWPs are far from emulating substrate, pH or
temperature heterogeneities present in large bioreactors. The response of the cells to these
environmental stresses has been shown to have a significant impact on the substrate uptake
and the intracellular fluxes [17,18]. Moreover cell-to-cell heterogeneity is increased having also
a severe impact on productivity [19]. For a robust scale-up the physiological conditions inside
the cell and the space-time dynamics of the environmental parameters have to be investigated
[20]. Therefore, it is necessary to have dynamic experiments and high frequency data to
understand the behavior of a biological process [21].
Fed-batch processes require monitoring and control, which are difficult to implement as ultra
HT, as performed in molecular target screenings [22] or droplet single-cell [23-25], On the other
hand, liter-scale bioreactors consume high material volumes and require manual intervention
hampering parallelization in large numbers. Miniaturized stirred-tank bioreactors offer a good
tradeoff between the experimental throughput and quality of the generated process data.
Examples are the ambr® 15 system (Sartorius AG, Göttingen, Germany), the bioREACTOR
48 or 8 systems and the explore HEL system [26,27]. Via the combination with automated
liquid-handling systems, the throughput and parallelization of microbial cultivations in small -
scale stirred tank systems is increased [28].
There is also work on automation of experimental facilities towards “smart” platforms. One
way of achieving this is the sequential design method, by which experimental data is processed
by algorithms to design the following experimental round [29,30]. Unfortunately, these
technologies are still focused on static experiments with mainly endpoint measurements and
no investigation of bioprocess dynamics. Fed-batch and scale-down experiments require some
understanding of the dynamics of the cultivation and resulting cell responses [31]. To these
end feedback operation methods have been developed [32] with online Optimal Experimental
re-Design strategies to fit macro-kinetic differential equation model of Escherichia coli (E. coli)
[33,34]. Nevertheless, these complex approaches require a fully automated and efficient
workflow of different laboratory devices, data exchange and management, which is has not
been achieve previously. In the previous the solutions were tailored to a specific process, less
flexible, relied on proprietary data formats, one-way data transfer and included manual steps.
In this article, we present a fully automated and highly modular facility based on a novel
concept for the interaction of i.) laboratory equipment, ii.) data, iii.) smart services and vi.) the
operator. The robotic facility presented here enables us for the first time to perform parallel
small-scale experiments with fully automated process handling, at-line sample analysis and
closed-loop process control. Additionally, optimal experimental designs, model-based
screenings and scale-down experiments are possible [35,36]. This was achieved by the

Accelerating biological screenings through the combination of high-throughput and modeling
Paper II - Integrated Robotic Mini Bioreactor Platform for Automated, Parallel …
38
physical and virtual interaction of two LHSs and a MBR system. A central database is used for
the integration of all units into a continuous workflow, which allows for end-to-end automation
[37] and operation of the parallel experiments. This automated “smart” experimental facility is
a step towards advanced bioprocess development phasing towards the digitalization of
biomanufacturing and Industry 4.0 [38].
4.2.2 Material and methods
4.2.2.1 Concept and structure of the platform
To ensure robustness, flexibility and dynamic of the MBR platform we used a central
database as data master. All measurements, sampling ids, setpoints, process parameters or
any other data generated or necessary during the cultivation are stored in a structured manner,
independent of the source or scope. Data transfer lines were avoided as much as possible, all
the data were transferred to the database on a direct way and can be read out from every
entity involved in the framework. Direct communication between the MBR platform devices is
needed for the execution of triggering events for certain tasks.
During the experiment all of the generated data sets from each MBR cultivation are saved
in the database, such as the liquid-handling steps and the online and at-line values. On the
other hand, set points for the culture handling regarding feeding, pH, stirring speed and
aeration are written to the database and read by the corresponding devices. The database
backbone was designed by infoteam (Software AG, Bubenreuth, Germany) during the BMBF
AutoBio project [37].
The setup of the robotic MBR platform centers around the integration of the bioREACTOR
48 mini-bioreactor system (2mag AG, Munich, Germany), which enables 48 cultivations in
parallel, with a Tecan Freedom EVO 200 LHS (Tecan Group Ltd, Männedorf, Switzerland).
The Tecan robot system performs the cultivation handling, process control and sampling in an
automated and parallel manner. Via the use of an electric linear transfer unit, the combination
with a Microlab Star LHS (Hamilton Company, Bonaduz, Switzerland) is enabled (Figure 1).
Samples of the parallel cultivations are taken into MWPs on the Tecan deck and carried via
the transfer unit to the Hamilton deck, where the at-line analytics are performed. By the use of
an integrated SynergyTM MX microwell plate reader (BioTek Instruments GmbH, Bad
Friedrichshall, Germany) photometric measurements of the recently taken samples are
performed. The Optical Density (OD600) of the parallel cultivations, enzymatic based tests, as
well as fluorescence signals are measured.

Accelerating biological screenings through the combination of high-throughput and modeling
39 Paper II - Integrated Robotic Mini Bioreactor Platform for Automated, Parallel …
Figure 1 Setup of the robotic platform with the combination of two liquid handlers via a linear transfer unit. Further integrations of labware devices such as a plate reader for photometric analysis, a cytomat as plate storage, an incubator for plate cultivations and a flow cytometer for single cell analysis are shown. The working place contains three computers, two for the control of the LHSs and one for the monitoring of the parallel cultivations.
4.2.2.2 Devices used in the robotic platform
4.2.2.2.1 Parallel Mini-BioReactor System
Microbial cultivations are performed in the bioREACTOR 48 system, which enables HT
parallel cultivation in up to 48 baffled single-use bioreactors, each with a working volume of 8-
14 mL. The system can easily be integrated into liquid handlers and offers a good gas transfer,
which is critical for microbial cultivations. Via the embedding of fluorometric sensor spots
(PreSens Precision Sensing GmbH, Regensburg, Germany) in each MBR, the pH and
Dissolved Oxygen Tension (DOT) is measured in real-time with an interval as low as 10 sec.
This allows for a close culture monitoring and results in large data sets. During a cultivation
with all MBRs 34 560 data points for every hour of the experiment are created, alone already
for pH and DOT. The stirrer speed, aeration and temperature are controlled for the whole
system uniformly. The temperature in the reactor block is measured via a Pt 100 sensor and
controlled through the interplay of a water bath and a cooler. The mixing of the liquid in the
MBRs is provided by hollow shafts with magnetically driven stirrers. This causes an induced
draft mechanism, by which the air is sucked from the headspace into the liquid phase. The
system can reach a volumetric mass transfer coefficient (kLa) of up to 0.4 s-1 [39]. The power
input and local energy dissipation is comparable to standard stirred-tank bioreactors and CFD
simulations showed similar hydrodynamics to bench-top stirred bioreactors on a liter scale [40].
In the lid of the system the supplied air is distributed to the headspace of each single bioreactor.
The surplus of air leaves through ports in the lid above each bioreactor assuring sterility by a
continuous outflow of sterile air. The lid of the bioreactor system is cooled to 4 °C in order to
minimize evaporation during cultivations. In preliminary tests the maximal evaporation rate was

Accelerating biological screenings through the combination of high-throughput and modeling
Paper II - Integrated Robotic Mini Bioreactor Platform for Automated, Parallel …
40
determined with 50 µL per hour (data not shown), which is in good agreement with literature
[41]. The ports in the lid enable access to each MBR with the steel needles of the Tecan liquid
handler, allowing automated culture handling and control as well as automated sampling.
4.2.2.2.2 Gas mixing station
A Red-y gas mixing station (Vögtlin Instruments GmbH, Aesch, Switzerland) was installed
upstream of the bioREACTOR 48 system for flexible and precise control of the aeration supply.
The exact inflow can be controlled as well as the composition of the aeration through the
addition of pure nitrogen or pure oxygen to the pressurized air. This can be controlled via a
Graphical User Interface (GUI) developed in LabView (National Instruments, Austin, USA),
which enables manual control or automatic control through the database. Thus, an aeration
profile can be automatically applied to the cultivations. The sterility of the system is guaranteed
via a Midisart 2000 air filter (Sartorius AG, Göttingen, Germany), which is installed between
the gas mixing station and the MBR system.
4.2.2.2.3 Liquid Handling Stations
On the deck of the Tecan LHS the bioREACTOR 48 system, trays for the liquids needed
for sterilization of the needles, feeding, pH control, a cooled carrier for the sample plates, an
Eppendorf tube carrier for offline samples and a washing station for the steel needles are
placed (Figure 2A). Moreover, an adaptive carrier of the Cedex Bio HT analyzer can be placed
for direct sampling into the corresponding tubes. The system is equipped with a Robotic
Manipulator Arm (RoMa) for plate transport and a Liquid Handling arm (LiHa) with eight fixed
steel needles. The Tecan liquid handler is used for performing all necessary steps for the
parallel cultivation handling in the MBRs including feed addition, pH control, sampling and
volume balance. Moreover, a cytomatTM 6001 (Thermo Scientific, Berlin, Germany) is
connected to the robot, which functions as a plate storage for the sample plates. Via the Tecan
Freedom Evoware, the cytomat can be controlled and a new plate is transferred to the deck
when needed. The test for sterility of the housing of the Tecan liquid handler with a sterile hood
and the test for sterility in place of the steel needles, to assure that cross contamination is
avoided, were performed according to the method of Rohe et al. [13].
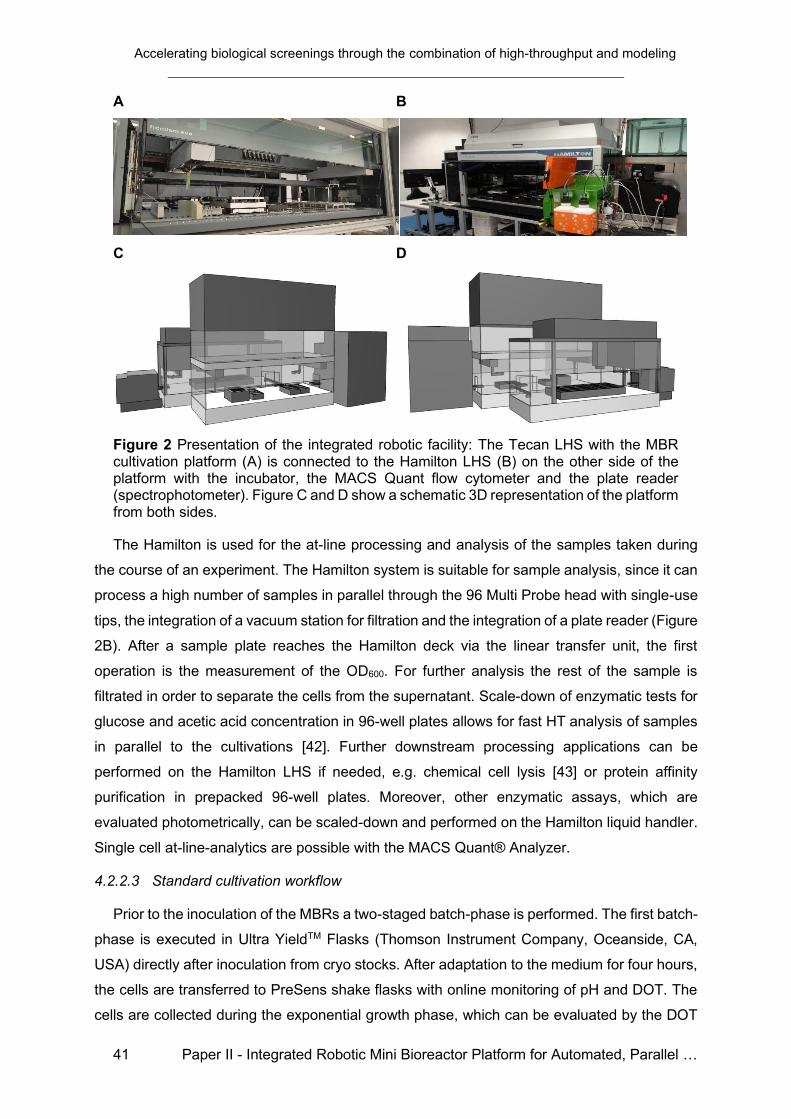
Accelerating biological screenings through the combination of high-throughput and modeling
41 Paper II - Integrated Robotic Mini Bioreactor Platform for Automated, Parallel …
A B
C D
Figure 2 Presentation of the integrated robotic facility: The Tecan LHS with the MBR cultivation platform (A) is connected to the Hamilton LHS (B) on the other side of the platform with the incubator, the MACS Quant flow cytometer and the plate reader (spectrophotometer). Figure C and D show a schematic 3D representation of the platform from both sides.
The Hamilton is used for the at-line processing and analysis of the samples taken during
the course of an experiment. The Hamilton system is suitable for sample analysis, since it can
process a high number of samples in parallel through the 96 Multi Probe head with single-use
tips, the integration of a vacuum station for filtration and the integration of a plate reader (Figure
2B). After a sample plate reaches the Hamilton deck via the linear transfer unit, the first
operation is the measurement of the OD600. For further analysis the rest of the sample is
filtrated in order to separate the cells from the supernatant. Scale-down of enzymatic tests for
glucose and acetic acid concentration in 96-well plates allows for fast HT analysis of samples
in parallel to the cultivations [42]. Further downstream processing applications can be
performed on the Hamilton LHS if needed, e.g. chemical cell lysis [43] or protein affinity
purification in prepacked 96-well plates. Moreover, other enzymatic assays, which are
evaluated photometrically, can be scaled-down and performed on the Hamilton liquid handler.
Single cell at-line-analytics are possible with the MACS Quant® Analyzer.
4.2.2.3 Standard cultivation workflow
Prior to the inoculation of the MBRs a two-staged batch-phase is performed. The first batch-
phase is executed in Ultra YieldTM Flasks (Thomson Instrument Company, Oceanside, CA,
USA) directly after inoculation from cryo stocks. After adaptation to the medium for four hours,
the cells are transferred to PreSens shake flasks with online monitoring of pH and DOT. The
cells are collected during the exponential growth phase, which can be evaluated by the DOT

Accelerating biological screenings through the combination of high-throughput and modeling
Paper II - Integrated Robotic Mini Bioreactor Platform for Automated, Parallel …
42
profile. The active cells are diluted with fresh medium to a low OD600 around 0.1-0.5 in one
batch and subsequently each MBR is inoculated with 10 mL of that batch. This enables similar
conditions between biological replicates to enable good batch-to-batch reproducibility. The
number of biological replicates depends on the number of strains used. Until now, a maximum
of eight strains was handled in parallel.
In the beginning of an automated experiment, a batch phase is performed to reach
comparable ODs600 within the different. After a steep increase in the DOT, which signals the
exhaustion of the substrate and end of batch phase, the fed-batch phase is started. Each MBR
can be fed individually based on the OD600 in the bioreactor and the set growth rate (µset). With
the use of computational modeling industrial feeding strategies can be performed: a batch-
phase at the start of the experiment, followed by an exponential fed-batch phase and a
constant feeding after induction. It is possible to use different types of substrates or substrate
concentrations, therefore multiple cultivation conditions in one run can be executed. Feeding
can be realized in two ways, either via a small bolus glucose addition every few minutes, or
continuously via the use of a substrate release system, e.g. by the EnBase® technology
(Enpresso GmbH, Berlin, Germany) [44]. This enables a slow glucose release over time based
on enzymatic degradation of a polymer and is similar to a fed-batch with a constant glucose
feed rate [45]. Also, exponential fed-batches can be performed with this system through a
semi-continuous additions of enzyme.
The pH control is based on a PI controller programmed in LabView, which calculates the
addition of base or acid based on the parameters entered in the database for each bioreactor
individually. The control is performed for each bioreactor accordingly and the parameters for
control can be changed over the course of a cultivation, such as the maximum amount of acid
or base added in one control step. The pH control can be executed as a two-sided or a one-
sided control, during the latter only base is added to the cultivations. This is especially useful
during handling of microorganisms with cycling acid metabolism such as E.coli [46].
Sampling is performed in an alternating manner with culture handling to ensure a steady
process control. In between two sampling steps substrate addition and pH control are
executed. After sampling of five columns the plate is transferred to the Hamilton LHS for at-
line analysis and a new plate is provided by the cytomat. It is possible to have different
sampling procedures included in the script, whether offline samples are needed aside from the
at-line samples. In order to keep the volume constant during a cultivation a subroutine for
volume balance is executed. This LabView application considers all volume changes, namely
i.) sampling, ii.) feeding, iii.) pH controlling additions and iv.) evaporation and calculates the
volume deficiency which is corrected with fresh culture medium. The calculated volume

Accelerating biological screenings through the combination of high-throughput and modeling
43 Paper II - Integrated Robotic Mini Bioreactor Platform for Automated, Parallel …
deficiency is saved in the database, read by a LabView application and performed by the Tecan
LHS.
To control the DOT during the cultivations, two stirrer control modes are possible. Either a
cascade control is applied, where the stirrer speed increases when the DOT in one of the
MBRs reaches a critical lower threshold, or set points are given, which can be read directly
from the database. In this way, pre-programmed agitation profiles can be accurately executed
over the whole cultivation. The scripts in the Tecan Freedom EvoWare are written in a modular
way, where each action of the LHS is saved in subroutines, so that scripts for each phase of
the cultivation are easily modifiable. This modular setup of the robotic platform allows for fast
execution of new experimental runs and adaptation of the developed scripts to new
experimental requirements.
4.2.2.4 At-line analytics
For the at-line analytics 200-300 µL samples are taken out of each MBR into a sample plate.
In advance, 15 µL 2 M NaOH is added to each well of the sample plate and dried. The addition
of the sample results in the dissociation of the dried NaOH and an increase of the pH (pH
approx. 10), which in combination with cooling of the MWP carrier to 4°C stops the metabolism
of the cells. It could be shown that over the course of three hours there was no metabolic
activity with this inactivation method 32. For the OD600 measurement a maximum of 20 µL of
the sample are taken, which leaves at least 180 µL for filtration. Afterwards 2 x 20 µl are used
for the enzymatic test in duplicate measurements, and the remaining 140 µL can be used for
further offline analyses. The script for at-line analysis of the samples takes about 45 min, which
includes the incubation times of the assays, the measurement of OD600, fluorescence signal,
glucose and acetic acid concentration in up to 48 samples in parallel.
4.2.2.4.1 Optical density and fluorescence measurement
OD600 is the first at-line measurement performed on the Hamilton liquid handler. Before the
measurement the samples are automatically diluted with 0.9 % sodium chloride in 96-well flat-
bottom MWPs. Different dilution factors are applied, in order to stay within the linear range of
the measurement over the course of the cultivation. The needed amounts of liquid to be
pipetted are calculated by the Hamilton software with an upper limit of 10 µL per sample. Before
the spectrophotometric measurement, the plate is shaken for 10 s in the plate reader to
guarantee a good suspension of the cells. The samples are prepared in duplicates, measured
at 600 nm, automatically corrected against the blank and multiplied by the correction factor.
The correction factor for the path length, which is used to convert the OD600 measured in 96-
well plates to a measurement in a cuvette, was calculated in advance [32]. If fluorescent
proteins are used as reporters, the fluorescence is measured directly after the OD600

Accelerating biological screenings through the combination of high-throughput and modeling
Paper II - Integrated Robotic Mini Bioreactor Platform for Automated, Parallel …
44
measurement in the plate reader. For different fluorescence measurements, the scripts in the
microwell plate reader software are adjusted to the correct excitation and emission
wavelengths. The corresponding script is then executed by the Hamilton software.
4.2.2.4.2 Glucose and acetate measurements
After the OD600 and fluorescence measurements, the samples are further processed
automatically on the Hamilton platform for the analysis of the metabolites and medium
components. Glucose concentration is measured with the enzymatic Glucose Hexokinase FS
kit (DiaSys Diognostics Systems GmbH, Holzheim, Germany), acetic acid concentration is
measured with the Acetic Acid Assay kit (Megazymes, Bray, Ireland). Both measurements
function via the enzymatic conversion of the analyte, by which NADH is oxidized 47 or NADPH
is produced [48], both can be measured photometrically at 340 nm. For each measurement
10 µL of sample are needed and both are measured in duplicates. Two 96-well MWPs are
prepared with pre-added master mixes of the test kids, the samples and standards are added
and subsequently the plate is measured after the stated incubation times. The standards used
for the determination of the analyte concentration were put in random order to avoid systematic
errors and were analyzed for each sample plate repeatedly. The analysis is executed fully
automatically and after each run the single-use plastic tips of the robot are replaced. The data
is automatically processed and the measured absorption is subtracted by the blank and
converted to the analyte concentration by regression of the standard samples.
4.2.2.4.3 Offline analysis
Direct samples from the MBRs as well as the surplus of the filtrated sample volume can be
used for offline analyses, e.g. for metabolite and protein analyses. Over the course of a
cultivation a lot of samples are generated. If all MBRs are used, nearly 100 samples are
generated after two sampling rounds. Therefore, the offline analysis also needs to be
performed in HT manner. The cultivation samples are automatically pipetted into tubes by the
Tecan LHS and the filtrated samples are collected in 96-well plates, both are manually
removed and stored in the fridge or directly frozen for subsequent analyses.
4.2.2.4.4 High-Throughput Metabolite Quantification
For the analysis of the produced metabolites the Cedex Bio HT analyzer (Roche
Diagnostics International Ltd, Rotkreuz, Switzerland) is used. Tests are based on photometric
and potentiometric measurements in combination with enzymatic tests for offline analysis of
samples in HT manner. For our purposes glucose, acetate, formate, ethanol, lactate, ammonia,
phosphate and magnesium were analyzed. For each measurement 2-20 µL are needed based
on the test used, but the minimal liquid volume required for sample handling by the Cedex

Accelerating biological screenings through the combination of high-throughput and modeling
45 Paper II - Integrated Robotic Mini Bioreactor Platform for Automated, Parallel …
pipettes is around 100 µL. The filtrated supernatant samples were diluted if needed and
processed according to the user manual.
4.2.2.4.5 High-Throughput Protein Analysis
For the analysis of produced recombinant proteins during the cultivation, the LabChip GXII
Touch HT (PerkinElmer Inc., Baesweiler, Germany) is used. The measurement is based on
the microfluidic and electrophoretic separation in combination with detection via laser-based
fluorescence of proteins in the offline cultivation samples. The analysis of one sample takes
around 42 sec and per measurement 2-4 µL are required. The device is applied for protein
quantification in the culture supernatant or after cell lysis. The Protein Pico Assay Reagent Kit
was used, which enables detection of protein concentrations as low as 10 pg/µL. The filtrated
supernatant samples were used and the preparation was performed according to the user
manual.
4.2.3 Results
4.2.3.1 Data handling and communication
To ensure modularity the central database as data master for all tasks is used. Thereby all
devices and programs are able to perform the tasks independently, in parallel and a modular
fashion via the direct communication with the database. One tool to achieve this, is a .NET
library that is used as a communication interface to the database and can be applied for nearly
all Windows-based applications such as VenusFour (Hamilton), Python (Python Software
Foundation) or LabView. applications. A mirror image version of this library is implemented in
MATLAB to ensure functionality on Linux based systems. Complex feeding profiles based on
process simulation and optimal experimental designs can be entered into the database for
each individual bioreactor.
For manual operation during the experiments, the database can be accessed via a
developed software. It can be used to write set points and parameters manually to the
database. Moreover, the software offers a flexible real-time visualization of the generated data
for process control. The offline data is entered via a MATLAB script that properly handles
significant amount of data generated by the LabChip and Cedex Bio HT analyzer. By this all
the data gained in one experimental run are saved together in a centralized manner, which is
easily accessible by both, the model-based operation algorithms and the operators.
Through the database different software tools and laboratory devices can communicate and
interact enabling an end-to-end data and device integration. Online data such as temperature,
stirring speed, pH and DOT values are stored in the database using a LabView application,
which also enables manual control or direct reading of process parameters, such as stirring
speed or aeration rate. Set points for culture handling, such as feeding and pH control are

Accelerating biological screenings through the combination of high-throughput and modeling
Paper II - Integrated Robotic Mini Bioreactor Platform for Automated, Parallel …
46
saved as set points in the database and read by different LabView applications. These
applications are converted to executable files (exe), which can be run from the Tecan Freedom
EVO software directly (Figure 3). Each set point in the database is connected to a timestamp
and the most recent ones are written into General Writing Language (gwl) lists.
The server-client based communication between the two liquid handlers is assured by a
Standardization in Lab Automation (SiLA 2) driver. This further developed tool serves as a
general and modular interface for the communication between the two LHS. The Tecan robot
sends a SiLA Client command via the network to the SiLA Server on the Hamilton site, which
triggers the start of the Hamilton script for at-line analysis. The script on the Hamilton robot is
started directly after samples are taken, so that the time frame between sampling and analysis
is as short as possible. The at-line data are extracted from the Gen 5 BioTek software of the
plate reader, read by the Hamilton software and saved in the database.

Accelerating biological screenings through the combination of high-throughput and modeling
47 Paper II - Integrated Robotic Mini Bioreactor Platform for Automated, Parallel …
Figure 3 Representation of the schematic data exchange via the centralized database with end-to-end data communication over the entire robotic platform. On the one hand, the database is used for saving the data generated during the experiment as pH, dissolved oxygen tension and stirring speed. On the other hand it is used as an interface between the manual or computational control of the liquid handlers and the 2mag bioREACTOR 48 system. For the data transfer different software parts need to interact as the database software, LabView applications, Python scripts, model-based Matlab scripts and the corresponding liquid handler software.
4.2.3.2 Scheduling of automated experimental procedure
Scheduling of the automated liquid handling steps is a crucial part during the development
of such a platform, since a lot of actions need to be performed within a limited amount of time.
It needs to be evaluated which steps in which intervals should be performed for a steady culture
handling. A script was developed, which meets the requirements for overall culture handling
without longer breaks for sampling or at-line analysis (Figure 4A). For the addition of substrate
an interval of 5 min was chosen, this ensures a semi-continuous feeding over the cultivation.
After the start of the script in the Tecan Freedom Evo software, prior to the handling of the

Accelerating biological screenings through the combination of high-throughput and modeling
Paper II - Integrated Robotic Mini Bioreactor Platform for Automated, Parallel …
48
sterile liquids, the fixed steel needles are sterilized. For sterilization the steel needles are
treated twice with 70% ethanol during the process ethanol is aspirated and the needles placed
inside the ethanol trays. Through this, the needles are sterilized from the inside as well as from
the outside for 20 sec. After each ethanol handling step the residual liquid is blown out by an
air dispense step. To avoid any carry-over of the ethanol to the cultures the needles are
washed with sterile deionized water subsequently.
In the Block 0, all the necessary steps for culture handling are integrated as feeding, pH
control and volume balance. Block 0 is designed so that the execution takes 5 minutes, it can
be repeated any number of times before block 1, which contains the sampling, is triggered
(Figure 4A). The duration of the specific liquid handling steps can differ depending on the
number of bioreactors, which are controlled. Thus, each subroutine is ended by a timer to
ensure that the timeframe is kept constant regardless of the experimental handling. Each time
a Block is started and before every sampling the needles are sterilized, after the handling of
each liquid, as base or glucose, the needles are washed with sterile deionized water. In this
way, any carry over between the liquids is avoided. Sampling could be repeated in a grid of 5
minutes. Here it could be chosen independently between at-line (Block 1a) and offline sampling
(Block1b). One limitation here is the analysis protocol on the second LHS, which takes 45
minutes for OD, fluorescence, glucose and acetate. As an example workflow Block 0 and Block
1 can be repeated regularly in a 10 min interval and 5 columns are collected before the sample
plate is transferred for analysis (Figure 4B). In each sampling procedure one column (i.e. 8
reactors) of the MBR system is sampled. With respect to the analysis time of the at-line
measurements this cycle is performed five times (Block 0 & 1 = 50 min). The next sampling
cycle starts with the remaining column of the MBR system and proceeds again from the first
column. Due to this modular interplay of subroutines both in process control (Block 0 & 1) and
at the at-line analysis, the experiments can be quickly and easily adapted to new requirements.
The separation of process control and at-line analysis clears a lot of robotic capacity on the
Tecan liquid handler a steady culture handling is ensured, while at the same time maintaining
the possibility of reducing, expanding or convert the at-line analyses.

Accelerating biological screenings through the combination of high-throughput and modeling
49 Paper II - Integrated Robotic Mini Bioreactor Platform for Automated, Parallel …
Figure 4 Schematic procedure of the culture handling in combination with sample handling. In figure 4A Combination of the liquid handling steps into blocks. In Figure 4B an exemplary experimental process is descripted. The script starts with the Block 0, which contains sterilization of the needles and all steps necessary for culture handling. After n cycles of Block 0 the Block 1 is entered, which combines culture handling with sampling procedure. Each time the Block 1 is executed one column of the MBR system is sampled, after five runs the sampling plate is forwarded to the second LHS for at-line analysis. Afterwards a new sampling plate is provided by the robot and the scheduled procedure is repeated. Thereby, the repletion of Block 0 could be one or higher and defines the sampling frequency(n=1; sampling every 10 min; n=2 sampling every 15 min and so on). The next sampling cycle starts with the remaining column in the MBR and proceeds again with the first column of the sampling plate. In figure 4B the time intervals, each Block and the individual subroutines take to be executed, are depicted.
A
B

Accelerating biological screenings through the combination of high-throughput and modeling
Paper II - Integrated Robotic Mini Bioreactor Platform for Automated, Parallel …
50
4.2.3.3 Experimental results
As a proof of concept, a HT fed-batch cultivation of E. coli BW25113 expressing
recombinant mini-proinsulin under the Isopropyl β-D-1-thiogalactopyranoside (IPTG) inducible
tac-promoter, is shown. The cultivation was performed with 24 MBRs and pulse-based feeding
with different intervals, as a scale-down approach. The data of only six of the MBRs are
depicted, to maintain a good visualization of the data (Figure 5A).
The batch phase was inoculated to an OD600 of 0.1 with an initial glucose concentration of
five g L-1 in mineral salt media, prepared as previously shown 18. The peaks in the DOT profiles
during the batch phase were caused by rises in the stirring speed, until 2400 rpm, in response
to low DOT concentrations. The pH was controlled at a set point of 7 with a tolerance of 0.1,
so that as soon as the measured pH dropped below 6.9 for one of the bioreactors, the pH
controller automatically interacted. Over the course of the cultivation the pH dropped for some
cultivations below 6.9, since the pH controller could not compensate for the produced acetate.
Therefore, the amount of base per addition was increased from 10 µL to 50 µL at 12 h.
The batch-phase lasted around five hours and an OD600 of 6.74±0.5 was reached for the
six shown bioreactors. This shows a good batch-to batch reproducibility for the parallel
cultivations. After the exhaustion of the substrate, which results in a steep DOT increase, the
pH increased gradually to 7.2 with a steady decline in DOT. This indicates the consumption of
the acetate, which was produced as a result of substrate overflow in the batch-phase. At 6 h
and 13 min the pulse-based exponential fed-batch phase was started, where a glucose pulse
was added by the Tecan LHS every 5 min for MBR 1-3 and every 10 min for MBR 4-6. The
size of the glucose pulses was derived from a time-based integration of a continuous
exponential feed that was calculated based on the physiological state of the culture at the end
of the batch phase (OD600 and residual glucose). The glucose pulses caused a cycling of the
DOT and pH, due to the changes in the metabolism of the cells in response to the availability
or limitation of glucose. The drop in the DOT increased with the amount of substrate added
per addition and the growing biomass, therefore the stirrer speed was increased to 2600 rpm
at 8 h and 18 min to avoid anoxic conditions. During the exponential growth phase a µ of
0.925±0.05 (Bioreactor 1-3) and 0.75±0.1 (Bioreactor 4-6) was reached. Despite the different
pulse intervals the cumulative amount of substrate added to the bioreactors was the same over
the course of the cultivation. After 9 h and 13 min the feed was switched to constant feed by
maintaining the last value of the exponential phase for every subsequent substrate addition.
Moreover, the cells were induced with an IPTG concentration of 0.5 mM (Bioreactor 4-6)
and 1 mM (Bioreactor 1-3), which is indicated by the vertical, black dotted line (Figure 5A and
5B). The glucose and acetate measurements were performed after the cultivation with the

Accelerating biological screenings through the combination of high-throughput and modeling
51 Paper II - Integrated Robotic Mini Bioreactor Platform for Automated, Parallel …
Cedex Bio HT analyzer, since no readjustment of the experiment was performed. The
cultivations with
A
B

Accelerating biological screenings through the combination of high-throughput and modeling
Paper II - Integrated Robotic Mini Bioreactor Platform for Automated, Parallel …
52
Figure 5 Measured online, at-line and offline values of the E. coli BW25113 cultivation with a batch-phase, an exponential fed-batch phase and a production phase with constant feed are shown for six of the used 24 MBRs. The feed additions are performed in a pulse-based form with different interval length in between. The vertical dashed black line indicates the induction with 0.5 mM (Bioreactor 4-6) and 1 mM IPTG (Bioreactor 1-3). The online measured values are DOT and pH, the at-line measurements are OD600, and glucose and acetic acid concentration were measured offline, analysis was performed with the Cedex Bio HT analyzer. The bioreactors with 5 min (A) and 10 min (B) pulse-based intervals are shown.
the 5 min pulses were run under substrate limitation, as can be seen by the glucose
measurements; nevertheless, acetate accumulated until a plateau of 3-4 g L–1 was reached.
Within the cultivations with the 10 min pulses the glucose varied up to 1.16 g L-1, but went back
to limitation towards the end of the cultivations. Acetate concentration increased from 0 up to
1.26 g L-1 towards the end of the concentration. This is around three times lower compared to
the five minute pulses and can be explained by the longer time for glucose and acetate
consumption between the pulses.

Accelerating biological screenings through the combination of high-throughput and modeling
53 Paper II - Integrated Robotic Mini Bioreactor Platform for Automated, Parallel …
Figure 6 Results of HT protein analysis using the technique of capillary gel electrophoresis. Figure 6A depicts an electropherogram of a sample from an E. coli cultivation 6 h after induction, showing the peak of the recombinant protein of interest (orange arrow) at 11.72 kDa. Figure 6B shows a virtual gel of 48 samples, which were taken over the course of the cultivation. They were quantified in HT manner with the LabChip GXII, the band of the recombinant protein of interest is indicated by red arrows. In figure 6C Product formation before and after induction with isopropyl β-D-1-thiogalactopyranoside for two mini bioreactors is exemplarily depicted.
A
B
C

Accelerating biological screenings through the combination of high-throughput and modeling
Paper II - Integrated Robotic Mini Bioreactor Platform for Automated, Parallel …
54
Exemplarily the electropherogram of the HT protein analysis with the LabChip GXII Touch
HT from one MBR 6 h after induction is shown (Figure 6A), whereby the protein of interest is
indicated by an orange arrow. The area under each peak is integrated and compared to the
peak area of protein standards, by which the quantity of each protein can be determined. For
each measurement, a virtual gel sample is created, which allows for visual comparison
between different samples induced with different IPTG concentrations (Figure 6B). It can be
seen that the proteins are separated and the protein of interest can be clearly detected in all
samples. By this analysis, the dynamics of the product formation could be followed over the
cultivation time as exemplarily shown for two MBRs (Figure 6C). Apart from the analysis, the
production of the recombinant protein can be seen in the microscopic pictures taken alongside
the cultivation (Figure 7).
Figure 7 Depicted are microscopic pictures of the E. coli BW25113 fed-batch cultivation before induction (left) and three hours after induction (middle and right). The produced recombinant protein after induction can be seen by the inclusion body formation at each site of the microorganism.
4.2.4 Discussion
To our knowledge, this is the first MBR platform that enables fully automated process
handling and at-line sample analysis in combination with online model-based control options.
The parallel cultivations are performed in milliliter scale under well controlled conditions
generating high density data. The experimental setup of the cultivations is designed to mimic
oscillating process conditions as present in large scale. The fast at-line analysis of the samples
allows for a good monitoring of the process, adaptive input design strategies and progressive
characterization of strains phenotype during the experiment. Adaptation and implementation
of the operating strategy is possible due to a fast data processing and device communication
through the central data storage. The combination of two liquid handlers with modular, well-
structured scripts and bidirectional communication drastically increases the sophistication,

Accelerating biological screenings through the combination of high-throughput and modeling
55 Paper II - Integrated Robotic Mini Bioreactor Platform for Automated, Parallel …
capacities, and throughput of the robotic facility. By this, a well-defined culture handling with
fast at line analysis is possible tackling the bottleneck of sample analytics from parallel
microliter scale cultivations [14].
The modular setup of the developed robotic MBR platform promotes the extension of the at
line capabilities by a facilitated integration of new HT at-line analytical devices into the existing
software framework.
The development of similar platforms requires an interdisciplinary work between
engineering, laboratory automation, liquid handling, software development and mathematical
modeling.
The feasibility of 48 microbial cultivations in parallel under well-defined conditions with
different feeding strategies was demonstrated over a course of 48 h of cultivation [49]. The
application of the platform for the cultivation of different microorganisms, such as E. coli and
Saccharomyces cerevisiae (S.cerevisiae) [49] showed the versatility and flexibility of the
developed platform. In the combination with model-based operations complex bioprocess
engineering applications, such as scale-down studies [35] and fast strain phenotyping for
optimal screening designs were also performed [36].
The platform creates an interface between HT small-scale screenings with low-controlled
conditions and the labor intensive well-controlled laboratory scale bioreactors with a low
throughput. Through the application of industrially relevant process conditions, failures during
development, due to unrepresentative experimental conditions for further scale-up can be
avoided.
The use of a central database to connect the devices in the integrated framework requires
standard communication protocols (e.g. OPC) which are missing in biotech laboratories.
Efforts in that direction are made by the SiLA consortium with the SiLA2 interfaces allowing for
multi-user access to devices on simplified, easy to understand commands and with unified
data formats [50]. Further applications, as laboratory information management systems (LIMS)
and electronic laboratory notebook (ELN) systems, should also be integrated into automated
laboratories devices for a holistic data management.
Funding
The project was financially supported by the German Federal Ministry of Education and
Research (BMBF) within the European program EraSysApp (Project no. 031L0018A
(Leanprot)) and European Union’s Horizon 2020 research and innovation program under the
Marie Skłodowska-Curie actions grant agreement (Project no. 643056 (Biorapid)).

Accelerating biological screenings through the combination of high-throughput and modeling
Paper II - Integrated Robotic Mini Bioreactor Platform for Automated, Parallel …
56
Acknowledgement
We thank Terrance Wilms for inputs to the model-based scripts and Florian Glauche for
fruitful discussion and technical support during the development phase. Also, we thank Robert
Giessmann for the programming support during the software setup. Moreover, we would like
to thank Dr. Matthias Gimpel for the input concerning the microbiological work. Moreover, we
thank the Roche Diagnostics International Ltd and the PerkinElmer Inc. for the support.
Conflicts of Interest
The authors declare no conflict of interest.
4.2.5 References
1. Siurkus, J.; Panula-Perälä, J.; Horn, U.; et al. Novel Approach of High Cell Density
Recombinant Bioprocess Development: Optimisation and Scale-up from Microliter to
Pilot Scales While Maintaining the Fed-Batch Cultivation Mode of E. Coli Cultures.
Microb. Cell Fact. 2010, 9, 1–17.
2. Neubauer, P.; Cruz Bournazou, M. N.; Glauche, F.; et al. Consistent Development of
Bioprocesses from Microliter Cultures to the Industrial Scale. Eng. Life Sci. 2013, 13,
224–238.
3. Hemmerich, J.; Noack, S.; Wiechert, W.; et al. Microbioreactor Systems for Accelerated
Bioprocess Development. Biotechnol. Bioeng. 2018, 13, 1–9.
4. Islam, R. S.; Tisi, D.; Levy, M. S.; et al. Scale-Up of Escherichia Coli Growth and
Recombinant Protein Expression Conditions From Microwell to Laboratory and Pilot
Scale Based on Matched k L A. Biotechnol. Bioeng. 2008, 99, 1128–1139.
5. Junker, B. H.; Wang, H. Y. Bioprocess Monitoring and Computer Control : Key Roots
of the Current PAT Initiative. 2006.
6. Scheidle, M.; Jeude, M.; Dittrich, B.; et al. High-Throughput Screening of Hansenula
Polymorpha Clones in the Batch Compared with the Controlled-Release Fed-Batch
Mode on a Small Scale. FEMS Yeast Res. 2010, 10, 83–92.
7. Schäpper, D.; Alam, M. N. H. Z.; Szita, N.; et al. Application of Microbioreactors in
Fermentation Process Development: A Review. Anal. Bioanal. Chem. 2009, 395, 679–
695.
8. Funke, M.; Diederichs, S.; Kensy, F.; et al. The Baffled Microtiter Plate : Increased
Oxygen Transfer and Improved Online Monitoring in Small Scale Fermentations.
Biotechnol. Bioeng. 2009, 103, 1118–1128.
9. Duetz, W. A. Microtiter Plates as Mini-Bioreactors : Miniaturization of Fermentation
Methods. TRENDS Microbiol. 2007, 15, 469–475.

Accelerating biological screenings through the combination of high-throughput and modeling
57 Paper II - Integrated Robotic Mini Bioreactor Platform for Automated, Parallel …
10. Buchenauer, A.; Hofmann, M. C.; Funke, M.; et al. Micro-Bioreactors for Fed-Batch
Fermentations with Integrated Online Monitoring and Microfluidic Devices. Biosens.
Bioelectron. 2009, 24, 1411–1416.
11. Neubauer, P.; Junne, S. Scale-down Simulators for Metabolic Analysis of Large-Scale
Bioprocesses. Curr. Opin. Biotechnol. 2010, 21, 114–121.
12. Dörr, M.; Fibinger, M. P. C.; Last, D.; et al. Fully Automatized High-Throughput Enzyme
Library Screening Using a Robotic Platform. Biotechnol. Bioeng. 2016, 113, 1421–
1432.
13. Rohe, P.; Venkanna, D.; Kleine, B.; et al. An Automated Workflow for Enhancing
Microbial Bioprocess Optimization on a Novel Microbioreactor Platform. Microb. Cell
Fact. 2012, 11.
14. Unthan, S.; Radek, A.; Wiechert, W.; et al. Bioprocess Automation on a Mini Pilot Plant
Enables Fast Quantitative Microbial Phenotyping. Microb. Cell Fact. 2015, 14, 1–11.
15. Blesken, C.; Olfers, T.; Grimm, A.; et al. The Microfluidic Bioreactor for a New Era of
Bioprocess Development. Eng. Life Sci. 2016, 16, 190–193.
16. Horinouchi, T.; Minamoto, T.; Suzuki, S.; et al. Development of an Automated Culture
System for Laboratory Evolution. J. Lab. Autom. 2014, 19, 478–482.
17. Lemoine, A.; Delvigne, F.; Bockisch, A.; et al. Tools for the Determination of Population
Heterogeneity Caused by Inhomogeneous Cultivation Conditions. J. Biotechnol. 2017,
251, 84–93.
18. Anane, E.; Sawatzki, A.; Neubauer, P.; et al. Modelling Concentration Gradients in Fed-
Batch Cultivations of E. Coli -towards the Flexible Design of Scale-down Experiments.
J. Chem. Technol. Biotechnol. 2018, 94, 516–526.
19. Grünberger, A.; Wiechert, W.; Kohlheyer, D. Single-Cell Microfluidics: Opportunity for
Bioprocess Development. Curr. Opin. Biotechnol. 2014, 29, 15–23.
20. Neubauer, P.; Junne, S. Scale-up and Scale-down Methodologies for Bioreactors. In:
“Bioreactors: Design, Operation and Novel Applications”; CF., M., Ed.; Wiley-VCH,
2016.
21. Neubauer, P.; Cruz Burnazou, M. N. Continuous Bioprocess Development: Methods
for Control and Characterization of the Biological System. In Continuous
Biomanufacturing: Innovative Technologies and Methods; G., S., Ed.; Wiley-VCH,
2017.
22. Hertzberg, R. P.; Pope, A. J. High-Throughput Screening: New Technology for the 21st
Century. Curr. Opin. Chem. Biol. 2000, 4, 445–451.
23. Agresti, J. J.; Antipov, E.; Abate, A. R.; et al. Ultrahigh-Throughput Screening in Drop-
Based Microfluidics for Directed Evolution. Proc. Natl. Acad. Sci. 2010, 107, 1–6.
24. Becker, S.; Schmoldt, H. U.; Adams, T. M.; et al. Ultra-High-Throughput Screening
Based on Cell-Surface Display and Fluorescence-Activated Cell Sorting for the
Identification of Novel Biocatalysts. Curr. Opin. Biotechnol. 2004, 15, 323–329.

Accelerating biological screenings through the combination of high-throughput and modeling
Paper II - Integrated Robotic Mini Bioreactor Platform for Automated, Parallel …
58
25. Ostafe, R.; Prodanovic, R.; Nazor, J.; et al. Ultra-High-Throughput Screening Method
for the Directed Evolution of Glucose Oxidase. Chem. Biol. 2014, 21, 414–421.
26. TWB and Hamilton develop a unique and custom made microbial culture robot , utilizing
cutting-edge technology for the field of industrial biotechnology High throughput culture
platform.
27. Betts, J. I.; Doig, S. D.; Baganz, F. Characterization and Application of a Miniature 10
ML Stirred-Tank Bioreactor, Showing Scale-down Equivalence with a Conventional 7 L
Reactor. Biotechnol. Prog. 2006, 22, 681–688.
28. Bareither, R.; Pollard, D. A Review of Advanced Small-Scale Parallel Bioreactor
Technology for Accelerated Process Development : Current State and Future Need.
2011.
29. Wu, T.; Zhou, Y. An Intelligent Automation Platform for Rapid Bioprocess Design. J.
Lab. Autom. 2014, 19, 381–393.
30. Freier, L.; Hemmerich, J.; Schöler, K.; et al. Framework for Kriging-Based Iterative
Experimental Analysis and Design: Optimization of Secretory Protein Production in
Corynebacterium Glutamicum. Eng. Life Sci. 2016, 16, 538–549.
31. Haby, B.; Glauche, F.; Hans, S.; et al. Stammcharakterisierung Mittels On-Line-
Redesign von Experimenten. BIOspektrum 2018, 24, 39–42.
32. Nickel, D. B.; Cruz Bournazou, M. N.; Wilms, T.; et al. Online Bioprocess Data
Generation, Analysis and Optimization for Parallel Fed-Batch Fermentations at ML
Scale. Eng. Life Sci. 2016, 1–7.
33. Cruz Bournazou, M. N.; Barz, T.; Nickel, D. B.; et al. Online Optimal Experimental Re-
Design in Robotic Parallel Fed-Batch Cultivation Facilities. Biotechnol. Bioeng. 2017,
114, 610–619.
34. Barz, T.; Sommer, A.; Wilms, T.; et al. Adaptive Optimal Operation of a Parallel Robotic
Liquid Handling Station. IFAC-PapersOnLine 2018, 51, 765–770.
35. Anane, E.; Haby, B.; Hans, S.; et al. Scaling down Further: Model-Based Scale-down
Studies in Minibioreactors. New Biotechnol. 2018, 44, 60–61.
36. Hans, S.; Anane, E.; Glauche, F.; et al. Optimal Conditional Screening in High-
Throughput Bioprocess Development. Chemie Ing. Tech. 2018, 90, 1224–1224.
37. Schmid, I.; Aschoff, J. A Scalable Software Framework for Data Integration in
Bioprocess Development. Eng. Life Sci. 2017, 17, 1159–1165.
38. BioPhorum Operations Group Ltd. Biomanufacturing Technology Roadmap.
https://www.biophorum.com/wp-con- tent/uploads/2017/06/Executive-Summary.pdf
39. Puskeiler, R.; Kaufmann, K.; Weuster-Botz, D. Development, Parallelization, and
Automation of a Gas-Inducing Milliliter-Scale Bioreactor for High-Throughput
Bioprocess Design (HTBD). Biotechnol. Bioeng. 2005, 89, 512–523.

Accelerating biological screenings through the combination of high-throughput and modeling
59 Paper II - Integrated Robotic Mini Bioreactor Platform for Automated, Parallel …
40. Weuster-Botz, D.; Puskeiler, R.; Kusterer, A.; et al. Methods and Milliliter Scale Devices
for High-Throughput Bioprocess Design. Bioprocess Biosyst. Eng. 2005, 28, 109–119.
41. Kusterer, A.; Krause, C.; Kaufmann, K.; et al. Fully Automated Single-Use Stirred-Tank
Bioreactors for Parallel Microbial Cultivations. Bioprocess Biosyst. Eng. 2008, 31, 207–
215.
42. Knepper, A.; Heiser, M.; Glauche, F.; et al. Robotic Platform for Parallelized Cultivation
and Monitoring of Microbial Growth Parameters in Microwell Plates. J. Lab. Autom.
2014, 19, 593–601.
43. Glauche, F.; Pilarek, M.; Bournazou, M. N. C.; et al. Design of Experiments-Based
High-Throughput Strategy for Development and Optimization of Efficient Cell
Disruption Protocols. Eng. Life Sci. 2017, 17, 1166–1172.
44. Krause, M.; Neubauer, A.; Neubauer, P. The Fed-Batch Principle for the Molecular
Biology Lab: Controlled Nutrient Diets in Ready-Made Media Improve Production of
Recombinant Proteins in Escherichia Coli. Microb. Cell Fact. 2016, 15, 110.
45. Krause, M.; Ukkonen, K.; Haataja, T.; et al. A Novel Fed-Batch Based Cultivation
Method Provides High Cell-Density and Improves Yield of Soluble Recombinant
Proteins in Shaken Cultures. Microb. Cell Fact. 2010, 9, 1–11.
46. Anane, E.; López C, D. C.; Neubauer, P.; et al. Modelling Overflow Metabolism in
Escherichia Coli by Acetate Cycling. Biochem. Eng. J. 2017, 125, 23–30.
47. Koltunov, V.; Greenblatt, C. L.; Goncharenko, A. V.; et al. Structural Changes and
Cellular Localization of Resuscitation-Promoting Factor in Environmental Isolates of
Micrococcus Luteus. Microb. Ecol. 2010, 59, 296–310.
48. Deng, X.; Petitjean, M.; Teste, M. A.; et al. Similarities and Differences in the
Biochemical and Enzymological Properties of the Four Isomaltases from
Saccharomyces Cerevisiae. FEBS Open Bio 2014, 4, 200–212.
49. Sawatzki, A.; Hans, S.; Narayanan, H.; et al. Accelerated Bioprocess Development of
Endopolygalacturonase-Production with Saccharomyces Cerevisiae Using Multivariate
Prediction in a 48 Mini-Bioreactor Automated Platform. Bioengineering 2018, 5, 1–20.
50. Bär, H.; Hochstrasser, R.; Papenfuß, B. SiLA: Basic Standards for Rapid Integration in
Laboratory Automation. J. Lab. Autom. 2012, 17, 86–95.

Accelerating biological screenings through the combination of high-throughput and modeling
Paper III - Automated Conditional Screening of Multiple Escherichia coli … 60
4.3 Automated Conditional Screening of Multiple Escherichia coli Strains in Parallel Adaptive Fed-Batch Cultivations
Bioengineering 2020: DOI: 10.3390/bioengineering7040145, Accepted: 9. Nov. 2020 / Published: 11. Nov. 2020, accepted manuscript Copyright © 2020 by the authors - CC BY 4.0
Sebastian Hans 1*, Benjamin Haby 1, Niels Krausch 1, Tilman Barz 2, Peter Neubauer 1 and Mariano Nicolas Cruz-Bournazou3 1 Technische Universität Berlin, Faculty III Process Sciences, Institute of Biotechnology, Chair of
Bioprocess Engineering, Ackerstraße 76, 13357 Berlin, Germany; [email protected] 2 AIT Austrian Institute of Technology, Center for Energy; [email protected] 3 DataHow AG, ETH Zürich-HCI, F137, Vladimir-Prelog-Weg 1, 8093 Zurich, Switzerland;
Abstract: In bioprocess development, the host and the genetic construct for a new
biomanufacturing process are selected in the early developmental stages. This decision, made
at the screening scale with very limited information about the performance in larger reactors,
has a major influence on the efficiency of the final process. To overcome this, scale-down
approaches during screenings that show the real cell factory performance at industrial-like
conditions are essential. We present a fully automated robotic facility with 24 parallel mini-
bioreactors that is operated by a model-based adaptive input design framework for the
characterization of clone libraries under scale-down conditions. The cultivation operation
strategies are computed and continuously refined based on a macro-kinetic growth model that
is continuously re-fitted to the available experimental data. The added value of the approach
is demonstrated with 24 parallel fed-batch cultivations in a mini-bioreactor system with eight
different Escherichia coli strains in triplicate. The 24 fed-batch cultivations were run under the
desired conditions, generating sufficient information to define the fastest-growing strain in an
environment with oscillating glucose concentrations similar to industrial-scale bioreactors.
Own Contributions: conceptualization, methodology, software, validation, formal analysis,
investigation, resources, data curation, writing—original draft, visualization, project administration, SH
Author Contributions: Conceptualization, MNCB and SH; methodology, SH; software, SH and BH;
validation, SH and MNCB.; formal analysis, SH; investigation, SH and MNCB; resources, SH, NK, BH
and MNCB; data curation, SH, BH, NK; writing—original draft preparation, SH; writing—review and
editing, MNCB, TB, PN, NK; visualization, SH; supervision, MNCB and PN; project administration, SH
and MNCB; funding acquisition, PN

Accelerating biological screenings through the combination of high-throughput and modeling
61
4.
3 Paper III - Automated Conditional Screening of Multiple Escherichia coli …
4.3.1 Introduction
Emerging technologies in robotic biolaboratories open new opportunities for both high-
throughput (HT) screening and HT bioprocess development. On the screening side, significant
progress has been made in terms of cultivation scale (down to femtoliter), parallelization and
non-invasive observation, which have been widely reviewed [1,2,3]. The focus of this work is
conditional screening, where a reduced number of candidate clones are tested under different
conditions with the aim to significantly improve the performance at an industrial scale (e.g.,
media, pH and temperature profiles, bioreactor heterogeneities, induction and feeding
strategies). These factors are known to affect the underlying nonlinear dynamics of the
bioprocess and are part of the very complex time-dependent interaction between the bioreactor
environment and the cell. This highly nonlinear behavior makes it difficult to predict the effect
of changes in the cultivating conditions and is responsible for the high failure rate in scale-up
[4,5,6]. In order to overcome these challenges, experiments in conditional screening require
highly advanced experimental setups able to: (i) operate as similar as possible to the industrial
strategy (e.g., fed-batch or continuous cultivations), (ii) mimic the harsh conditions of industrial-
scale bioreactors as closely as possible (e.g., growth limitation; bioreactor heterogeneities)
and (iii) generate the maximal amount of information possible about the strain’s phenotype and
its complex dynamic interaction with the process. Many experimental strategies in all scales
as well as kinetic and computational fluid dynamics (CFD) modeling approaches focus on this
challenge [7,8,9].
The technology to perform parallel experiments with advanced operation in fed-batch or
continuous mode has recently become available [10,11,12,13]. Mini-bioreactors (MBR)
integrated in liquid handling stations (LHS) allow a large number of parallel cultivations while
maintaining the properties of benchtop bioreactors [9]. With working volumes of 2–250 mL,
geometric similarities to large-scale reactors [14] and high-frequency measurements and
analytics, MBRs have been used for process characterizations [10,12,15] and scale-down
studies [16] for up to 48 cultivations in parallel. Such robotic facilities with automated cultivation
control, sampling and at-line analytic operations are very powerful systems that can accelerate
bioprocess development [11,17,18,19], especially in combination with digital solutions for
experiment (re-)planning [20,21,22], data acquisition [11,17] and real-time dynamic analysis
[23]. The bottleneck is currently the lack of advanced computer-aided tools to plan the
experiments, operate the robots and build the necessary models and digital twins for scale-up
and advanced process control. Because of limitations of the planning and operation capacity
of humans, much too often, robots are on hold, waiting for the next experiment to be planned,
experimental campaigns need to be repeated because of failures that were not detected on

Accelerating biological screenings through the combination of high-throughput and modeling
Paper III - Automated Conditional Screening of Multiple Escherichia coli … 62
time and the same feeding strategy is used for clones with different characteristics. These are
the main issues we address in the present work.
Initial attempts to solve these challenges have demonstrated the added value of model-
based tools in terms of accelerating the development process and increasing robustness
during scale-up [24]. Nevertheless, the existing solutions are mostly limited to single-strain
applications due to the complexity of the used mechanistic models and the difficulty of
identifying the parameters for a large number of strains at the same time [25]. Therefore,
screening approaches often use simple black-box models for the microorganisms, which do
not allow a detailed comparison of their phenotypes.
This contribution proposes an advanced conditional screening design framework and its
integration into an autonomously working robotic facility. To achieve this, (i) a macro-kinetic
model of the central carbon flux of Escherichia coli is defined that can describe the phenotypes
of all clones, (ii) a parameter estimation is carried out to cover a characteristic parameter set
that describes the individual phenotype and, (iii) based on the unique models, the process is
(re)defined in a dynamic process redesign approach as an adapted modelling framework. By
this, we not only gain a robust and accurate prediction of the characteristics of each clone but
can also quantify and confidently compare their performances. Finally, the method is applied
in an online model calibration framework to adaptively define individual optimal feed start and
feeding strategies.
During the parallel cultivation of this study, the adaptive framework for conditional screening
experiments recursively executes the following steps: (i) collection of cultivation data, (ii)
selection of an identifiable parameter (sub)set (sensitivity analysis) for each clone, (iii)
estimation of kinetic parameters for each clone, (iv) updating of the optimal feeding profiles
and (v) transfer of the new feeding profiles to the database (Figure 1). As a proof of concept,
parallel screening experiments with eight different clones, including six knockout mutants of
E. coli K-12, are conducted in 24 mini-bioreactors. At the start of the experiment, virtually no
information on the growth behavior of all these strains was available, as it is common in early
conditional screening. From the generated data (of all 24 parallel experiments), it was possible
to identify 13 model parameters for all clones, with sufficient accuracy to discriminate the

Accelerating biological screenings through the combination of high-throughput and modeling
63
4.
3 Paper III - Automated Conditional Screening of Multiple Escherichia coli …
performance between the clones.
Figure 1: Illustration of the model calibration cycle in the adaptive framework for conditional screening experiments. The cultivation of the clones is performed on the cultivation and analysis platform (consisting of two liquid handling stations and a mini-bioreactor system); samples are collected and autonomously analyzed. The generated online and at-line measurements are sent to the central data storage (database). The model calibration cycle starts with the collection of all available data. Based on the measurements, the sensitivity analysis is performed; based on the results, the identifiable parameters are selected, and non-identifiable parameters are not considered/fixed in the subsequent parameter estimation. In the parameter estimation, the identifiable parameter subset is adjusted to fit the model to the measurements. Based on the calibrated model, the feed is calculated during the feed calculation step, according to previously defined criteria. The feed is further converted into corresponding pulses with individual times. These time/pulse setpoints are stored in the database and executed directly by the cultivation and analysis platform.
4.3.2 Materials and Methods
4.3.2.1 HTBD facility
The high-throughput bioprocess development facility is composed of two liquid handling
stations (LHS, Freedom Evo 200, Tecan, Switzerland; Microlab Star, Hamilton, Switzerland)
and a mini-bioreactor system (48 BioReactor, 2mag AG, Munich, Germany), which is mounted
on the Tecan LHS. Both LHSs are connected at the hardware and software level to exchange
samples, process and measurement information (Figure 2). The process control (e.g., feed,
pH control and volume balance) is carried out by the LHSs in a pulsed based manner. A
detailed description of the used hardware and software framework is given in Haby et al. 2019
[17].

Accelerating biological screenings through the combination of high-throughput and modeling
Paper III - Automated Conditional Screening of Multiple Escherichia coli … 64
Figure 2: Schematic description of the high-throughput bioprocess development facility used in this study. Composition of the two liquid handling stations (LHS, 1 and 2) and a mini-bioreactor system (3). The liquid handling stations are connected by a linear transfer unit (4) for automatic sample exchange. The facility is surrounded by supporting laboratory equipment (5–8), all accessible by one of the liquid handling stations.
4.3.2.2 Cultivation
Precultures were performed with EnPresso B (Enpresso GmbH, Berlin, Germany) medium
with 9 U L−1 Reagent A at 37 °C in a 24-multi-well Oxodish plate to keep the cells in the growth
phase (PreSens GmbH, Regensburg Germany). The main culture was started as a batch
culture at 37 °C with 5 g L−1 glucose. The initial batch phase was prolonged after 1 h by an
additional feed pulse to a final concentration of 5 g L−1 glucose. The stirrer speed was kept
constant at 3000 rpm. After the end of the batch phase, a fed-batch was started with a pulse-
based glucose feeding every 5 min of feed solution 400 g L−1 glucose dissolved in deionized
water. The feeding rate was increased exponentially and switched to a constant feed when the
maximum pulse volume of 22 µL was reached. In total, the cultivations were carried out over
8 h with fed-batch phases of 5.4 to 6.1 h, depending on the length of the clone-specific batch
phases. The µset for the exponential feed was chosen to be 50% of the model-predicted µmax
value and was adapted in every modelling cycle for each clone. The volume of the feed pulses
was determined on the basis of the calculated feed rate. All experiments were carried out as
biological triplicates.

Accelerating biological screenings through the combination of high-throughput and modeling
65
4.
3 Paper III - Automated Conditional Screening of Multiple Escherichia coli …
4.3.2.3 Sampling and Analytic
During the cultivations, pH and dissolved oxygen tension (DOT) were measured online in
the mini-bioreactor system. Each column of the bioreactor system was sampled every 45 min
in a sequential mode with a sampling interval of 15 min. Samples were inactivated directly with
NaOH and stored in 96-well plates at 4 °C on the deck of the LHS until further processing [20].
After 5 samplings, the sampling plates were automatically transferred to the Hamilton LHS for
OD600, glucose and acetate measurements in 96-well plates [17]. For the OD600
measurements, the samples were diluted to remain in the linear range. The dilution factor was
adjusted between 20 and 100 over the course of the cultivation process. All OD600 values were
multiplied by a correction factor of 2.62 to convert the values to a liquid height of 1 cm. Based
on the OD600 measurements, the dry cell weight of the biomass was calculated by multiplying
the OD600 by 0.33 [26]. Due to the time-consuming sampling and analysis procedure, the
values for biomass, glucose and acetate were written to the database with a delay of 0.25–
1.35 h for the biomass and 0.66–2 h for glucose and acetate, depending on the column of the
bioreactor system where the sample was taken.
During the eight hours of cultivation, for each reactor, 1440 values for DOT and pH were
collected, as well as 23 samples for biomass (OD600), 20 for glucose and 20 for acetate
measurements. This yields, in total, for each reactor, 1503 data points. Considering three
replicates, the size of the parameter sensitivity matrix is (1503 𝑥 18) ∗ 3
(measurements x parameter) * replicates).
4.3.2.4 Strains
The used strains in this study were E. coli K 12 W3110 (F- lambda- IN(rrnD-rrnE)1 rph-1),
E. coli K 12 BW25113 (F-, DE(araD-araB)567, lacZ4787(del)::rrnB-3, LAM-, rph-1, DE(rhaD-
rhaB)568, hsdR514) and six knockout strains obtained from the NBRP at the National Institute
of Genetics, Shizuoka, Japan (Keio collection [35]), namely E. coli BW25113-JW0554-KC
(ΔompT), E. coli BW25113-JW3975-KC (ΔaceA), E. coli BW25133-JW1907-KC (ΔfliA), E. coli
BW25133-JW2076-KC (ΔgatC), E. coli BW25113-JW2082-KC (ΔgatZ), E. coli BW25133-
JW2943-KC (ΔglcB).
4.3.2.5 Computational methods
The E. coli macro-kinetic growth model [25] consists of 5 ordinary differential equations,
describing biomass, glucose, acetate, oxygen and enzymatic glucose release, and represents
the major extracellular dynamics of E. coli, including the acetic acid overflow. The model
contains 18 parameters, from which 13 have been shown to vary with clones and cultivation
conditions. All computational methods related to the model calibration and feed calculation

Accelerating biological screenings through the combination of high-throughput and modeling
Paper III - Automated Conditional Screening of Multiple Escherichia coli … 66
were carried out in MATLAB (The MathWorks, Inc., Natick, Massachusetts, USA), available at
https://gitlab.tu-berlin.de/hts_modelling/ModellingFramework. The commit used for this study
is efaee5eba813237860264fc33ba79315eef5bbca. Cultivation time and data for the different
sequential tasks are summarized in Table 1. All measurements used for the parameter
estimation are available in Table S1.
Table 1: Underlying data, i.e. number of analysis of sensor data, for the parameter
estimates of one biological triplicate.
Sequential task # Cultivation time [h] Available measurements
DOT Biomass Glucose Acetate
1 1.38 321 6 0 0 2 1.88 411 16 0 0 3 2.55 531 16 10 10 4 3.52 705 26 10 10 5 3.93 780 26 20 20 6 5.17 999 36 20 20 7 5.94 1137 36 30 30 8 6.91 1311 46 30 30 9 7.66 1440 46 40 40
4.3.2.6 Parameter estimation
The parameter estimation problem is solved for a reduced (identifiable) parameter subset.
This subset is updated in each model calibration cycle in Table 1 and is selected based on the
local sensitivity matrix [28]. In doing so, the model calibration updates both the identifiable
parameter subset and corresponding parameter values. This approach is useful as the
information content in the data increases with each cycle. The algorithm implements a
stepwise forward selection of parameters to be included in the estimation problem based on
the dynamical parameter sensitivities. Identifiable parameters are selected by a ranking of all
parameters according to linear independence and an analysis of the matrix rank condition of
the sensitivity matrix.
The parameter estimation is formulated as the following optimization problem:
𝜃 ≔ argmin𝜃
Φ(𝑈, 𝜃) (1)
where the objective function reads:
Φ(𝑈, 𝜃) ≔ ∑1
𝑁𝑖
5
𝑖=1
∑(𝑦𝑖,𝑗(𝑈, 𝜃) − 𝑦𝑖,𝑗𝑚)2
𝑁𝑖
𝑗=1
(2)
where 𝑦𝑖,𝑗(𝑈, 𝜃) are the simulated, and 𝑦𝑖,𝑗𝑚 are the corresponding measured states. The
index 𝑖 = 1, … ,5 indicates the measured variables and the index 𝑗 = 1, … , 𝑁𝑖 indicates
individual data points. The CVODES solver in SUNDIALS [29] is used to solve the ODE system
and the interior-point algorithm is used for optimisation (MATLAB fmincon). Initial values and

Accelerating biological screenings through the combination of high-throughput and modeling
67
4.
3 Paper III - Automated Conditional Screening of Multiple Escherichia coli …
lower and upper bounds of the parameter estimation (PE) are based on experts’ knowledge
and summarized in Table S2.
4.3.2.7 Monte Carlo Simulation
Parameter distribution and pairwise correlations are determined by Monte Carlo simulations
based on the last dataset (n = 500) and with the identifiable parameter set based on the subset
selection. Monte Carlo simulations were carried out with σ = 0.15 for biomass, glucose and
acetate and with σ = 0.05 for DOT.
4.3.2.8 2.5.3. Feed Calculation
The exponential feed was calculated using the standard fed-batch equation [30], which was
adapted to consider a pulse-based profile. Since the feed in a fed-batch process is the only
major volume-changing factor, volume changes due to sampling are neglected at this point
and the volume change could be described as
∫ 𝑑𝑉
𝑉
𝑉0
= 𝐹0 ∫ 𝑒µ𝑠𝑒𝑡⋅𝑡𝑑𝑡
𝑡
𝑡0=0
=𝐹0
µ𝑠𝑒𝑡
𝑒µ𝑠𝑒𝑡⋅𝑡|0𝑡 (3)
With µ𝑠𝑒𝑡 [ℎ−1]as the predefined specific growth rate, 𝐹0 [𝑔 𝐿−1] is the initial feed rate and time
𝑡 [ℎ]. The pulse volume is calculated as
𝑉 = 𝑉0 +𝐹0
µ𝑠𝑒𝑡
(𝑒µ𝑠𝑒𝑡⋅𝑡 − 1) (4)
with
𝐹0 =µ𝑠𝑒𝑡
𝑌𝑋𝑆⁄ ∗ 𝑆𝑖
𝑋0 𝑉0 (5)
where 𝑌𝑋𝑆⁄ [𝑔 𝑔𝑥
−1] is the yield coefficient of glucose per biomass, 𝑆𝑖 [𝑔 𝐿−1] is the glucose
concentration in the feed solution, 𝑋0 [𝑔] the biomass concentration and 𝑉0 the volume at the
feed start. Volume manipulations by the pipetting robot (e.g. volume balancing, sampling, base
addition for pH control) are considered in the feed calculation apart of the equations above.
Biomass and volume for the calculation of 𝐹0 (Equation 5) were estimated by simulations
based on the last calibrated model. The end of the batch phase was defined as the time point
where the predicted glucose and acetate concentrations were below 0.02 g L−1, but not later
than 45 min after the depletion of glucose.

Accelerating biological screenings through the combination of high-throughput and modeling
Paper III - Automated Conditional Screening of Multiple Escherichia coli … 68
4.3.3 Results
Eight different E. coli K-12 clones were cultivated in parallel with an industrial process-
relevant feeding design consisting of batch, exponential fed-batch and constant feed phases.
The feed was applied as pulses to expose the cells to inhomogeneities similar to those in large-
scale bioreactors.
4.3.3.1 Parallel cultivation
The length of the batch phase varied among the clones and lasted 1.65 h for E. coli W3110
(the fastest growing clone) and 1.86 h for E. coli BW25113 ΔglcB (the slowest growing clone).
After the end of the batch phase, the feed was automatically started. Due to the pulse nature
of the feed procedure, the feed start is visible through the oscillating DOT values (Figure 3a).
These oscillations, as well as the glucose at-line data, prove that glucose limitation was
maintained during the fed-batch phase in all cultivations. Furthermore, no significant acetate
accumulation was observed (Figure 3b). The cultivations show a low variance between
triplicates, which is obvious from the online DOT and pH profiles as well as from the
automatically analyzed biomass, glucose and acetate values. As expected, the pH decreased
during the batch phase and started to increase after glucose depletion (typically caused by
acetate consumption). During each glucose pulse cycle, a perturbation of pH is observed,
which is caused by the transient production of acetic acid (Figure 3c). Finally, a small increase
in pH was observed after the switch to constant pulse-based feed.
4.3.3.2 Prediction of Batch and Feed start
After inoculation, samples for biomass were taken and, together with the initial parameter
set, served as the basis for the first prediction of the batch phase, feed start and feed rate
(Figure 4a, black dashed line). The difference in the initial biomass between the clones led to
different simulation results and different predicted batch phases prior to the first model
calibration. After the second biomass measurement, the first model calibration cycle was
initiated after 1.4 h of batch cultivation and the feed start and rate were re-computed using the
updated models. From that time onwards, the model calibration cycle was started after each
entry of new at-line data (biomass or glucose/acetate). The end of batch was defined as the
time point at which glucose as well as acetate (produced during overflow growth) were
depleted (Table 2). Therefore, the fed-batch phase in our cultivations started purposely later
compared to typical fed-batch processes, which are mostly started when glucose is depleted
and the DO signal increases. Note that feeding was started only when acetate had been
metabolized. This prevent possible overfeeding with glucose by co-metabolism of the
remaining acetate and thus allowed a higher process stability.

Accelerating biological screenings through the combination of high-throughput and modeling
69
4.
3 Paper III - Automated Conditional Screening of Multiple Escherichia coli …
Figure 3. Cultivation data of all strains. Clones from top to bottom: E. coli W3110; E. coli BW25113; E. coli BW25113 ΔompT; E. coli BW25113 ΔaceA; E. coli BW25113 ΔfliA; E. coli BW25113 ΔgatC; E. coli BW25113 ΔgatZ; E. coli BW25113 ΔglcB. (a) DOT (%): solid lines, pH: dotted lines. (b) Biomass (g L−1): red dots; glucose (g L−1): purple dots; acetic acid (g L−1): brown dot. (c) Illustration of the oscillating pH values with each glucose pulse. The figure shows the section marked in (a) red. An interactive version of (a,b) is available at http://www.bioprocess.tu-berlin.de/fileadmin/fg187/Publications/Hans_2020/fig2.html.

Accelerating biological screenings through the combination of high-throughput and modeling
Paper III - Automated Conditional Screening of Multiple Escherichia coli … 70
Figure 4: Illustration of the results of the sequential tasks 1 to 3 for the cultures of E. coli BW25113 ΔglcB. (a): Comparison of parameter estimation results at different times during the cultivation, the initial parameter set and the measurements for strain E. coli BW25113 ΔglcB; (b): Results for computed feeding profiles after the sequential task 1-3 as cumulative volume.
Table 2: Batch end prediction overview: initial, adjusted (parameter estimation after 1:52 hour) and observed times for consumption of glucose and acetate and the actual feed start based on the first executed glucose pulse.
Strain
Glucose consumption (hh:mm) Acetate consumption (hh:mm) Feed start (hh:mm)
initial adjusted Observed initial adjusted
observed
E. coli W3110 01:46 01:40 01:39 ± 00:01 02:03 01:48 01:48 01:55
E. coli BW25113 01:52 01:38 01:49 ± 00:03 02:00 03:02 > 02:23 02:23
E. coli BW25113 ΔompT 01:46 01:40 01:40 ± 00:01 01:53 03:05 02:10 02:23
E. coli BW25113 ΔaceA 02:13 02:11 01:48 ± 00:21 02:22 03:06 > 02:37 02:37
E. coli BW25113 ΔfliA 01:51 01:36 01:42 ± 00:01 01:59 02:13 02:07 02:16
E. coli BW25113 ΔgatC 01:49 01:39 01:46 ± 00:05 01:57 02:50 02:25 02:30
E. coli BW25113 ΔgatZ 01:46 01:43 01:43 ± 00:01 01:55 03:03 > 02:09 02:09
E. coli BW25113 ΔglcB 01:55 01:56 01:51 ± 00:03 02:03 02:24 02:30 02:37
Figure 4a illustrates the outcome of the model calibration cycle during the batch phase, with
the example of the E. coli BW25113 ΔglcB cultivation data (grey cross) and simulations after
model calibration (blue line). It is obvious that the first parameter estimate indicates, for this
strain, a slower growth compared to the initial parameter set. However, with each model
(a)
(b)

Accelerating biological screenings through the combination of high-throughput and modeling
71
4.
3 Paper III - Automated Conditional Screening of Multiple Escherichia coli …
calibration cycle, the computed growth rate (µmax) increased from 0.36 h−1 at t1 to 0.58 h−1 at t2
and up to 0.82 h−1 at the third shown model calibration cycle. The fit to the cultivation data is
improved with each modelling cycle and the trend of the cultivation is well represented, at least
after the third modelling cycle.
In addition, due to the underestimated µmax, the first model calibration cycle failed to propose
the end of the batch phase properly. An accurate estimation of the specific glucose uptake rate
is only reached after the first glucose measurements are available, but then the estimation is
very precise. Although the glucose depletion is equally estimated in the third model calibration
cycle (1.94 h) and in the initial, unadjusted model (1.92 h; Figure 4a, black dashed line), the
feed (Figure 4b) started 21 min later (calibrated model: 2.40 h; initial model: 2.01 h). This is
due to differences in the production and consumption rates of acetate, resulting in different
starting times of the fed-batch phase. Based on the DOT profiles, acetate is consumed after
2.5 h; this also corresponds well with the at-line measurements of E. coli BW25113 ΔglcB in
Figure 3.
The predicted end of the batch phase is very close to the observed one in all cultivations,
even after the second model calibration and 1.5 h of cultivation (Table 2). For some
cultivations, the time of glucose depletion was predicted with an accuracy of less than one
minute (E. coli BW25113 ΔgatZ). In the worst case, the glucose depletion was predicted 22.8
min too late (E. coli BW25113 ΔaceA). A missed batch end and even a short starvation phase
could lead to unwanted metabolic reactions by the clone and influence the process and product
quality. However, with this triplicate, the variance of glucose uptake is very high, because with
one triplicate, the glucose consumption is clearly leading (Figure 3a). Without the leading one,
the gap between predicted and observed glucose depletion is significant lower. Nevertheless,
a difference of 22 min is still in an operational range for conditional screening. Due to
operational reasons, the model calibration with all clones was maintained. The overall mean
difference between the observed and predicted glucose depletion is 6.9 min for the calibrated
model after 1.5 h and, thus, better, compared to the initial model with a mean prediction error
of 7.3 min.
Complete consumption of acetate was only observed for five of the eight clones. For all
these clones, the adjusted model predicted the acetic acid consumption to better compare to
the initial model, with the exception of E. coli BW25113 Δomp. Complete consumption of acetic
acid was not observed for three clones because of the time-dependent restrictions in the feed
start (maximum tolerance between end of glucose depletion and feed start; see Section 2.5.3).
Nevertheless, for these three clones, the initial model predicted a faster, and the adjusted
model, a slower, acetic acid consumption rate. The times of the first feed pulse are summarized
in Table 2 (feed start); the predicted end of batch and the first pulse may differ due to technical

Accelerating biological screenings through the combination of high-throughput and modeling
Paper III - Automated Conditional Screening of Multiple Escherichia coli … 72
reasons (delay in computation or first pulses are calculated with 0 µL due to the minimal
pipetting volume restrictions).
4.3.3.3 Feed and fed-batch
During the fed-batch phase, the size of the feed pulses is re-computed during each model
calibration cycle. The maximal glucose uptake rate was determined as basis for the new feed
rates. However, the biomass concentration and the substrate yield coefficient (𝑌𝑋/𝑆) have a
major impact on the initial feed rate (𝐹0) and influence the feed as well. With the exception of
E. coli BW25113 ΔglcB (Figure 5h), the first feed rate (grey bars) was higher than the following
calculated feed pulses. However, the second applied feed rates for E. coli BW25113 ΔompT,
E. coli BW25113 ΔfliA and E. coli BW25113 ΔgatZ (Figure 5c,d,f) were close to the initial feed
rates, indicating only a minor parameter drift, but were reduced in the later model calibration
cycles. In the case of E. coli BW25113 ΔglcB, the second feed was somewhat higher than the
later one, which is reflected in both the initial feed rate and in the slope of the feed (all feed
pulses are summarized in Figure 5). Feed pulses were calculated by the optimization algorithm
for each clone and applied to all biological triplicates. In this way, eight different feeding rates
were calculated and 24 cultivations were carried out in parallel.
Figure 5. The applied feed and scheduled feeds for each clone between cultivation hours 2 and 5. Black dots: the applied feed based on the real executed feed, logged by the LHS. Light grey bars: scheduled feed at feed start. Colored bars: scheduled feeds in the following modelling cycles; the color change indicates the next modelling cycle. (a) E. coli W3110; (b) E. coli BW25113; (c) E. coli BW25113 ΔompT; (d) E. coli BW25113 ΔaceA; (e) E. coli BW25113 ΔfliA; (f) E. coli BW25113 ΔgatC; (g) E. coli BW25113 ΔgatZ; (h) E. coli BW25113 ΔglcB.
4.3.3.4 Parameter estimation
During all model calibration cycles, the model parameters are estimated on the basis of all
available data (Table S1), i.e., all data which were collected from the start of the cultivations to
(e)
(a) (b) (c) (d)
(f) (g) (h)

Accelerating biological screenings through the combination of high-throughput and modeling
73
4.
3 Paper III - Automated Conditional Screening of Multiple Escherichia coli …
the actual time point. For all clones, the measurements and dynamics of cultivation are well
represented in the simulation of the calibrated model, as illustrated in Figure 6 for the strain
E. coli BW25113 ΔglcB (last modelling cycle; for the other strains, see supplementary Figures
S1–S7). In contrast to the calibrated model, the initial model overestimated the biomass
formation. This trend could be observed for all strains, with the exception for E. coli BW25113
(Figure S2). The DOT measurements indicate a slower glucose uptake rate than predicted in
the last modelling cycle. A lower maximal specific glucose uptake rate (qSmax) was calculated
in the first two modelling calibration cycles compared to the later ones (Figure 7). In the first
two model calibration cycles, no glucose measurements were available due to the time delay
in the at-line analytics. The prediction error of acetic acid was decreased in the batch and fed-
batch phase after model calibration. The cultivation dynamics of all cultivation measurements
are well represented by the calibrated model. The parameters to be adjusted in each model
calibration cycle are selected by the included subset selection (sensitivity analysis, Figure 1).
The parameters Kap, kLa and qm are not adjusted in one model calibration cycle. This means
that the underlying measurement data are not sufficient to determine these model parameters
with sufficient certainty, not even in the last model calibration cycle. The model parameters Ko,
Ksq, Yofm and Yoresp are only partly selected for parameter estimation (Figure 7, filed dots). Within
the subset selection model parameters can influence other’s parameter sensitivity if they have
dependencies to each other. Accordingly, the selection of one parameter may lead to a lower
sensitivity of another one and the latter may be excluded from the subset selection although it
was active in previous cycles. All parameter subsets and parameter values are summarized in
the Supplementary Tables S3–S10. Regularization of parameter estimation using a subsets
selection method (López et al., 2013) was used to ensure a meaningful parameter set and to
avoid non-physiological model calibrations..

Accelerating biological screenings through the combination of high-throughput and modeling
Paper III - Automated Conditional Screening of Multiple Escherichia coli … 74
Figure 6. Model for E. coli BW25113 ΔglcB after the last model calibration cycle and at the beginning of the experiment. Solid line: calibrated model; dashed line: initial model; dots: measurements.
Figure 7: Adjusted parameters of the time for each E. coli strain: Parameters are normalized to the initial value and scaled to three times the standard derivation. Filled dots: parameter fixed by the subset selection; open dots: estimated parameter.
Monte Carlo simulations have been shown to give a good insight into actual, non-linear
parameter distribution (Krausch et al., 2019) and were therefore performed to gain a better
understanding of the parameter correlation and its variances. In Figure 8, the parameter
distributions for E. coli BW25113 ΔglcB (last model calibration cycle) are shown based on
Monte Carlo simulations. The correlation between all parameters is very weak. Only Kaq and
Ksq showed a correlation with qAmax. The model parameters Kaq and Ksq are the affinity
constants for acetate and glucose uptake, respectively, and a dependence to the maximal
acetate uptake rate (qAmax) cannot be avoided in the model. The high significance of each
parameter is indicated by a narrow distribution in Figure 8 as well as low variation for the most
important model parameters (Table 3), especially for the model parameters Yem, qSmax and
Yosresp. Normal distribution is given for all parameters except for Yam. This parameter is quite
close to the lower bound of the previously defined solution space (lower and upper parameter

Accelerating biological screenings through the combination of high-throughput and modeling
75
4.
3 Paper III - Automated Conditional Screening of Multiple Escherichia coli …
bound). It is noted that this situation should be avoided as it might reduce the accuracy of the
parameter estimates.
Figure 8. Monte Carlo parameter estimation: pair plots of the 500 best Monte Carlo parameter estimation results and with the identifiable parameter set based on the dataset for E. coli BW25113 ΔglcB during the last modelling cycle. Monte Carlo simulations were carried out with σ = 0.15 for biomass, glucose and acetate and with σ = 0.05 for DOT.
Table 3: Values, variance and relative variance of the adjusted parameters for all clones
after the final model calibration cycle.
In the present work, eight strains were examined in 24 successful cultivations. The end of
glucose uptake was, in part, predicted with small errors of less than one minute, thanks to the
iterative model calibration cycle. The feed start was automatic and in an operable acceptable
time window using the dynamic process redesign as defined in the model calibration cycle.

Accelerating biological screenings through the combination of high-throughput and modeling
Paper III - Automated Conditional Screening of Multiple Escherichia coli … 76
The model parameter sets estimated are always unique and with a physiological meaning,
even with very little data in the initial phase of this study, e.g., the first 3 h of cultivation. This
is ensured by the built-in subset selection and is proven by the Monte Carlo simulations made
afterwards.
4.3.4 Discussion
In this study, we presented a computational framework able to design and operate parallel
E. coli cultivations without human supervision. The results demonstrate that a robust operation
tailored to each specific clone is possible through an adaptive input design. Undesired
experimental conditions (e.g., overfeeding and starvation) are avoided while sufficient
information to allow a confident discrimination of the clones is generated. Both start time and
feed rate were accurately predicted for each one of the eight clones, using feedback
information from online and at-line cultivation measurements. This is essential in an
experimental facility aimed to perform screening cultivations for clones whose phenotype is
not known beforehand. The relevance of an adaptive and specific experimental design can be
seen in this case study. As illustrated in Figure 9, despite the fact that the clone characteristics
differ only minimally from each other, an experiment with a fixed start time and feeding rate
would have violated important experimental constrains (here, overfeeding).
Figure 9. In-silico comparison of different clones; simulation based on last modelling cycle parameter set. Initial values: glucose 10 g L−1; biomass 2 g L-1. Solid line: E. coli BW25113; dashed line: E. coli BW25113 ΔgatZ. Feed start is simulated at 2.3 h; µset is fixed at 0.5 h−1. If the feed start and rate are only adjusted to one strain, the cultivation of the ΔgatZ mutant would lead to overfeeding.
Additionally, the use of a macro-kinetic growth model that describes the main extracellular
dynamics of E. coli was shown to be sufficient, even though it is insufficient to describe the
complex nonlinear dynamics of the bioprocess and the different genotypes of the clones. The
adaptive nature of the framework ensures a proper prediction within the current horizon and is
sufficient to assure a robust operation of the cultivations. On average, the predicted feed start
differed by less than 10 min for the optimal one, which is in an acceptable range and is mainly
caused by unobserved disturbances in the system. If necessary, the mismatch can be further

Accelerating biological screenings through the combination of high-throughput and modeling
77
4.
3 Paper III - Automated Conditional Screening of Multiple Escherichia coli …
reduced by increasing the frequency of model calibration. Furthermore, the framework
provides all necessary parameters and actions to define a wide range of alternative feet start
triggers (e.g., glucose reduction or acetate consumption).
As expected, the parameter variance in general decreases with every model calibration
cycle. After the cultivation, the parameter distribution is generally very narrow. This is also
reflected in the small deviations of the simulation results of the Monte Carlo studies (Figure
10) and demonstrates the value of the parameters for further in-silico studies. Important
parameters, such as maximum glucose uptake (qSmax), can be distinguished with statistical
significance and used for clone discrimination (Figure 7, Table 3). In this study, E. coli
BW25113 ∆ompT had the largest qSmax value and E. coli BW25113 ∆gatZ the lowest one.
However, some parameters could not, or only with insufficient confidence, be identified. This
hampered a distinction of some essential parameters, such as the maximal acetate uptake
rate (qAmax). Furthermore, parameter identifiability can be increased in future applications
using methods for optimal experimental design (OED) [20,32,33] or enhanced parameter
identifiability analysis [34–36].
Figure 10: . Model uncertainty based on parameter standard deviation. Monte Carlo simulation: results of 1000 parameter estimates based on in-silico data. In-silico data were generated based on the last data set for E. coli BW25113 ΔglcB and by a random σ of 0.15 for biomass, glucose and acetate and a σ of 0.05 for DOT.
The frequency of the parameter estimation was defined based on the availability of at-line data
(biomass, glucose and acetate), and as expected, the at-line data are decisive to achieve model
identifiability. Still, the results show that especially parameters related to glucose consumption can be
identified using only the online DOT signal. This shows that, even though in a significantly limited
manner, the framework can also be used to increase the robustness of robotic facilities that do not have
embedded at-line analytics. This significantly reduces the operative effort of the experimental setup.
The glucose consumption rate seems to be observable from the DOT signal, by which a reduced version

Accelerating biological screenings through the combination of high-throughput and modeling
Paper III - Automated Conditional Screening of Multiple Escherichia coli … 78
of the macro-kinetic model could be used to build an observer-based feeding control. Finally, we also
demonstrated that the length of the batch phase is essential to assure sufficient data before the start of
the feeding so as to allow a reliable operation of the following phases.
Some parameters drift over time or change rapidly between batch and fed-batch (Figure 7).
This could be related to the increasing information content of the growing data set and the
resulting addition of previously neglected model parameters to the subset selection. However,
the variations in the parameters caused by intracellular changes in the metabolic machinery
together with heterogeneous mutations in the population [37] are not represented in the model
and could also cause such parameter changes. Such uncovered intracellular changes may
also explain the apparently poor representation of the batch phase in the last model calibration
cycle compared to earlier ones. Therefore, an iterative recalculation of the feed is necessary
to cope with disturbances in the experiments and inaccuracies in the model prediction. Moving
horizon approaches can also increase the model prediction accuracy by allowing different
parameter sets in different cultivation phases for a single clone [38].
4.3.5 Conclusions
The operation of robotic experiments with multiple fed-batch cultivations in parallel is very
challenging even for skilled operators, since many decisions and tasks are needed at the same
time. In this work, we present an adaptive framework for conditional screening for parallel fed-
batch experiments, aiming to identify the best candidate strain for industrial scale
biomanufacturing. We demonstrate that the use of a macro-kinetic growth model in an adaptive
framework using online and at-line data information in a feedback loop is necessary to:
1.) Design a specific strategy for each different clone of the conditional screening experiment.
2.) Increase the robustness of the robotic operation against experimental disturbance.
3.) Give an approximation of the reliability of the simulation results with respect to production
scale performance.
To our knowledge, this is the first successful model-based operation of 24 fed-batch
cultivations with as many as eight different clones in parallel including its characterization,
sufficient for clone discrimination. The results clearly demonstrate the capabilities of the
framework to increase the efficiency of combined mini-bioreactor systems with liquid handling
stations to drastically reduce the experimental time, efforts and failure rate in high-throughput
bioprocess development.
Supplementary Materials:
The following are available online at www.mdpi.com/xxx/s1, Table S1: all experimental
measurements used for the modelling cycles; Table S2: initial parameter values, upper and
lower bounds and units; Table S3: parameter subsets and values for E. coli W3110; Table S4:
parameter subsets and values for E. coli BW25113; Table S5: parameter subsets and values

Accelerating biological screenings through the combination of high-throughput and modeling
79
4.
3 Paper III - Automated Conditional Screening of Multiple Escherichia coli …
for BW25113 ΔompT; Table S6: parameter subsets and values for BW25113 ΔaceA; Table
S7: parameter subsets and values for BW25113 ΔfliA; Table S8: parameter subsets and
values for BW25113 ΔgatC; Table S9: parameter subsets and values for BW25113 ΔgatZ;
Table S10: parameter subsets and values for BW25113 ΔglcB; Figure S1: Comparison of
measurement and simulation for E. coli W3110; Figure S2: Comparison of measurement and
simulation for E. coli BW25113; Figure S3: Comparison of measurement and simulation for E.
coli BW25113 ΔompT; Figure S4: Comparison of measurement and simulation for E. coli
BW25113 ΔaceA; Figure S5: Comparison of measurement and simulation for E. coli BW25133
ΔfliA; Figure S6: Comparison of measurement and simulation for E. coli BW25133 ΔgatC;
Figure S7: Comparison of measurement and simulation for E. coli BW25113 ΔgatZ.
Funding
The authors acknowledge financial support by the German Federal Ministry of Education
and Research (BMBF) within the European program EraSysApp (grant number: 031L0018A,
Leanprot project), which is managed by the Project Management Agency Jülich (PTJ).
Acknowledgments
We would like to thank Robert Giessmann and Terrance Wilms for their programming and
modelling support. We acknowledge support by the Open Access Publication Fund of TU
Berlin.
Conflicts of Interest
The authors declare no conflict of interest.
4.3.6 References
1. Dusny, C.; Grünberger, A. Microfluidic single-cell analysis in biotechnology: from
monitoring towards understanding. Curr. Opin. Biotechnol. 2020, 63, 26–33,
doi:10.1016/j.copbio.2019.11.001.
2. Leavell, M.D.; Singh, A.H.; Kaufmann-Malaga, B.B. High-throughput screening for
improved microbial cell factories, perspective and promise. Curr. Opin. Biotechnol.
2020, 62, 22–28, doi:10.1016/j.copbio.2019.07.002.
3. Bunzel, H.A.; Pi, X.G.; Pott, M.; Hilvert, D. Speeding up enzyme discovery and
engineering with ultrahigh-throughput methods. Curr. Opin. Struct. Biol. 2018, 48, 149–
156, doi:10.1016/j.sbi.2017.12.010.
4. Nicolaou, S.A.; Gaida, S.M.; Papoutsakis, E.T. A comparative view of metabolite and
substrate stress and tolerance in microbial bioprocessing: From biofuels and
chemicals, to biocatalysis and bioremediation. Metab. Eng. 2010, 12, 307–331,
doi:10.1016/j.ymben.2010.03.004.

Accelerating biological screenings through the combination of high-throughput and modeling
Paper III - Automated Conditional Screening of Multiple Escherichia coli … 80
5. Crater, J.S.; Lievense, J.C. Scale-up of industrial microbial processes. FEMS Microbiol.
Lett. 2018, 365, 1–5, doi:10.1093/femsle/fny138.
6. Delvigne, F.; Takors, R.; Mudde, R.; Van Gulik, W.; Noorman, H. Bioprocess scale-
up/down as integrative enabling technology: from fluid mechanics to systems biology
and beyond. Microb. Biotechnol. 2017, 10, 1267–1274, doi:10.1111/1751-7915.12803.
7. Ho, P.; Westerwalbesloh, C.; Kaganovitch, E.; Grünberger, A.; Neubauer, P.;
Kohlheyer, D.; Von Lieres, E. Reproduction of Large-Scale Bioreactor Conditions on
Microfluidic Chips. Microorganisms 2019, 7, 105,
doi:10.3390/microorganisms7040105.
8. Anane, E.; García, Ángel C.; Haby, B.; Hans, S.; Krausch, N.; Krewinkel, M.;
Hauptmann, P.; Neubauer, P.; Bournazou, M.N.C. A model‐based framework for
parallel scale‐down fed‐batch cultivations in mini‐bioreactors for accelerated
phenotyping. Biotechnol. Bioeng. 2019, 116, 2906–2918, doi:10.1002/bit.27116.
9. Tajsoleiman, T.; Mears, L.; Krühne, U.; Gernaey, K.V.; Cornelissen, S. An Industrial
Perspective on Scale-Down Challenges Using Miniaturized Bioreactors. Trends
Biotechnol. 2019, 37, 697–706, doi:10.1016/j.tibtech.2019.01.002.
10. Hemmerich, J.; Noack, S.; Wiechert, W.; Oldiges, M. Microbioreactor Systems for
Accelerated Bioprocess Development. Biotechnol. J. 2018, 13, 1–25,
doi:10.1002/biot.201700141.
11. Janzen, N.H.; Striedner, G.; Jarmer, J.; Voigtmann, M.; Abad, S.; Reinisch, D.
Implementation of a Fully Automated Microbial Cultivation Platform for Strain and
Process Screening. Biotechnol. J. 2019, 14, 1800625, doi:10.1002/biot.201800625.
12. Kusterer, A.; Krause, C.; Kaufmann, K.; Arnold, M.; Weuster-Botz, D. Fully automated
single-use stirred-tank bioreactors for parallel microbial cultivations. Bioprocess
Biosyst. Eng. 2008, 31, 207–215, doi:10.1007/s00449-007-0195-z.
13. Morschett, H.; Freier, L.; Rohde, J.; Wiechert, W.; Von Lieres, E.; Oldiges, M. A
framework for accelerated phototrophic bioprocess development: integration of
parallelized microscale cultivation, laboratory automation and Kriging-assisted
experimental design. Biotechnol. Biofuels 2017, 10, 26, doi:10.1186/s13068-017-0711-
6.
14. Bareither, R.; Pollard, D. A review of advanced small-scale parallel bioreactor
technology for accelerated process development: Current state and future need.
Biotechnol. Prog. 2010, 27, 2–14, doi:10.1002/btpr.522.
15. Tai, M.; Ly, A.; Leung, I.; Nayar, G. Efficient high-throughput biological process
characterization: Definitive screening design with the Ambr250 bioreactor system.
Biotechnol. Prog. 2015, 31, 1388–1395, doi:10.1002/btpr.2142.
16. Knorr, B.; Schlieker, H.; Hohmann, H.-P.; Weuster-Botz, D. Scale-down and parallel
operation of the riboflavin production process with Bacillus subtilis. Biochem. Eng. J.
2007, 33, 263–274, doi:10.1016/j.bej.2006.10.023.

Accelerating biological screenings through the combination of high-throughput and modeling
81
4.
3 Paper III - Automated Conditional Screening of Multiple Escherichia coli …
17. Haby, B.; Hans, S.; Anane, E.; Sawatzki, A.; Krausch, N.; Neubauer, P.; Bournazou,
M.N.C. Integrated Robotic Mini Bioreactor Platform for Automated, Parallel Microbial
Cultivation with Online Data Handling and Process Control. SLAS Technol. Transl. Life
Sci. Innov. 2019, 24, 569–582, doi:10.1177/2472630319860775.
18. Newton, J.; Oeggl, R.; Janzen, N.H.; Abad, S.; Reinisch, D. Process adapted
calibration improves fluorometric pH sensor precision in sophisticated fermentation
processes. Eng. Life Sci. 2020, 20, 331–337, doi:10.1002/elsc.201900156.
19. Hemmerich, J.; Tenhaef, N.; Steffens, C.; Kappelmann, J.; Weiske, M.; Reich, S.J.;
Wiechert, W.; Oldiges, M.; Noack, S. Less Sacrifice, More Insight: Repeated Low‐
Volume Sampling of Microbioreactor Cultivations Enables Accelerated Deep
Phenotyping of Microbial Strain Libraries. Biotechnol. J. 2018, 14, 1–10,
doi:10.1002/biot.201800428.
20. Bournazou, M.C.; Barz, T.; Nickel, D.; Cárdenas, D.L.; Glauche, F.; Knepper, A.;
Neubauer, P. Online optimal experimental re-design in robotic parallel fed-batch
cultivation facilities. Biotechnol. Bioeng. 2017, 114, 610–619, doi:10.1002/bit.26192.
21. Von Stosch, M.; Willis, M.J. Intensified design of experiments for upstream bioreactors.
Eng. Life Sci. 2016, 17, 1173–1184, doi:10.1002/elsc.201600037.
22. Bayer, B.; Von Stosch, M.; Striedner, G.; Duerkop, M. Comparison of Modeling
Methods for DoE‐Based Holistic Upstream Process Characterization. Biotechnol. J.
2020, 15, e1900551, doi:10.1002/biot.201900551.
23. Hans, S.; Ulmer, C.; Narayanan, H.; Brautaset, T.; Krausch, N.; Neubauer, P.; Schäffl,
I.; Sokolov, M.; Bournazou, M.N.C. Monitoring Parallel Robotic Cultivations with Online
Multivariate Analysis. Processes 2020, 8, 582, doi:10.3390/pr8050582.
24. Delvigne, F.; Goffin, P. Microbial heterogeneity affects bioprocess robustness:
Dynamic single-cell analysis contributes to understanding of microbial populations.
Biotechnol. J. 2013, 9, 61–72, doi:10.1002/biot.201300119.
25. Anane, E.; López C, D.C.; Neubauer, P.; Bournazou, M.N.C. Modelling overflow
metabolism in Escherichia coli by acetate cycling. Biochem. Eng. J. 2017, 125, 23–30,
doi:10.1016/j.bej.2017.05.013.
26. Sauer, U.; Lasko, D.R.; Fiaux, J.; Hochuli, M.; Glaser, R.; Szyperski, T.; WüthrichK.;
Bailey, J.E. Metabolic Flux Ratio Analysis of Genetic and Environmental Modulations
of Escherichia coli Central Carbon Metabolism. J. Bacteriol. 1999, 181, 6679–6688,
doi:10.1128/jb.181.21.6679-6688.1999.
27. Baba, T.; Ara, T.; Hasegawa, M.; Takai, Y.; Okumura, Y.; Baba, M.; A Datsenko, K.;
Tomita, M.; Wanner, B.L.; Mori, H. Construction of Escherichia coli K‐12 in‐frame,
single‐gene knockout mutants: the Keio collection. Mol. Syst. Biol. 2006, 2, 2006.0008,
doi:10.1038/msb4100050.

Accelerating biological screenings through the combination of high-throughput and modeling
Paper III - Automated Conditional Screening of Multiple Escherichia coli … 82
28. López C, D.C.; Barz, T.; Peñuela, M.; Villegas, A.; Ochoa, S.; Wozny, G. Model-based
identifiable parameter determination applied to a simultaneous saccharification and
fermentation process model for bio-ethanol production. Biotechnol. Prog. 2013, 29,
1064–1082, doi:10.1002/btpr.1753.
29. Hindmarsh, A.C.; Brown, P.N.; Grant, K.E.; Lee, S.L.; Serban, R.; Shumaker, D.E.;
Woodward, C.S. SUNDIALS. ACM Trans. Math. Softw. 2005, 31, 363–396,
doi:10.1145/1089014.1089020.
30. Moser, A.; Moser, P.D.A. Haggstrom, Bioprocess Technology: Fundamentals and
Applications; Springer Science & Business Media: New York, NY, USA, 1988,
doi:10.1007/978-1-4613-8748-0.
31. Krausch, N.; Barz, T.; Sawatzki, A.; Gruber, M.; Kamel, S.; Neubauer, P.; Bournazou,
M.N.C. Monte Carlo Simulations for the Analysis of Non-linear Parameter Confidence
Intervals in Optimal Experimental Design. Front. Bioeng. Biotechnol. 2019, 7, 122,
doi:10.3389/fbioe.2019.00122.
32. Barz, T.; Sommer, A.; Wilms, T.; Neubauer, P.; Bournazou, M.N.C. Adaptive optimal
operation of a parallel robotic liquid handling station. IFAC-PapersOnLine 2018, 51,
765–770, doi:10.1016/j.ifacol.2018.04.006.
33. Franceschini, G.; Macchietto, S. Model-based design of experiments for parameter
precision: State of the art. Chem. Eng. Sci. 2008, 63, 4846–4872,
doi:10.1016/j.ces.2007.11.034.
34. Anane, E.; López C, D.C.; Barz, T.; Sin, G.; Gernaey, K.V.; Neubauer, P.; Bournazou,
M.N.C. Output uncertainty of dynamic growth models: Effect of uncertain parameter
estimates on model reliability. Biochem. Eng. J. 2019, 150, 107247,
doi:10.1016/j.bej.2019.107247.
35. Dynamics of Mathematical Models in Biology. Dyn. Math. Models Biol. 2016, 31–41,
doi:10.1007/978-3-319-45723-9.
36. Villaverde, A.F.; Banga, J.R. Structural Properties of Dynamic Systems Biology
Models: Identifiability, Reachability, and Initial Conditions. Processes 2017, 5, 29,
doi:10.3390/pr5020029.
37. Neubauer, P.; Lin, H.Y.; Mathiszik, B. Metabolic load of recombinant protein production:
Inhibition of cellular capacities for glucose uptake and respiration after induction of a
heterologous gene in Escherichia coli. Biotechnol. Bioeng. 2003, 83, 53–64,
doi:10.1002/bit.10645.
38. Jabarivelisdeh, B.; Carius, L.; Findeisen, R.; Waldherr, S. Adaptive predictive control
of bioprocesses with constraint-based modeling and estimation. Comput. Chem. Eng.
2020, 135, 106744, doi:10.1016/j.compchemeng.2020.106744.
© 2020 by the authors. Submitted for possible open access publication under the terms and conditions of the Creative Commons Attribution (CC BY) license (http://creativecommons.org/licenses/by/4.0/).

Accelerating biological screenings through the combination of high-throughput and modeling
83 Paper IV - Monitoring Parallel Robotic Cultivations with Online Multivariate …
4.4 Monitoring Parallel Robotic Cultivations with Online Multivariate Analysis
Processes 2020, 8(5), 582; doi:10.3390/pr8050582, Accepted: 11 May 2020 / Published: 14 May 2020, accepted manuscript Copyright © 2020 by the authors - CC BY 4.0
Sebastian Hans 1*†, Christian Ulmer 1†, Harini Narayanan 2, Trygve Brautaset 3, Niels Krausch 1, Peter Neubauer 1, Irmgard Schäffl 1, Michael Sokolov 4 and Mariano Nicolas Cruz Bournazou 4* 1 Technische Universität Berlin, Institute of Biotechnology, Chair of Bioprocess Engineering,
Ackerstraße 76, 13355 Berlin, Germany 2 ETH Zürich, Department of Chemistry and Applied Biosciences, Institute of Chemical and
Bioengineering, Vladimir-Prelog-Weg 1, CH-8093 Zurich, Switzerland 3 Department of Biotechnology and Food Science, Norwegian University of Science and
Technology, Sem Sælandsvei 6-8, 7491 Trondheim, Norway 4 DataHow AG, c/o ETH Zürich, HCl, F137, Vladimir-Prelog-Weg 1, CH-8093 Zurich, Switzerland * Correspondence: [email protected] (S.H.); [email protected] (M.N.C.B.) † These authors contribute equally to this work.
Abstract: In conditional microbial screening, a limited number of candidate strains are
tested at different conditions searching for the optimal operation strategy in production (e.g.,
temperature and pH shifts, media composition as well as feeding and induction strategies). To
achieve this, cultivation volumes of >10 mL and advanced control schemes are required to
allow appropriate sampling and analyses. Operations become even more complex when the
analytical methods are integrated into the robot facility. Among other multivariate data analysis
methods, principal component analysis (PCA) techniques have especially gained popularity in
high throughput screening. However, an important issue specific to high throughput bioprocess
development is the lack of so-called golden batches that could be used as a basis for
multivariate analysis. In this study, we establish and present a program to monitor dynamic
parallel cultivations in a high throughput facility. PCA was used for process monitoring and
automated fault detection of 24 parallel running experiments using recombinant E. coli cells
expressing three different fluorescence proteins as the model organism. This approach
allowed for capturing events like stirrer failures and blockage of the aeration system and
provided a good signal to noise ratio. The developed application can be easily integrated in
existing data- and device-infrastructures, allowing automated and remote monitoring of parallel
bioreactor systems.
Own Contribution: Conceptualization, Software writing, Validation, Writing original draft, Visualization
Author Contributions: Conceptualization, CU, SH and MNCB; methodology, CU; software, CU and
SH; validation, CU, SH, HN, MNCB and MS; formal analysis, CU; resources, TB, NJK and IS;
investigation, CU; data curation, CU; writing—original draft preparation, CU, HN and SH; writing—review
and editing, MS, TB, MNCB and PN; visualization, CU, NJK and SH; supervision, MS, MNCB and PN;
project administration, PN; funding acquisition, PN

Accelerating biological screenings through the combination of high-throughput and modeling
Paper IV - Monitoring Parallel Robotic Cultivations with Online Multivariate … 84
4.4.1 Introduction
Microbial cell factories are widely used for biotechnological production processes. The
development of effective bioprocesses requires screening of many microbial strains under
various cultivation conditions. State-of-the-art bioprocess development is known to be time
consuming, laborious, and for having a low success rate [1]. Process parameters, such as
microbial host, vector size and copy-number, feeding strategy, and media composition have a
significant impact on the profitability, reliability, and sustainability of the final manufacturing
process. Considering all these factors and evaluating them in relation to each other often calls
for a high number of cultivations. To ensure reliability of data and results, parallel cultivations
providing a number of replicates to compensate for the variance of biological systems are
additionally needed. Many bioprocess conditions are difficult to study due to the lack of suitable
high throughput (HT) facilities to perform all these cultivations in a short time. Consequently,
current process improvement strategies in high throughput bioprocess development (HTBD)
are based on expert knowledge [2] and static design of experiments (DoE) [3,4,5]. In order to
reduce the number of cultivations to an appropriate level, many factors are only partially and
incompletely weighed against each other. On the other hand, emerging technologies such as
automation and digitization enable a faster product development and shorter cycles from
construction of a microbial clone to an optimal bioprocess [6,7,8] by increasing the possible
number of parallel cultivations. Although model-based tools (e.g., for process control or
computer aided design) are the standard in other industries [9,10,11,12], they are rarely used
in bioprocess development despite their big potential [13,14]. A major challenge is the lack of
suitable tractable mathematical models that are required but difficult to develop due to the
complexity of biological systems [15]. This is especially the case for process development,
where knowledge of the new microbial strains is limited and an exhaustive investigation of
mutants likely to be discarded is considered unnecessary.
The difference between process control (batch vs. fed-batch), cultivation system (e.g.,
shake flask, multi well plate or lab scale bioreactor vs. production scale bioreactor) and the
resulting different metabolic and stress conditions between screening and manufacturing
makes scale-up between these stages challenging. An essential factor for scale up is a detailed
knowledge about the process dynamics [16]. Changes in pH, oxygen limitation or the
availability of media components should be considered during the conditional screening phase.
The technical requirements are already met by modern HT robots with developments at the µL
scale. Significant advantages are offered by mini-bioreactors (MBR) with working volumes
between 10 and 250 mL [17,18,19], integrated online sensors for pH and DOT, integrated
control of pH and substrate feeding [20,21,22] and automated at-line sampling and analysis
[8,21,23]. Additionally, computer aided tools that enable advanced process control and

Accelerating biological screenings through the combination of high-throughput and modeling
85 Paper IV - Monitoring Parallel Robotic Cultivations with Online Multivariate …
feedback operation of the robots and the MBRs have been developed, but are rarely used
[17,18,20,22,24,25,26].
However, the number of parallel cultivations made possible in this way is now hardly
achievable in the present way, with manual corrections and interventions. Therefore, process
monitoring of parallel cultivations is a major challenge in HTBD, especially if no models to
describe the bioprocess are available to guide the operator. Fully automated solutions that
include process and feeding control, online and at-line monitoring are very challenging in
parallel MBR cultivations [20,21]. The main difficulties are the analysis of multi-dimensional
and highly correlated data sets, monitoring and operating a large number of bioreactors and
the intrinsic need to solve an optimal experimental design problem considering all MBRs
simultaneously [24,27] in a period of time. Additional challenges arise when industrial
conditions are investigated at the milliliter scale [22,25].
In production processes, the operation strategy is well defined, historical data is at hand,
and the goal is typically to run the current cultivations within predefined critical quality attributes
(CQAs) or the “golden batch” conditions. Under these conditions, multivariate analysis (MVA)
tools have been widely applied to supervise the process and assure its reproducibility [28].
MVA tools such as principal component analysis (PCA) have become increasingly popular in
the field of bioprocesses due to their capability to represent highly correlated multi-dimensional
datasets in a reduced space, separating process noise while retaining maximum information.
Some of the early applications of PCA include process monitoring, detection of failures or
anomalies, and statistical process control [19,28,29,30,31,32,33]. However, for all these
applications, a PCA model is usually trained based on an “in-control”, i.e., “golden batch”, basis
to detect deviations from the targeted production run characteristics [34].
During screening, where the goal is to find new strains best suited for the bioprocess at
hand, this training data is of course unavailable. The lack of a “golden batch” makes it very
challenging to diagnose or even identify faults or disturbances in cultivations with no historical
data. Although in principle historical data of similar processes can be used as reference points
for development, one cannot rely on pre-defined process behavior and constraints, as is
typically the case in production. Due to various factors, the physiology and phenotype of the
cells is known to vary during cultivation time [35] (e.g., population heterogeneities [36]). This
makes choosing a setup and tuning of control strategies in advance very difficult. For this
reason, we need to develop tools that exploit the information generated in parallel MBRs online
to rapidly develop models for process monitoring and to project the large data sets into a low
dimensional visual representation.
Our previous work showed that PCA can be used in parallel MBR experiments to identify
and improve feeding strategies with a low number of experiments [27]. In this work we
developed a program that enables the monitoring of parallel dynamic cultivations in real-time,

Accelerating biological screenings through the combination of high-throughput and modeling
Paper IV - Monitoring Parallel Robotic Cultivations with Online Multivariate … 86
supported with visual representations as well as automated event triggers (Figure 1). The
added value of this method is enhanced process monitoring and automated fault detection.
This is demonstrated in an experimental campaign with 24 parallel MBR operated by a fully
automated robotic system. This program allows a compressed representation and visualization
of the ongoing experiments, enabling a comparison between the states of parallel cultivations.
The PCA method is applied in a moving horizon framework to allow a rapid detection of specific
events and to track the dynamic evolution of the reactors. The two approaches together provide
an informative overview of the bioreactor’s performance and state. Thus, they enable the
operator to determine whether all parallel cultivations are running within critical parameter
limits and display a warning in case of deviations. Critical bioreactors can be easily identified
and tended to.
Figure 1. Screenshots of the monitoring application. Screenshot (a) depicts the landing
page where the user selects an experiment, adapts settings, and starts the data query and
subsequent online data analysis; (b) shows the main panel with plots for process data and
results from the PCA; and (c) depicts the central control app of the digital twin (DTW) of the
process. It allows for fast process monitoring via direct control and observation of single MBRs
as well as fast identification of process failures based on PCA.

Accelerating biological screenings through the combination of high-throughput and modeling
87 Paper IV - Monitoring Parallel Robotic Cultivations with Online Multivariate …
In addition, they enable an automated and secure transfer of the cultivation data during the
runtime of the experiment. This allows the often computationally intensive online data
evaluation to be performed in specialized laboratories, as a service or by project partners. Here
we used an efficient protocol for communication, enabling the monitoring of the robotic
experiments remotely, reducing the physical barrier separating theoretical work and practical
wet lab. The implementation is based on a SILA2 protocol (preliminary standard as of January
2019).
4.4.2 Materials and Methods
4.4.2.1 Experimental Facility
The wet experiments were performed in a high throughput bioprocess development facility
composed of two liquid handling stations (LHS) (Freedom EVO 200, Tecan Group Ltd.,
Männedorf, Switzerland; Microlab Star, Hamilton Company, Bonaduz, Switzerland) and one
mini bioreactor system (bioREACTOR 48, 2mag AG, Munich, Germany) which is mounted on
the first LHS (Tecan). The entire facility and its functionality is described in [21]. To trigger non-
optimal microbial cultivation conditions the volume balance control described by Haby et al.
[21] was switched off.
4.4.2.2 Microbial Model Strain and Cultures
All cultivations were performed with E. coli K-12 BW25113 (F-, DE(araD-araB)567,
lacZ4787(del)::rrnB-3, LAM-, rph-1, DE(rhaD-rhaB)568, hsdR514) carrying plasmid pAG032.
As described by Gawin et al. 2018 [37] the plasmid pAG032 contains three fluorescent protein
(CFP, YFP, RFP) encoding genes, each under transcriptional control of different promotors.
The CFP fluorescent signal gene is coupled to an σ32 related promoter and is constitutively
expressed. The rpsJ constitutive promoter is responsible for the YFP expression and serves
as an indicator for the number of ribosomes in the cell. As placeholder for a recombinant
product RFP expression is under control of the XylS/Pm promoter system. Frozen cells (stored
at −80 °C) were transferred into TY medium and kept for 5 h at 37 °C. Afterwards an aliquot
was added to EnPresso B medium (Enpresso GmbH, Berlin, Germany) with 6 U L−1 Reagent
A and stored at 37 °C overnight. The main culture was adjusted to an OD600 of 1 in MS
medium [38] with 5 g L−1 glucose and distributed to the MBR culture vessels as 10 mL aliquots.
Ampicillin (0.1 g L−1) was added to all cultures for plasmid maintenance. The main cultivation
was started with 2000 rpm at 37 °C. The stirrer speed was increased stepwise by 200 rpm
every 5 min to 3000 rpm. The maximum specific growth rate of E. coli BW25113 (pAG032)
was calculated based on previous experiments without induction at 0.72 h−1. The applied feed
rates are summarized in Table 1, the calculations are based on the equations by Enfors 2019

Accelerating biological screenings through the combination of high-throughput and modeling
Paper IV - Monitoring Parallel Robotic Cultivations with Online Multivariate … 88
[39]. After six hours of cultivation the cultures were induced by the addition of 50 µL 0.1 M m-
toluic acid to a final concentration 0.5 mM.
Table 1. Summary of applied feed rates for cultivation of E. coli BW25113 (pAG032). The
listing of the reactors in columns and rows represents the reactor allocation at the two liquid
handling stations (LHS).
Reactor µset % of µmax
1 2 3 0.65 90
4 5 6 0.58 80
7 8 9 0.50 70
10 11 12 0.43 60
13 14 15 0.36 50
16 17 18 0.29 40
19 20 21 0.22 30
22 23 24 0.14 20
4.4.2.3 Sampling and Analytics
On-line measurements for pH and DOT were taken every 30 s. For at-line analysis, the
MBRs were sampled column-wise every 15 min during the cultivation, and samples were
directly transferred into V-shaped 96-microwell plates. The sampling plates contained 15 µL
dried 2M NaOH to ensure direct metabolic inactivation of the samples [8]. The samples were
stored for five cycles on the LHS deck at 4 °C before being transferred to the second analytic
LHS. The sample storage time on the LHS deck was between 2 and 75 min. For OD600 and
fluorescence measurements the samples were diluted by the LHS [21] and measured in a
SynergyTM MX microwell plate reader (BioTek Instruments GmbH, Bad Friedrichshall,
Germany). The undiluted samples were filtrated to isolate the cells, and glucose and acetic
acid concentrations in the supernatant were measured. The detailed procedure of the
automated workflow is described in Haby et al. 2019 [21]. Outliers based on traceable technical
issues are marked as invalid and not included in the data analysis.
4.4.2.4 Software Framework
Online data transfer was enabled by a server–client architecture based on the SiLA 2
(Association Consortium Standardization in Lab Automation, Rapperswil-Jona, Switzerland,
sila-standard.org) standard. The server is located at the Chair of Bioprocess Engineering at
Technische Universität Berlin, while the Client is distributed with the application. The server–
client framework is written in Java 8 (Oracle Corporation, Santa Clara, CA, USA). The client
requests information about an (running or completed) experiment to which the server replies.
The server is equipped with a driver that connects to the centralized MySQL (Oracle

Accelerating biological screenings through the combination of high-throughput and modeling
89 Paper IV - Monitoring Parallel Robotic Cultivations with Online Multivariate …
Corporation, Santa Clara, CA, USA) database, allowing access to all process and meta data
of an experiment. Upon request by a client, the server pulls the data from the database via
SQL queries and returns the information to the client. The client formats the information into a
string complying to the XML standard and saves it on the local machine.
4.4.2.5 Monitoring Application
The monitoring application serves as graphical user interface (Supplementary Code S1).
The application itself is written in MATLAB (2018a, MathWorks, Natick, MA, USA, 2019) using
the MATLAB App Designer environment. A MATLAB script initiates the client and parses the
information of the XML file into a data structure compatible to MATLAB. The parsing is based
on a modified version of the xml2struct function from MATLAB File Exchange [40].
4.4.2.6 Data Processing for PCA
The input variables for the PCA consisted of on-line (pH, DOT) and at-line (OD600, glucose
and acetate concentrations, fluorescence for red, yellow, and cyan fluorescent proteins)
measurements as well as the logged volumes for base and glucose addition. The time
differences between the sampling of at-line measurements were interpolated to a reference
time using piecewise cubic Hermite interpolating polynomials.
The PCA of the three-dimensional dataset (reactor x variable x time) is unfolded in a batch-
wise manner [41]. This approach essentially converts time to a distinguishing factor of each
variable, i.e., defining one variable per time instance where it was quantified. Following the
unfolding the dataset was mean-centered and scaled to unit-variance. Additionally, to account
for the different frequency of measurements, the data was block-scaled: the trajectories of one
variable among all was scaled by dividing each column by the square root of available number
of data points [42].
4.4.2.7 Principal Component Analysis
The PCA is computed by the built-in MATLAB function pca. Detailed mathematical
representation of the algorithm can be found in [43]. The optimal number of principal
components (PCs) are selected automatically based on the improvement in % variance
explained. An empirical threshold was set at 5%.
Score plots were used to visually represent the replicates’ run behavior. Given the unfolding
choice, the traditional loading plots become too complex with many lines for direct
interpretation. Thus, contribution plots were employed to aid the operator in relating patterns
in the score plots to actual occurrences in the process [44].
PCA was applied to series of dataset collected in time that are augmented in two ways.
First, a moving horizon or sliding window mode of data augmentation is used to detect failures
of sensors or faulty measurements rapidly. In this approach a window length is chosen (x mins)

Accelerating biological screenings through the combination of high-throughput and modeling
Paper IV - Monitoring Parallel Robotic Cultivations with Online Multivariate … 90
and an update time is chosen (y mins). All data available in the window length is used to build
the PCA model and a new model is built by sliding the window by y minutes. Secondly, a full
horizon mode of data augmentation is used to track and compare the dynamic evolution of the
different MBRs. In this approach, all data available is used to build the PCA model. In this work
we chose to build a full horizon PCA model for each time in the reference time set.
The Hotelling’s T² distance measure was used to detect unexpected drifts of an MBR
compared to its replicates. Automated triggers were set for reactors outside the 90%
confidence ellipse. The variable causing the behavior was automatically detected using key
properties of PCA [43] to have a preliminary diagnosis of the event. The latent variable
contributing most to the run was identified using the formula stated below:
𝑐𝑜𝑠𝑖,𝑙 2 =
𝑓𝑖,𝑙2
∑ 𝑓𝑖,𝑙2
𝑙
(
1)
where 𝑓𝑖,𝑙2 is the squared score of observation i on latent variable l. Subsequently, squared
loadings of all the variables on this principal component were analyzed to identify the key driver
of the failure.
4.4.2.8 Automated Warnings
Robotic experiments typically run without automated supervision systems. Failures besides
arm movements or device malfunction cannot be detected unless an operator is monitoring
the process. To tackle this issue, a simple method to trigger alarms was developed. For this,
the Euclidean distance of each point to the center of its cluster of replicates was calculated in
the sliding window triggering a message if user defined constraints were violated. This
information allows the operator to quickly grasp the current status of the overall cultivation and
assess the similarity of the replicates. Additionally, this first step towards online automatic
classification of outliers enables more robust data selection for online optimal experimental re-
design [45], a process that requires fast and thorough data selection that can hardly be done
manually.
4.4.2.9 Pipetting Accuracy
To assess the pipetting accuracy of the cultivation LHS, weighed 96 well plates are filled
with coloured demineralised water. Absorption maximum of the used liquid was determined
via a spectral scan by the plate reader at 445 nm. The pipetting scheme was set up so each
needle pipettes three columns in one row on one aspiration cycle to mimic the experimental
setup in the cultivation. The factor for absorption mL−1 was calculated as shown below and
applied to the plate.
Factor [absortion
mL] =
avrg. absortion of all wells ∗ no. of wells
weight differnce density water
=total absortion
total volume in plate (
2)

Accelerating biological screenings through the combination of high-throughput and modeling
91 Paper IV - Monitoring Parallel Robotic Cultivations with Online Multivariate …
4.4.3 Results
The aim of the study was to demonstrate the functionality of the application and its capability
to remotely monitor parallel cultivations, detect failures and guide the operator through the
experiment. To this end, 24 microbial cultivations were carried out with eight different feeding
strategies in triplicate. The aim of the study was to force several failures to test the performance
of the program under critical conditions.
4.4.3.1 Microbial Cultivation
As model system, we use previously constructed recombinant strain E. coli BW25113
(pAG032) that expresses three different fluorescence proteins under individual control of three
different promoters [37]. The batch phase of the 24 parallel cultivations lasted 2.6 h ± 2.04 min.
The feed for the first nine reactors was started at 3.2 h of cultivation after consumption of acetic
acid. The feed for all other reactors was started at 4 h. Different feed rates were set for each
reactor triplicate. The feed rates varied between 20% and 90% of the maximum growth rate
(see Table 1). Due to the pulse-based nature of the feeding, DOT oscillations started together
with the feed additions. Cultivation data are shown in Figure 2 and available in Supplementary
Table S1. Depending on the feeding rate, the increase of reactor volumes over time differs.
For reactors 1–3 (with the highest feed rate of 90% of µmax) the critical volume was reached
after 5.5 h, reactors 10–12 (60% of µmax) reached the critical volume after 8.8 h. Reactors with
a low feed rate never reached critical volume levels. The DOT profile of reactor 17 decreased
between 8.7 h and 9.8 h, however, this was due a technical issue and was solved during the
running cultivation. When a critical volume level was reached, the DOT dropped to zero and
the glucose consumption rate decreased.
In all cultivations a decrease of CFP activity (σ32 related promoter) was observed during the
batch phase. Furthermore, the CFP activity is on the same level and stays constant during the
feeding phase for low and moderate feed rates. For higher feed rates (60–90% of µmax) the
CFP activity is lower during the feeding phase and increases with the beginning of the oxygen
limitation. The specific CFP signal increases during the batch phase and decreased during the
feed phase at higher feed rates. In cultivations with a lower feed rate (20–40% of µmax) the YFP
signal (indicator for ribosomes per cell) stays constant during the feed rate. Between the
cultivation time from 3–5 h, some YFP measurements were marked invalid because the
detector limit of the used plate reader was exceeded. Later samples are analyzed in a higher
dilution. For the two highest feed rates nearly no specific increase of RFP (inducible product)
was observed. The highest specific RFP activity was reached with a feed rate of µset of 0.22 h−1
(30% of µmax).

Accelerating biological screenings through the combination of high-throughput and modeling
Paper IV - Monitoring Parallel Robotic Cultivations with Online Multivariate … 92
Figure 2. Cultivation data of the experiment. The rows represent a group of replicates with three mini-bioreactors (MBR). From top to bottom row, the applied feed decreased by 10% from 90% to 20% of µmax. (a) Solid lines: DOT (%); dashed lines: pH (-); (b) dots: biomass (g L−1); stars: glucose (g L−1); diamonds: acetic acid (g L−1); (c) dots: RFP (RFU × 103) (rpsJ constitutive promoter); stars: YFP (RFU × 105) (inducible XylS/Pm promoter); diamonds: CFP (RFU × 104) (σ32 related constitutive promoter).
4.4.3.2 User Interface
The main features of the program developed here are (i) the operator support with a visual
compression of the large number of bioreactors and variables that need to be supervised, (ii)
the secure and reliable remote access via the framework, and (iii) developing an automated
event trigger and fault detection tool. Additionally, a user-friendly interface was developed to
demonstrate the added value of the tool and allow its test in real experiments with experienced
operators.
The central program developed in MATLAB covers all Server-Client connections, data
management and -analyses and offers a graphical user interface. The user may choose from
different plots commonly used in PCA such as score, scree, contribution, and loading plots.
Input variables for data analysis can be varied to explore different aspects. To monitor the

Accelerating biological screenings through the combination of high-throughput and modeling
93 Paper IV - Monitoring Parallel Robotic Cultivations with Online Multivariate …
cultivation, the application separates data for a full horizon and a moving window approach
(see Figure 3).
4.4.3.3 Moving and Full Horizon Setup
In the moving horizon setup, the window’s timeframe was set to 20 min, a duration
empirically determined based on experience and trials with historical data. Thus, the input
variables for
Figure 3. A screenshot of the graphical user interface of the application. The data shown is from the described experiment at 3:19 h. The left blue shows plots for the moving horizon PCA model, whereas the right blue rectangle depicts the same plots for a full horizon PCA model.
the sliding window PCA are the set points for pipetting volumes (base + feed) and the online
measurements (pH + DOT).
Analysis of the loading vectors in the full horizon setup showed that the variables cumulated
glucose feed and biomass correlate positively and are strongly pronounced on the first
principal component. As the feed was set differently for each group of replicates, this finding
is sound. However, from 03:00 h onwards, a trend can be observed on the second PC where
the scores for the reactors of the replicates have monotonous decreasing values on the y-axes
(see Figure 4). The posteriori analysis of the pipetting system showed that the feedings were
indeed following this trend.
4.4.3.4 Event Monitoring Based on PCA
During this study, the program continuously observed the cultivations, updating its data
every 10 min. Several incidents observed during the cultivation were detected properly by the
program. We discuss three of these events: (1) stirrer failure in one bioreactor, caused by

Accelerating biological screenings through the combination of high-throughput and modeling
Paper IV - Monitoring Parallel Robotic Cultivations with Online Multivariate … 94
problems in the magnetic system, (2) overfilling of a bioreactor, caused by deactivation of the
volume control, and (3) disturbance of air supply in a bioreactor, caused by, e.g., droplets in
the inlet.
4.4.3.4.1 Stirring Failure
The moving horizon PCA model with eleven pH and DOT measurements revealed at least
three reactors behaving differently after 20 min of batch phase. Reactors 3, 8, and 20 were
identified as outliers by the automated program (see Figure 5b). DOT was identified as the
causal variable for reactor 3, while pH was identified the causal variable for reactor 20. The
(a) (b)
Figure 4. Full horizon PCA approach at different times. (a) Score plot for the full horizon principal component analysis (PCA) model at time point t = 30 min. (b) Score plot for the full horizon PCA model at t = 10:22 h (entire cultivation). The eight groups of replicates are indicated by color and the reactors are numbered consecutively. The variance explained by the PC is indicated in percent in parenthesis.
first and second PC explain 44.4% and 43.1% variance, respectively. In the loading plots
the orthogonal relation of the input variable pH and DOT is clearly visible, hence allowing to
trace back the deviation in the score plot to the raw measurements (Figure 5c). While the
variable from the DOT trajectory impacts the second PC almost exclusively, the pH trajectory
has an impact on the first PC. Corresponding deviations were also observed in the on-line
measurements. For reactors 3 and 8 lower DOT values were measured during the first 10 min
of the cultivation (Figure 5a). In both reactors this was caused by a technical issue. The
magnetic stirrer of reactor 8 did not start properly (this issue was detected by the operator and
solved promptly). Reactor 20 is located the furthest away from the center point in respect to
the first PC, indicating a lower pH but usual DOT. This finding is supported by the physiological
state of the reactor.

Accelerating biological screenings through the combination of high-throughput and modeling
95 Paper IV - Monitoring Parallel Robotic Cultivations with Online Multivariate …
(a) (b) (c)
Figure 5. Detection of stirrer failures. (a) Trajectories for DOT and pH for all 24 reactors in the first hour of the cultivation. (b) Score plot for the sliding window PCA model with DOT and pH trajectories as input variables. The timeframe is t0 = 0 to tend = 20 min. Reactors 8 and 20 are distinctly separated from the main cluster. The variance explained by the PC is indicated in percent in parenthesis. (c) Loadings of the first two principal components for the same PCA model.
4.4.3.4.2 Reactor Overfill
At 05:40 h, the program detected reactor 3 to be an outlier. The contributing variable was
identified to be the pH. Analyzing the score plot of the sliding window PCA at 05:40 h showed
that reactors 2 and 3 did separate from their cluster of replicates (Figure 6c). Compared to the
score plots at 05:20 h (Figure 6b), these two reactors where the only ones that did not move
uniformly in one direction. Rather, the scores of reactors 2 and 3 shifted from the first to the
fourth quadrant. Inspection of the first two PC shows that they explain more than 90% of the
variance. The weights for the loading vector of the second component show negative
correlation of pH and base addition to DOT (not shown). The DOT trajectory for these reactors
did not feature the expecting oscillating pattern, indicating that the cultivation stopped reacting
to the pulse-based feeding (Figure 6a).
While all three MBR were fed the same volume of glucose, the added volume of base
differed. The total volume added decreases in reverse order of the reactors (3–1). Due to the
missing volume control, this caused the reactors to exceed their upper volume limit, causing a
blockage of the aeration system. The at-line analysis of the glucose and acetate media
concentration showed a drastic increase of glucose and slight increase of acetate (Figure 2).

Accelerating biological screenings through the combination of high-throughput and modeling
Paper IV - Monitoring Parallel Robotic Cultivations with Online Multivariate … 96
(a) (b) (c)
Figure 6. Reactor overfill. (a) Trajectories of the DOT profile from 05:00–05:40 h with highlighted reactors (1,2,3; highest feed rate). The pattern of peaks corresponds to the pulse-based feeding. (b,c) Score plot of the first two PC. The sliding window PCA model was built with data from 05:00–05:20 h (b) and 05:20–05:40 h (c) into the cultivation, respectively. The variance explained by the PC is indicated in percent in parenthesis.
4.4.3.4.3 Blockage of the Aeration System
Another instance causing an automated trigger was at 08:50 h when reactor 16 was
identified to be an outlier with DOT as the causal variable. The score plots of the sliding window
PCA models showed that the replicates (reactors 16, 17 and 18) behaved very similarly up to
the time point 08:50 h (Figure 7b). At this point the score corresponding to reactor 16 abruptly
digressed from the cluster (Figure 7c). The DOT profile of reactor 16 decreased unexpectedly
in respect to its two replicates. This difference in sensor data was detected in the score plot
for the first two PCs. The loadings for the DOT trajectories are negative in both sliding window
PCA models (loading plot not shown). Comparison with the actual data implies a move of the
score towards the positive axes, a trend that can be seen in the score plot (Figure 7c). The
variance is explained to more than 95% by the first two principal components, indicating that
the PCA model is well suited to describe the data and that the depicted score plot is sufficient
for online monitoring. On the loading vector for the 1st PC, DOT and pH both correlates
negatively to the base addition. Moreover, the weights of the input variable trajectories in the
loadings do not differ significantly throughout one variable for the first loading vector. For the
loading vector of the second PC, the weights for the most recent DOT measurement values
increase (data not shown). Despite the fact that reactor 16 did not exceed its critical volume
level, droplets of reactor medium may have covered the aeration hole and temporarily hinder
oxygen transport into the reactor.

Accelerating biological screenings through the combination of high-throughput and modeling
97 Paper IV - Monitoring Parallel Robotic Cultivations with Online Multivariate …
(a) (b) (c)
Figure 7. Aeration system blockage. (a) Trajectories of the DOT profile from 07:50–08:50 h into the cultivation with highlighted reactors (16,17,18; feed rate: µset = 40% of µmax).The DOT profiles of Reactor 16 deviates from its group of replicates, indicating the system stops reacting to the pulse-based feeding. (b,c) Score plot based on the sliding window PCA model with input variables pH, DOT, base volume addition, and feed volume addition in the time range t0 = 08:10 h to tend = 08:30 h (b) and t0 = 08:30 h to tend 08:50 h (c).
4.4.3.4.4 Pipetting Volume Inaccuracy
Based on the information of the scalar representation of abnormality, an overall trend stood
out. The score plots of the PCA after 03:00 h showed that the value of the second PC usually
monotonously de- or increased (see Figure 4b), corresponding to the arrangement of the MBR
in the 2mag system. The accuracy of pipetting volume on the LHS for the cultivation was
investigated after conclusion of the experiment. For this the LHS was given an identical
setpoint for pipetting a small volume of colored water. The absorption differed from the actual
pipetting volume by 2% for each column of MBR compared to the setpoint (data not shown).
This pipetting volume inaccuracy accumulated throughout the cultivation and caused the
pattern of score scattering on the second PC, as their order corresponds to increasing column
indices of the MBR setup.
4.4.4 Discussion
Here we present a program to monitor parallel bioreactor systems in high-throughput
microbial cultivations. With this program, we can supervise if replicates follow a coherent
pattern throughout the experiment or, in case of irregularities, identify the failure automatically.
Furthermore, the most common handling errors like stirrer failure, overfilling, and blockage of
the aeration system were properly identified during the cultivation by the program.
The major benefits of this tool are manifold: Firstly, a compression of the information
originally in multivariate form into a few two-dimensional plots facilitates supervision of the
process. Secondly, a basic analysis of the data using standard PCA is sufficient to detect a
number of undesired events during cultivation as well as to monitor the reproducibility of the

Accelerating biological screenings through the combination of high-throughput and modeling
Paper IV - Monitoring Parallel Robotic Cultivations with Online Multivariate … 98
process and the operating robots. Finally, the automated event detection methods in the
program are a step forward to a better and more intensive use of robotic experimental facilities,
allowing longer campaigns and experiments with low supervision.
4.4.4.1 MVA for Monitoring Parallel Cultivations
With PCA as the mathematical method that is applied to the data, it is worth reflecting on
its applicability in the herein described case. The PCA was used for data visualization and
modest triggers such as outliers, but not for building a model of the process. This can only be
done to a limited extent by the monitoring platform.
In future work, sophistication of the mathematical methods that are utilized for the tasks of
data pre-processing, data analysis and model generation would improve the insights gained
with the program. Some possibilities are PLS models for prediction, or the integration of
existing mechanistic models [45–47] for the use of semi-parametric hybrid models [48,49]. In
addition, alternative methods to the Euclidean distance that account for the correlation nature
of the variable should be explored to ensure broader applicability of the classification of
“unwanted” reactor behavior based on the scores. Possible methods would be a variation of
the Mahalanobis distance with the benefit of considering the explained variance in the
projected space [50].
Regarding the time delay of the at-line analytics, which on average accumulated to about
45 min in this cultivation, possible solutions would be to use different measurement methods
or re-designing the workflow of the LHS that carried out the at-line analytics to free resources
for an adapted sampling scheme. Alternative measurement methods additionally improve the
timely availability of process data. As replacement of at-line measurements with online
sensors, Raman spectroscopy [51], non-invasive biomass sensors [52] or fluorescence
measurements of intracellular reporter systems [37] can further improve the approach. Another
benefit of the presented program is the support in terms of calibration, operation, and selection
of analytical devices and measurement frequency, i.e., the sampling and analytics workflow of
the LHS could be adjusted dynamically based on the importance of input variables to the PCA
as indicated in the loadings of the PCs [53].
4.4.4.2 Common Failure Events
The stirrer failure event demonstrated that quick reaction is crucial for a successful
cultivation. A supervision of the cultivations’ status by simple visual inspection of each critical
process variable in each reactor is already difficult for 24 reactors. The undesired reactor
disturbances and the variables with the largest contribution to it are automatically detected
using modest approach such as the inherent properties of PCA. Additionally, the trends are
visualized in a concise two-dimensional score and contribution plots which allows the operator

Accelerating biological screenings through the combination of high-throughput and modeling
99 Paper IV - Monitoring Parallel Robotic Cultivations with Online Multivariate …
to examine the status of reactors of interest in more depth. However, as with the stirrer failure,
the timely availability of data remains a key issue.
Still, the results also show that the abstraction of PCA is not sufficient to derive concrete
measures to steer the process back to the experimental constraints. However, in the case of
the events that caused the sudden drop of DOT, PCA proved to be useful in the reduction of
the data dimension. As the feeding strategy in high throughput experiments usually varies for
each group of replicates and the DOT trajectory is oscillating due to the pulse-based feeding,
visually inspecting the profiles for all reactors throughout a 10 h cultivation would become very
cumbersome or even impossible. Thus, as demonstrated in this paper, score plots are a great
tool to help identify irregularities.
4.4.5 Conclusions
We here develop and demonstrate the benefits of a remote tool for online multivariate
analysis of parallel cultivations and its applicability to monitor dynamic HT experiments—a task
that has become hardly manageable by lab operators. The black box nature of the MVA makes
it independent of the type of experiments or cultivation vessels used. This feature makes it
particularly useful for early-stage bioprocess development with little process understanding
and highly varying experimental systems. We have shown that the program is able to provide
data-based insight to guide operator decisions in a large multidimensional data set at the
example of complex HT fed-batch cultivations. Despite high process variability and the large
amount of datapoints, the tool simplified the task to derive decisions and allows conclusion to
be drawn about the similarity of replicates and causes for deviations, improving the
reproducibility of a bioprocess.
The freely available program (see below) presented in this work is a useful tool for the
monitoring and operation of high throughput bioprocess development facilities. Due to the
modular program structure and the fact that the software relies on an open server–client
interface, only small code adjustments on the backend are necessary if the app is deployed in
a different environment, such as a different working group.
This approach is in the scope of the different model variants [13]: A descriptive model allows
for visualization and interpretation in a reduced dimension space along the central process
information. Moreover, it also supports diagnosis of abnormalities and deviations. For the
future, it would be important to further develop the tool towards predictive and prescriptive
capabilities, i.e., to proactively foresee deviations and suggest on possible process control
actions, so to most efficiently utilize the experimental data and potential of each ongoing
experiment.

Accelerating biological screenings through the combination of high-throughput and modeling
Paper IV - Monitoring Parallel Robotic Cultivations with Online Multivariate … 100
Supplementary Materials
The following are available online at https://www.mdpi.com/2227-9717/8/5/582/s1, Table
S1: Cultivation Data, Code S1: MonitoringApp, available at: https://gitlab.tubit.tu-
berlin.de/publication/2019_Ulmer.
Funding
This research was funded by German Federal Ministry of Education and Research (BMBF)
grant number 031L0018A.
Acknowledgments
We thank Robert Giessmann and Benjamin Haby for the support during the software
development and experimental work. We thank Maximillian Schulz from UniteLabs for his
patient introduction and support for the SiLA2 implementation in Java and we thank Agnieszka
Gawin for the good cooperation in the LEANPROT project.
Conflicts of Interest
The authors declare no conflict of interest.
4.4.6 References
1. Neubauer, P.; Glauche, F.; Bournazou, M.N.C. Editorial: Bioprocess Development in
the era of digitalization. Eng. Life Sci. 2017, 17, 1140–1141.
2. Neubauer, P. Editorial: Towards faster bioprocess development. Biotechnol. J. 2011,
6, 902–903.
3. Islam, R.S.; Tisi, D.; Levy, M.S.; Lye, G.J. Framework for the Rapid Optimization of
Soluble Protein Expression in Escherichia coli Combining Microscale Experiments and
Statistical Experimental Design. Biotechnol. Prog. 2007, 23, 785–793.
4. Glauche, F.; Pilarek, M.; Bournazou, M.N.C.; Grunzel, P.; Neubauer, P. Design of
experiments-based high-throughput strategy for development and optimization of
efficient cell disruption protocols. Eng. Life Sci. 2016, 17, 1166–1172.
5. Küppers, T.; Steffen, V.; Hellmuth, H.; O’Connell, T.; Bongaerts, J.; Maurer, K.-H.;
Wiechert, W. Developing a new production host from a blueprint: Bacillus pumilus as
an industrial enzyme producer. Microb. Cell Factories 2014, 13, 46.
6. Jorgensen, J.T. A challenging drug development process in the era of personalized
medicine. Drug Discov. Today 2011, 16, 891–897.
7. Paritala, P.K.; Manchikatla, S.; Yarlagadda, P.K.D.V. Digital Manufacturing-
Applications Past, Current, and Future Trends. Procedia Eng. 2017, 174, 982–991.

Accelerating biological screenings through the combination of high-throughput and modeling
101 Paper IV - Monitoring Parallel Robotic Cultivations with Online Multivariate …
8. Nickel, D.B.; Bournazou, M.N.C.; Wilms, T.; Neubauer, P.; Knepper, A. Online
bioprocess data generation, analysis, and optimization for parallel fed-batch
fermentations in milliliter scale. Eng. Life Sci. 2016, 17, 1195–1201.
9. Kim, J.H. A Review of Cyber-Physical System Research Relevant to the Emerging IT
Trends: Industry 4.0, IoT, Big Data, and Cloud Computing. J. Ind. Integr. Manag. 2017,
2, 1750011.
10. Ghobakhloo, M. The future of manufacturing industry: A strategic roadmap toward
Industry 4.0. J. Manuf. Technol. Manag. 2018, 29, 910–936.
11. Gani, R. Computer Aided Process and Product Engineering, Comput; WILEY-VCH
Verlag GmbH & Co. KGaA: Weinheim, Germany, 2006; pp. 647–666.
12. Stephanopoulos, G.; Reklaitis, G.V. Process systems engineering: From Solvay to
modern bio- and nanotechnology. Chem. Eng. Sci. 2011, 66, 4272–4306.
13. Narayanan, H.; Luna, M.F.; Von Stosch, M.; Bournazou, M.N.C.; Polotti, G.; Morbidelli,
M.; Butté, A.; Sokolov, M. Bioprocessing in the Digital Age: The Role of Process
Models. Biotechnol. J. 2019, 15, e1900172.
14. Abt, V.; Barz, T.; Cruz-Bournazou, M.N.; Herwig, C.; Kroll, P.; Möller, J.; Pörtner, R.;
Schenkendorf, R.; Cruz, N. Model-based tools for optimal experiments in bioprocess
engineering. Curr. Opin. Chem. Eng. 2018, 22, 244–252.
15. Löffler, M.; Simen, J.D.; Jäger, G.; Schäferhoff, K.; Freund, A.; Takors, R. Engineering
E. coli for large-scale production – Strategies considering ATP expenses and
transcriptional responses. Metab. Eng. 2016, 38, 73–85.
16. Sonnleitner, B. Bioprocess automation and bioprocess design. J. Biotechnol. 1997, 52,
175–179.
17. Wilson, L.J.; Lewis, W.; Kucia-Tran, R.; Bracewell, D.G. Identification of upstream
culture conditions and harvest time parameters that affect host cell protein clearance.
Biotechnol. Prog. 2019, 35, e2805.
18. Randek, J.; Mandenius, C.-F. On-line soft sensing in upstream bioprocessing. Crit.
Rev. Biotechnol. 2017, 38, 106–121.
19. Kourti, T. Process Analytical Technology Beyond Real-Time Analyzers: The Role of
Multivariate Analysis. Crit. Rev. Anal. Chem. 2006, 36, 257–278.
20. Hemmerich, J.; Noack, S.; Wiechert, W.; Oldiges, M. Microbioreactor Systems for
Accelerated Bioprocess Development. Biotechnol. J. 2018, 13, 1700141.
21. Haby, B.; Hans, S.; Anane, E.; Sawatzki, A.; Krausch, N.; Neubauer, P.; Bournazou,
M.N.C. Integrated Robotic Mini Bioreactor Platform for Automated, Parallel Microbial
Cultivation With Online Data Handling and Process Control. SLAS Technol. Transl. Life
Sci. Innov. 2019, 24, 569–582.

Accelerating biological screenings through the combination of high-throughput and modeling
Paper IV - Monitoring Parallel Robotic Cultivations with Online Multivariate … 102
22. Anane, E.; García, Á.C.; Haby, B.; Hans, S.; Krausch, N.; Krewinkel, M.; Hauptmann,
P.; Neubauer, P.; Bournazou, M.N.C. A model-based framework for parallel scale-
down fed-batch cultivations in mini-bioreactors for accelerated phenotyping.
Biotechnol. Bioeng. 2019, 116, 2906–2918.
23. Janzen, N.H.; Striedner, G.; Jarmer, J.; Voigtmann, M.; Abad, S.; Reinisch, D.
Implementation of a Fully Automated Microbial Cultivation Platform for Strain and
Process Screening. Biotechnol. J. 2019, 14, e201800625.
24. Bournazou, M.N.C.; Barz, T.; Nickel, D.B.; Cárdenas, D.L.; Glauche, F.; Knepper, A.;
Neubauer, P. Online optimal experimental re-design in robotic parallel fed-batch
cultivation facilities. Biotechnol. Bioeng. 2016, 114, 610–619.
25. Barz, T.; Sommer, A.; Wilms, T.; Neubauer, P.; Bournazou, M.N.C.; Throughput, A.
Adaptive optimal operation of a parallel robotic liquid handling station. In Proceedings
of the 9th Vienna Internacional Conference Mathematical Model, Vienna, Austria, 21–
23 February 2018; pp. 901–906.
26. Hans, S.; Gimpel, M.; Glauche, F.; Neubauer, P.; Bournazou, M.N.C.; Gimpel, M.
Automated Cell Treatment for Competence and Transformation of Escherichia coli in a
High-Throughput Quasi-Turbidostat Using Microtiter Plates. Microorganisms 2018, 6,
60.
27. Sawatzki, A.; Hans, S.; Narayanan, H.; Haby, B.; Krausch, N.; Sokolov, M.; Glauche,
F.; Riedel, S.L.; Neubauer, P.; Bournazou, M.N.C. Accelerated Bioprocess
Development of Endopolygalacturonase-Production with Saccharomyces cerevisiae
Using Multivariate Prediction in a 48 Mini-Bioreactor Automated Platform.
Bioengineering 2018, 5, 101.
28. Nomikos, P.; MacGregor, J.F. Monitoring batch processes using multiway principal
component analysis. AIChE J. 1994, 40, 1361–1375.
29. Sokolov, M.; Ritscher, J.; MacKinnon, N.; Brühlmann, D.; Rothenhäusler, D.; Thanei,
G.; Soos, M.; Stettler, M.; Souquet, J.; Broly, H.; et al. Robust factor selection in early
cell culture process development for the production of a biosimilar monoclonal
antibody. Biotechnol. Prog. 2016, 33, 181–191.
30. Undey, C.; Ertunç, S.; Mistretta, T.; Looze, B. Applied advanced process analytics in
biopharmaceutical manufacturing: Challenges and prospects in real-time monitoring
and control. J. Process. Control. 2010, 20, 1009–1018.
31. Gunther, J.; Baclaski, J.; Seborg, D.; Conner, J. Pattern matching in batch
bioprocesses—Comparisons across multiple products and operating conditions.
Comput. Chem. Eng. 2009, 33, 88–96.

Accelerating biological screenings through the combination of high-throughput and modeling
103 Paper IV - Monitoring Parallel Robotic Cultivations with Online Multivariate …
32. Thomassen, Y.E.; Van Sprang, E.N.; Van Der Pol, L.A.; Bakker, W.A. Multivariate data
analysis on historical IPV production data for better process understanding and future
improvements. Biotechnol. Bioeng. 2010, 107, 96–104.
33. Kirdar, A.; Conner, J.; Baclaski, J.; Rathore, A.S. Application of Multivariate Analysis
toward Biotech Processes: Case Study of a Cell-Culture Unit Operation. Biotechnol.
Prog. 2007, 23, 61–67.
34. Wang, X.; Kruger, U.; Irwin, G.W. Process Monitoring Approach Using Fast Moving
Window PCA. Ind. Eng. Chem. Res. 2005, 44, 5691–5702.
35. Brand, E.; Junne, S.; Anane, E.; Bournazou, M.N.C.; Neubauer, P. Importance of the
cultivation history for the response of Escherichia coli to oscillations in scale-down
experiments. Bioprocess Biosyst. Eng. 2018, 41, 1305–1313
36. Delvigne, F.; Goffin, P. Microbial heterogeneity affects bioprocess robustness:
Dynamic single-cell analysis contributes to understanding of microbial populations.
Biotechnol. J. 2013, 9, 61–72.
37. Gawin, A.; Peebo, K.; Hans, S.; Ertesvåg, H.; Irla, M.; Neubauer, P.; Brautaset, T.
Construction and characterization of broad-host-range reporter plasmid suitable for on-
line analysis of bacterial host responses related to recombinant protein production.
Microb. Cell Factories 2019, 18, 80.
38. Anane, E.; Sawatzki, A.; Neubauer, P.; Bournazou, M.N.C. Modelling concentration
gradients in fed-batch cultivations of E. coli - towards the flexible design of scale-down
experiments. J. Chem. Technol. Biotechnol. 2018, 94, 516–526.
39. Enfors, S.-O. Fermentation Process Technology; Technische Universität Berlin: Sven-
Olof Enfors, Stockholm, Sweden, 2019.
40. Wouter Falkena, xml2struct, MATLAB Central File Exchange. Available online:
https://www.mathworks.com/matlabcentral/fileexchange/28518-xml2struct (accessed
on 1 January 2019).
41. MacGregor, J.; Kourti, T. Statistical process control of multivariate processes. Control.
Eng. Pr. 1995, 3, 403–414.
42. Jolliffe, I.T. Principal Component Analysis. Springer Series in Statistics 2002, 98, 487.
43. Abdi, H.; Williams, L. Principal component analysis. Wiley Interdiscip. Rev. Comput.
Stat. 2010, 2, 433–459.
44. Anane, E.; Neubauer, P.; Bournazou, M.N.C. Modelling overflow metabolism in
Escherichia coli by acetate cycling. Biochem. Eng. J. 2017, 125, 23–30.
45. Sokolov, M.; Ritscher, J.; MacKinnon, N.; Souquet, J.; Broly, H.; Morbidelli, M.; Butté,
A. Enhanced process understanding and multivariate prediction of the relationship
between cell culture process and monoclonal antibody quality. Biotechnol. Prog. 2017,
33, 1368–1380.

Accelerating biological screenings through the combination of high-throughput and modeling
Paper IV - Monitoring Parallel Robotic Cultivations with Online Multivariate … 104
46. Duan, Z.; Wilms, T.; Neubauer, P.; Kravaris, C.; Bournazou, M.N.C. Model reduction of
aerobic bioprocess models for efficient simulation. Chem. Eng. Sci. 2020, 217, 115512.
47. Von Stosch, M.; Hamelink, J.-M.; Oliveira, R. Hybrid modeling as a QbD/PAT tool in
process development: An industrial E. coli case study. Bioprocess Biosyst. Eng. 2016,
39, 773–784.
48. Narayanan, H.; Sokolov, M.; Morbidelli, M.; Butté, A. A new generation of predictive
models: The added value of hybrid models for manufacturing processes of therapeutic
proteins. Biotechnol. Bioeng. 2019, 116, 2540–2549.
49. Neubauer, P.; Cruz, N.; Glauche, F.; Junne, S.; Knepper, A.; Raven, M. Consistent
development of bioprocesses from microliter cultures to the industrial scale. Eng. Life
Sci. 2013, 13, 224–238.
50. Mercier, S.M.; Diepenbroek, B.; Wijffels, R.H.; Streefland, M. Multivariate PAT solutions
for biopharmaceutical cultivation: Current progress and limitations. Trends Biotechnol.
2014, 32, 329–336.
51. Lee, H.L.; Boccazzi, P.; Gorret, N.; Ram, R.J.; Sinskey, A.J. In situ bioprocess
monitoring of Escherichia coli bioreactions using Raman spectroscopy. Vib. Spectrosc.
2004, 35, 131–137.
52. Buchenauer, A.; Hofmann, M.; Funke, M.; Büchs, J.; Mokwa, W.; Schnakenberg, U.
Micro-bioreactors for fed-batch fermentations with integrated online monitoring and
microfluidic devices. Biosens. Bioelectron. 2009, 24, 1411–1416.
53. Kourti, T.; Nomikos, P.; MacGregor, J.F. Analysis, monitoring and fault diagnosis of
batch processes using multiblock and multiway PLS. J. Process. Control. 1995, 5, 277–
284.

Accelerating biological screenings through the combination of high-throughput and modeling
105 Discussion
5 Discussion
The acceleration of two essential parts of bioprocess engineering, library screening and
conditional screening, is the focus of this work. For this purpose, it was necessary to develop
novel tools to combine automation, modelling and data processing. An automated workflow for
the bioprocess, sampling, analysis, data storage in a central location and data treatment was
realized. This was the basis to run model-based algorithms for enhanced bioprocess designs.
The workflow is further enhanced to allow automatic execution of the model-based bioprocess
design by the LHS. This thesis closes the loop of process inputs, execution, and monitoring to
enable autonomously acting bioprocess facilities.
RQ 1: How can dynamic data input within a statically working LHS be achieved?
In all four studies, methods are performed that are not fully defined prior to process start-up
by the LHS. On the Tecan LHS, which is hosting the MBR, these include amongst others feed,
pH control and volume balancing (Paper 2-4), on the Hamilton LHS side these include the
turbidostat culture dilution rate (Paper 1) and the OD600 sample dilution rate (Paper 2-4).
For the turbidostat, the cells are incubated, the OD600 is measured by the plate reader, the
data are stored in a file, the file is read in by the LHS software and the data are written into the
relational database. The modelling application is then started by the LHS software, retrieves
the OD600 readings of the current and the last measurement from the database, determines
the respective growth rate, and calculates the corresponding dilutions. These dilutions are
saved to another table in the same database. The LHS software pauses for the duration of the
modelling application execution and then retrieves the dilution volumes from the database.
This represents a complex process flow with several software from different vendors involved.
However, on the LHS side the process can be mapped in simple loops. Using the developed
database interface for the Hamilton LHS, it is possible to specify the database interactions
before starting the method. No changes in the LHS method depending on the current
bioprocess state are necessary and a dynamic operation is possible. Data exchange through
the database ensures modularity in that there are no dependencies between the data
generating system (LHS) and the data processing algorithm.
The PyHamilton, an open source framework for controlling Hamilton LHS, is introduced with
the example of a turbidostat in MWP, too (Chory et al., 2020). Here the whole LHS and plate
reader control is transferred into Python commands and the necessary calculations are
handled in a single application. Alternatively, the inclusion of the calculations as Hamilton
library could be considered. Similar packages to PyHamilton are also available for Tecan LHS
as RobotEvo, (Viña Rodríguez, 2018) pyTecan (Townshend, 2013) or pyTecanFluent
(Youngblut, 2017). Combining LHS operations and model calculations into one application
simplifies the entire process. However, it significantly reduces the transferability of the method

Accelerating biological screenings through the combination of high-throughput and modeling
Discussion 106
and requires expert knowledge of the LHS as well as the biological / mathematical background.
This can be neglected for such simple methods as the turbidostat, but not for more complex
models as used in paper 3.
The MBR-hosting LHS performs various work steps that have an impact on the reactor
volume (e.g.: feed, pH control, sampling). These methods are integrated as individual modules,
store and receive their data from the database and do not require any communication between
each other. This makes modification or replacement of these modules extremely easy. The
volume balancing in the mini bioreactors is one of the more complex tasks from the data
processing view. For this purpose, the information of the modules mentioned need to be
merged. The use of the database also decouples this task from the other modules and
impressively illustrates the advantages of a central data repository for the modularity of a
facility. Porting the methods to other systems is quickly possible. Likewise, the creation of new
modules or the expansion of the dataset can be done with only a few adaptations in the SQL
queries and would be more time-consuming with a file-based solution.
RQ 2: How can multiple parallel bioprocess be monitored?
Process monitoring is important to ensure a stable process. An undesirable process can
only be counteracted if it is detected in time. This applies equally to manual and automated
bioprocesses. Here (in Paper 4) PCA is used to build a user-friendly interface that quickly
shows the most important process failures in the experiment. The PCA is fed with all available
information. Thus, not only on-line and at-line analytics are included in the model, but also
pipetting volumes and feeding rates. Dependent or correlated data are weighted accordingly
within the PCA and combined into principal components. The application created here was
able to identify the most important process irregularities and to present them in an easily
understandable way.
Multivariate Data Analysis (MVDA) methods like PCA have been used numerous times for
process monitoring in the past (Nomikos and MacGregor, 1994; Kourti, 2006; Kirdar et al.,
2007; Gunther et al., 2009; Ündey et al., 2009; Thomassen et al., 2010; Glassey, 2013;
Sokolov et al., 2017). In general, the most applications train a PCA model on a "golden batch"
basis to detect deviations and are therefore only very limitedly applicable to unknown strains,
as is the case here. In this study, the detection of unwanted behavior is only possible with the
use of several replicates which are compared to each other. Thus, it is not so much the
deviation from an ideal experimental course that is evaluated (the "golden batch" is not
available), but the uniformity of the replicates. This requires that the models are created during
experiments, a computationally intensive process that can be improved by refined methods
(Wang et al., 2005). Hybrid modeling approaches consisting of mechanistic and MVDA
models, as previously used in bioprocess evaluation (von Stosch et al., 2014; Narayanan et

Accelerating biological screenings through the combination of high-throughput and modeling
107 Discussion
al., 2019; 2020), can further improve the online monitoring approach by incorporating an
abstraction of a typical bioprocess run.
RQ 3: Can online model adaptation and dynamic redesign be used for continuous
growth alignment?
With the implementation of the quasi-turbidostat in the study Automated Cell Treatment for
Competence and Transformation of Escherichia coli in a High-Throughput Quasi-Turbidostat
Using Microtiter Plates (Paper 1) it is possible to align strains with different growth behaviour.
By iteratively monitoring the biomass, determining the growth rate, and predicting the growth
for the next process interval, the required target biomass value for all strains could be
successfully achieved at a predictable time point. This has been successfully used to make
strains competent and to transform them in a single automated process.
In this study, the major achievement is not cell competence and subsequent transformation
in an automated manner focus, as this has been done by others before (Finley et al., 2004;
Hughes et al., 2007). Crucial for an efficient transformation is the initial step of cell harvesting
in the exponential phase. A simplified knowledge-based model is used here. The mathematical
model represents the growth of microbials like E. coli and consists only of one equation
(𝑑𝑥
𝑑𝑡= µ𝑚𝑎𝑥 𝑋). Only the parameter µ𝑚𝑎𝑥 needs to be adjusted to fit to the respective host. Since
the model is very simple, most of the parameter fitting problems are eliminated and the model
can even be fitted to a raw data set. Assumptions made in advance , e.g. consideration of only
one batch phase and independency of the growth from medium, enable the use of such a
simple model. Even though it is known that these conditions do not hold true, as for example
diauxic phases happen in complex media (Selvarasu et al., 2009), these influences were
neglected in the model.
The turbidostat represents a contiuous cultivation at the maximum growth rate in MWP
format and promises a broad application range. Complex evolution experiments, some of
which last thousands of generations, can be automated and parallelized (Lenski et al., 1991).
In addition to saving material and personnel costs, the higher throughput could also shorten
the experimental times until a targeted adaptation is achieved. These experiments can be
further supported by adaptive laboratory evolution experiments models and improved in a
targeted manner (LaCroix et al., 2017).
RQ 4: How can high-quality parameter fitting with potentially inadequate data be
ensured?
In this thesis (paper 3) a mechanistic model with 5 state variables and 18 parameters was
individually adapted to eight different strains. The model was able to reproduce the process

Accelerating biological screenings through the combination of high-throughput and modeling
Discussion 108
data at any time and to make precise predictions for further process behavior with increasing
process duration (increasing data basis).
The calibration of mechanistic models to on- and at-line data with the aim to accelerate the
design of experiments has been successfully performed several times in the past (McMullen
and Jensen, 2011; Barz et al., 2013; Echtermeyer et al., 2017) also for bioprocesses (Cruz
Bournazou et al., 2017). However, the experiments in these studies are not ordinary
experiments but rather specifically tailored for model fitting, using special hardware or needing
several sequential experiments. Here a common experimental protocol should be followed,
consisting of batch, exponential fed-batch and constant fed-batch process phases.
The quality of the model parameter estimation varies depending on the amount of data and
the process dynamics. To ensure a significant parameter set, parameter subset selection was
used to fit only those parameters for which the data set is sufficient. Alternative and
complementary methods for parameter regularization are available and can be used for a more
robust model fitting (Gábor et al., 2017; Abdulla and Poteau, 2021).
However, parameter regularization is only the second-best way to achieve an optimal model
calibration. An improved data set would be much more beneficial. In addition to more frequent
sampling, the use of spectral on-line measurements, like RAMAN and NIR, promises particular
added value (Claßen et al., 2017).
RQ 5: An autonomously working bioprocess development facility
The main achievement of this thesis is the development of the autonomous bioprocess
facility. It is capable of successfully cultivating up to 48 unknown strains in parallel. To be able
to carry out high-quality bioprocesses in parallel, the executing facility must be able to operate
the process in a -target oriented manner. The facility needs to have contextual knowledge
about the strains and the bioreactor which can only be passed into the facility with a
mechanistic model. The automatic calibration of this model to the respective uncharacterized
strains made an individually tailored bioprocess strategy possible.
The target quality parameters in this work are the accurate feed start and the avoidance of
overfeeding or starvation. The feed start was determined based on simulation of the
mechanistic model. In the model biomass, glucose, acetate, and oxygen are considered. The
simulation results can be used to calculate when glucose and acetate are depleted and thus
the time for the feed start can be determined. Using a well-calibrated model, this allows
prediction of the batch end to the minute. Alternatives to batch end detection, e.g. using the
DOT or pH signal (Janzen et al., 2019), can only be used recursively. The model used here
also estimates the volume and biomass concentration, information that are needed to calculate
the initial feed rate.

Accelerating biological screenings through the combination of high-throughput and modeling
109 Discussion
For the feeding, model parameters are combined to determine the maximum growth rate.
To ensure a robust process design, 50% of the maximum growth rate is considered optimal
in this study. However, the feedrate is one of the most optimised parameters in later bioprocess
development and can be controlled by various approaches (Modak et al., 1986; Mears et al.,
2017). Because of parameter variations, the strict definition in this study led to a frequent
adjustment of the feeding profile The changes to the feed have been greatest in the early
stages of the bioprocess when the data bases for model calibration were fewer and the model
parameters varied most between model calibrations.
Model based bioprocess design is sufficient for a robust process but does not yet represent
an optimal process and leaves out possibilities of the used facility. Using Model Predictive
Control (MPC) allows more complex multivariate control and has been applied many times in
industry processes (Lee, 2011). However, pure mechanistic models reach their limits in MPC
applications, and hybrid models are a promising alternative for enhanced bioprocess design
(Narayanan et al., 2020).

Accelerating biological screenings through the combination of high-throughput and modeling
Conclusions and Outlook 110
6 Conclusions and Outlook
Screening a large number of new strains or vectors in the shortest possible time with
meaningful results will become one of the challenges of the coming years. This can only be
achieved by integrating modular automation, intelligent data management and self-learning
models for bioprocess control. This work is a step in this direction and shows that even with
the simplest models, highly complex automation tasks can be properly computed.
The models presented in this work are tailored solutions for the particular issues and
available datasets. The knowledge-based modelling approaches used here are extremely
useful for bioprocess control, as demonstrated in the two examples shown. The complexity of
the models can be sufficiently reduced, the influences that are no longer represented in the
model after model reduction are known, and the informative value of the model can be
estimated in advance. However, black-box modelling approaches can be a useful addition to
existing models, especially in cases where knowledge-based approaches face knowledge
gaps, are too complex for the available data, or meaningful model reduction is no longer
possible. Hybrid combinations of mechanistic models and neural networks have been
developed in many areas and will further strengthen autonomous bioprocessing, as will model
discrimination methods, where different models are tested to detect the best candidate for a
specific task. Here, a decision algorithm has to determine which model should be used for
process control in the respective experimental phase. Such a framework would enable different
groups to test their model concepts in real scenarios without the risk of complete failure of the
respective experiment.
Further advances in measurements and sensors will also have a positive effect on the
modeling and thus on the autonomy of the bioprocess facility. On the one hand, this can mean
a compression of the existing measurement data (e.g. OD600, glucose, acetate) as well as the
extension of the analytical spectrum. The most obvious extension is the detection and
quantification of recombinant products beyond fluorescent proteins. For example, ELISA
assays have already been widely implemented and automated on LHS. Advanced
spectrometric (RAMAN, NIR) and imaging techniques have also been successfully automated
and can provide important information for online bioprocess modelling.
The increase in the measurements goes hand in hand with more devices to be integrated
and more complex automation solutions. In this work, monolithic methods were run in various
loops. Keeping the individual process steps self-contained and modular has proven successful
and led to flexible methods. However, the process flow was fixed and could only be changed
in the volumes to be pipetted. The integration of new devices and software is made more
difficult in this way since the overall system must always be adapted as well. The use of a
superordinate orchestration framework will therefore be unavoidable in the near future. Here,

Accelerating biological screenings through the combination of high-throughput and modeling
111 Conclusions and Outlook
the process steps are broken down into smallest tasks and subtasks and triggered by a third
software. Such a solution would give new freedom to modeling and process optimization, will
simplify the integration of new devices, analyses or software packages, but will also increase
the overall complexity. The development of a new and comprehensively dynamic workflow
orchestration concept is one of the most urgent tasks in order to increase the results’ quality
with the same effort (in equipment, time and costs).
Furthermore, the use of a central data lake where all data is consistently stored plays a
decisive role for rapid expansion and modularity. The relational database used here was one
of the success factors for cross-device communication and online model calibration. With the
predicted introduction of new measurement methods, the structure of the database needs to
be reconsidered. Relational databases are well suited for structured data. Spectral data can
also be stored conditionally well in them. Nevertheless, unstructured data such as microscopy
images require more extensive data management.
In the fourth study presented, the development of a SiLA-enabled database interface in
particular is an invitation to interested groups to participate in the development of new modeling
and monitoring techniques. The data stored in the database are easy to interpret for domain
competent scientists, but difficult to comprehend for researchers from other domains, such as
mathematics or computer science. Making the data available according to FAIR Data principles
is therefore a worthy goal and will require even further documentation and explanation of the
respective experiments.
In the bioprocess monitoring study, the PCA was able to detect the most important and
frequent process faults in the operation with the used facility. Afterwards, a possibility of
automatic error exposure was developed. However, its implementation into a real alarm
function is still pending. With more data, new training cases can be implemented. In addition,
the presented approach for process error exposure should be further refined.

Accelerating biological screenings through the combination of high-throughput and modeling
References 112
7 References
Abdulla, U.G., Poteau, R., 2021. Identification of parameters for large-scale kinetic models.
Journal of Computational Physics 429, 110026. doi:10.1016/j.jcp.2020.110026
Agresti, J.J., Antipov, E., Abate, A.R., Ahn, K., Rowat, A.C., Baret, C., Marquez, M., Klibanov,
A.M., Grif, A.D., Weitz, D.A., Aga, G.A.L., 2010. Ultrahigh-throughput screening in drop-
based microfluidics for directed evolution. Proceedings of the National Academy of
Sciences 107, 1–6. doi:10.1073/pnas.1002891107
Almquist, J., Cvijovic, M., Hatzimanikatis, V., Nielsen, J., Jirstrand, M., 2014. Kinetic models in
industrial biotechnology - Improving cell factory performance. Metabolic Engineering 24,
38–60. doi:10.1016/j.ymben.2014.03.007
Anane, E., López C, D.C., Neubauer, P., Cruz Bournazou, M.N., 2017. Modelling overflow
metabolism in Escherichia coli by acetate cycling. Biochemical Engineering Journal 125,
23–30. doi:10.1016/j.bej.2017.05.013
Arain, S., John, G.T., Krause, C., Gerlach, J., Wolfbeis, O.S., Klimant, I., 2006.
Characterization of microtiterplates with integrated optical sensors for oxygen and pH,
and their applications to enzyme activity screening, respirometry, and toxicological
assays. Sensors and Actuators, B: Chemical 113, 639–648.
doi:10.1016/j.snb.2005.07.056
Argelaguet, R., Velten, B., Arnol, D., Dietrich, S., Zenz, T., Marioni, J.C., Buettner, F., Huber,
W., Stegle, O., 2018. Multi‐Omics Factor Analysis—a framework for unsupervised
integration of multi‐omics data sets. Molecular Systems Biology 14, 1–13.
doi:10.15252/msb.20178124
Axe, D.D., Bailey, J.E., 1995. Transport of lactate and acetate through the energized
cytoplasmic membrane of Escherichia coli. Biotechnology and Bioengineering 47, 8–19.
doi:10.1002/bit.260470103
Barz, T., López Cárdenas, D.C., Arellano-Garcia, H., Wozny, G., 2013. Experimental
evaluation of an approach to online redesign of experiments for parameter determination.
AIChE Journal 59, 1981–1995. doi:10.1002/aic.13957
Basan, M., Hui, S., Okano, H., Zhang, Z., Shen, Y., Williamson, J.R., Hwa, T., 2015. Overflow
metabolism in Escherichia coli results from efficient proteome allocation. Nature 528, 99–
104. doi:10.1038/nature15765
Bauer, K.A., Ben-Bassat, A., Dawson, M., La Puente, V.T. De, Neway, J.O., 1990. Improved
expression of human interleukin-2 in high-cell-density fermentor cultures of Escherichia
coli K-12 by a phosphotransacetylase mutant. Applied and Environmental Microbiology
56, 1296–1302. doi:10.1128/aem.56.5.1296-1302.1990

Accelerating biological screenings through the combination of high-throughput and modeling
113 References
Blesken, C., Olfers, T., Grimm, A., Frische, N., 2016. The microfluidic bioreactor for a new era
of bioprocess development. Engineering in Life Sciences 16, 190–193.
doi:10.1002/elsc.201500026
BMBF, 2010. Nationale Forschungsstrategie BioÖkonomie 2030 Unser Weg zu einer bio-
basierten Wirtschaft. Berlin / Bonn.
Bryson, V., Szybalski, W., 1952. Microbial Selection. Science 116, 45–51.
doi:10.1126/science.116.3003.45
Buchenauer, A., Hofmann, M.C., Funke, M., Büchs, J., Mokwa, W., Schnakenberg, U., 2009.
Micro-bioreactors for fed-batch fermentations with integrated online monitoring and
microfluidic devices. Biosensors and Bioelectronics 24, 1411–1416.
doi:10.1016/j.bios.2008.08.043
Calleja, D., Kavanagh, J., Mas, C. de, López-Santín, J., 2016. Simulation and prediction of
protein production in fed-batch E. coli cultures: An engineering approach. Biotechnology
and Bioengineering 113, 772–782. doi:10.1002/bit.25842
Camacho, D.M., Collins, K.M., Powers, R.K., Costello, J.C., Collins, J.J., 2018. Next-
Generation Machine Learning for Biological Networks. Cell 173, 1581–1592.
doi:10.1016/j.cell.2018.05.015
Cancer, G.P., Zimmermann, H.F., Trauthwein, H., Dingerdissen, U., 2004. Monitoring aerobic
Escherichia coli growth in shaken microplates by measurement of culture fluorescence
36, 36–38.
Chassagnole, C., Noisommit-Rizzi, N., Schmid, J.W., Mauch, K., Reuss, M., 2002. Dynamic
modeling of the central carbon metabolism of Escherichia coli. Biotechnology and
Bioengineering 79, 53–73. doi:10.1002/bit.10288
Chory, E.J., Gretton, D.W., DeBenedictis, E.A., Esvelt, K.M., 2020. Flexible open-source
automation for robotic bioengineering. bioRxiv. doi:10.1101/2020.04.14.041368
Claßen, J., Aupert, F., Reardon, K.F., Solle, D., Scheper, T., 2017. Spectroscopic sensors for
in-line bioprocess monitoring in research and pharmaceutical industrial application.
Analytical and Bioanalytical Chemistry 409, 651–666. doi:10.1007/s00216-016-0068-x
Costa, R.S., Machado, D., Rocha, I., Ferreira, E.C., 2010. Hybrid dynamic modeling of
Escherichia coli central metabolic network combining Michaelis-Menten and approximate
kinetic equations. BioSystems 100, 150–157. doi:10.1016/j.biosystems.2010.03.001
Cruz Bournazou, M.N., Barz, T., Nickel, D.B., Lopez Cárdenas, D.C., Glauche, F., Knepper,
A., Neubauer, P., 2017. Online optimal experimental re-design in robotic parallel fed-
batch cultivation facilities. Biotechnology and Bioengineering 114, 610–619.
doi:10.1002/bit.26192
Cui, L., Wang, Z., Xu, T., Song, H., 2017. Prediction of the product formation with the AdaBoost
algorithm in bioprocesses. International Journal of System Control and Information

Accelerating biological screenings through the combination of high-throughput and modeling
References 114
Processing 2, 180–189. doi:10.1504/IJSCIP.2017.089816
Doppler, P., Veiter, L., Spadiut, O., Herwig, C., Rajamanickam, V., 2020. A chemometric tool
to monitor and predict cell viability in filamentous fungi bioprocesses using UV
chromatogram fingerprints. Processes 8. doi:10.3390/PR8040461
Duetz, W.A., 2007. Microtiter plates as mini-bioreactors: miniaturization of fermentation
methods. Trends in Microbiology 15, 469–475. doi:10.1016/j.tim.2007.09.004
Duetz, W.A., Witholt, B., 2004. Oxygen transfer by orbital shaking of square vessels and
deepwell microtiter plates of various dimensions. Biochemical Engineering Journal 17,
181–185. doi:10.1016/S1369-703X(03)00177-3
Duetz, W.A., R??edi, L., Hermann, R., O’Connor, K., B??chs, J., Witholt, B., 2000. Methods
for intense aeration, growth, storage, and replication of bacterial strains in microtiter
plates. Applied and Environmental Microbiology 66, 2641–2646.
doi:10.1128/AEM.66.6.2641-2646.2000
Dugar, D., Stephanopoulos, G., 2011. Relative potential of biosynthetic pathways for biofuels
and bio-based products. Nature biotechnology 29, 1074—1078. doi:10.1038/nbt.2055
Echtermeyer, A., Amar, Y., Zakrzewski, J., Lapkin, A., 2017. Self-optimisation and model-
based design of experiments for developing a C-H activation flow process. Food,
Pharmaceutical and Bioengineering Division 2017 - Core Programming Area at the 2017
AIChE Annual Meeting 2, 747–760. doi:10.3762/bjoc.13.18
Edwards-Parton, S., Thornhill, N.F., Bracewell, D.G., Liddell, J.M., Titchener-Hooker, N.J.,
2008. Principal component score modeling for the rapid description of chromatographic
separations. Biotechnology Progress 24, 202–208. doi:10.1021/bp070240j
Edwards, J.S., Palsson, B.O., 2000. The Escherichia coli MG1655 in silico metabolic genotype:
Its definition, characteristics, and capabilities. Proceedings of the National Academy of
Sciences 97, 5528–5533. doi:10.1073/pnas.97.10.5528
Enfors, S.-O., 2019. Fermentation Process Technology. Stockholm.
EPSO, 2011. THE EUROPEAN BIOECONOMY IN 2030 Delivering Sustainable Growth by
addressing the Grand Societal Challenges.
Feist, A.M., Palsson, B.Ø., 2008. The growing scope of applications of genome-scale
metabolic reconstructions using Escherichia coli. Nature biotechnology 26, 659—667.
doi:10.1038/nbt1401
Fellner, M., Delgado, A., Becker, T., 2003. Functional nodes in dynamic neural networks for
bioprocess modelling. Bioprocess and Biosystems Engineering 25, 263–270.
doi:10.1007/s00449-002-0297-6
Feng, X., Xu, Y., Chen, Y., Tang, Y.J., 2012. Integrating flux balance analysis into kinetic
models to decipher the dynamic metabolism of shewanella oneidensis MR-1. PLoS
Computational Biology 8. doi:10.1371/journal.pcbi.1002376

Accelerating biological screenings through the combination of high-throughput and modeling
115 References
Feyo De Azevedo, S., Dahm, B., Oliveira, F.R., 1997. Hybrid modelling of biochemical
processes: A comparison with the conventional approach. Computers and Chemical
Engineering 21. doi:10.1016/s0098-1354(97)87593-x
Finley, J.B., Qiu, S.H., Luan, C.H., Luo, M., 2004. Structural genomics for Caenorhabditis
elegans: High throughput protein expression analysis. Protein Expression and Purification
34, 49–55. doi:10.1016/j.pep.2003.11.026
Freeman, R.H.M., Yeudall, A.D., 1986. Liquid handling station. WO1988000707A1.
Funke, M., Diederichs, S., Kensy, F., Müller, C., Büchs, J., 2009. The baffled microtiter plate:
Increased oxygen transfer and improved online monitoring in small scale fermentations.
Biotechnology and Bioengineering 103, 1118–1128. doi:10.1002/bit.22341
Funke, M., Buchenauer, A., Schnakenberg, U., Mokwa, W., Kensy, F., Bu, J., Diederichs, S.,
Mertens, A., Mu, C., 2010. Microfluidic BioLector — Microfluidic Bioprocess Control in
Microtiter Plates 107, 497–505. doi:10.1002/bit.22825
Gábor, A., Villaverde, A.F., Banga, J.R., 2017. Parameter identifiability analysis and
visualization in large-scale kinetic models of biosystems. BMC Systems Biology 11, 1–
16. doi:10.1186/s12918-017-0428-y
Gebhardt, G., Hortsch, R., Kaufmann, K., Arnold, M., Weuster-Botz, D., 2011. A new
microfluidic concept for parallel operated milliliter-scale stirred tank bioreactors.
Biotechnology Progress 27, 684–690. doi:10.1002/btpr.570
Glassey, J., 2013. Multivariate Data Analysis for Advancing the Interpretation of Bioprocess
Measurement and Monitoring Data. In: Mandenius, C.-F., Titchener-Hooker, N.J. (Eds.),
Measurement, Monitoring, Modelling and Control of Bioprocesses. Springer Berlin
Heidelberg, Berlin, Heidelberg, pp. 167–191. doi:10.1007/10_2012_171
Glauche, F., John, G.T., Arain, S., Knepper, A., Neubauer, A., Goelling, D., Lang, C., Violet,
N., King, R., Neubauer, P., 2015. Toward Microbioreactor Arrays: A Slow-Responding
Oxygen Sensor for Monitoring of Microbial Cultures in Standard 96-Well Plates. Journal
of Laboratory Automation 20, 438–446. doi:10.1177/2211068215573924
Glauche, F., Glazyrina, J., Cruz Bournazou, M.N., Kiesewetter, G., Cuda, F., Goelling, D.,
Raab, A., Lang, C., Neubauer, P., 2017. Detection of growth rate-dependent product
formation in miniaturized parallel fed-batch cultivations. Engineering in Life Sciences 17,
1215–1220. doi:10.1002/elsc.201600029
Gunther, J.C., Baclaski, J., Seborg, D.E., Conner, J.S., 2009. Pattern matching in batch
bioprocesses—Comparisons across multiple products and operating conditions.
Computers & Chemical Engineering 33, 88–96.
doi:10.1016/j.compchemeng.2008.07.001
Haby, B., Hans, S., Anane, E., Sawatzki, A., Krausch, N., Neubauer, P., Cruz Bournazou,
M.N., 2019. Integrated Robotic Mini Bioreactor Platform for Automated, Parallel Microbial

Accelerating biological screenings through the combination of high-throughput and modeling
References 116
Cultivation With Online Data Handling and Process Control. SLAS TECHNOLOGY:
Translating Life Sciences Innovation 24. doi:10.1177/2472630319860775
Hannig, G., Makrides, S.C., 1998. Strategies for optimizing heterologous protein expression in
Escherichia coli. Trends in biotechnology 16, 54–60. doi:10.1016/S0167-7799(97)01155-
4
HEL, 2019. Bioreactor Systems For Rapid Bioprocess Development [WWW Document]. URL
https://www.helgroup.com/systems_brochure/biousa.pdf
Henry, C.S., DeJongh, M., Best, A.A., Frybarger, P.M., Linsay, B., Stevens, R.L., 2010. High-
throughput generation, optimization and analysis of genome-scale metabolic models.
Nature Biotechnology 28, 977–982. doi:10.1038/nbt.1672
Hollinshead, W., He, L., Tang, Y.J., 2014. Biofuel production: an odyssey from metabolic
engineering to fermentation scale-up. Frontiers in Microbiology 5, 344.
doi:10.3389/fmicb.2014.00344
Hsu, S.-Y., Lin, Y.-S., Li, S.-J., Lee, W.-C., 2014. Co-expression of a heat shock transcription
factor to improve conformational quality of recombinant protein in Escherichia coli. Journal
of Bioscience and Bioengineering 118, 242–248. doi:10.1016/j.jbiosc.2014.02.012
Huber, R., Ritter, D., Hering, T., Hillmer, A., Kensy, F., Müller, C., Wang, L., Büchs, J., 2009.
Robo-Lector – a novel platform for automated high-throughput cultivations in microtiter
plates with high information content 15, 1–15. doi:10.1186/1475-2859-8-42
Huber, R., Roth, S., Rahmen, N., Büchs, J., 2011. Utilizing high-throughput experimentation
to enhance specific productivity of an E.coli T7 expression system by phosphate
limitation. BMC Biotechnology 11, 22. doi:10.1186/1472-6750-11-22
Hughes, S.R., Dowd, P.F., Hector, R.E., Riedmuller, S.B., Bartolett, S., Mertens, J.A., Qureshi,
N., Liu, S., Bischoff, K.M., Li, X.-L., John S. Jackson, J., Sterner, D., Panavas, T., Rich,
J.O., Farrelly, P.J., Butt, T., Cotta, M.A., 2007. Cost-Effective High-Throughput Fully
Automated Construction of a Multiplex Library of Mutagenized Open Reading Frames for
an Insecticidal Peptide Using a Plasmid-Based Functional Proteomic Robotic Workcell
with Improved Vacuum System. JALA: Journal of the Association for Laboratory
Automation 12, 202–212. doi:10.1016/j.jala.2007.04.007
Janzen, N.H., Striedner, G., Jarmer, J., Voigtmann, M., Abad, S., Reinisch, D., 2019.
Implementation of a Fully Automated Microbial Cultivation Platform for Strain and Process
Screening. Biotechnology Journal 14, 1800625. doi:10.1002/biot.201800625
Jensen, E.B., Carlsen, S., 1990. Production of recombinant human growth hormone in
Escherichia coli: Expression of different precursors and physiological effects of glucose,
acetate, and salts. Biotechnology and Bioengineering 36, 1–11.
doi:10.1002/bit.260360102
Jeude, M., Dittrich, B., Niederschulte, H., Anderlei, T., Knocke, C., Klee, D., Bu, J., 2006. Fed-

Accelerating biological screenings through the combination of high-throughput and modeling
117 References
Batch Mode in Shake Flasks by Slow-Release Technique. doi:10.1002/bit
John, G.T., Goelling, D., Klimant, I., Schneider, H., Heinzle, E., 2003. pH-sensing 96-well
microtitre plates for the characterization of acid production by dairy starter cultures.
Journal of Dairy Research 70, 327–333. doi:10.1017/S0022029903006344
Junker, B.H., Wang, H.Y., 2006. Bioprocess Monitoring and Computer Control : Key Roots of
the Current PAT Initiative. doi:10.1002/bit.21087
Kaganovitch, E., Steurer, X., Dogan, D., Probst, C., Wiechert, W., Kohlheyer, D., 2018.
Microbial single-cell analysis in picoliter-sized batch cultivation chambers. New
Biotechnology 47, 50–59. doi:10.1016/j.nbt.2018.01.009
Kensy, F., Zang, E., Faulhammer, C., Tan, R.-K., Büchs, J., 2009. Validation of a high-
throughput fermentation system based on online monitoring of biomass and fluorescence
in continuously shaken microtiter plates. Microbial Cell Factories 8, 31. doi:10.1186/1475-
2859-8-31
Khodayari, A., Maranas, C.D., 2016. A genome-scale Escherichia coli kinetic metabolic model
k-ecoli457 satisfying flux data for multiple mutant strains. Nature communications 7,
13806. doi:10.1038/ncomms13806
Khodayari, A., Zomorrodi, A.R., Liao, J.C., Maranas, C.D., 2014. A kinetic model of Escherichia
coli core metabolism satisfying multiple sets of mutant flux data. Metabolic engineering
25, 50–62. doi:10.1016/j.ymben.2014.05.014
Kim, W.J., Kim, H.U., Lee, S.Y., 2017. Current state and applications of microbial genome-
scale metabolic models. Current Opinion in Systems Biology 2, 10–18.
doi:10.1016/j.coisb.2017.03.001
Kirdar, A.O., Conner, J.S., Baclaski, J., Rathore, A.S., 2007. Application of Multivariate
Analysis toward Biotech Processes: Case Study of a Cell-Culture Unit Operation.
Biotechnology Progress 23, 61–67. doi:10.1021/bp060377u
Knepper, A., Heiser, M., Glauche, F., Neubauer, P., 2014. Robotic Platform for Parallelized
Cultivation and Monitoring of Microbial Growth Parameters in Microwell Plates. Journal of
Laboratory Automation 19, 593–601. doi:10.1177/2211068214547231
Knorr, B., Schlieker, H., Hohmann, H.-P., Weuster-Botz, D., 2007. Scale-down and parallel
operation of the riboflavin production process with Bacillus subtilis. Bochem. Eng. J. 33,
263–274. doi:DOI: 10.1016/j.bej.2006.10.023
Koenig, L., Ramme, A.P., Faust, D., Lauster, R., Marx, U., 2018. Production of Human Induced
Pluripotent Stem Cell-Derived Cortical Neurospheres in the DASbox ® Mini Bioreactor
System. Application note 1–12.
Konstantinov, K.B., Cooney, C.L., 2015. White Paper on Continuous Bioprocessing May 20-
21, 2014 Continuous Manufacturing Symposium. Journal of Pharmaceutical Sciences
104, 813–820. doi:10.1002/jps.24268

Accelerating biological screenings through the combination of high-throughput and modeling
References 118
Kopp, J., Kolkmann, A.M., Veleenturf, P.G., Spadiut, O., Herwig, C., Slouka, C., 2019.
Boosting recombinant inclusion body production—from classical fed-batch approach to
continuous cultivation. Frontiers in Bioengineering and Biotechnology 7, 1–12.
doi:10.3389/fbioe.2019.00297
Kourti, T., 2006. Process Analytical Technology Beyond Real-Time Analyzers: The Role of
Multivariate Analysis. Critical Reviews in Analytical Chemistry 36, 257–278.
doi:10.1080/10408340600969957
Krausch, N., Barz, T., Sawatzki, A., Gruber, M., Kamel, S., Neubauer, P., Cruz Bournazou,
M.N., 2019. Monte Carlo Simulations for the Analysis of Non-linear Parameter Confidence
Intervals in Optimal Experimental Design. Frontiers in Bioengineering and Biotechnology
7, 122. doi:10.3389/fbioe.2019.00122
Krause, M., Ukkonen, K., Haataja, T., Ruottinen, M., Glumoff, T., Neubauer, A., Neubauer, P.,
Vasala, A., 2010. A novel fed-batch based cultivation method provides high cell-density
and improves yield of soluble recombinant proteins in shaken cultures. Microbial Cell
Factories 9, 1–11. doi:10.1186/1475-2859-9-11
Kroll, P., Hofer, A., Ulonska, S., Kager, J., Herwig, C., 2017. Model-Based Methods in the
Biopharmaceutical Process Lifecycle. Pharmaceutical Research 34, 2596–2613.
doi:10.1007/s11095-017-2308-y
LaCroix, R.A., Palsson, B.O., Feist, A.M., 2017. A Model for Designing Adaptive Laboratory
Evolution Experiments. Applied and Environmental Microbiology 83.
doi:10.1128/AEM.03115-16
Lagaris, I.E., Likas, A., Fotiadis, D.I., 1998. Artificial neural networks for solving ordinary and
partial differential equations. IEEE Transactions on Neural Networks 9, 987–1000.
doi:10.1109/72.712178
Lee, J.H., 2011. Model predictive control: Review of the three decades of development.
International Journal of Control, Automation and Systems 9, 415–424.
doi:10.1007/s12555-011-0300-6
Lee, S.Y., 1996. High cell-density culture of Escherichia coli. Trends in Biotechnology 14, 98–
105. doi:10.1016/0167-7799(96)80930-9
Lenski, R.E., Rose, M.R., Simpson, S.C., Tadler, S.C., 1991. Long-Term Experimental
Evolution in Escherichia coli. I. Adaptation and Divergence During 2,000 Generations.
The American Naturalist 138, 1315–1341. doi:10.1086/285289
Lin, H., Hanschke, R., Nicklisch, S., Nietsche, T., Jarchow, R., Riemschneider, S., Meyer, S.,
Gupta, A., Hecker, M., Neubauer, P., 2001a. Cellular Responses To Strong
Overexpression of Recombinant Genes in Escherichia Coli. Recombinant Protein
Production with prokaryotic and eukaryotic cells. A comparative view on host physiology
1–19. doi:10.1007/978-94-015-9749-4_5

Accelerating biological screenings through the combination of high-throughput and modeling
119 References
Lin, H.Y., Mathiszik, B., Xu, B., Enfors, S.O., Neubauer, P., 2001b. Determination of the
maximum specific uptake capacities for glucose and oxygen in glucose-limited fed-batch
cultivations of Escherichia coli. Biotechnology and Bioengineering 73, 347–357.
doi:10.1002/bit.1068
López, D.C., Barz, T., Peñuela, M., Villegas, A., Ochoa, S., Wozny, G., 2013. Model-based
identifiable parameter determination applied to a simultaneous saccharification and
fermentation process model for bio-ethanol production. Biotechnology Progress 29,
1064–1082. doi:10.1002/btpr.1753
Luli, G.W., Strohl, W.R., 1990. Comparison of growth, acetate production, and acetate
inhibition of Escherichia coli strains in batch and fed-batch fermentations. Applied and
Environmental Microbiology 56, 1004–1011. doi:10.1128/aem.56.4.1004-1011.1990
Mahadevan, R., Edwards, J.S., Doyle, F.J., 2002. Dynamic Flux Balance Analysis of diauxic
growth in Escherichia coli. Biophysical Journal 83, 1331–1340. doi:10.1016/S0006-
3495(02)73903-9
Manahan, M., Nelson, M., Cacciatore, J.J., Weng, J., Xu, S., Pollard, J., 2019. Scale-down
model qualification of ambr® 250 high-throughput mini-bioreactor system for two
commercial-scale mAb processes. Biotechnology Progress 35, 1–13.
doi:10.1002/btpr.2870
Markx, G.H., Davey, C.L., Kell, D.B., 1991. The permittistat: A novel type of turbidostat. Journal
of General Microbiology 137, 735–743. doi:10.1099/00221287-137-4-735
Martin, G.A., Hempfling, W.P., 1976. A Method for the Regulation of Microbial Population
Density during Continuous Culture at High Growth Rates. Archives of Microbiology 47,
41–47. doi:10.1007/BF00427865
McKinstry, W.J., Hijnen, M., Tanwar, H.S., Sparrow, L.G., Nagarajan, S., Pham, S.T., Mak, J.,
2014. Expression and purification of soluble recombinant full length HIV-1 Pr55Gag
protein in Escherichia coli. Protein Expression and Purification 100, 10–18.
doi:10.1016/j.pep.2014.04.013
McMullen, J.P., Jensen, K.F., 2011. Rapid determination of reaction kinetics with an automated
microfluidic system. Organic Process Research and Development 15, 398–407.
doi:10.1021/op100300p
Mears, L., Stocks, S.M., Sin, G., Gernaey, K. V., 2017. A review of control strategies for
manipulating the feed rate in fed-batch fermentation processes. Journal of Biotechnology
245, 34–46. doi:10.1016/j.jbiotec.2017.01.008
Meyer, R., 2017. Bioeconomy Strategies: Contexts, Visions, Guiding Implementation
Principles and Resulting Debates. Sustainability 9, 1031. doi:10.3390/su9061031
Modak, J.M., Lim, H.C., Tayeb, Y.J., 1986. General characteristics of optimal feed rate profiles
for various fed-batch fermentation processes. Biotechnology and Bioengineering 28,

Accelerating biological screenings through the combination of high-throughput and modeling
References 120
1396–1407. doi:10.1002/bit.260280914
Monk, J.M., Lloyd, C.J., Brunk, E., Mih, N., Sastry, A., King, Z., Takeuchi, R., Nomura, W.,
Zhang, Z., Mori, H., Feist, A.M., Palsson, B.O., 2017. iML1515, a knowledgebase that
computes Escherichia coli traits. Nature Biotechnology 35, 904–908.
doi:10.1038/nbt.3956
Nakano, K., Rischke, M., Sato, S., Märkl, H., 1997. Influence of acetic acid on the growth of
Escherichia coli K12 during high-cell-density cultivation in a dialysis reactor. Applied
Microbiology and Biotechnology 48, 597–601. doi:10.1007/s002530051101
Narayanan, H., Sokolov, M., Morbidelli, M., Butté, A., 2019. A new generation of predictive
models–the added value of hybrid models for manufacturing processes of therapeutic
proteins. Biotechnology and Bioengineering 0. doi:10.1002/bit.27097
Narayanan, H., Luna, M.F., Stosch, M. von, Cruz-Bournazou, M.N., Polotti, G., Morbidelli, M.,
Butté, A., Sokolov, M., 2020. Bioprocessing in the Digital Age: The Role of Process
Models. Biotechnology Journal 15, 1900172. doi:10.1002/biot.201900172
Neubauer, P., Lin, H.Y., Mathiszik, B., 2003. Metabolic load of recombinant protein production:
Inhibition of cellular capacities for glucose uptake and respiration after induction of a
heterologous gene in Escherichia coli. Biotechnology and Bioengineering 83, 53–64.
doi:10.1002/bit.10645
Neubauer, P., Glauche, F., Cruz-Bournazou, M.N., 2017. Editorial: Bioprocess Development
in the era of digitalization. Engineering in Life Sciences 17, 1140–1141.
doi:10.1002/elsc.201770113
Nomikos, P., MacGregor, J.F., 1994. Monitoring batch processes using multiway principal
component analysis. AIChE Journal 40, 1361–1375. doi:10.1002/aic.690400809
Orth, J.D., Thiele, I., Palsson, B.O., 2010. What is flux balance analysis? Nature Biotechnology
28, 245–248. doi:10.1038/nbt.1614
Orth, J.D., Conrad, T.M., Na, J., Lerman, J.A., Nam, H., Feist, A.M., Palsson, B., 2011. A
comprehensive genome-scale reconstruction of Escherichia coli metabolism-2011.
Molecular Systems Biology 7, 1–9. doi:10.1038/msb.2011.65
Øyås, O., Stelling, J., 2018. Genome-scale metabolic networks in time and space. Current
Opinion in Systems Biology 8, 51–58. doi:10.1016/j.coisb.2017.12.003
Paalme, T., Kahru, A., Elken, R., Vanatalu, K., Tiisma, K., Raivo, V., 1995. The computer-
controlled continuous culture of Escherichia coli with smooth change of dilution rate (A-
stat). Journal of Microbiological Methods 24, 145–153. doi:10.1016/0167-7012(95)00064-
X
Panula-Perälä, J., Šiurkus, J., Vasala, A., Wilmanowski, R., Casteleijn, M.G., Neubauer, P.,
2008. Enzyme controlled glucose auto-delivery for high cell density cultivations in
microplates and shake flasks. Microbial Cell Factories 7, 1–12. doi:10.1186/1475-2859-

Accelerating biological screenings through the combination of high-throughput and modeling
121 References
7-31
Pfost, D.R., Bjornson, T.O., Coppock, R.M., Kowalski, C., Marquiss, S.A., Murray, D.S., Pfost,
R.F., Sanford, B., Puckett, K.L., 1989. Automated multi-purpose analytical chemistry
processing center and laboratory work station. US5104621A.
Pope, B., Kent, H.M., 1996. High Efficiency 5 Min Transformation of Escherichia Coli. Nucleic
Acids Research 24, 536–537. doi:10.1093/nar/24.3.536
Puskeiler, R., Kaufmann, K., Weuster-Botz, D., 2005. Development, parallelization, and
automation of a gas-inducing milliliter-scale bioreactor for high-throughput bioprocess
design (HTBD). Biotechnology and Bioengineering 89, 512–523. doi:10.1002/bit.20352
Rajamanickam, V., Wurm, D., Slouka, C., Herwig, C., Spadiut, O., 2017. A novel toolbox for
E. coli lysis monitoring. Analytical and Bioanalytical Chemistry 409, 667–671.
doi:10.1007/s00216-016-9907-z
Randek, J., Mandenius, C.F., 2018. On-line soft sensing in upstream bioprocessing. Critical
Reviews in Biotechnology 38, 106–121. doi:10.1080/07388551.2017.1312271
Reddy, R.K., Bhargava, R., 2010. Chemometric Methods for Biomedical Raman Spectroscopy
and Imaging. In: Matousek, P., Morris, M.D. (Eds.), Emerging Raman Applications and
Techniques in Biomedical and Pharmaceutical Fields. Springer Berlin Heidelberg, Berlin,
Heidelberg, pp. 179–213. doi:10.1007/978-3-642-02649-2_8
Reed, J.L., Vo, T.D., Schilling, C.H., Palsson, B.O., 2003. An expanded genome-scale model
of Escherichia coli K-12 (iJR904 GSM/GPR). Genome Biology 4, R54. doi:10.1186/gb-
2003-4-9-r54
Ritz, D., Raley, J., Huff, K., Fernandez, J., Wu, J., Pu, Z., Marsh, D., Warr, S., Read, G.A.,
Finka, G., Patel, G.P., 2017. Use of Ambr250 As a Small Scale Model for Manufacturing-
Scale Single-Use Bioreactors. p. 250.
Rosano, G.L., Ceccarelli, E.A., 2014. Recombinant protein expression in Escherichia coli:
advances and challenges. Frontiers in Microbiology.
Ruano, P., Delgado, L.L., Picco, S., Villegas, L., Tonelli, F., Merlo, M., Rigau, J., Diaz, D.,
Masuelli, M., 2016. Increasing Recombinant Protein Production in E. coli by an Alternative
Method to Reduce Acetate. Intech 13. doi:10.5772/57353
Rydenfelt, M., Garcia, H.G., Cox III, R.S., Phillips, R., 2015. The Influence of Promoter
Architectures and Regulatory Motifs on Gene Expression in Escherichia coli. PLOS ONE
9, 1–31. doi:10.1371/journal.pone.0114347
Sawatzki, A., Hans, S., Narayanan, H., Haby, B., Krausch, N., Sokolov, M., Glauche, F.,
Riedel, S.L., Neubauer, P., Cruz Bournazou, M.N., 2018. Accelerated Bioprocess
Development of Endopolygalacturonase-Production with Saccharomyces cerevisiae
Using Multivariate Prediction in a 48 Mini-Bioreactor Automated Platform. Bioengineering
5. doi:10.3390/bioengineering5040101

Accelerating biological screenings through the combination of high-throughput and modeling
References 122
Scheidle, M., Jeude, M., Dittrich, B., Denter, S., Kensy, F., Suckow, M., Klee, D., Büchs, J.,
2010. High-throughput screening of Hansenula polymorpha clones in the batch compared
with the controlled-release fed-batch mode on a small scale. FEMS Yeast Research 10,
83–92. doi:10.1111/j.1567-1364.2009.00586.x
Schmideder, A., Severin, T.S., Cremer, J.H., Weuster-Botz, D., 2015. A novel milliliter-scale
chemostat system for parallel cultivation of microorganisms in stirred-tank bioreactors.
Journal of Biotechnology 210, 19–24. doi:10.1016/j.jbiotec.2015.06.402
Schubert, J., Simutis, R., Dors, M., Havlik, I., Lübbert, A., 1994. Bioprocess optimization and
control: Application of hybrid modelling. Journal of Biotechnology 35, 51–68.
doi:10.1016/0168-1656(94)90189-9
Selvarasu, S., Ow, D.S.-W., Lee, S.Y., Lee, M.M., Oh, S.K.-W., Karimi, I.A., Lee, D.-Y., 2009.
Characterizing Escherichia coli DH5α growth and metabolism in a complex medium using
genome-scale flux analysis. Biotechnology and Bioengineering 102, 923–934.
doi:https://doi.org/10.1002/bit.22119
Sezonov, G., Joseleau-Petit, D., D\textquoterightAri, R., 2007. Escherichia coli Physiology in
Luria-Bertani Broth. Journal of Bacteriology 189, 8746–8749. doi:10.1128/JB.01368-07
Shiloach, J., Fass, R., 2005. Growing E. coli to high cell density - A historical perspective on
method development. Biotechnology Advances 23, 345–357.
doi:10.1016/j.biotechadv.2005.04.004
Shiloach, J., Kaufman, J., Guillard, A.S., Fass, R., 1996. Effect of glucose supply strategy on
acetate accumulation, growth, and recombinant protein production by Escherichia coli
BL21 (λDE3) and Escherichia coli JM109. Biotechnology and Bioengineering 49, 421–
428. doi:10.1002/(SICI)1097-0290(19960220)
Šiurkus, J., Panula-Perälä, J., Horn, U., Kraft, M., Rimšeliene, R., Neubauer, P., 2010. Novel
approach of high cell density recombinant bioprocess development: Optimisation and
scale-up from microlitre to pilot scales while maintaining the fed-batch cultivation mode of
E. coli cultures. Microbial Cell Factories 9, 1–17. doi:10.1186/1475-2859-9-35
Sokolov, M., Ritscher, J., MacKinnon, N., Bielser, J.M., Brühlmann, D., Rothenhäusler, D.,
Thanei, G., Soos, M., Stettler, M., Souquet, J., Broly, H., Morbidelli, M., Butté, A., 2017.
Robust factor selection in early cell culture process development for the production of a
biosimilar monoclonal antibody. Biotechnology Progress 33, 181–191.
doi:10.1002/btpr.2374
Sousa, M., Santo, V.E., Becken, U., Serra, M., Lisboa, U.N. De, 2018. Culture of 3D Cell
Aggregates in Perfusion in a DASbox ® Mini Bioreactor System 1–8.
Stachowiak, H., 1973. Allgemeine Modelltheorie. Springer.
Stosch, M. von, Oliveira, R., Peres, J., Feyo de Azevedo, S., 2014. Hybrid semi-parametric
modeling in process systems engineering: Past, present and future. Computers and

Accelerating biological screenings through the combination of high-throughput and modeling
123 References
Chemical Engineering 60, 86–101. doi:10.1016/j.compchemeng.2013.08.008
Stosch, M. Von, Oliveria, R., Peres, J., Azevedo, F. de, 2012. Hybrid Modeling Framework for
Process Analytical Technology : Application to Bordetella Pertussis Cultures. Biotechnol.
Prog 28, 284–291. doi:10.1002/btpr.706
Subramanian, G., Erm, S., Abner, K., Seiman, A., Adamberg, K., Vilu, R., 2017. Study of Cells
in the Steady-State Growth Space. In: Continuous Biomanufacturing - Innovative
Technologies and Methods. pp. 233–258. doi:10.1002/9783527699902.ch9
Takahashi, M.B., Leme, J., Caricati, C.P., Tonso, A., Fernández Núñez, E.G., Rocha, J.C.,
2015. Artificial neural network associated to UV/Vis spectroscopy for monitoring
bioreactions in biopharmaceutical processes. Bioprocess and Biosystems Engineering
38, 1045–1054. doi:10.1007/s00449-014-1346-7
Tarca, A.L., Carey, V.J., Chen, X. wen, Romero, R., Drǎghici, S., 2007. Machine learning and
its applications to biology. PLoS computational biology 3.
doi:10.1371/journal.pcbi.0030116
Thomassen, Y.E., Sprang, E.N.M. van, Pol, L.A. van der, Bakker, W.A.M., 2010. Multivariate
data analysis on historical IPV production data for better process understanding and
future improvements. Biotechnology and Bioengineering 107, 96–104.
doi:10.1002/bit.22788
Toeroek, C., Cserjan-Puschmann, M., Bayer, K., Striedner, G., 2015. Fed-batch like cultivation
in a micro-bioreactor: screening conditions relevant for Escherichia coli based production
processes. SpringerPlus 4. doi:10.1186/s40064-015-1313-z
Tohsato, Y., Ikuta, K., Shionoya, A., Mazaki, Y., Ito, M., 2013. Parameter optimization and
sensitivity analysis for large kinetic models using a real-coded genetic algorithm. Gene
518, 84–90. doi:10.1016/j.gene.2012.11.080
Townshend, B., 2013. pyTecan [WWW Document]. URL
https://github.com/btownshend/pyTecan (accessed 2.7.21).
Ündey, C., Ertunç, S., Mistretta, T., Pathak, M., 2009. Applied advanced process analytics in
biopharmaceutical manufacturing: Challenges and prospects in real-time monitoring and
control. IFAC Proceedings Volumes (IFAC-PapersOnline) 7, 177–182.
doi:10.1016/j.jprocont.2010.05.008
Unthan, S., Radek, A., Wiechert, W., Oldiges, M., Noack, S., 2015. Bioprocess automation on
a Mini Pilot Plant enables fast quantitative microbial phenotyping. Microbial Cell Factories
14, 1–11. doi:10.1186/s12934-015-0216-6
Vaitkus, V., Brazauskas, K., Repšytundefined, J., 2020. Soft-Sensors Based on Black-Box
Models for Bioreactors Monitoring and State Estimation. In: Proceedings of the 2020 12th
International Conference on Bioinformatics and Biomedical Technology, ICBBT 2020.
Association for Computing Machinery, New York, NY, USA, pp. 43–47.
Accelerating biological screenings through the combination of high-throughput and modeling
References 124
doi:10.1145/3405758.3405780
Villadsen, J., Nielsen, J., Lidén, G., 2011. Bioreaction Engineering Principles. Springer US.
doi:10.1007/978-1-4419-9688-6
Viña Rodríguez, A., 2018. RNA virus detection and identification using techniques based on
DNA hybridization.
Vital-Jacome, M., Buitrón, G., Moreno-Andrade, I., Garcia-Rea, V., Thalasso, F., 2016.
Microrespirometric determination of the effectiveness factor and biodegradation kinetics
of aerobic granules degrading 4-chlorophenol as the sole carbon source. Journal of
Hazardous Materials 313, 112–121. doi:10.1016/j.jhazmat.2016.02.077
Wang, R.F., Kushner, S.R., 1991. Construction of versatile low-copy-number vectors for
cloning, sequencing and gene expression in Escherichia coli. Gene 100, 195–199.
Wang, X., Kruger, U., Irwin, G.W., 2005. Process monitoring approach using fast moving
window PCA. Industrial and Engineering Chemistry Research 44, 5691–5702.
doi:10.1021/ie048873f
Warr, S.R., Betts, J.P., Ahmad, S., Newell, K. V, Finka, G.B., 2013. Streamlined process
development using the Micro24 Bioreactor system. BMC Proceedings 7, 6–8.
doi:10.1186/1753-6561-7-s6-p36
Warr, S.R.C., 2014. Microbioreactors and Scale-Down Models: Growth of CHO Cells Using
the Pall Micro24 MicroReactor System. In: Animal Cell Biotechnology. Humana Press,
pp. 105–116. doi:10.1007/978-1-62703-733-4
Watson, T.G., 1969. Steady state operation of a continuous culture at maximum growth rate
by control of carbon dioxide production. Journal of general microbiology 59, 83–89.
doi:10.1099/00221287-59-1-83
Weuster-Botz, D., 2005. Parallel reactor systems for bioprocess development. Advances in
Biochemical Engineering/Biotechnology 92, 125–143. doi:10.1007/b98916
Xu, B., Jahic, M., Enfors, S.-O., 1999. Modeling of overflow metabolism in batch and fed-batch
cultures of Escherichia coli. Biotechnology progress 15, 81–90. doi:10.1021/bp9801087
Yazdani, A., Lu, L., Raissi, M., Karniadakis, G.E., 2020. Systems biology informed deep
learning for inferring parameters and hidden dynamics. PLoS Computational Biology 16,
1–19. doi:10.1371/journal.pcbi.1007575
Yoshida, F., Yamane, T., Nakamoto, K.-I., 1973. Fed-batch hydrocarbon fermentation with
colloidal emulsion feed. Biotechnology and Bioengineering 15, 257–270.
doi:10.1002/bit.260150204
Youngblut, N., 2017. pyTecanFluent [WWW Document]. URL
https://pypi.org/project/pyTecanFluent/ (accessed 2.7.21).
Zampieri, G., Vijayakumar, S., Yaneske, E., Angione, C., 2019. Machine and deep learning
meet genome-scale metabolic modeling. PLoS Computational Biology 15, 1–24.

Accelerating biological screenings through the combination of high-throughput and modeling
125 References
doi:10.1371/journal.pcbi.1007084
Zareef, M., Chen, Q., Hassan, M.M., Arslan, M., Hashim, M.M., Ahmad, W., Kutsanedzie,
F.Y.H., Agyekum, A.A., 2020. An Overview on the Applications of Typical Non-linear
Algorithms Coupled With NIR Spectroscopy in Food Analysis. Food Engineering Reviews
12, 173–190. doi:10.1007/s12393-020-09210-7
Zhang, D., Rio-Chanona, E.A. Del, Petsagkourakis, P., Wagner, J., 2019. Hybrid physics-
based and data-driven modeling for bioprocess online simulation and optimization.
Biotechnology and Bioengineering 116, 2919–2930. doi:10.1002/bit.27120
Zhu, X., Rehman, K.U., Wang, B., Shahzad, M., 2020. Modern Soft-Sensing Modeling
Methods for Fermentation Processes. Sensors 20. doi:10.3390/s20061771
Zimmermann, H.F., Rieth, J., 2006. A Fully Automated Robotic System for High Throughput
Fermentation. JALA - Journal of the Association for Laboratory Automation 11, 134–137.
doi:10.1016/j.jala.2006.03.003
Zimmermann, H.F., John, G.T., Trauthwein, H., Dingerdissen, U., Huthmacher, K., 2003.
Rapid evaluation of oxygen and water permeation through microplate sealing tapes.
Biotechnology Progress 19, 1061–1063. doi:10.1021/bp025774t
Zweck, A., Holtmannspötter, D., Braun, M., Cuhls, K., Hirt, M., Kimpeler, S., 2015. Forschungs-
und Technologieperspektiven 2030 Ergebnisband 2 zur Suchphase von BMBF-Foresight
Zyklus II.

Accelerating biological screenings through the combination of high-throughput and modeling
1 References
Recent doctoral theses at Bioprocess Engineering, TU Berlin
1. Robert Giessmann (2020) Prediction of kinetics and yields of nucleoside phosphorylase reactions and derived enzymatic reaction cascades
2. Klaus Pellicer Alborch (2020) Cocci chain length distribution as control parameter in scaling lactic acid fermentations
3. Ángel Córcoles García (2019) Molecular genetic approaches to decrease mis-incorporation of non-canonical branched chain amino acids into a recombinant protein in Escherichia coli
4. Moonsung Cho (2019) Suspension of a point-mass-loaded filament in non-uniform flows: the ballooning flight of spiders
5. Sarah Kamel (2019) Enzymatic synthesis of -D-pentosefuranose-1-phosphate
6. Heba Yehia Mohamed (2019) Chemoenzymatic synthesis of nucleoside analogs as potential medicinal agents
7. Funda C. Ertem (2019) Life cycle assessment and modeling approaches as a combined evaluation tool for sustainable control strategies at biogas plants
8. Emmanuel Anane (2019) Model based strategies for scale-down studies in fed-batch cultivation of Escherichia coli expressing protein
9. Ekaterina Osmekhina (2018) Quantitative approach for detection of RNA and proteins by sandwich hybridization technology
10. Elvis Legala (2018) Reconstruction of the lanthipeptide ruminococcin-A biosynthesis machinery in Escherichia coli and structural characterization
11. Anika Bockisch (2018) Mobile multi-parameter measurements for the dynamic analysis of gradients in brewing vessels
12. Juan Antonio Arzate (2018) Modeling and simulation of biogas production based on anaerobic digestion of energy crops and manure
13. Anna Maria Marbá (2018) Monitoring of the single-cell morphology for the evaluation of microbial eukaryotic bioprocesses
14. Martin Kögler (2018) Advanced Raman spectroscopy for bioprocess monitoring
15. Anja Lemoine (2017) Impact of oscillations in substrate and oxygen availability on Corynebacterium glutamicum cultivations
Full copies of the theses are available at https://depositonce.tu-berlin.de/.