Family Medicine Accelerated Track: Experiences in Implementing a 3-Year Medical Degree

Accelerated Degree courses Assessment of Impact
November 2018

2
Contents
Problem under consideration 6
Rationale for Intervention 7
Policy Objectives 9
A Comparison of Accelerated and Standard degree courses 9
Description of Policy Options 11
Changes to the HE regulatory framework 11
Analysis of Option 0 13
Costs and Benefits 13
Analysis of Option 1 14
Analytical framework to understand cost and benefits of the reform 14
Key behavioural assumptions 17
Accelerated student numbers 21
Main scenario 23
Transformative scenario 26
Costs and Benefits for HE Providers 26
Costs and Benefits for Students 31
Core Students 31
Switching Students 32
New students 35
Costs and Benefits for Government and Taxpayers 37
Net Economic Impact 41
Risks and uncertainty 43
Small and Micro Business Assessment 46
Appendix A: Population Estimates 47
Appendix B: Accelerated Student Number Estimates 50
Option 0 – Do Nothing 50
Option 1 – Increase fee and fee loan caps 50
Best estimate- Cautious growth scenario 50
High Estimate – Transformative growth scenario 51
Appendix C: Earnings modelling 54
Average Earnings Growth 54
Earnings while studying 55

3
Labour market outcomes by age for graduates and non-graduates 56
Tax and Student Loan Repayments 59
Appendix D: Sensitivity Analysis 61
Costs of accelerated provision 61
Split between Switching and New Students 63
Approved provider response to Policy Option 1 63
Additional students at Approved providers 65
Alternative Provider registrations under new Regulatory Framework 66

4
Title: Supporting growth in Accelerated Courses
IA No: DFE099
RPC Reference No: n/a Lead department or agency: Department for Education
Other departments or agencies:
Impact Assessment (IA) Date: 18/11/18
Stage: Final
Source of intervention: Domestic
Type of measure: Secondary legislation Contact for enquiries: [email protected]
Summary: Intervention and Options
RPC Opinion: Not Applicable Cost of Preferred (or more likely) Option
Total Net Present Value
Business Net Present Value
Net cost to business per year (EANDCB in 2014 prices)
One-In, Three-Out
Business Impact Target Status £131.1m £36.0m £-3.4m Not applicable
What is the problem under consideration? Why is government intervention necessary? Accelerated courses result in the same qualification and have similar content to standard courses but delivery is compressed, e.g. a degree course is delivered in two rather than three years. Despite the benefits of accelerated courses - increasing student choice and opportunities for lifelong learning and widening participation – only around 0.25% of first degree undergraduate students at English HE providers are studying accelerated courses. Providers report that annual fee caps set in legislation represent a regulatory barrier to greater provision by limiting the amount they can charge a student to cover their costs.
What are the policy objectives and the intended effects? Reducing the effect of this regulatory barrier to provision should encourage HE providers to offer more accelerated courses. Greater provision of accelerated courses will: (i) improve student choice - increasing provision will give students a greater choice as to how they study, enabling them to enter or re-enter employment more quickly; (ii) reduce the overall cost of obtaining a degree, benefiting students and the taxpayer; (iii) increase opportunities for lifelong learning – the shorter duration of accelerated courses can be attractive to mature students looking to progress their careers; (iv) widen participation - increasing the variety of courses on offer should attract students into HE who may have not considered it previously. Overall, this should support social mobility and economic growth.
What policy options have been considered, including any alternatives to regulation? Please justify preferred option (further details in Evidence Base) The options under consideration are:
• Option 0: Do nothing (counterfactual). Maintain alignment between standard full-time and accelerated course fee caps.
• Option 1: Increase the fee caps for accelerated courses to 120% of the standard full-time course fee and fee loan cap (preferred).
Will the policy be reviewed? Yes. If applicable, set review date: 2021/22 Does implementation go beyond minimum EU requirements? N/A
Are any of these organisations in scope? Micro Yes
Small Yes
Medium Yes
Large Yes
What is the CO2 equivalent change in greenhouse gas emissions? (Million tonnes CO2 equivalent)
Traded:
Non-traded:
I have read the Impact Assessment and I am satisfied that, given the available evidence, it represents a reasonable view of the likely costs, benefits and impact of the leading options.
Signed by the responsible Minister: Date: 28/11/2018

5
Summary: Analysis & Evidence Policy Option 1 Description: Increase the fee and fee loan cap for Accelerated first degrees to 120% of the standard full-time cap FULL ECONOMIC ASSESSMENT
Price Base Year 2017
PV Base Year 2019
Time Period Years 10
Net Benefit (Present Value (PV)) (£m) Low: High: 293.7 Best Estimate: 131.1
COSTS (£m) Total Transition (Constant Price) Years
Average Annual (excl. Transition) (Constant Price)
Total Cost (Present Value)
Low 1
High 2.3 111.0 880.0
Best Estimate
2.3 44.4 362.3 Description and scale of key monetised costs by ‘main affected groups’ Overall, this is a deregulatory measure for providers. Annual course costs increase, improving provider revenues and allowing them to expand accelerated provision. In the case of students who would have taken an accelerated course anyway, this is a pure economic transfer to providers. However, for students switching, or those now able to access HE, it allows them to obtain a degree at a reduced cost. Overall, students face additional fees of £6.9m per year (with a corresponding increase in taxpayer funded fee loan outlay). Long Course Loan outlay increases to £8.9m per year, while lower maintenance costs for students mean reduced Maintenance Loan outlay of £7.4m per year. Providers’ course delivery costs increase by £.2.7m per year. Due to the increased graduate labour supply, there is a boost to the UK economy that results in an increase in tax revenues, estimated to at £2.7m per year. The economic costs are additional students’ foregone earnings (£9.1m per year) and Student Loans Company system transition costs (£2.3m in 2019). Other key non-monetised costs by ‘main affected groups’ HE providers who set up new Accelerated courses face additional design, marketing and other set-up costs, which we have not been able to monetise separately from general costs of provision from the existing evidence. It is assumed that providers will judge the benefits of offering an accelerated course to at least offset the costs. Additional students may also face a change in their living costs, which we are unable to monetise (e.g. non-fee course costs such as travel and books, or accommodation expenses). BENEFITS (£m) Total Transition
(Constant Price) Years
Average Annual (excl. Transition) (Constant Price)
Total Benefit (Present Value)
Low 0
High 0 149.4
1,173.7
Best Estimate
0 61.6 492.8 Description and scale of key monetised benefits by ‘main affected groups’ This reform is deregulatory in nature as it allows providers to charge a higher tuition fee cap for accelerated courses and so makes them economic to offer and expand. The deregulatory benefit of this policy is providers’ increased fee income (£6.9m per year, of which £4.1m is direct and £2.8m is indirect). The net economic benefit is driven by students’ higher earnings as graduates (£26.3m per year), as a result of entering graduate employment a year earlier, or from new students entering Higher Education. Other benefits correspond to the transfers described above as costs. Other key non-monetised benefits by ‘main affected groups’ Students who undertake Accelerated courses who would not otherwise have taken a HE course would receive non-monetised benefits in the form of better health outcomes and wellbeing, and may pass on benefits to their children. The wider economy would benefit from productivity spill-overs and a range of non-economic benefits from having a higher proportion of the population with a degree e.g. reduce crime, greater social stability. Key assumptions/sensitivities/risks Discount rate (%) 3.5% After consultation, we remain unable to make robust estimates of future demand and supply for accelerated degrees. Evidence gathered so far shows that demand for accelerated degrees exists but several providers responded to the consultation that the scale of it is uncertain. As we have limited evidence on the costs of accelerated provision, we model two growth scenarios and test the sensitivity of our analysis to our assumptions.
BUSINESS ASSESSMENT (Option 1)
Direct impact on business (Equivalent Annual) £m: Score for Business Impact Target (qualifying provisions only) £m:
Costs: 0 Benefits: 3.4 Net: 3.4

6
Problem under consideration 1. Accelerated degree courses result in the same qualification as traditional undergraduate
honours degree courses and normally have the same curriculum and content. However, an accelerated course is compressed - the most common scenario being that a degree course is typically delivered in two years instead of three. This accelerated delivery is usually achieved by having shorter or fewer academic breaks during the year, for example by running the course through the summer.
2. The Government recognises the benefits accelerated degree courses can bring through increasing student choice and opportunities for lifelong learning and widening participation. For example, accelerated courses allow graduates to get back into full time employment with their new credentials faster, and the personal costs (including foregone earnings while studying) are lower than for a standard course. There is also evidence that accelerated degree courses can encourage greater participation in Higher Education (HE)1.
3. Accelerated courses have historically appealed to mature students seeking to enhance their careers by studying vocational degrees, though future demand is not constrained to this group. From 2005 to 2010 the Higher Education Funding Council for England (HEFCE) funded several accelerated degree courses for its Flexible Learning Pathfinder Project2. It concluded that accelerated degree courses reported a higher proportion of mature students (21 years old and greater) than the equivalent standard length programme (63% compared to 34%). Increased provision of accelerated degree courses could therefore be a welcome offer for this group.
4. Despite the benefits of accelerated degree courses we estimate that in 2016/17 only 4,470 undergraduate students were enrolled on two-year accelerated degree courses at English HE providers. Currently no data are collected on accelerated courses or students specifically. Instead we construct an estimate from a data source on courses matched with a dataset of students3. We found students on accelerated courses at 16 HEFCE-funded Higher Education Institutions (HEIs) and 12 designated Alternative Providers (APs). These 4,470 students are a small fraction, just 0.25%, of the 1.6 million undergraduate student population4.
1 Outram, Steve, 2009, “Flexible Learning Pathfinders: a review of the pilots’ final and interim reports”, Higher Education Academy, https://www.heacademy.ac.uk/system/files/hea_evaluation_report_aug09.doc 2 HEFCE, 2011, “Flexible Learning Pathfinders: key statistics 2008-09”, http://www.hefce.ac.uk/pubs/year/2011/201105/ 3 See Appendix A for how we estimated the accelerated student population. 4 According to HESA in 2016/17 there were 1,434,515 undergraduates enrolled at English HEIs, 123,230 undergraduates enrolled at Further Education Colleges, and 51,870 undergraduates enrolled at English designated APs, https://www.hesa.ac.uk/data-and-analysis/sfr249/figure-10

7
Rationale for Intervention 5. Providers may wish to offer accelerated courses as it appeals to students for whom more
traditional degree courses may be a less practicable option, for example because of their individual circumstances. However, the availability of accelerated course may be lower than the level which students would currently like and providers are prepared to offer.
6. A call for evidence by the Department for Education on accelerated degree courses concluded that the most significant barrier to their provision was financial5. This was further confirmed by recent responses to the consultation6.
7. Tuition fees and fee loans are regulated through annual caps and the amount publicly-funded HE providers are allowed to charge per year for undergraduate degree course tuition is the same regardless of course length. Caps vary, depending on whether the provider has an access agreement or TEF award7. For academic years 2017/18 and 2018/19, the highest fee cap stands at £9,250, for HEFCE-funded providers with a TEF award and an access agreement. Full-time fee caps for all categories of providers are set out in Table 1.
8. The existence of the fee cap therefore means that a provider will receive less fee income if the student opts for a shorter accelerated degree course instead of a traditional degree course8. Since accelerated degrees typically involve one year less of study, providers forego one year of fee income by offering accelerated degrees.
9. As well as receiving less fee income for accelerated degree courses, research suggests that they are proportionately more expensive for providers to deliver on a per year basis. A costing study of the HEFCE Pathfinder Projects found that, “on an indicative basis”, the cost
5 Department for Education, 2016, “Accelerated courses and switching university or degree: call for evidence”, https://www.gov.uk/government/consultations/accelerated-courses-and-switching-university-or-degree-call-for-evidence 6 The consultation collected views on the proposal to introduce an accelerated annual fee cap set 20% higher than the standard cap. Details are available at https://www.gov.uk/government/consultations/accelerated-degrees-widening-student-choice-in-higher-education 7 TEF awards are available to providers who take part in the Teaching and Student Outcomes Excellence Framework (TEF) carried out by the Office for Students or, before April 2018, HEFCE. More information is available on the Office for Students website at https://www.officeforstudents.org.uk/advice-and-guidance/teaching/what-is-the-tef/ Access agreements for 2017/18 and 2018/19 were approved by the Director of Fair Access. From April 2018, these will be replaced by Access and participation plans, approved by the Office for Students’ Director of Fair Access and Participation. 8 HEFCE does provide a small financial contribution to those institutions it funds which offer an accelerated course, but this contribution equates to £800-£1,400 per student per year – far below the foregone fee income of a year of tuition fees. The allocation of this contribution is outside the scope of this policy.

8
of delivering a two-year accelerated degree could be between 6.5% and 11% more per year than a three-year standard full-time degree9.
10. The HEFCE study also found that changes to institutional processes, such as staff contracts, exam timetables, IT and library services would be needed. The cost of changing these systems is likely to be a further financial disincentive for providers, and economies of scale would be possible only if accelerated degree courses become more widespread.
11. In response to the Department’s call for evidence and consultation, providers also reported a number of other concerns10. These include demand uncertainty; the need for a flexible workforce, including ensuring time for staff to undertake research or scholarly activity. Providers also reported and changes needed in institutional processes including support mechanisms for students across the whole academic year and exam and assessment timetables.
12. This evidence on the transition and on-going delivery costs for accelerated courses has formed the basis for our preferred Policy Option. Given the benefits of accelerated degree courses, the Government is committed to easing the financial constraint to increased provision created by the tuition fee caps set in The Student Fees (Amounts) (England) Regulations 2004 (as amended). We would expect the intervention to bring about greater growth in the market for accelerated degree courses.
9 Foster, Will, Liz Hart & Tony Lewis, 2011, “Costing study of two-year accelerated honours degrees”, Higher Education Funding Council for England, http://www.hefce.ac.uk/media/hefce/content/pubs/indirreports/2011/RE,0311/rd03_11.pdf 10 Department for Education, 2016, “Accelerated courses and switching university or degree: call for evidence”, https://www.gov.uk/government/consultations/accelerated-courses-and-switching-university-or-degree-call-for-evidence Department for Education, 2017, “Accelerated degrees: widening student choice in higher education”, https://www.gov.uk/government/consultations/accelerated-degrees-widening-student-choice-in-higher-education

9
Policy Objectives 13. The Government’s overarching aim for HE is to ensure all students that have the potential
to benefit from entering HE can do so. Removing the financial disincentive to accelerated degree course provision should lead to a greater diversity of HE market offer, encouraging growth in the market which would:
1. Improve student choice. Increased provision of accelerated degree courses will give students a greater choice as to how they study, how quickly they enter or re-enter employment and the financial investment they make.
2. Increase the opportunities for lifelong learning. Accelerated degree courses offer a different student experience to the traditional route. The more intense mode of study with the opportunity to enter or re-enter employment sooner has to date been popular with mature students looking to progress their careers.
3. Widen Participation. Increasing the variety of degree courses providers offer should attract individuals into higher education who may have not considered it previously, such as mature students who may be attracted to being able to re-enter the labour market sooner.
A Comparison of Accelerated and Standard degree courses 14. Students’ needs and circumstances can vary significantly when studying for a HE
qualification. As such, there is no single optimal mode of degree delivery. This section sets out the different reasons why a student may favour an accelerated degree course over a standard degree course, and vice versa.
15. Accelerated degree courses are typically completed in two years instead of the standard three years.11 This is usually accommodated within the academic year by including an additional semester which is taught over summer when a standard student would be on vacation. The total number of teaching weeks for both degrees are typically the same, though there are no plans to stipulate the number of teaching weeks that providers would need to offer for accelerated courses.
16. The relative advantages of an accelerated degree course for students are:
1. The total cost of an accelerated degree course to the student would be lower than a standard degree course. This is due to lower fees for the whole course at most
11 It is also possible for a four-year course to be offered as a three-year course, although we have found few examples.

10
providers12. It also means lower maintenance costs over the whole degree course, especially where the student studies away from home.
2. Since the course is shorter, an accelerated student has the opportunity to start earning a graduate salary earlier than a standard student.
3. Accelerated students only forego two years of earnings to obtain a degree instead of three years for a standard student. This relative advantage (and the one above) will be particularly appealing to mature students who want to return to the workplace quickly.
17. The relative disadvantages of an accelerated degree course for students are:
1. Accelerated students cannot work a full-time job in the summer vacation. A standard student has this opportunity, and could use the income they earn to offset the cost of studying. An accelerated student, by contrast, would have more limited options to earn additional income.
2. Some students may prefer a longer course and the greater time this gives them to experience Higher Education. The level of study required on an accelerated degree is more intense, and will not appeal to all students. This is reflected in current admissions processes for accelerated degrees13.
18. There is no evidence regarding the relative labour market and broader outcomes of accelerated and standard degree courses. These are therefore assumed to be same throughout our analysis.
12 Some APs set accelerated fees so that whole course fees are the same as for standard degrees. HEFCE-funded providers currently set annual fees as the same across accelerated and standard courses. 13 Department for Education, 2016, “Accelerated courses and switching university or degree: call for evidence”, https://www.gov.uk/government/consultations/accelerated-courses-and-switching-university-or-degree-call-for-evidence

11
Description of Policy Options 19. The Higher Education and Research Act 2017 enables the Secretary of State to set in
secondary legislation an annual fee cap for an accelerated course that is higher than the fee cap for the standard equivalent version of that course.
20. We therefore consider the following policy options:
1. Option 0: Do nothing (counterfactual). Maintain the current alignment between standard and accelerated course fee and fee loan caps.
2. Option 1: Increase fee and fee loan caps for accelerated courses to 120% of standard full-time course caps (preferred). Full-time courses which are accelerated from three years to two years are in scope.
Changes to the HE regulatory framework 21. The Government proposes to introduce the cap increase from academic year 2019/20
onwards, by which point the HE sector will be operating under a new regulatory framework. Under the new system, HE providers would be able to register with the regulator, the Office for Students (OfS), as one of two provider types:
• Approved (fee cap) – analogous to current HEFCE-funded providers that have a maximum fee cap of £9,250 and a basic fee cap of £6,165 for 2017/18, and whose students have access to a tuition fee loan equal to their tuition fees14. We expect all current HEFCE-funded providers and some APs to register as Approved (fee cap) providers.
• Approved – analogous to the designated APs that currently have no cap on fees, but whose students are eligible for a maximum of £6,125 in tuition fee loan15.
22. Providers who do not register would have no regulation of their fees and their students would not be eligible for any tuition fee loan. Therefore, these providers are outside the scope of this policy.
23. Table 1 below compares the fee levels which Approved (fee cap) providers would be able to charge under the different policy options in current prices for 2017/18 and 2018/19 levels.
14 This “maximum” fee cap applied to providers with an access agreement in place, while the “basic” cap applies to providers without an access agreement. All HE Institutions and 75 Further Education Colleges currently have an access agreement in place. 15 Office for Students, 2018, Securing student success: Regulatory framework for higher education in England, https://www.officeforstudents.org.uk/media/1047/ofs2018_01.pdf

12
Table 1: Comparative fee and fee loan caps levels for Approved (fee cap) providers for 2017/18 and 2018/19 caps, nominal prices
Policy Option 0 Do nothing
Policy Option 1 20% uplift to caps (Preferred option)
With access agreement and TEF award £9,250 £11,100 16
With access agreement, no TEF award £9,000 £10,800
Without access agreement, with TEF award £6,165 £7,398
Without access agreement or TEF award £6,000 £7,200
24. Policy Options 0 and 1 would not have a direct effect on fees at Approved providers, who are not subject to a fee cap, but would increase the fee loan students could claim at Approved providers. The loan cap corresponds to the fee cap for providers without access agreements. As such, under the Do Nothing option students would continue to face a cap of £6,165 per year at Approved providers with TEF awards (or £6,000 per year at providers without TEF awards). For Option 1, the fee loan cap would rise to £7,398 for providers with TEF awards and £7,200 for providers without TEF awards.
25. Our work has identified accelerated courses operating in both the existing HEFCE-funded part of the sector and amongst Alternative Providers. Providers will need to choose which of the two provider categories set out at paragraph 19 they wish to operate in under the new regulatory framework. We assume:
• As all of the HEFCE-funded providers have access agreements and TEF awards in place, they will operate as Approved (fee cap) and be subject to the “maximum” fee cap (equivalent to £9,250 in 2017/18 for a standard course).
• That Alternative Providers choose to either register as Approved (fee cap) with an access agreement (and so subject to the “maximum” cap but able to access provider grant funding), or as Approved (i.e. not subject to any fee cap, but with loan funding capped at the basic level and no access to grant funding). This is based on the understanding, that most students on accelerated courses in this part of the sector pay £8,000 per year or more already above the fee loan cap of £7,398 for Approved (fee cap) providers without access agreements.17
16 All publicly-funded providers we identified with accelerated courses have an access agreement and TEF in place, so the following analysis uses the highest “maximum” fee cap. 17 Registering as Approved (fee cap) without an access agreement has two disadvantages. Firstly, it would mean that providers are not able to access grant funding which could otherwise be used to cover the additional cost of providing high cost subjects (which cost more than the tuition fee cap). This prevents them from teaching a broader range of courses, which improves their offer to students making them a more attractive place to study. It would also mean that they cannot charge higher course fees, and use the additional income which this brings in to invest in teaching and facilities to improve their offer to students. For a fuller explanation see the consultation impact assessment on the risk-based regulatory framework which can be found at https://www.gov.uk/government/consultations/office-for-students-regulatory-framework-for-higher-education.

13
Analysis of Option 0 26. In the Do Nothing option there would continue to be an alignment between standard and
accelerated course fee caps. As such, providers subjected to the fee cap will be unable to charge higher fees for accelerated courses, and there would continue to be a financial disincentive to increase accelerated course provision. There would also be no concomitant change to the financial support available to students at Approved providers.
Costs and Benefits 27. As the current fees and financial support for these courses would remain unchanged, there
would be no corresponding impact on students and accordingly the taxpayer (in terms of loan outlay).
28. We also assume that there would be no additional growth in the supply of places on accelerated courses at either Approved or Approved (fee cap) providers. This is because we expect the current fee cap system will continue to serve as a financial disincentive to increased provision, and as a result limit available places to their present levels.
29. Furthermore, consultation responses from providers show a mixed picture, with some providers expanding, while others have closed courses. In our population estimates we identified six providers (three publicly-funded and three APs) which have ceased to offer accelerated courses since 2016/17. Consequently, we assume no growth in the number of UK- and EU-domiciled students18 and no increase in the UK’s supply of highly skilled labour. The resulting student numbers are presented in Table 4 and Table 5. Further details are included in Appendices A and B.
18 The OBR’s forecast of student numbers shows broadly flat growth in student numbers between 2017/18 and 2022/23. This reflects a fall in the young population and an increase in the HE participation rate. See Table 2.45 here: http://obr.uk/download/march-2018-economic-and-fiscal-outlook-supplementary-fiscal-tables-receipts-and-other/

14
Analysis of Option 1 30. The Government has set out its intention that the overall cost of an accelerated course, in
terms of total fees paid by the student, will never exceed the total amount which a student can expect to pay on the same course with a longer duration of study.
31. Under Option 1 fee and fee loan caps for accelerated courses would increase to 120% of the fee and fee loan cap for a standard full-time degree. While this does not mean providers would receive the same total fee income from a two year course compared to one lasting three years, it would provide better value for students and recognises the potentially significant cost savings to providers of running courses for one less year, based on published HEFCE estimates19.
32. For the purposes of this impact assessment, we consider only the impact of increased provision of accelerated degree courses and places at Approved (fee cap) providers with access agreements that are able to currently charge up to the maximum fee cap of £9,250, and Approved providers that are designated for student support but are not subject to a fee cap. This reflects the type of providers we have identified which currently run accelerated courses and the categories they are likely to operate in under the new regulatory framework (see paragraph 23).
Analytical framework to understand cost and benefits of the reform 33. Increasing the fee cap is a deregulatory measure. It should create better opportunities for
Approved (fee cap) providers to increase the number of accelerated degree courses and places they offer where the cost of provision exceeds the current fee cap. The evidence suggests the current level of the cap restricts providers’ ability to recoup the additional annual costs of an accelerated course, which in turn is holding back increased provision.
34. The deregulatory benefit can be measured through the additional fee income received by providers, net of the costs of provision. The direct benefit arises through the ability to increase fees for students who would have undertaken an accelerated course under Option 0 (Do Nothing). These benefits are included in the Equivalent Annual Net Direct Cost to Business (EANDCB) estimate. There is a further indirect deregulatory benefit of increased fee income, resulting from behavioural changes to expand provision to additional students. These indirect benefits require discretionary action by providers to set up or significantly expand courses. According to consultation responses and our engagement with the sector, there are further barriers to expansion beyond the financial. As
19 Foster, Will, Liz Hart & Tony Lewis, 2011, “Costing study of two-year accelerated honours degrees”, Higher Education Funding Council for England, http://www.hefce.ac.uk/media/hefce/content/pubs/indirreports/2011/RE,0311/rd03_11.pdf

15
such, providers may need to be innovative in their marketing and organisational practices to overcome these further barriers.
35. These greater revenues represent an economic transfer from students (or the taxpayer, given most students will fund their tuition costs via a Government backed loan and not all of these loans will be repaid) and therefore do not translate into a net economic benefit. The benefit to the economy lies in the greater productivity arising from an increase in the graduate labour supply.
36. Demand for accelerated degrees arises due to the overall benefits of Higher Education for students20, and because accelerated courses enable motivated students to enter the labour market more quickly. Even with the 20% increase in the annual fee cap, the benefits of accelerated courses will continue to outweigh the costs for many students, including many who would not be able to take up an accelerated place without an expansion in supply.
37. The key costs and benefits associated with the reform are discussed in more detail in the rest of this analysis and are summarised in Table 2 below. The flows of costs and benefits between the main affected groups is illustrated in Figure 1.
Table 2: Key costs and benefits of Policy Option 1
Affected group
Benefit Cost Key assumptions
Providers Higher cap represents deregulation – allowing the sector to provide greater access to accelerated degree option. Increase annual fee revenues (directly from increased fee cap and indirectly from increased student numbers) and greater fulfilment of institution mission (which in most cases will not be profit-making)
Set up cost of running expanded accelerated option.
Lost revenue at providers who do not offer accelerated courses and consequently lose students to other providers in the HE sector that do.
Lost income to providers from students switching from 3 to 2 year courses.
Up to providers whether to offer accelerated provision, so assume costs of doing so outweighed by expected benefits.
Level of cap
Charging practice of providers
Number of providers expanding accelerated provision.
Students Greater ability to access accelerated course which enables study at higher level and accordingly the
Those who would already do accelerated degrees may face higher fees.
Number of students taking up accelerated courses and extent to which they are new to
20 Department for Business Innovation & Skills, 2013, “The Benefits of Higher Education Participation for Individuals and Society: key findings and reports “The Quadrants””, BIS Research Paper No. 146, https://www.gov.uk/government/uploads/system/uploads/attachment_data/file/254101/bis-13-1268-benefits-of-higher-education-participation-the-quadrants.pdf

16
Affected group
Benefit Cost Key assumptions
prospect of higher future wages.
Cost saving where otherwise would have done standard three-year course.
More time in the labour market with HE qualification and able to earn graduate premium.
Those new to HE have to meet cost of accelerated provision
Reduced ability to earn additional income from summer work to partially offset the costs of study
Foregone earnings of students who would not otherwise participate in HE
HE or switchers from other courses.
Estimated wage returns of having a higher education degree.
Fee setting behaviour by providers
Government / taxpayer
More graduates spending longer in the labour market means greater tax revenues.
Reduction in maintenance and fee loans where students switches to two-year course (both in short-term outlay and in long-term cost due to write off of outstanding loans after 30yrs).
Lower RAB charge compared to standard 3-year course21.
Greater tuition fee and maintenance loan outlay on those who otherwise would not have gone to HE.
Increased tuition fee loan outlay for those who would have done accelerated course anyway.
Adapting SLC systems to accommodate higher fee levels for accelerated courses
Number of students taking up accelerated courses and extent to which they are new to HE or switching from other courses.
Fee setting behaviour by providers
Borrowing behaviour of students
Graduate earnings (both tax and repayments)
Other Employers benefit from more rapid entry of high-skilled labour supply into the labour market, plus spill over benefits from graduate employment
Increase in wage bill, but more than offset by productivity gains from hiring graduate worker.
Increase in graduates in labour market
Size of spillover effect.
21 DfE analysis using DfE’s repayment model for a population of students on a two-year degree course, assuming they have the same characteristics and outcomes as the population on three-year degree courses entering HE in 2017. We assume the same characteristics in the absence of evidence on the composition of the accelerated student population. The estimate is rounded to the nearest 5 percentage points.

17
Figure 1: Flows of costs and benefits between main affected groups
Tax, Loan repayments
Student loans (Tuition fee, Maintenance)
Grants and allowances
Government/ Taxpayer
Other costs: SLC system set-up
Students
Other benefits: Earnings
HE Providers
Other costs: Course delivery
Fees
Key behavioural assumptions 38. This section outlines our assumptions regarding the behavioural response of HE providers
and students to higher fee caps to accelerated degree courses. These underlying assumptions form the basis of our analysis.
Assumption 1
HE providers will offer more accelerated degree courses. In our call for evidence, providers explained that fee caps were a key financial disincentive to increased accelerated degree course provision22. By increasing fee caps, accelerated degree courses will become more financially viable for providers. This assumption is supported by the consultation responses from HEFCE-funded providers that reported their plans for growth. A significant increase in provision will also depend on providers overcoming other reported barriers such as the need for a flexible workforce and for staff to undertake research or scholarly activity during the summer period.
Assumption 2
The supply of new accelerated degree courses and places will increase over time. According to providers’ responses to the call for evidence and consultation, it will take providers time to establish demand, design courses and put in place enablers (e.g. staff
22 Department for Education, 2016, “Accelerated courses and switching university or degree: call for evidence”, https://www.gov.uk/government/consultations/accelerated-courses-and-switching-university-or-degree-call-for-evidence

18
contracts and infrastructure such as exam and assessment timetables and student support services for additional semesters) to provide accelerated degree courses. Furthermore, providers would need sufficient time to advertise their courses. Some providers may take time to better understand demand for accelerated courses and make decisions about setting up new courses. We therefore expect to see the number of accelerated students to grow over the ten-year period considered in this consultation Impact Assessment.
Assumption 3
On average Approved (fee cap) providers will set accelerated fees at the new maximum cap. We base this expectation on HEIs previous fee-setting behaviour since the increased fee cap in 2012, and consultation responses on the cost of accelerated provision.
Fee and fee loan caps for 2018/19 have been frozen at the 2017/18 nominal values. Our analysis, in line with the practice adopted by the Office for Budget Responsibility (OBR) when forecasting Government expenditure, assumes that the previous policy intention of inflation-linked fee rises beyond 2018/19 is still in place, and therefore that all fee levels from 2018/19 are constant in real terms.
OFFA estimate that in 2018/19 the average fee at English HEFCE-funded HEIs will be £9,112 (after fee waivers, current prices23, which is 98.5% of the maximum cap. In 2017 prices, this is £8,975 per year. HEFCE-funded HEIs currently set accelerated fees at the maximum cap, so we use this cap as the accelerated fee under the Do Nothing option. Details on fees and fee and loan caps in current and 2017 prices are presented in Table 3.
23 OFFA, 2017, “Access agreements for 2018-19: key statistics and analysis”, https://www.offa.org.uk/wp-content/uploads/2015/03/Access-agreement-2018-19-key-facts-revised-OFFA-201708.pdf

19
Table 3: Assumptions for fee and fee loan values
2018/19 fee levels in nominal prices Fee levels for Impact Assessment period in 2017 prices24
Standard
under both Options
Accelerated under
Option 0
Accelerated under
Option 1
Standard under both
Options
Accelerated under
Option 0
Accelerated under
Option 1
Maximum fee cap at Approved (fee cap) providers
£9,250 £9,250 £11,100 £9,111 £9,111 £10,933
Average fee at Approved (fee cap) providers
£9,112 £9,250 £11,100 £8,975 £9,111 £10,933
Fee loan cap at Approved providers
£6,165 £6,165 £7,398 £6,072 £6,072 £7,286
Assumption 4
Approved providers will keep their fees constant in real terms, and above the fee loan cap faced by their students. Amongst those courses we have observed, the norm appears to be fees that significantly exceed the fee loan available to students under both the Do Nothing option and under Policy Option 125. Therefore, we assume that the market for places at these providers is currently in equilibrium. As these providers’ fees are unregulated, this policy option has no direct impact on supply in this part of the accelerated market.
The policy change has an ambiguous effect on demand. Consultation responses from APs discussed how the increased fee loan would improve affordability of their courses. Two providers responded that they expected to expand their provision, while other APs highlighted the limited pool of suitable candidates for their accelerated courses. Furthermore, increased supply of accelerated places by Approved (fee cap) providers, where a full fee loan is available, increases competition for students, and reduces demand in this part of the market. For our main analysis we assume these effects
24 We deflate 2018/19 caps to 2017 prices using the OBR’s forecast for the GDP deflator for 2018. GDP deflator estimates, including the OBR’s forecasts, are available at https://www.gov.uk/government/statistics/gdp-deflators-at-market-prices-and-money-gdp-march-2018-spring-statement 25 Out of the 12 designated APs offering accelerated degrees in 2016/17 that we have identified, eight currently set fees for their accelerated courses above the current cap. All of these eight also set fees above the Option 1 cap. Among the four identified setting fees at or below the current cap, only one is still running accelerated degrees. See Appendix A for an explanation of the methodology used to identify accelerated courses and the list of providers.

20
balance. We provide further analysis of alternative responses in Appendix D. We also assume that students at these providers take out the full tuition fee loan.
Assumption 5
There is student demand for accelerated degree courses that is currently not being met by providers, and which will still exist at a higher annual fee level. We assume demand for accelerated degree courses exceeds current provision and that providers are failing to meet this demand due to the financial restrictions created by fee caps.
Assumption 6
Students that would have enrolled on an accelerated degree course in the Do Nothing option would still do so despite the higher fee level. For most goods and services, an increase in price will reduce consumer demand. However, evidence generally shows that students are able to absorb rises in tuition fee levels, in large part because the student finance system ensures they can access sufficient funding to ensure that HE costs remain affordable. Students may also be willing to pay higher annual fees for accelerated courses because of the particular advantages they offer over standard courses (e.g. reduced overall costs, reduced maintenance loans and quicker entry into the labour market. Consultation responses were ambiguous about the cost sensitivity of students generally. Some existing providers of accelerated courses said the main motivation for these students was the opportunity to enter graduate work more quickly. Some respondents reporting that students are largely insensitive to debt levels, and maintenance support was a bigger factor in many students’ HE choices. Others responded that some students were more sensitive to debt and fees, for example mature students.
Assumption 7
Students that enrol on an accelerated degree course have reduced employment opportunities while they study, so they forego some earnings. Accelerated students may be able to take on part-time work on a continuous or casual basis alongside their degree courses, but we expect opportunities to be more limited than for students on standard degrees. In particular, accelerated students are unlikely to be able to take up higher-earning full-time opportunities over the summer. Students’ earnings opportunities are also considerably more limited that non-graduates who are not enrolled in HE. Details are provided in Appendix C.
Assumption 8
Future employment and earnings prospects of a degree are the same for a student on an accelerated course as they are for a standard course. That is, students on accelerated courses are assumed to have a similar distribution of characteristics known to influence graduate outcomes and will make subject and institutional choices representative of the student population as a whole. This means that we also assume

21
accelerated students have a similar loan repayment profile to the general student population. Further details of our earnings modelling are included in Appendix C.
Assumption 9
Maintenance costs are the same across different kinds of study and employment. This analysis includes individuals who would switch between standard and accelerated study, and between study and employment as a result of this Policy Option. According to the Student Income and Expenditure Survey (SIES) 2014/15 a full-time student’s average expenditure on maintenance per annum is £12,345 (2017 prices)26,27. Accelerated maintenance costs are likely to be higher than on a standard course. The need to study longer during the year is likely to increase annual maintenance costs e.g. because they have to rent student accommodation across the summer. The extent to which this leads to an additional cost is, however, difficult to estimate, due to a lack of data on accelerated students. There is also a lack of available data and evidence to make an informed comparative assessment of the maintenance cost of studying and the corresponding maintenance costs associated with working.
39. We also assume that costs and benefits are constant in real terms. All values are expressed in 2017 prices28.
Accelerated student numbers 40. Our analysis groups students according to their choices in the Do Nothing option.
Accelerated students belong to one of three groups:
1. Core students: students who would have studied an accelerated degree course anyway in the Do Nothing option. We split these students between Approved and Approved (fee cap) providers.
2. Switching students: students who would have studied a standard full-time course in the Do Nothing option, but take advantage of an increasing number of accelerated courses and the number of places available on these. These students benefit from the lower costs of an accelerated degree relative to a standard degree, and from entering the labour market as a graduate one year earlier.
26 These costs include housing, living, child-related, and facilitation costs, and participation costs excluding fees. Prices are adjusted using the GDP deflator, the measure of the price level for the whole economy. GDP deflator estimates, including the OBR’s forecasts, are available at https://www.gov.uk/government/statistics/gdp-deflators-at-market-prices-and-money-gdp-march-2018-spring-statement 27 Maher, Jo, Keeva Rooney, Marki Toomse-Smith, Zsolt Kiss, Emma Pollard, Matthew Williams, Jim Hillage, Martha Green, Clare Huxley and Wil Hunt, 2018, “Student Income and Expenditure Survey 2014/15: English Report”, https://www.gov.uk/government/publications/student-income-and-expenditure-survey-2014-to-2015 28 Where necessary, estimates are adjusted using the GDP deflator (https://www.gov.uk/government/statistics/gdp-deflators-at-market-prices-and-money-gdp-september-2017-quarterly-national-accounts-september-2017)

22
3. New students: students who would not have entered HE in the Do Nothing option, but now do so because accelerated provision is more attractive or feasible. These students incur the cost of studying, but will also now benefit from the higher wage premium associated with HE study. Under Options 1 and 2, these students would attend Approved (fee cap) providers. As for Switching students, we assume no increase in accelerated places at Approved providers as the market remains at the same equilibrium as under the Do Nothing option.
41. As noted above, we estimate 4,470 students were enrolled on accelerated degree courses in 2016/17, of which 20% were at HEFCE-funded providers and 80% at designated APs. Assuming each course is two years long, and abstracting from the potential for non-continuation (on which we have no data), this implies around 2,235 students starting an accelerated course each year.
42. Under Option 0, we expect no growth in Core students at Approved or Approved (fee cap providers), in line with overall student number forecasts29. As a result, we would expect the number of students starting an accelerated degree to stay at around 2,235 from 2019/20 to 2028/29. We estimate that 54% of Core accelerated students would attend Approved (fee cap) providers and the remaining 46% would attend Approved providers. These estimates are based on a survey of APs in which they reported their intended registration category under the new regulatory system30, and the assumption that all HEFCE-funded HEIs will register as Approved (fee cap) providers31. We test the impact of this assumption in our Sensitivity analysis in Appendix D.
43. Under Option 1, we assume that all additional students attend Approved (fee cap) providers, and that none of the Core/Do Nothing students at Approved providers switch to Approved (fee cap) courses. This is linked to Assumption 4, that Approved providers will not change their fees and hence not increase the number of places.
44. In effect we are assuming that Approved part of the market is in equilibrium – the increase in the loan cap changing the way in which students fund their study but not their behaviour. This is a simplifying assumption. In reality, we would expect greater fee loan amounts to make the provision at Approved providers more affordable to prospective students and for this to lead to an increase in demand for their courses. Against this, we might also see Approved providers coming under greater competition from the Approved (fee cap) part of
29 See Appendix B for more details 30 Details of the survey are included in Annex B of Department for Business Innovation & Skills, 2016, “Higher Education and Research Bill: detailed impact assessment”, https://www.gov.uk/government/uploads/system/uploads/attachment_data/file/528005/bis-16-295-he-research-bill-detailed-impact-assessment.pdf 31 Based on the survey results we estimate that 42% of APs will register as Approved (fee cap) and the remainder as Approved, and all HEFCE-funded providers will register as Approved (fee cap). We apply these proportions to the current population of Accelerated students at APs. We also assume that all HEFCE-funded providers will register as Approved (fee cap) and that these registrations are constant over the period of this IA.

23
the sector as they begin to offer more accelerated provision. It is difficult to know which of these effects will predominate.
45. Consultation responses from APs gave a mixed picture on whether they expect the policy change to lead to higher demand. Consultation responses from two Alternative Providers reported plans for growth, but did not state clear expectations on their registration category. As such they might register as Approved (fee cap), which would be consistent with our assumption that there is no growth at Approved providers. Allocating some additional students to Approved providers has little overall impact on the policy’s economic impact, or the impact on providers as a whole, except through reducing the overall tuition fee loan outlay, due to the lower fee loan cap for these providers. This is discussed in more detail in our Sensitivity analysis (Appendix D).
46. After consultation, there remains uncertainty around the extent to which Option 1 will lead to greater accelerated provision, as providers themselves are uncertain about demand.
47. For the purpose of this Impact Assessment we consider two scenarios: our main scenario, which is rooted in current market evidence on accelerated provision, but which is potentially less applicable where the higher cap succeeds in bringing about transformative change in student and provider behaviour; and a more transformative scenario that reflects the scale of the Government’s ambition to encourage more accelerated provision in the sector and provide students with greater, lower cost, choices. It is important to note that these are not forecasts. The main scenario provides the basis for the “best estimate” for this Impact Assessment, while the transformative scenario provides the basis for the “high estimate”. The growth profiles associated with these two scenarios are set out below and in Appendix B.
Main scenario
48. This scenario assumes the number of students enrolled on accelerated courses rising from 4,470 to around 23,540 in the space of ten years, an increase of almost 430%. In total, an additional 40,395 students would enrol on such courses during the ten years as a result of the reform. We assume that growth of this scale is feasible given the low base and evidence of interest from potential providers. We use this scenario in our “best estimate” for this Impact Assessment. Appendix B provides a more detailed description of the evidence underpinning our modelling.
49. This growth pattern seen in Table 4 includes zero growth at Approved providers and annual growth of 26% at Approved (fee cap) providers. This profile of growth reflects the evidence that there is interest in accelerated courses both from providers and potential students, but that there are organisational and marketing barriers to overcome, and time is required to

24
design new courses32. In our modelling we assume that growth builds year on year, so that the majority of additional students are enrolled towards the end of the impact assessment period. This reflects the time needed by providers to adjust to greater provision of accelerated courses and for students to become more aware of their availability and benefits. We have not attempted to estimate changes in the number of students at the provider-level, as this would go beyond the existing evidence base.
50. Within this overall increase we assume that 90% of additional students will be ‘switching’ from standard three year courses, while 10% would be “New” students who would not otherwise have gone on to study at degree level. This assumption is tested in the sensitivity analysis in Appendix D.
51. The numbers in Table 4 reflect entrants on accelerated courses each year. Table 5 sets out the impact of this increased entrant rate on the total number of students (i.e. total enrolments) studying on an accelerated course in a given year. We assume all students continue to the second year. For 2019/20 we only include entrants in the stock numbers, since second year students in this year will not be affected by this policy.
32 Pollard, Emma, Kari Hadjivassiliou, Sam Swift, and Martha Green, 2017, “Accelerated degrees in Higher Education: Literature review”, Department for Education, https://www.gov.uk/government/uploads/system/uploads/attachment_data/file/595637/Accelerated_Degrees_Literature_Review.pdf Huxley, Clare , Martha Green, Sam Swift and Emma Pollard, 2017, “Accelerated degrees in Higher Education: Case study report”, Department for Education, https://www.gov.uk/government/uploads/system/uploads/attachment_data/file/595638/Accelerated_Degrees_Case_Study_Report.pdf Department for Education, 2016, “Findings from the Call for Evidence on Accelerated Courses and Switching University or Degree”, Department for Education, https://www.gov.uk/government/consultations/accelerated-courses-and-switching-university-or-degree-call-for-evidence

25
Table 4: First-year accelerated student entrants for Option 1 by student group – best estimate
New Entrants for both Policy Options
Additional Entrants for Policy Option 1 Policy Option 1
Total Approved Approved
(fee cap) Switching Students New to HE
2019/20 1,035 1,200 280 30 2,545
2020/21 1,035 1,200 630 70 2,935
2021/22 1,035 1,200 1,070 120 3,425
2022/23 1,035 1,200 1,630 180 4,045
2023/24 1,035 1,200 2,330 260 4,820
2024/25 1,035 1,200 3,210 355 5,800
2025/26 1,035 1,200 4,320 480 7,035
2026/27 1,035 1,200 5,720 635 8,585
2027/28 1,035 1,200 7,475 830 10,540
2028/29 1,035 1,200 9,690 1,075 13,000 Notes:
1. Numbers may not sum to totals, due to rounding. Numbers are rounded to the nearest 5.
Table 5: Total stock of students on Accelerated Courses for Option 1 by student group - best estimate
Student stock for both Policy Options
Additional Students for Policy Option 1 Policy Option
1 Total Approved Approved
(fee cap) Switching Students New to HE
2019/20 1,035 1,200 280 30 2,545
2020/21 2,070 2,395 910 100 5,480
2021/22 2,070 2,395 1,700 190 6,360
2022/23 2,070 2,395 2,700 300 7,470
2023/24 2,070 2,395 3,960 440 8,865
2024/25 2,070 2,395 5,540 615 10,625
2025/26 2,070 2,395 7,530 835 12,835
2026/27 2,070 2,395 10,040 1,115 15,620
2027/28 2,070 2,395 13,195 1,465 19,125
2028/29 2,070 2,395 17,165 1,905 23,540 Notes:
1. For 2019/20 we include entrants only, as continuing students would not be affected by this policy option. For all subsequent years, this table includes both entrants and continuing students. We assume a continuation rate and graduation rate of 100%
2. Numbers may not sum to totals, due to rounding. Numbers are rounded to the nearest 5.

26
52. This main scenario is used to estimate the deregulatory and wider economic benefits within this Impact Assessment. However, the scale of the Government’s ambition in this area and the current lack of evidence around the future scale of demand and supply means that this might understate the extent to which accelerated provision increases. We consider below a more transformative scenario.
Transformative scenario
53. To communicate the Government’s broader vision to challenge and support the sector in delivering a more transformative shift towards accelerated provision, we also include a Transformative growth scenario. In this scenario, the number of accelerated entrants rises from the current level of 2,235 to 40,000 by 2028/29. The number of students enrolled increases from 4,470 currently, to around 68,500, and in total, an additional 116,460 students would enrol on such courses during the ten years as a result of the reform.
54. This scenario would go beyond the existing evidence base, which is rooted in accelerated courses’ current position as a niche product within the HE market. This transformation would necessitate a shift in cultural norms among providers, students and employers, and is therefore assumed to take place over a number of years. This scenario is used to produce a “High” estimate of the economic impact of this policy for this Impact Assessment. Further details on this growth scenario and the resulting impact estimates are included in Appendix B.
Costs and Benefits for HE Providers 55. HE providers are predominantly non-profit organisations with objectives to produce world
class teaching and research, and enable access and student choice. Expansion of high quality accelerated degree courses should directly contribute to the fulfilment of these objectives, for example by reaching underrepresented groups through innovative courses. We expect this, rather than the generation of profit or surplus, to be the main driver of the sector’s decision to increase accelerated provision.
56. The key economic benefit to providers of Option 1 will be the extra fee income they receive due to their ability to offer an accelerated course within a higher fee, net of the costs of running these courses. This equates to the deregulatory benefit to business of this reform. Providers can use the additional revenue to support their objectives.
57. Approved providers will not be subject to a fee cap, but will be designated such that their students can receive loan funding up to the amount of loan fee cap (£6,070 in 2017 prices). Under Policy Option 1 this annual loan cap would be 20% greater for an accelerated course (£7,284 in 2017 prices). However, given that many providers who might register in this category under the new regulatory landscape currently appear to charge significantly more than this new cap it is assumed that this would not feed into higher charges or changes in their student numbers (Assumption 4). This assumption is further supported by the consultation responses from current APs. There is therefore no revenue change to this type of provider.

27
58. Conversely, we expect that Approved (fee cap) providers will raise their fees with the increase in the fee cap (assumption 3), and hence will benefit from increased revenue. To calculate this economic benefit, we consider the student numbers set out in Table 5, and consider the revenue impacts associated with the three types of student in our analysis.
59. The direct benefit to providers arises from the higher fee income from Core students at Approved (fee cap) providers. Changes in net fee income from additional students, whether switching or new students, are indirect as they result from behavioural changes by providers and students.
60. Table 6 compares the fee and loan cap for Approved (fee cap) providers with an access agreement for a standard three-year degree, an accelerated degree under the current arrangements and an accelerated degree with a higher fee cap. It then calculates total revenue per student across a course.
Table 6: Fee and Fee Loan amounts for three different degree options for Approved (fee cap) providers with an access agreement (2017 prices)
Standard degree
Accelerated Degree – standard cap
Accelerated Degree – increased cap
Average fee per year £8,975 £9,111 £10,933
Course length 3 years 2 years 2 years
Revenue per student per course
£26,925 £18,222 £21,866
61. There is limited quantitative evidence on the costs of accelerated provision, both in absolute and relative terms. The most relevant estimates from the HEFCE pathfinder project pre-date major changes in the sector, such as the introduction of the £9,000 fee cap in 2012. This research suggests that the yearly cost of delivering a two-year accelerated degree course is higher than the equivalent three-year course, but that the overall cost across the whole course is lower33. Providers’ consultation responses reported that teaching is the greatest cost in provision, and that the costs of teaching for a whole degree will be constant across standard and accelerated courses, or potentially higher for accelerated courses. The potential for higher costs may be, due to the need to teach the same volume of content over a shorter time period than for standard degrees, necessitating additional recruitment of teaching staff and/or payment of overtime and ‘buy-out’ of vacation entitlements on existing
33 Foster, Will, Liz Hart & Tony Lewis, 2011, “Costing study of two-year accelerated honours degrees”, Higher Education Funding Council for England, http://www.hefce.ac.uk/media/hefce/content/pubs/indirreports/2011/RE,0311/rd03_11.pdf

28
teaching contracts. These responses conclude that there is little scope for savings over the whole accelerated course.
62. The cost of delivering higher education more broadly is the subject of ongoing research, and within the scope of this Impact Assessment we have been unable to produce direct estimates of accelerated degree costs. Instead we model costs relative to fee revenue using sector-wide surplus estimates and considering the wider evidence collected throughout the development of this policy.
63. HEFCE publish annual analysis of the publicly-funded sector’s Transparent Approach to Costing (TRAC) data, including data on income and costs for publicly-funded (including fee capped) teaching at HEIs in England and Northern Ireland. The latest data, for 2015/16, shows that the sector was close to break-even for this teaching, with a small surplus of 2.4% of income, or equivalently, costs corresponding to 97.6% of income. We apply this estimate to fees for standard courses to estimate the costs of providing such courses.
64. We have identified several publicly-funded providers that run accelerated courses with the current fee cap, covering subjects including law, business, management, sports science, computing, and architecture design. Currently HEFCE-funded providers with accelerated courses receive additional support through the Teaching Grant34. This support indicates that accelerated costs may exceed the current fee cap for Core students at Approved (fee cap) providers.
65. We expect no change to the costs for providing courses to Core/Do Nothing students because the policy focuses on the fee and fee loan cap, with other requirements on quality and student support covered by existing regulation, such as QAA standards and the OfS regulatory framework. Therefore the additional fee revenue to providers from these students is equivalent to the additional net fee revenue.
66. For additional students, we infer costs of provision are higher than the current fee cap, otherwise providers would already be more likely to offer these courses. Furthermore, based on consultation responses we expect that costs will be a high proportion of fee income for courses which are provided under the higher cap. Consultation responses from providers report that a 20% fee uplift would be insufficient to cover additional costs of accelerating some courses, so new accelerated courses may be focused on less resource-intensive subjects, and where providers can realise savings by moving to accelerated delivery. We doubt that providers will initially extend accelerated provision into subjects where additional costs would exceed the additional fee revenue, although this kind of expansion might result from providers cross-subsidising from other income streams, in order to fulfil wider non-financial objectives.
67. For our “best estimate”, therefore, we use the estimate based on TRAC data for the publicly-funded sector of 97.6%. That is we assume that 97.6% of extra fee revenue goes
34 This allocation from the Teaching grant is decided by HEFCE and is beyond the scope of this analysis. We assume that this allocation will not change under the policy.

29
on costs of providing additional accelerated provision, with the rest (2.4%) representing the deregulatory benefit to providers. We also consider a range of cost levels, from 95-100% of fee revenue, in our Sensitivity Analysis (see Appendix D). Our estimates for net revenue by student type are set out below in Table 7.
Table 7: Estimates of additional net fee revenue for Approved (fee cap) providers per student, 2017 prices
Core students Switching students New students
Option 0: Do nothing
Fee revenue per student per course 18,222 26,925 0
Provision cost per student per course - 26,291 0
Net revenue per student per course - 634 0
Option 1: Uplifted fee cap
Fee revenue per student per course 21,866 21,866 21,866
Provision cost per student per course No change 21,351 21,351
Net revenue per student per course - 515 515
Change in net revenue per course 3,644 -119 515
68. From this we can see the following changes in net revenue:
1. Core students: It is assumed that providers increase their fees so that they are at the new, higher fee cap (Assumption 3). This means that providers would now receive on average an additional £3,644 per course (or £1,822 more per year) for a student who would have attended an accelerated course otherwise. Since the system will ensure students are able to absorb a higher annual fee level, we expect the number of Core students taking up an accelerator degree (Assumption 6) to be relatively stable. If some students decide not to study an accelerated course because of the fee increase, then the additional HE revenue figures set out below will represent an overestimate.
2. Switching students: HE providers do not receive additional fee revenue on a whole course basis from ‘switchers’. Indeed, with a fee cap of 120% of the annual standard fee cap levied for two years of the course, they will receive less per student than under the Do Nothing option (£21,866 compared to £26,925). However, this impact is mitigated by a concomitant fall in course costs. We do not have a robust data on the annual cost of accelerated degree provision, and consequently how much cost will be saved by a student moving from a three year to two-year course. We therefore assume, based on the aggregate surplus data described in paragraph 67, that it is equivalent to 97.6% of the course’s new revenue profile. This implies a net revenue fall per course per switcher of only around £120 per student per course (2.4% of £26,925 - £21,866).
3. New students: it is expected that the greater availability of accelerated degrees, combined with the lower overall cost of study relative to a standard three-year degree,

30
will lead some people choosing to participate in Higher Education that otherwise would not have done. The fees paid will also be entirely additional and will amount to £10,928 per student per year on courses at Approved fee cap providers with access agreements. We estimate that these will be offset by costs so that providers’ net revenue will be £515 (2.4%) per student per course.
69. Table 8 combines these effects with our student number assumptions in Table 5 to show the overall impact on provider revenues. On the basis of our assumptions, providers receive less revenue from Switching students, which is outweighed by the addition to revenue from New students entering higher education. Therefore the additional expansion of accelerated provision leads to higher net revenue for these providers. These net revenue streams translate to an NPV for providers of £36.0m.
Table 8: Estimated additional net revenue to Approved (fee cap) providers with an access agreement, by student group (£m, 2017 prices) – best estimate
Academic Year Core students Switching
students New students Total
2019/20 2.2 0.0 0.0 2.2
2020/21 4.4 0.0 0.0 4.4
2021/22 4.4 0.0 0.0 4.4
2022/23 4.4 -0.0 0.1 4.4
2023/24 4.4 -0.0 0.1 4.4
2024/25 4.4 -0.1 0.2 4.4
2025/26 4.4 -0.1 0.2 4.4
2026/27 4.4 -0.2 0.3 4.4
2027/28 4.4 -0.3 0.4 4.4
2028/29 4.4 -0.4 0.5 4.4
Total 41.5 -1.2 1.8 42.1
70. Familiarisation costs for the sector will be negligible as this Policy Option incurs no additional costs beyond existing familiarisation costs for annual changes in student support and fee caps. Currently providers must review changes to fee caps and student financial support regularly. While this policy will affect the changes, it will have a negligible effect on providers’ review requirements.

31
Costs and Benefits for Students 71. There are three key drivers of the costs and benefits to students:
(i) The cost of studying either on accelerated course or when they otherwise wouldn’t have, compared to the Do Nothing option. This is made up of changes in tuition fee cost, as well as changes in living costs whilst studying. The vast majority of students will fund tuition fee costs and some of their maintenance cost through student loans. This means that in the short-term these costs will be funded by the taxpayer, with the long-term cost depending on future earnings and hence the amount of loan repayments made by the student over the 30-year loan period.
(ii) The amount of earnings foregone whist studying.
(iii) The benefit from acquiring a higher education qualification, in particular the graduate premium they can expect to receive in the labour market and the number of years they for which they receive that premium.
72. Since the costs and benefits of Option 1 are different for the three groups of students, (Core, Switching and New students), each group is discussed separately in the analysis below.
Core Students
73. Core students attending Approved (fee cap) providers do not receive any additional benefits under the reform, beyond a greater choice of accelerated courses when applying to study HE. They are already studying a two-year degree and so do not benefit from one less year of fees and maintenance costs while studying, or from an additional year of earnings. This is also largely true for those attending Approved providers, although they will benefit from being able to draw down a higher tuition fee loan, which may help with the affordability of their course.
74. Under the fee levels set out in Assumption 3, on average a Core student at these providers pays an additional £1,822 per academic year. This additional cost to the student is an economic transfer to the provider. The total additional cost to Core students is thus equal to the revenue gain to Approved (fee cap) providers of being able to charge such students more. This is equal to £4.4m per year from 2020/21 onwards, and £41.5m over the ten year appraisal period as set out in Table 8.
75. Outside of the period of this Impact Assessment, the higher fees associated with accelerated degree course would mean that Core students at Approved (fee cap) providers experience increased loan repayment costs. The upfront costs to pay this additional tuition

32
will be typically met by the Government through loans35. However, the student will then have to pay back the loan, plus interest, over the 30-year period following graduation. The income contingent nature of student loan repayments means that cost of paying any additional fee amounts will be shared between the student and taxpayers. On average, we estimate that around 40% of the value of loans issued to accelerated students will not be repaid36. This is less than the average value not repaid for a standard course, due to the lower loan balance. This results in a higher proportion of students repaying in full, and for those not repaying in full, a smaller share of the loan balance remains unpaid37. Without taking into consideration interest, this implies that the long term repayment cost of the accelerated fee cap rise to a Core student who takes out a student loan, is around £1,090 per academic year (2017 prices)38.
76. Students may, however, receive some benefits which we cannot monetise. It would be expected that if providers do increase fees for this group, that, given their mostly non-profit making status, this additional revenue will be invested in expanding course provision or improving the quality of teaching and learning experience for existing and future students.
Switching Students
77. Removing the financial barriers surrounding increased provision of accelerated degrees should incentivise providers to offer a greater number and diversity of courses to offer students. This should encourage and enable some students to enrol on an accelerated degree course who would have studied a standard degree in the Do Nothing option.
78. The choice of which degree type to study is voluntary. We assume that a Switching student chooses to study an accelerated degree because it is the best option for them. This means there is an expected net benefit for these students. We can demonstrate this for an average student under the assumptions stated, and using estimates for certain costs and benefits.
79. In our estimates in Table 6, the total tuition cost an average Switching student pays at an Approved (fee cap) provider is £5,059 less than a standard degree course. If providers set
35 It is estimated that 92% of undergraduates take out loans. We expect that the figure for undergraduate accelerated degree students is broadly similar. To keep our analysis proportionate we assume a 100% loan take-up rate for accelerated degrees. 36 DfE analysis using DfE’s repayment model for a population of students on a two-year degree course, assuming they have the same characteristics and outcomes as the population on three-year degree courses entering HE in 2017. We assume the same characteristics in the absence of evidence on the composition of the accelerated student population. The estimate is rounded to the nearest 5%. 37 The current estimate for the Resource Account and Budgeting (RAB) charge is 40-45%: HC Deb 17 October 2017 c108255W (http://www.parliament.uk/business/publications/written-questions-answers-statements/written-question/Commons/2017-10-17/108255) 38 60% of £1,822 = £1,093.20~ £1,090

33
fees at a level lower than we assume in this analysis, students will benefit more from lower overall tuition fees when switching to an accelerated degree course fee costs.
80. We assume that accelerated students earn less income from work while studying, due to the structure of their course. Results from the 2014/15 Student and Income Expenditure Survey (publication forthcoming) show that full-time students on average earned £2,661, including summer vacation earnings (in 2017 prices).
81. We have limited evidence on accelerated students’ employment, beyond reports that some accelerated students do work alongside their studies. Assuming that accelerated students’ employment pattern during the teaching year follows the same pattern as overall full-time students, we adjust the teaching year earnings estimate from SIES 2014/15 to cover the full calendar year. Under those assumptions we estimate that accelerated students would have earned £2,394 (in 2017 prices)39.
82. To estimate student earnings throughout the period of this Impact Assessment we adjust these estimates for forecasts of real average earnings growth. Full details are included in Appendix C.
83. A key benefit to students switching from a standard to an accelerated degree course is that the period of time until they graduate and enter the workplace is comparatively shorter. Thus, these students gain one more year of graduate earnings compared to a standard degree. Details on the modelling of student and graduate earnings are included in Appendix C, and the expected earnings profile for the first cohort of the policy is illustrated in Figure 2 below. Estimates are obtained from the Labour Force Survey 2017, and are adjusted for real average earnings growth and employment rates.
39 Maher, Jo, Keeva Rooney, Marki Toomse-Smith, Zsolt Kiss, Emma Pollard, Matthew Williams, Jim Hillage, Martha Green, Clare Huxley and Wil Hunt, 2018, “Student Income and Expenditure Survey 2014/15: English Report”, https://www.gov.uk/government/publications/student-income-and-expenditure-survey-2014-to-2015

34
Figure 2: Switching students’ earnings estimates by year for 2019/20 cohort of policy adjusted for unemployment and inactivity, 2017 prices
Sources: ONS, OBR, DfE calculations
84. On average, switching students will earn an extra £5,965 during the period of this impact assessment. This includes switching students from 2027/28 and 2028/29 cohorts who will not enter the labour market during this time. Graduates over this period (i.e. excluding the last two cohorts) will earn, on average, an additional £11,697, driven by higher earnings in the first year after graduation.
85. We estimate tax and loan repayments using median earnings for those in employment, and then adjust for inactivity and unemployment rates. Since median earnings for the newly graduated accelerated students are lower than the loan repayment threshold, we estimate negligible increases in student loan repayments during the period of assessment. For Switching graduates, we estimate an increase in average tax payments of £1,592. Thus, overall, Switching graduates’ take-home pay over the impact assessment period increases by £10,105.
86. A student who switches to a two-year course will also experience changes in their maintenance costs. The need to study longer during the year is likely to increase annual maintenance costs e.g. because they have to rent student accommodation across the summer. The extent to which this leads to an additional cost is, however, difficult to estimate as it will depend on what the student would otherwise have been doing. There is also a lack of available data and evidence on how the expected cost of living during what would have previously been a third year of study compares to what would now be an additional year in the labour market. To simplify our analysis we assume that these costs are equal (Assumption 9).
87. Overall, the net benefit of Option 1 to the average Switching graduate is £15,164, excluding changes to government financial support payments to students during their studies in the

35
form of tuition and maintenance loans. This results from the reduction tuition fee of £5,059 and on average higher take-home earnings of £10,10540 due to an extra year in the labour market. Their student loan is also £8,599 lower under Option 141.
New students
88. New students are those who would not otherwise enrol in Higher Education. Therefore, these students face costs in the form of tuition fees and foregone earnings while studying, and after graduation benefit from the graduate premium associated with HE42. A higher education degree also brings wider benefits to an individual, for example improved health and life satisfaction43. However, since these benefits cannot be easily monetised they are not considered further in this Impact Assessment.
89. The largest cost to this group is their tuition fees. The average New HE student at an Approved (fee cap) provider would pay £21,866 in fees over the two years of their courses, compared to no fees under the Do Nothing option. It is assumed that these are made affordable by a tuition fee loan.
90. Enrolling on an accelerated degree course means these students forego earnings during their two years of study, as accelerated students have more limited employment than non-graduates. This is the second largest cost faced by this group. We estimate that on average graduates from this group (i.e. students in cohorts 2019/20 to 2026/27) forego £20,183 during their studies. More details on this estimate are included in Appendix C.
91. Furthermore, these students may experience a change in their maintenance costs. As for Switching students we do not monetise this change given a lack of data on comparative living costs for those studying and working (Assumption 9). Government maintenance loans and Long Course Loans provide maintenance support for New students, on a means tested basis, with the average loan estimated at £7,344 per student per year.
92. The main benefit to New students is that they obtain a degree which can be used to improve career prospects and increase future earnings. As graduates, we estimate that this
40 Switching graduates (i.e. cohorts which enter HE between 2019/20 and 2026/27) forego an average of £589 of earnings during their studies, relative to a standard student. They earn, on average, an extra £12,289 in their first year as graduates, of which £1,592is additional tax, leaving them £10,105 better off (i.e. £12,289 - £1,592 - £589 = £10,105). 41 Across all cohorts, on average Switching students pay £1,343 less in tuition fees, take home an extra £5,124 in earnings (from £6,485 higher gross earnings as graduates, less £840 in higher tax and £520 in foregone earnings during their studies), and taken on £2,346 less in student loans. 42 Walker, Ian & Yu Zhu, 2013, The impact of university degrees on the lifecycle of earnings: some further analysis”, BIS research papers, https://www.gov.uk/government/publications/university-degrees-impact-on-lifecycle-of-earnings 43 Department for Business Innovation & Skills, 2013, “The Benefits of Higher Education Participation for Individuals and Society: key findings and reports “The Quadrants””, BIS Research Paper No. 146, https://www.gov.uk/government/uploads/system/uploads/attachment_data/file/254101/bis-13-1268-benefits-of-higher-education-participation-the-quadrants.pdf

36
group would earn an additional £12,798 on average during this assessment period. This varies from £55,886 (£6,986 per year) over eight years for the first cohort to £2,324 in 2028/29 for the 2026/27-entry cohort. Earnings by year for the first cohort, including foregone earnings while studying, are presented in Figure 3.
Figure 3: New students’ earnings estimates by year for 2019/20 cohort of policy adjusted for unemployment and inactivity, 2017 prices
Sources: ONS, OBR, DfE calculations
93. Alongside their higher earnings, students make student loan repayments once their earnings pass the repayment threshold (£25,000 in 2018, subsequently rising with average earnings), which, on average within our modelling, occurs six years after graduation. Across the whole Impact Assessment period and all students in this group, these average £15 per student. Higher earnings also result in higher tax payments but these are offset by the reduced tax due to foregone earnings, so overall students in this group pay £787 less in tax during the assessment period, which is linked to their foregone earnings during their studies. This varies across cohorts, with the first cohort paying around an extra £12,000 in tax across this assessment period.
94. The relatively high foregone earnings of this group mean that the net present value of take-home earnings over this Impact Assessment period for Option 1 is only positive for the first four cohorts, when they have had sufficient time to benefit from higher earnings. Over all cohorts in the 10-year period of this Impact Assessment, the Net Present Value per student is negative for this group. However, over the working life, the average graduate will earn comfortably over £100,000 more in today’s valuation, net of tax, than a similar individual who completed their education with two or more A levels44, so the NPV in this Impact
44 Walker, Ian & Yu Zhu, 2013, The impact of university degrees on the lifecycle of earnings: some further analysis”, BIS research papers, https://www.gov.uk/government/publications/university-degrees-impact-on-lifecycle-of-earnings

37
Assessment only captures a small fraction of this lifetime benefit, while capturing the full costs of foregone earnings.
Costs and Benefits for Government and Taxpayers 95. The initial cost associated with increasing the accelerated fee cap to the taxpayer is the
additional loan outlay to support changes in tuition fees and maintenance. As with the main undergraduate student loan system, this will be subject to income contingent repayments with outstanding loan balances written off after 30 years. From April 2018 loan repayments are 9% of gross earnings above £25,000 per year (2018 prices), and the repayment threshold will rise annually with average earnings. This provides reassurance to students around affordability, but also retains the principle that students who benefit most from higher education should pay the most for their study.
96. From 2018, the taxpayer meets an estimated 40-45% of the long-term cost of a student attaining a full-time undergraduate degree45. We estimate that for those taking two-year accelerated degrees, 40% of the long-term cost will be met by the taxpayer and that this is lower than for a standard 3-year degree46. On average, the additional amount of money the taxpayer needs to lend to the three different categories of student considered in this impact assessment will be different, with the highest additional outlay required for a new HE student, a smaller increase for a Core Student, and a reduction in average loan outlay for a Switching student (because of their reduced tuition and taxpayer funded maintenance costs).
45 HC Deb 17 October 2017 c108255W (http://www.parliament.uk/business/publications/written-questions-answers-statements/written-question/Commons/2017-10-17/108255) 46 DfE analysis using DfE’s repayment model for a population of students on a two-year degree course, assuming they have the same characteristics and outcomes as the population on three-year degree courses entering HE in 2017. We assume the same characteristics in the absence of evidence on the composition of the accelerated student population. The estimate is rounded to the nearest 5%.

38
Table 9: Loan amounts per student for different degree options (2017 prices)
Approved (fee cap) Providers Approved Providers
Standard degree
Accelerated degree
– standard cap
Accelerated degree
– increased cap
Standard degree
Accelerated degree
– standard cap
Accelerated degree
– increased cap
Course length (years)
3 2 2 3 2 2
Fee loan per year
£8,975 £9,111 £10,933 £6,072 £6,072 £7,286
Maintenance loan per year47
£6,094 £6,094 £6,094 £6,094 £6,094 £6,094
Long Course loan per year48
£0 £1,277 £1,277 £0 £1,277 £1,277
Loan amount per course
£45,206 £32,962 £36,607 £36,497 £26,885 £29,313
97. Table 10 estimates the total additional loan outlay for the three different groups of accelerated students. Our calculations depend on the loan take-up rate; to keep our analysis proportionate we assume a 100% loan take-up rate. In the absence of specific estimates for the accelerated population, our estimates also assume that this population has the same household income distribution and same characteristics as the current full-time undergraduate population. These assumptions determine the estimate of the average level of maintenance and long course loan to which accelerated students are entitled.
47 Student Loans Company, 2016, “Student Support For Higher Education In England 2016:2015/16 Payments, 2016/17 Awards”, https://www.slc.co.uk/media/8445/slcsfr052016.xlsx 48 This is based on Long Course Loan award entitlement, adjusted for the composition of the overall student population.
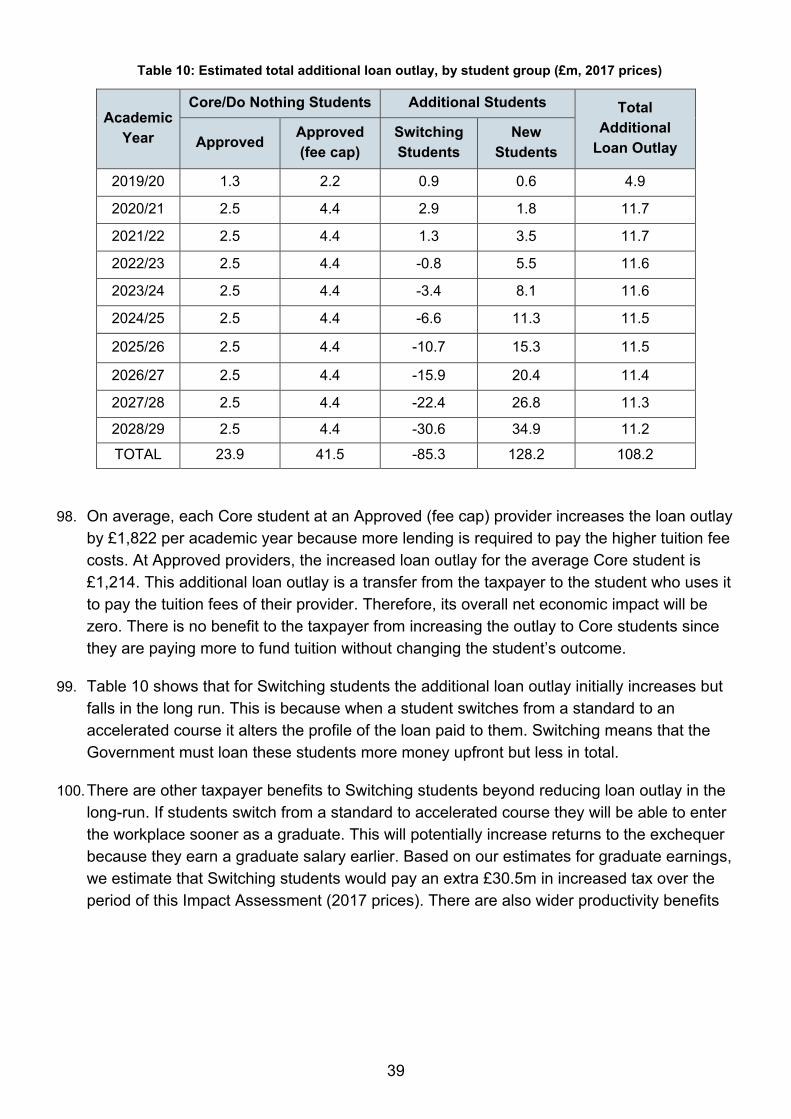
39
Table 10: Estimated total additional loan outlay, by student group (£m, 2017 prices)
Academic Year
Core/Do Nothing Students Additional Students Total Additional
Loan Outlay Approved Approved (fee cap)
Switching Students
New Students
2019/20 1.3 2.2 0.9 0.6 4.9
2020/21 2.5 4.4 2.9 1.8 11.7
2021/22 2.5 4.4 1.3 3.5 11.7
2022/23 2.5 4.4 -0.8 5.5 11.6
2023/24 2.5 4.4 -3.4 8.1 11.6
2024/25 2.5 4.4 -6.6 11.3 11.5
2025/26 2.5 4.4 -10.7 15.3 11.5
2026/27 2.5 4.4 -15.9 20.4 11.4
2027/28 2.5 4.4 -22.4 26.8 11.3
2028/29 2.5 4.4 -30.6 34.9 11.2
TOTAL 23.9 41.5 -85.3 128.2 108.2
98. On average, each Core student at an Approved (fee cap) provider increases the loan outlay by £1,822 per academic year because more lending is required to pay the higher tuition fee costs. At Approved providers, the increased loan outlay for the average Core student is £1,214. This additional loan outlay is a transfer from the taxpayer to the student who uses it to pay the tuition fees of their provider. Therefore, its overall net economic impact will be zero. There is no benefit to the taxpayer from increasing the outlay to Core students since they are paying more to fund tuition without changing the student’s outcome.
99. Table 10 shows that for Switching students the additional loan outlay initially increases but falls in the long run. This is because when a student switches from a standard to an accelerated course it alters the profile of the loan paid to them. Switching means that the Government must loan these students more money upfront but less in total.
100. There are other taxpayer benefits to Switching students beyond reducing loan outlay in the long-run. If students switch from a standard to accelerated course they will be able to enter the workplace sooner as a graduate. This will potentially increase returns to the exchequer because they earn a graduate salary earlier. Based on our estimates for graduate earnings, we estimate that Switching students would pay an extra £30.5m in increased tax over the period of this Impact Assessment (2017 prices). There are also wider productivity benefits

40
to the economy through increased innovation, labour market flexibility, and productivity spillovers to co-workers, though these are not monetised49.
101. Increasing the cap should give providers a greater financial incentive to create new accelerated courses which leads to wider participation in HE by groups who are under-represented, such as mature students. The loan outlay for a New student is £18,303 per academic year (or £36,607 per degree, as shown in Table 9). These figures are higher than the other two student groups because New students are new loan recipients who would not have entered HE otherwise. This additional loan outlay is an equal transfer between the Government and the individual so the overall net economic impact will be zero.
102. While each New student increases the initial loan outlay by a larger amount than the other groups of students, the taxpayer ultimately benefits from these students entering HE. The net working life benefits to the taxpayer as a result of individuals gaining a first bachelor degree compared to 2+ A levels are, on average, over £250,000 for men, and over £300,000 for women – these account for tax payments, student loan repayments, grants, etc.50 However, for the 10 year period of this Impact Assessment, while we have estimated this group will make £0.1m in loan repayments, we have also estimated that they will pay £3.2m less in tax, linked to their foregone earnings while studying. There are also wider social and productivity benefits of having a more educated population51.
103. The upfront costs of increasing the accelerated fee cap are met by the Government through additional loan outlay. However, the student will then have to pay back the loan, plus interest (initially set at RPI + 3%), over the 30-year period following graduation. Any outstanding balance on the loan is written off after this time. Due to the income contingent nature of student loan repayments it means that the cost of a degree is shared between the student population and taxpayers. On average we estimate that 40% of the value of loans issued to accelerated students will not be repaid52. This implies that the average long term
49 Department for Business Innovation & Skills, 2013, “The Benefits of Higher Education Participation for Individuals and Society: key findings and reports “The Quadrants””, BIS Research Paper No. 146, https://www.gov.uk/government/uploads/system/uploads/attachment_data/file/254101/bis-13-1268-benefits-of-higher-education-participation-the-quadrants.pdf 50 Walker, Ian & Yu Zhu, 2013, The impact of university degrees on the lifecycle of earnings: some further analysis”, BIS research papers, https://www.gov.uk/government/publications/university-degrees-impact-on-lifecycle-of-earnings 51 Department for Business Innovation & Skills, 2013, “The Benefits of Higher Education Participation for Individuals and Society: key findings and reports “The Quadrants””, BIS Research Paper No. 146, https://www.gov.uk/government/uploads/system/uploads/attachment_data/file/254101/bis-13-1268-benefits-of-higher-education-participation-the-quadrants.pdf 52 DfE analysis using DfE’s repayment model for a population of students on a two-year degree course, assuming they have the same characteristics and outcomes as the population on three-year degree courses entering HE in 2017. We assume the same characteristics in the absence of evidence on the composition of the accelerated student population. The estimate is rounded to the nearest 5%.

41
cost to the taxpayer for the loan outlay in the first academic year of the policy would be £2.0m53.
104. The taxpayer would also experience costs for the set-up or changes to the Student Loans Company (SLC) systems for processing applications and payments to students. According to SLC internal estimates, these costs are £2.3m in the first year of the policy.
Net Economic Impact 105. Raising the fee and fee loan cap for accelerated degrees is a deregulatory measure.
Businesses, in this case HE providers, benefit from the ability to increase fees and raise additional revenue. This revenue is a transfer from students, funded up-front by Government fee loans. This transfer does not in itself provide a net economic cost or benefit. Similarly, the changes in cost of course delivery for providers has no economic impact as these costs represent payments to staff and for goods and services required to run the courses.
106. The economic benefit comes from providers increasing the number of places on accelerated courses, and therefore increasing the number of graduates, and hence the productivity in the economy. Monetised costs, other than transfers, arise in the form of SLC systems costs (a transition cost for Government) of £2.3m in the first year of the policy. They also arise through foregone earnings of Switching and New students. Switching students have reduced earnings opportunities on accelerated courses relative to Standard courses, and New students forego non-graduate full-time earnings while they study.
107. Present values of the monetised costs and benefits are presented below in Table 11. They are presented by student type, to demonstrate the differences in the policy impact. In this table transfers are presented first, to show how fees, loans, loan repayments and tax move between the three main affected groups, and result in zero net economic impact. The remaining costs and benefits are presented below, to demonstrate that the overall economic value of this policy is driven by increased graduate earnings.
5340% of £4.9m =£2.0m

42
Table 11: Present value of additional costs and benefits for Option 1 by student type (£m, 2017 prices)
Core students Additional students
Total Approved providers
Approved (fee cap) providers
Switching New
Transfers Providers Fee income 0.0 35.5 -37.1 60.6 58.9 Students Fees 0.0 -35.5 37.1 -60.6 -58.9 Fee loan 20.4 35.5 -37.1 60.6 79.3 Maintenance loan 0.0 0.0 -91.6 33.8 -57.8 Long Course Loan 0.0 0.0 63.7 7.1 70.8 Loan repayments 0.0 0.0 0.0 -0.0 -0.0 Tax 0.0 0.0 -23.6 2.7 -20.9 Government / Taxpayer Fee loan -20.4 -35.5 37.1 -60.6 -79.3 Maintenance loan 0.0 0.0 91.6 -33.8 57.8 Long Course Loan 0.0 0.0 -63.7 -7.1 -70.8 Loan repayments 0.0 0.0 -0.0 0.0 0.0 Tax 0.0 0.0 23.6 -2.7 20.9 Non-transfers Students Foregone earnings 0.0 0.0 -16.3 -56.9 -73.2 Graduate earnings 0.0 0.0 184.3 20.7 205.0 Government SLC set-up costs -2.3 Total Costs -20.4 -70.9 -269.5 -280.8 -386.2 Total Benefits 20.4 70.9 473.8 185.4 492.8 Net Present Value 0.0 0.0 204.3 -95.4 106.6

43
Risks and uncertainty 108. The calculated net present value (NPV) of our preferred option is dependent on a number
of modelling assumptions made explicit throughout. We have used this section to run through, in order of magnitude, the risks and uncertainties relating to our ‘best estimate’. We have used the consultation process to explore what further evidence is available to improve our estimates, but considerable uncertainty remains.
109. There is a high degree of uncertainty around our additionality assumptions, reflected by the large range between our different growth scenarios. Accurately forecasting these figures with limited data is difficult. As such, the underlying assumptions for additional students have been made as a ‘best estimate’ given a lack of data and policy timescales. At the extreme, if a higher accelerated degree fee cap does not translate into additional students, then the associated policy benefits of the policy could be zero. However, the balance of feedback from the sector on the existing constraints to expanding accelerated courses makes this scenario highly unlikely.
110. Consultation provided further qualitative evidence on the costs of accelerated provision, but quantitative evidence remains scarce. Higher costs would leave to a lower NPV for business (i.e. HE providers) and overall. As such, there is a high degree of uncertainty on the costs of provision, these are explored further through sensitivity analysis in Appendix D.
111. Further, any change in the graduate premium, or foregone earnings while studying, will affect the overall NPV calculation. If the graduate premium rises and/or foregone earnings fall, then the NPV will increase. If the opposite is true, the calculated NPV will fall. These values will likely change in future following the economic cycle, and so it is very difficult to estimate these changes ahead of time.
112. There is also limited evidence on how maintenance costs differ between standard full-time students, accelerated students and employed graduates and non-graduates. While an accelerated degree will last one academic year less than a traditional three-year degree, accelerated students will be at university over the summer semester, and will likely have additional yearly maintenance costs to traditional full-time students. Given the lack of data surrounding the maintenance costs different groups face, there is a risk that the potential savings for some accelerated students will be lower than presented in this IA, bringing down the NPV.
113. It is possible that Approved providers will have a range of behavioural responses to the increased accelerated degree fee cap. These actions are very difficult to predict before providers have had time to familiarise themselves with the policy, and gauge local demand for accelerated degrees. As such, there is significant uncertainty around what providers decide to do, with things such as the number and size of accelerated degree courses to offer, and the number of providers that ultimately offer accelerated degrees, greatly affecting the final benefits of the policy overall. This is the area for which there is the most uncertainty and is explored further in Appendix D below.

44
114. An area of high uncertainty but limited NPV impact is that of our underlying student population estimates. If the projected Core student population is higher than estimated (i.e. rises rather than remains flat as currently projected), then this will increase the deregulatory benefit for providers. A reduced population would have the opposite effect, i.e. reduced outlays and fees for providers. However, neither scenario would impact the overall NPV.
115. A final area of uncertainty is the pricing decisions of Approved (fee cap) providers, in particular the possibility that they set their accelerated degree fee below the level assumed in this analysis. This will not affect the NPV of our analysis – as this is simply a reduced transfer – however, it will reduce the deregulatory value of the policy for these providers and lead to lower levels of government loan outlays.
116. Similarly, our estimate of the Equivalent Annual Direct Net Cost to Business (EANDCB) is sensitive to our assumptions about the number of Core students and the size of the fee increase54.
117. We have assumed that Approved (fee cap) providers set their fees at the maximum cap (Assumption 3). If instead providers set fees lower than this level, the magnitude of the EANDCB would be proportionally lower, but still a net benefit. Similarly, if we were to assume that some Core students were deterred by the fee increase, contrary to our expectation of their likely behaviour (Assumption 6), the benefit would be lower and proportional to the share of Core students who continue to enrol.
118. A further area of uncertainty is the pricing decisions of Approved providers. Our ‘best estimate’ assumes that they hold their fees constant (as they are not currently constrained by a fee cap) (Assumption 4). These providers might respond by increasing their fees, and hence their net revenue, because the policy increases affordability of Approved providers’ accelerated courses, by making larger fee loans available to students. If the fee increase were equivalent to the fee loan increase for their students, then the NPV of the policy for these providers would be £20.4m. Since the benefits are “passed through” students who have access to the increased tuition fee loans, the additional fee income to these providers would be an indirect benefit, and would therefore not change the EANDCB of the policy. There would also be no change to the overall NPV of the policy as the increased fee revenue would be an economic transfer from students to providers.
119. However, from the consultation responses from Alternative Providers, we view this behaviour as highly unlikely. These responses reported that the main role of the increased loan would be to make the courses more affordable for students who currently face upfront costs where fees exceed the current loan cap. This includes the vast majority of accelerated students at APs. Other potential responses from these providers are explored in Appendix D.
54 Additional fee revenue due to additional students is an indirect benefit for Providers as it results from behavioural changes by students.

45
120. The final area of uncertainty is the current number of Core students at Approved (fee cap) providers. If we have underestimated this, then the deregulatory benefit to HE providers will be proportionally higher. This could either be due to incorrectly estimating the current accelerated student population, or incorrectly estimating the share of current APs who register as Approved (fee cap) providers under the new regulatory framework. We have tested the sensitivity of our analysis to alternative assumptions on the registration categories of current APs, which we think cover the most likely range of registration outcomes.
121. Our lower bound estimate is taken from the consultation response from Independent HE, which reports that in their survey only three of eleven (27%) accelerated providers said they intend to register as Approved (fee cap). Our upper bound estimate is 70%, which is our estimate of the share of accelerated students at current Approved Providers with fees under the uplifted cap. This is an extreme and unlikely scenario in which all APs register as Approved (fee cap) unless it requires them to reduce their accelerated fees to meet the new cap. From this range we find alternative estimates for the EANDCB of benefits of between £2.7m and £4.8m. Further details are provided in Appendix D.

46
Small and Micro Business Assessment 122. In the Higher Education sector, provider size is normally based on its student population, as
it is considered more relevant for most policy questions than the total number of employees. It is possible for institutions with the same number of employees to have significantly different student populations, and therefore they may greatly vary in size. However, this small and micro business assessment will analyse provider size by the number of employees.
123. HESA data for 2015/16 show that HEIs have on average 2,516 employees, with 95 employees being the smallest number at a single HEI. Analysis of the Further Education workforce data for England Report55 shows that the average FTE staff per college is 383 for England. Therefore, we do not believe any HEI or FEC is a small business for this assessment.
124. We know, however, that the average size of Alternative Providers is smaller - with 95% out of a sample of 160 APs having 50 employees or fewer in 201356. This includes all types of providers, whether or not they offer courses eligible for student support or not. The most recent data also suggests that APs make up 12% of all providers in the HE sector57. We do not know whether there are differences in the employee size of APs by whether or not they currently or might under reform offer an accelerated course.
125. The small and micro business assessment therefore only applies to APs.
126. Overall, we expect this reform to be positive for smaller providers, and possibly disproportionately so. As this is a voluntary and deregulatory measure, we would expect any benefits to exceed the costs for providers offering accelerated degrees, or at worst neutral overall. It may, however, be that at the current time small and micro providers find it more difficult to offer accelerated degrees, due to the need for more flexible staffing, contracts and resources, which would likely be difficult to achieve on a small scale. A rise in the fee cap – where that Alternative Provider would prefer to operate under the Approved (fee cap) category – may therefore be disproportionately beneficial. However, this will depend on the extent to which they also face other constraints to offering accelerated degrees.
55Frontier, 2014, http://www.et-foundation.co.uk/wp-content/uploads/2014/09/SIR-Report.pdf 56 Hughes, Tristram, Aaron Porter, Stephen Jones & Jonathan Sheen, 2013, “Privately funded providers of
higher education in the UK”, BIS Research Paper No. 111, https://www.gov.uk/government/uploads/system/uploads/attachment_data/file/207128/bis-13-900-privately-funded-providers-of-higher-education-in-the-UK.pdf 57 Shury, Jan, Lorna Adams, Matt Barnes, Jessica Huntley Hewitt and Tariq Oozeerally, 2016, "Understanding the market of alternative providers of higher education and their students in 2014”, BIS Research Paper No.227, https://www.gov.uk/government/publications/alternative-providers-of-higher-education-the-market-and-students-in-2014

47
Appendix A: Population Estimates 127. This section estimates the number of students registered on accelerated degree courses at
English HE providers in 2016/17. This figure forms the basis of our population estimates when analysing policy options.
128. We have updated the methodology for this estimate, since the assessment developed to support the reform’s consultation stage, to make use of more complete course-level data, and as such the estimate cannot be compared directly with the estimate from the consultation stage Impact Assessment.
129. Estimating the number of accelerated students is not straightforward. Although there is a broad understanding of what an accelerated degree course is, there is currently no set definition in terms of their structure, composition or parameters. This means there is no single data variable held in the HESA student record which identifies students on accelerated degree courses.
130. Instead we use SLC data for courses running in 2016/17 with expected duration of two years to identify accelerated degree courses, and match these to HESA student records for the same year to estimate student numbers. Some providers run accelerated courses of different lengths. However, these are currently out of scope for the policy, and hence excluded from our estimate.
131. In the SLC data, accelerated degree courses are identified using the course title, mode and qualification. Many course titles include “accelerated” or “fast-track”. This allows us to distinguish these shorter degrees from “top-up” courses, which are designed to build on a level 4 or 5 HE qualification, rather than to be a stand-alone level 6 qualification. Where the nature of the course was unclear, details were cross-checked with providers’ websites or the UCAS website to check entry requirements, and hence to rule out “top up” courses. We treated courses called “accelerated” but requiring a first degree for entry as “top up” courses as we found they were more similar in structure.
132. We can approximately match these courses to HESA data on student numbers. The HESA data include provider, subject studied using JACS codes, qualification and course length, but not course name. The SLC data contain provider, course length, course name, and subject, using JACS code. We matched accelerated courses to students by providers and JACS code, using Full Time Equivalent counts of students, to avoid double counting of students on combined or joint honours courses. We may overestimate where providers run both “top up” and “accelerated” courses lasting two years in the same subjects. We found no such instances, but cannot rule out the possibility.
133. Using this method, we found around 250 accelerated degree courses at 34 English HE providers (20 HEFCE-funded HEIs, 6 designated APs, 2 Further Education Colleges (FECs)). Across these courses, our population exercise identifies that in 2016/17 4,470 students enrolled on accelerated degree courses, with 80% enrolled at APs and the remaining 20% at HEIs.

48
134. We do not have an estimate for the number of accelerated students at FECs in 2016/17. HESA data excludes FECs and we have been unable to obtain an estimate of enrolments on these courses. On inspection of these providers’ access agreements and websites, we found that they charged fees significantly under the maximum cap, and therefore are not bound by the current policy. As such, we conclude that they will not be affected by an increase in the fee cap for accelerated courses.
135. Since we only include two-year courses, we also assume that the number of first year students on accelerated degree courses is half of total enrolment. We therefore estimate that 2,235 first year students enrolled on an accelerated degree course in 2016/17 at designated HE providers.
136. This method of identifying accelerated students may lead to a biased estimate of the total population. We have identified factors that could lead to an over-estimate and other factors which could lead to an under-estimate. On balance we view our estimate as robust for the specified policy scope.
137. Factors which could lead to an overestimate include:
1. We may have misidentified courses as accelerated when in fact they are “Top up” courses – we relied on current (2017/18) course information to confirm course characteristics such as entry requirements, which may have changed since 2016/17.
2. Some providers offer 2-year accelerated and “top up” courses in the same subject, and we have incorrectly identified all students as accelerated – however, we did not find providers offering both 2-year top up and accelerated courses in the same subject in the SLC course data.
138. Factors which could lead to an under-estimate include:
1. We have excluded courses which would be within scope, once OfS finalises the definition, but which last longer than two years.
2. Some courses may have been incorrectly classified in the SLC data as part-time or not a Bachelors qualification, and so were excluded from our student estimate.
139. Therefore it is possible that other accelerated degree courses exist that we have not included, and such courses will be difficult to identify with the available variables and data. An alternative data source could be HEFCE’s Higher Education Students Early Statistics (HESE) Survey and Higher Education in Further Education: Students (HEIFES) Survey data. However, as in the HESA data, accelerated courses are not directly identified. The number of accelerated students can be approximated by looking at full-time undergraduates on long courses. A long course lasts at least 45 weeks per year, excluding work placements.
140. However, these data don’t allow us to distinguish students by course qualification or total length in years. The estimates are also at risk of incorrect reporting by providers, who may

49
inaccurately record the length of a course which includes work placements. As such, we conclude that the SLC and HESA data sources provide a more robust estimate of the population.
141. We provide a list of accelerated providers we identified with the SLC data below in Table 12. This list may be incomplete due to the data quality problems outlined above. Similarly, some providers on this list may not run courses in 2018 and beyond, as the data were obtained from 2016/17 courses.
Table 12: English providers of accelerated degree courses in 2017
HEFCE-funded HEIs Alternative Providers Anglia Ruskin University Access to Music Birmingham City University BIMM Falmouth University* BPP University Leeds Beckett University GSM London Leeds Trinity University London School of Business and Management Middlesex University London Met Film School Plymouth University Pearson College Ravensbourne SAE Institute Southampton Solent University The Academy of Contemporary Music (ACM) St Mary’s University, Twickenham The University of Buckingham Staffordshire University The University of Law University of Bedfordshire* University of Derby University of Essex University of Gloucestershire University of Greenwich University of Hertfordshire University of Lincoln* University of Northampton* University of Salford
Source: DfE analysis of SLC course data, for courses running in 2016/17 * No students identified at these providers

50
Appendix B: Accelerated Student Number Estimates 142. This section uses our population estimate and behavioural response assumptions to
estimate accelerated student numbers under both policy options.
Option 0 – Do Nothing 143. In the Do Nothing option we assume that 2,235 first-year students enrol in accelerated
degree courses in 2019/20, staying constant to 2028/29. The main assumptions underlying these estimates are as follows:
• Overall student numbers do not change from 2016/17 to 2019/2020. Published forecasts for HEFCE-funded students show broadly flat numbers, as a fall in the population of 18-24 year olds is offset by increasing HE participation rates. In the absence of specific forecasts for Alternative Providers, or accelerated students, this forecast is applied to all Core students.
• Accelerated student numbers do not change in the absence of a change of policy. We assume no growth at Approved (fee cap) providers since the financial barriers are still in place. We assume no change in students at Approved providers, in line with the overall student population.
Option 1 – Increase fee and fee loan caps 144. The lack of available data means there is a large amount of uncertainty around the number
of additional students. Consultation responses indicated some providers were planning expansion, but others were uncertain about the level of demand for accelerated courses and did not have firm plans for the short term.
145. We estimate two sets of student numbers with a range of assumptions about growth to illustrate the range of outcomes we anticipate. We use these estimates to calculate a “best estimate” and “high” NPV, keeping per-student and fixed costs and benefits constant.
Best estimate- main growth scenario
146. Our main growth scenario assumes that in 2019/20, and each following year to 2028/29, the number of entrants at Approved (fee cap) providers increases by approximately 27% each year, with no growth at Approved providers. The high growth rate is feasible given the low base, and the evidence of interest from providers58. This growth may include expansion of existing courses, new courses at existing accelerated providers, and from providers who
58 Department for Education, 2016, “Accelerated courses and switching university or degree: call for evidence”, https://www.gov.uk/government/consultations/accelerated-courses-and-switching-university-or-degree-call-for-evidence

51
do not currently offer accelerated courses. This last group may include new entrants as well as existing providers in the wider HE market.
147. There is significant uncertainty around this rate of growth. In particular, it assumes activity by the Office for Students to encourage and support providers in moving to this innovative type of provision and addressing other challenges relating to the provision of accelerated degrees59.
148. This profile of growth reflects evidence that there is interest in accelerated courses both from providers and potential students, but that there are organisational and marketing barriers to overcome, as well as the time required to design new courses60. There will also be cultural norms, influencing both students and providers that will need to be challenged. There is also some evidence that providers view their accelerated courses as more suitable for the most motivated students, and carefully vet applicants through resource-intensive admissions processes61, so the policy impact may be constrained by the pool of suitable candidates.
149. The number of accelerated entrants and total number of accelerated students per academic year in this scenario are presented in Table 4 and Table 5 respectively. In this scenario, by 2028/29 the number of entrants on accelerated degrees will have increased to almost six times the pre-policy level. This estimate of student numbers translates to a Net Present Value of £131.1m in 2017 prices for the 10-year period starting in 2019/20
High Estimate – Transformative growth scenario
150. For our “High Estimate” of the NPV of Policy Option 1, we consider a Transformative growth scenario with higher annual growth to reflect broader Government aims to improve student choice. In this scenario, there would be a substantial shift to accelerated degrees among providers, as the cultural norms among students, providers and employers (discussed above in paragraph 141) change.
151. We assume that from 2019/20 to 2028/29 the number of entrants to accelerated courses rises to 40,000, with annual growth of 42% in the Approved (fee cap) part of the sector. As
59 Barber, Michael, 2017, “Tending the Higher Education Landscape: Priorities for the Office for Students”, Speech to Universities UK conference, http://www.universitiesuk.ac.uk/news/Documents/sir-michael-barber-speech-uuk-june-2017.pdf 60 Pollard, Emma, Kari Hadjivassiliou, Sam Swift, and Martha Green, 2017, “Accelerated degrees in Higher Education: Literature review”, Department for Education, https://www.gov.uk/government/uploads/system/uploads/attachment_data/file/595637/Accelerated_Degrees_Literature_Review.pdf Huxley, Clare , Martha Green, Sam Swift and Emma Pollard, 2017, “Accelerated degrees in Higher Education: Case study report”, Department for Education, https://www.gov.uk/government/uploads/system/uploads/attachment_data/file/595638/Accelerated_Degrees_Case_Study_Report.pdf 61 Huxley, et al., 2017, “Accelerated degrees in Higher Education: Case study report”, Department for Education

52
in the main scenario, this growth may arise from existing courses and providers, and from new entrants to the accelerated market and new entrants to HE as a whole.
152. As with the main scenario, there is no change in the number of entrants at Approved providers. We continue to assume the same split between Switching and New students, and a 100% continuation rate for all students. The volume of entrants and enrolled students under this scenario, by academic year of entrants, are presented in Table 13 and Table 14 respectively.
Table 13: First-year accelerated entrant numbers for Option 1 (Transformative scenario) by student group
New Entrants for both Policy Options
Additional Entrants for Option 1 Option 1
Total Approved
Approved (fee cap)
Switching students
New students
2019/20 1,035 1,200 450 50 2,735
2020/21 1,035 1,200 1,085 120 3,440
2021/22 1,035 1,200 1,985 220 4,440
2022/23 1,035 1,200 3,265 365 5,860
2023/24 1,035 1,200 5,070 565 7,870
2024/25 1,035 1,200 7,630 850 10,715
2025/26 1,035 1,200 11,260 1,250 14,745
2026/27 1,035 1,200 16,400 1,820 20,455
2027/28 1,035 1,200 23,680 2,630 28,545
2028/29 1,035 1,200 33,990 3,775 40,000 Notes:
1. Numbers may not sum due to rounding. Numbers are rounded to the nearest 5.

53
Table 14: Total accelerated students for Option 1 (Transformative scenario) by student group
Student stock for both Options
Additional Students for Option 1 Option 1
Total Approved Approved
(fee cap) Switching Students
New Students
2019/20 1,035 1,200 450 50 2,735
2020/21 2,070 2,395 1,535 170 6,175
2021/22 2,070 2,395 3,070 340 7,880
2022/23 2,070 2,395 5,250 585 10,300
2023/24 2,070 2,395 8,335 925 13,725
2024/25 2,070 2,395 12,705 1,410 18,580
2025/26 2,070 2,395 18,890 2,100 25,460
2026/27 2,070 2,395 27,660 3,075 35,200
2027/28 2,070 2,395 40,075 4,455 49,000
2028/29 2,070 2,395 57,665 6,405 68,545 Notes:
1. For 2019/20 we include entrants only, as continuing students would not be affected by this policy option. For all subsequent years, this table includes both entrants and continuing students. We assume a continuation rate and graduation rate of 100%
2. Numbers may not sum due to rounding. Numbers are rounded to the nearest 5.
153. Under this scenario, by 2028/29 there will be 68,545 students enrolled on accelerated courses, and an additional 116,460 students will have enrolled on accelerated courses over the first ten years of the policy.
154. The overall NPV under this Transformative growth scenario (our “High” estimate for this Impact Assessment), is £293.7m. This comprises the NPV associated with Core Students of zero (as under the Cautious growth scenario), the NPV associated with Switching students of £409.3m, and the NPV associated with New students of -£113.3m. As for the ‘best estimate’, the NPV for New students does not reflect the full life-time social benefit of these students participating in HE. There is no change to the SLC set-up costs. For this scenario, the NPV to providers is £37.9m, the EANDCB remains a benefit of £3.4m, as it results from the effect of the policy on Core students only.

54
Appendix C: Earnings modelling 155. We model earnings for non-graduates and standard and accelerated graduates to account
for earnings growth over time as individuals accumulate labour market experience, and to account for the rise in average earnings in the economy, due to rising labour productivity. We also model earnings to account for differences in employment rates by age within each group.
156. We produce estimates of earnings for each cohort in each year of the policy for both the Do Nothing policy option, and where there is an increase in the tuition fee cap. We do not model earnings prior to the point of HE participation, as we assume no change in behaviour as a result of the policy at this stage.
Average Earnings Growth 157. We use estimates of earnings from 2017 (see below for details) and adjust for average
earnings growth in the macroeconomy. Average earnings forecasts are taken from the Office for Budget Responsibility62. We then adjust this average earnings index for the GDP deflator index to calculate an average real earnings index.
Table 15: Real earnings forecast
Financial year
Average earnings index1
GDP deflator index1
Real average earnings index1,2
Real average earnings growth (%)
2016-17 100.0 100.0 100.0 2017-18 102.5 101.9 100.7 0.7 2018-19 105.3 103.4 101.8 1.1 2019-20 107.8 105.0 102.6 0.8 2020-21 110.6 106.8 103.6 0.9 2021-22 113.7 108.6 104.7 1.1 2022-23 117.1 110.6 105.9 1.2 2023-24 121.3 113.1 107.3 1.3 2024-25 125.7 115.6 108.8 1.4 2025-26 130.4 118.1 110.4 1.5 2026-27 135.4 120.7 112.2 1.6 2027-28 140.7 123.3 114.1 1.7 2028-29 146.4 126.1 116.1 1.8 Source: OBR March 2018 Economic and fiscal outlook, DfE calculations Notes: 1. For indices, 2016-17 = 100 2. Real average earnings index = Average earnings index / GDP deflator index
62 Office for Budget Responsibility, 2018, “Long-term economic determinants – March 2018 Economic and fiscal outlook”, http://obr.uk/efo/economic-fiscal-outlook-march-2018/
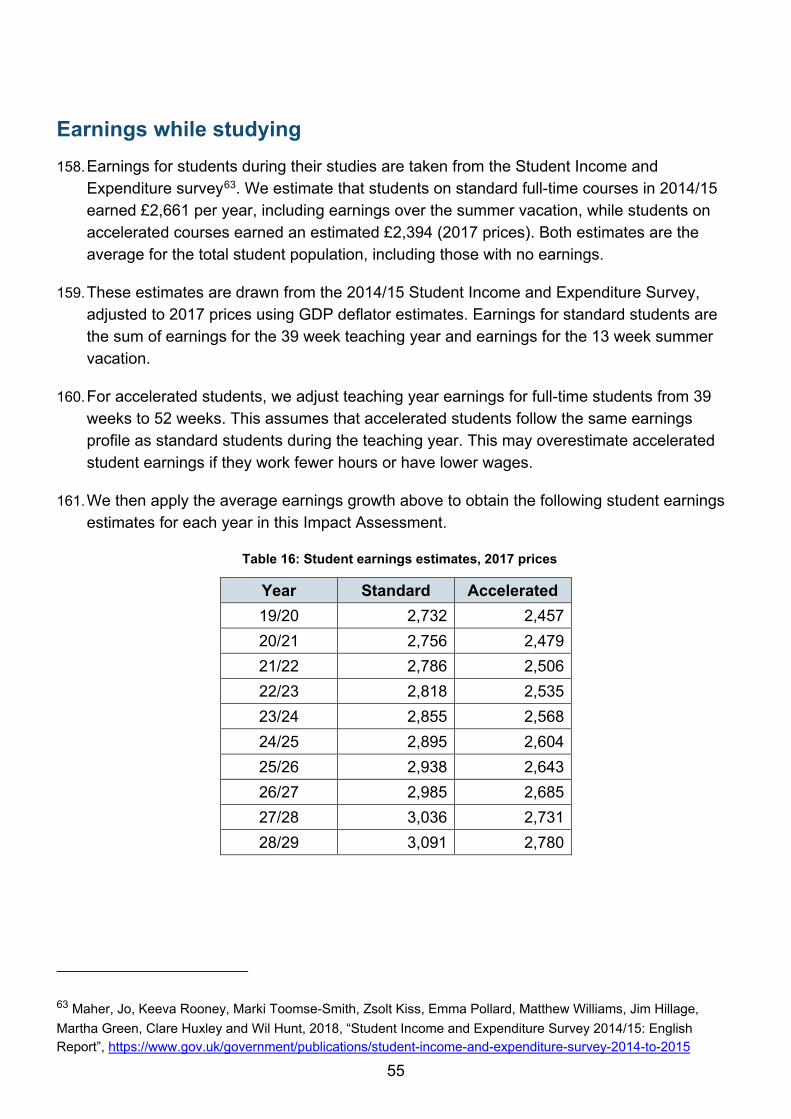
55
Earnings while studying 158. Earnings for students during their studies are taken from the Student Income and
Expenditure survey63. We estimate that students on standard full-time courses in 2014/15 earned £2,661 per year, including earnings over the summer vacation, while students on accelerated courses earned an estimated £2,394 (2017 prices). Both estimates are the average for the total student population, including those with no earnings.
159. These estimates are drawn from the 2014/15 Student Income and Expenditure Survey, adjusted to 2017 prices using GDP deflator estimates. Earnings for standard students are the sum of earnings for the 39 week teaching year and earnings for the 13 week summer vacation.
160. For accelerated students, we adjust teaching year earnings for full-time students from 39 weeks to 52 weeks. This assumes that accelerated students follow the same earnings profile as standard students during the teaching year. This may overestimate accelerated student earnings if they work fewer hours or have lower wages.
161. We then apply the average earnings growth above to obtain the following student earnings estimates for each year in this Impact Assessment.
Table 16: Student earnings estimates, 2017 prices
Year Standard Accelerated 19/20 2,732 2,457 20/21 2,756 2,479 21/22 2,786 2,506 22/23 2,818 2,535 23/24 2,855 2,568 24/25 2,895 2,604 25/26 2,938 2,643 26/27 2,985 2,685 27/28 3,036 2,731 28/29 3,091 2,780
63 Maher, Jo, Keeva Rooney, Marki Toomse-Smith, Zsolt Kiss, Emma Pollard, Matthew Williams, Jim Hillage, Martha Green, Clare Huxley and Wil Hunt, 2018, “Student Income and Expenditure Survey 2014/15: English Report”, https://www.gov.uk/government/publications/student-income-and-expenditure-survey-2014-to-2015

56
Labour market outcomes by age for graduates and non-graduates 162. We model graduate and non-graduate earnings to identify foregone earnings and the
graduate premium for additional students who are “new participants”, and to estimate the additional earnings arising from earlier graduation for “switching” students.
163. Graduate earnings estimates are available from a range of sources, many of which do not have a suitable non-graduate comparison group. We use earnings estimates by age and education level from the Labour Force Survey, published by ONS64.
164. These earnings estimates exclude the self-employed. According to the latest Longitudinal Education Outcomes statistics, self-employed graduates earn slightly less on average65, so these estimates may somewhat overestimate average graduate earnings.
165. However, the estimate also includes individuals with a wide range of qualifications within the “graduate” category. The category includes qualifications over A level equivalent. It therefore includes FE and HE qualifications below first degree (Level 6) and higher qualifications, such as Masters and PhDs (Levels 7 and 8 respectively). Depending on the relative frequency of these different qualifications, earnings for first degree graduates may be over- or underestimated. For non-graduates, estimates are for A-level equivalent qualifications. It also includes some Level 4 and 5 qualifications. The full list is in Table 17 below.
Table 17: Graduate and non-graduate qualifications, Labour Force Survey earnings estimates by education level, 2017
Types of higher education that lead to a person being classified as a graduate:
Types of education classified as equivalent to an A level:
Higher degree NVQ level 5 Level 8 Certificate Level 7 Diploma Level 7 Certificate Level 8 Award First degree or foundation degree Other degree NVQ level 4 Level 6 Certificate Level 7 Award Diploma in higher education Level 5 Diploma
Level 4 Diploma Level 4 Certificate Level 5 Award NVQ level 3 Advanced/Progression (14 to 19) Diploma Level 3 Diploma Advanced Welsh Baccalaureate International Baccalaureate GNVQ/GSVQ advanced A-level or equivalent RSA advanced diploma OND/ONC/BTEC/SCOTVEC National etc. City and Guilds Advanced Craft/Part 1 Scottish 6 year certificate/CSYS SCE higher or equivalent
64 Office for National Statistics, 2017, “Graduates in the UK labour market: 2017”, https://www.ons.gov.uk/employmentandlabourmarket/peopleinwork/employmentandemployeetypes/articles/graduatesintheuklabourmarket/2017 65 Department for Education, 2017, “Graduate outcomes (LEO): including self-employment earnings data“, https://www.gov.uk/government/statistics/graduate-outcomes-leo-including-self-employment-earnings-data

57
Types of higher education that lead to a person being classified as a graduate:
Types of education classified as equivalent to an A level:
Level 5 Certificate Level 6 Award HNC/HND/BTEC higher etc. Teaching further education Teaching secondary education Teaching primary education Teaching foundation stage Teaching level not stated Nursing etc. RSA higher diploma Other higher education below degree
Access qualifications AS-level or equivalent Trade apprenticeship Level 3 Certificate Level 4 Award
Source: ONS, 2017
166. Estimates for median earnings are given by age in years, from 21 years old. We have adjusted earnings for employment rates and average earnings growth.
167. The employment rate, i.e. the proportion of the population who are in employment rather than inactive or unemployed, is then calculated as the product of (1 – Inactivity Rate) and (1 – Unemployment rate).Estimates for unemployment and inactivity rates, which are given for recent and non-recent graduates (where recent is within five years of graduation) and for non-graduates aged 21-30 and aged over 30. In our modelling for both standard and accelerated graduates we use the ONS estimates for recent graduates, and for non-graduates we use the estimates for ages 21-30.
168. From HESA 2016/17 student records data, for students on first degree courses at English HEIs the median entrant age is 19, and the median qualifier age for these students is 22. We use these when choosing the age profile available from the ONS estimates. Estimates by age are available from 21 years. In the absence of non-graduate earnings estimates for ages 19 and 21, we use the estimate for age 21. This will likely overestimate earnings for this group, thereby leading to an overestimate of foregone earnings for “New” students. The alternative approach would require further modelling of earnings growth among young non-graduates.

58
Table 18: Labour market outcomes by student type and for non-participants, 2017 (2017 prices)
Standard student (3 years study, qualify age 22) Year since
potential start Age Earnings
Unemployment rate
Inactivity Rate
Employment rate
Adjusted earnings
1 19 2,661 2 20 2,661 3 21 2,661 4 22 17,306 5% 6% 89% 15,454 5 23 19,471 5% 6% 89% 17,388 6 24 21,988 5% 6% 89% 19,635 7 25 23,859 5% 6% 89% 21,306 8 26 25,967 5% 6% 89% 23,188 9 27 26,724 2% 12% 89% 23,865
10 28 27,890 2% 12% 89% 24,906 Accelerated student (2 years study, qualify age 21) Year since
potential start Age Earnings
Unemployment rate
Inactivity Rate
Employment rate
Adjusted earnings
1 19 2,394 2 20 2,394 3 21 15,189 5% 6% 89% 13,564 4 22 17,306 5% 6% 89% 15,454 5 23 19,471 5% 6% 89% 17,388 6 24 21,988 5% 6% 89% 19,635 7 25 23,859 5% 6% 89% 21,306 8 26 25,967 2% 12% 89% 23,188 9 27 26,724 2% 12% 89% 23,865
10 28 27,890 2% 12% 89% 24,906
Non-participant (no years of study, A-level equivalent earnings)
Year since potential
start Age Earnings
(£) Unemployment
rate Inactivity
Rate Employment
rate Adjusted earnings
1 19 14,980 7% 17% 77% 11,563 2 20 14,980 7% 17% 77% 11,563 3 21 14,980 7% 17% 77% 11,563 4 22 15,444 7% 17% 77% 11,922 5 23 16,630 7% 17% 77% 12,837 6 24 17,658 7% 17% 77% 13,630 7 25 18,546 7% 17% 77% 14,316 8 26 19,153 7% 17% 77% 14,784 9 27 19,163 7% 17% 77% 14,792
10 28 19,833 7% 17% 77% 15,309 Source: ONS, SIES 14/15 Notes: Unemployment and inactivity rates for graduates are given for the 5 years after graduation and for over 5 years after graduation Unemployment and inactivity rates for non-graduates are given for ages 21-30 and non-graduates aged over 30.

59
169. Once average real earnings growth has been applied, the earnings for the first cohort of the policy (those entering HE in 2019/20) follow the profile in Figure 2 above. Profiles for subsequent cohorts will follow the same pattern, but with higher earnings levels reflecting real average earnings growth.
Tax and Student Loan Repayments 170. Tax and loan repayments are estimated using the earnings estimates above, using median
earnings conditional on employment. They are then adjusted using the same employment rates to produce an overall average.
171. Graduates pay 9% of their gross earnings over the repayment threshold as loan repayments. The repayment threshold in April 2018 is £25,000, and will rise with average earnings. The threshold by year is reported in Table 19 below.
172. In this modelling, accelerated students have no loan repayments in their first year after graduation as their earnings are below the repayment threshold. As standard and accelerated graduates have the same annual earnings from age 22, these loan repayment estimates for those in employment are the same. However employment rates differ at age 26, leading to a small difference in loan repayments
173. These estimates may vary from other models as they are based on median earnings only, rather than the full distribution. As such, the simplified nature of this modelling may not capture the variation in repayments between standard and accelerated graduates. Since loan repayments are a transfer between graduates and the tax payer, they have no effect on the overall economic impact of the policy, and no impact on the EANDCB or Net Present Value for business, so this simplification has a very minor impact on the accuracy of this Impact Assessment.
174. Income tax and National Insurance Contributions (NICs) are modelled similarly. We adjust current payment thresholds to rise with average earnings, and apply the current rates of 20% for income tax and 12% for NICs. Thresholds estimates are presented in Table 19 below. These are applied to the median earnings estimates for graduates and non-graduates in employment, and then adjusted for employment rates to produce an overall average.

60
Table 19: Loan repayment and tax thresholds, 2017 prices
Year Student loan repayment threshold, £
Personal allowance (income tax threshold), £
National Insurance threshold, £
19/20 25,107 11,798 8,378 20/21 25,334 11,905 8,454 21/22 25,603 12,032 8,544 22/23 25,899 12,171 8,643 23/24 26,237 12,329 8,755 24/25 26,605 12,502 8,878 25/26 27,005 12,690 9,012 26/27 27,437 12,894 9,156 27/28 27,905 13,113 9,312 28/29 28,408 13,350 9,480

61
Appendix D: Sensitivity Analysis 175. To illustrate the robustness of our estimates, additional modelling has been completed to
demonstrate what could happen if these assumptions are changed. The results of this further analysis are set out below.
Costs of accelerated provision 176. As discussed in the main analysis (see paragraphs 60 to 66), there is limited evidence on
the costs of provision in HE, both for accelerated courses and more widely. Qualitative responses to consultation matched earlier evidence, with increased focus on the costs of teaching. The available evidence on overall publicly-funded sector costs relative to income for publicly-funded teaching shows a small surplus of 2.4%. We use this estimate in our main estimate.
177. Given the uncertainty on this issue, we test the sensitivity of this assumption by considering a case where providers can realise greater savings through accelerated provision, due to a higher contribution of fixed costs. We continue to assume no change in costs for Core students, and a surplus of 2.4% on standard courses because the policy should have no effect on the costs of providing existing courses (see paragraphs 61 to 67 for details). We now assume a 5% surplus from additional students on accelerated courses. We expect this to be a high estimate, as many consultations responses from the sector reported that a 20% uplift in fees would not sufficiently cover the costs of many courses.
178. Under these assumptions the cost of providing a complete accelerated degree is £20,773, the net revenue change for switching students is £459 per student per course, and the net revenue change for New students is £1,093 per student per course. Combining these changes with student numbers from Table 4, we set out the change in net revenue for providers in Table 20.
Table 20: Estimated additional net revenue to Approved (fee cap) providers by student group (£m, 2017 prices) – accelerated provision costs at 95% of fee revenue
Academic Year Core students Switching
students New students Total
2019/20 2.2 0.1 0.0 2.3 2020/21 4.4 0.3 0.1 4.7 2021/22 4.4 0.5 0.1 5.0 2022/23 4.4 0.8 0.2 5.3 2023/24 4.4 1.1 0.2 5.7 2024/25 4.4 1.5 0.3 6.2 2025/26 4.4 2.0 0.5 6.9 2026/27 4.4 2.7 0.6 7.7 2027/28 4.4 3.5 0.8 8.7 2028/29 4.4 4.5 1.0 10.0
Total 41.5 17.1 3.8 62.4

62
179. Testing this assumptions does not change student numbers, so there is no change in students’ net earnings, fee loan outlay or maintenance support. The estimate for the overall NPV rises to £122.6m, due to an increase in the business NPV to £52.1m. There is no change to the EANDCB estimate since this assumption only affects indirect benefits to providers.
180. Alternatively, we also test our cost assumption by assuming that the cost of providing accelerated courses to additional students is 100% of fee revenue. We do not expect providers to deliver courses where the costs exceed the fee cap. Under this assumption the cost of providing an accelerated degree is £21,866, the net revenue from a Switching student is -£634, and the net revenue from a New student is zero. The overall net revenue by student type and academic year is set out in Table 21.
Table 21: Estimated additional net revenue to Approved (fee cap) providers with an access agreement, by student group (£m, 2017 prices) – accelerated provision costs at 100% of fee revenue
Academic Year Core students Switching
students New students Total
2019/20 2.2 -0.1 0.0 2.1
2020/21 4.4 -0.2 0.0 4.2
2021/22 4.4 -0.4 0.0 3.9
2022/23 4.4 -0.7 0.0 3.7
2023/24 4.4 -1.1 0.0 3.3
2024/25 4.4 -1.5 0.0 2.9
2025/26 4.4 -2.1 0.0 2.3
2026/27 4.4 -2.8 0.0 1.6
2027/28 4.4 -3.7 0.0 0.7
2028/29 4.4 -4.8 0.0 -0.5
Total 41.5 -17.4 0.0 24.1
181. On this basis, the estimate for the overall NPV is £92.3m, including a business NPV of £21.7m. Expansion under this scenario is driven by accelerated courses fulfilling providers’ non-financial objectives, rather than the aim of increasing the surplus from teaching.
182. This sensitivity analysis on course costs highlights the considerable uncertainty around the best estimate of around 15% each way, assuming the same growth in student numbers. This variation would be increased if student numbers growth is positively correlated with surplus levels from accelerated courses.

63
Split between Switching and New Students 183. In our analysis above, we assume that 90% of additional students “switch” from standard
three-year degrees to two-year accelerated degrees, and that the remaining 10% of additional students would not otherwise get a degree.
184. Within the timeframe of this impact assessment, the net economic value from Switching students is relatively large and positive, driven by an extra year of graduate earnings. However, the net economic value for New students is negative, since it takes five years for increased graduate earnings to offset foregone earnings during study. Therefore, if a higher proportion of additional students are New, rather than Switching students, the overall NPV for this Option decreases.
185. The NPV reaches zero at an approximately four-to-one split between Switching and New students. At this level the NPV for business is £37.4m, slightly higher than our “best estimate” as New students are associated with higher additional net revenue for providers. These proportions have no impact on the direct regulatory benefit to HE providers, since fee income from additional students is an indirect benefit.
186. However, this picture does not reflect the full long-term economic benefit from New students, since these students continue to generate gains through higher productivity and other benefits throughout their working life66.
187. If instead, there are no New students as a result of this policy, the NPV for the 10-year assessment period is £224.7m, arising from the immediate increase in the graduate labour supply and limited foregone earnings. This includes an NPV for business of £34.5m. The variation in the business NPV across these two scenarios is relatively small, as the NPV largely rests on the additional fee income from Core students, which is not affected by this uncertainty.
Approved provider response to Policy Option 1 188. Throughout our analysis of Option 1 we have assumed that there is no change in fee, and
student numbers for Approved providers. This is largely consistent with treating these providers/courses/students as a largely separate market in equilibrium.
189. However, if Option 1 successfully removed barriers to increased supply of accelerated places by Approved (fee cap) providers, the Approved providers who account for 80% of accelerated places at present, may face a sharp increase in competition.
66 Department for Business Innovation & Skills, 2013, “The Benefits of Higher Education Participation for Individuals and Society: key findings and reports “The Quadrants””, BIS Research Paper No. 146, https://www.gov.uk/government/uploads/system/uploads/attachment_data/file/254101/bis-13-1268-benefits-of-higher-education-participation-the-quadrants.pdf

64
190. This increase in competition may result in changes in provider and student choices. Some of these possible changes, and their implications for the net economic value for the policy option are outlined in the table below.
Table 22: Possible effects of increased competition for Approved providers
Response Type of effect Result
Approved providers reduce fees in response to increased competition from Approved (fee cap) providers
Some additional students attend Approved providers, rather than the Approved (fee cap) providers which we have modelled.
Switching and New students would receive less fee loan and may face an upfront cost, relative to enrolling at Approved (fee cap) providers. See below for details.
If Core students switch, they may face additional upfront costs for fees and they would receive around £3,650 less in fee loan per year.
More current APs register as Approved (fee cap) providers with access agreements than we anticipate
This would increase the fee loan available to students, if these providers are charging fees above the basic cap.
The increase in providers with full fee loan support may help to meet student demand, and increase the number of additional students more quickly.
For Core students at these providers, there will likely be an increased loan outlay as they become entitled to a full fee loan. Further details are set out below.
If this registration also increases the additional students on accelerated courses, there will be an increase in the net economic benefit of the policy, through increased graduates in employment.
Students who would have attended Approved providers switching to courses at Approved (fee cap) providers
Students may respond to the increasing number of accelerated places with full tuition fee loans.
There is no economic benefit through graduate earnings and productivity spillovers if these students would have taken accelerated courses anyway.
Students benefit from reducing up-front costs of studying.
The move to Approved (fee cap) providers results in an increase in the Government fee loan outlay.
This may reduce the number of Approved providers offering accelerated degrees.

65
191. Approved providers may also respond to the policy through enrolling more students and/or increasing fees. Two APs that responded to the consultation reported plans for growth in accelerated courses. If fees stay constant or rise only slightly, the increase in tuition fee loan for their students would increase affordability of the courses, as reflected in these APs’ consultation responses. This would increase student demand. Through these additional students, the policy would have an increased Net Present Benefit in the long run.
192. Alternatively, an increase in tuition fee loan could enable Approved providers to raise their fees to offset the increase in loan. Since students would not face higher up-front costs than currently, we would expect to see little fall in demand, in line with student behaviour we have seen with the increase in fee cap in 2012/13. Therefore, unlike under the modelling assumptions in our main analysis, these Approved providers would also see increased fee income, supported by the increased fee loan. This would have no impact on the Net Present Value of the policy, since the increased fee income for providers would be funded through transfers from government and students.
193. Overall, there remains uncertainty in the likely outcome for this part of the Higher Education market.
Additional students at Approved providers
194. In our main analysis we assume that all additional growth occurs through Approved (fee cap) providers. The analysis is very similar if instead some additional students attend Approved providers. Within this analysis we do not anticipate differential graduate outcomes by provider type .The differences arise in loan outlay, upfront costs for students, and providers’ net revenue.
Switching students
195. Switching students may change from standard courses at Approved or Approved (fee cap) providers.
196. Students switching from standard courses at Approved providers may do so for the same reasons as Switching students in our main analysis. Relative to those switching students at Approved (fee cap) providers, there would be smaller reduction in tuition fee loan outlay (£3,643 compared to £5,059). These students would also very likely face an increased upfront cost of fees not covered by the fee loan, because most current APs set accelerated fees as over 120% of standard fees.
197. Those switching from Approved (fee cap) providers may be motivated to attend Approved providers to access a particular course at a specialist provider, or to study at a particular location, which becomes more affordable under the policy. These students will receive a substantially lower tuition fee loan than if they had switched to a fee-cap course, so the government loan outlay would be reduced by a further £7,293 per student per course. These students will also likely face an additional upfront cost where fees exceed the fee

66
cap. The impact on overall provider revenues is not clear, as there is considerable variation in fees at current APs.
New HE participants
198. If additional New students, who would not otherwise participate in HE, attend Approved providers, rather than Approved (fee cap), the government loan outlay for these students would be reduced by around £3,645 per student per year, due to the lower fee loan cap. There would be no change in their access to government maintenance loans. These students would also likely face an upfront fee cost, depending on the provider and their fee setting. Similarly to the students above, the impact on provider net revenue is not clear. These students may choose these providers despite the upfront cost in order to access specific courses and locations, similarly to the potential Switching students discussed above.
Alternative Provider registrations under new Regulatory Framework
199. There remains uncertainty on how many current APs will register as Approved or Approved (fee cap) providers under the new regulatory framework, which was reflected in the consultation response. We base the main analysis on the results of a DfE survey. Here we consider two alternative assumptions:
1. Independent HE’s response to the consultation reported that 27.3% (3 of 11) of providers running accelerated courses who responded to their survey intend to register as Approved (fee cap).
2. If we apply current fee levels at APs to our population estimate, we find that 69.9% of students would be at providers with accelerated fees at or under the uplifted maximum cap of £11,100. We consider it very unlikely that providers with fees above this level would choose to register as Approved (fee cap) and hence reduce their fees. This estimate is also considerably higher than both survey estimates of registration intentions. As such, this is an extreme scenario which provides an upper bound estimate for fee cap registrations
200. Under the lower estimate of 27.3% APs registering as fee cap providers, assuming that this share also applies to AP students, we estimate that 42% of Core students would be at fee cap providers. On the same student growth assumptions, reaching 13,000 accelerated entrants in 2028/29, we estimate an overall NPV of the policy of £94.6m, with an NPV for business of £28.2m and an EANDCB of a £2.7m benefit.
201. Under the higher estimate of 69.9% of current AP students joining the fee cap registration category, we estimate that 76% of Core students would be at fee cap providers. Under the same student growth assumptions as above we estimate an overall NPV of the policy of £124.3m, with an NPV for business of £50.6m and an EANDCB of a £4.8m benefit. These results are closely linked to the assumptions of fee setting and student growth for the two registration categories.

67
© Crown copyright 2018
This document/publication (not including logos) is licensed under the terms of the Open Government Licence v3.0 except where otherwise stated. Where we have identified any third party copyright information you will need to obtain permission from the copyright holders concerned.
To view this licence: visit www.nationalarchives.gov.uk/doc/open-government-licence/version/3 email [email protected] write to Information Policy Team, The National Archives, Kew, London, TW9 4DU
About this publication: enquiries www.education.gov.uk/contactus download www.gov.uk/government/consultations Reference: DFE-00340-2018
Follow us on Twitter: @educationgovuk
Like us on Facebook: facebook.com/educationgovuk