ACCELERATED CARBONATION ASSESSMENT OF HIGH-VOLUME FLY ASH …
90
ACCELERATED CARBONATION ASSESSMENT OF HIGH-VOLUME FLY ASH CONCRETE by Omkar H. Thombare, B.E. A thesis submitted to the Graduate Council of Texas State University in partial fulfillment of the requirements for the degree of Master of Science with a Major in Technology Management August 2019 Committee Members: Federico Aguayo, Chair Anthony Torres Yoo-Jae Kim
Transcript of ACCELERATED CARBONATION ASSESSMENT OF HIGH-VOLUME FLY ASH …

ACCELERATED CARBONATION ASSESSMENT OF HIGH-VOLUME FLY ASH
CONCRETE
by
Omkar H. Thombare, B.E.
A thesis submitted to the Graduate Council of
Texas State University in partial fulfillment
of the requirements for the degree of
Master of Science
with a Major in Technology Management
August 2019
Committee Members:
Federico Aguayo, Chair
Anthony Torres
Yoo-Jae Kim

COPYRIGHT
by
Omkar H. Thombare
2019

FAIR USE AND AUTHOR’S PERMISSION STATEMENT
Fair Use
This work is protected by the Copyright Laws of the United States (Public Law 94-553,
section 107). Consistent with fair use as defined in the Copyright Laws, brief quotations
from this material are allowed with proper acknowledgement. Use of this material for
financial gain without the author’s express written permission is not allowed.
Duplication Permission
As the copyright holder of this work, I, Omkar H. Thombare, authorize duplication of this
work, in whole or in part, for educational or scholarly purposes only.

iv
ACKNOWLEDGEMENTS
I would like to thank my parents, Hanumant Thombare and Vasudha Thombare
for their continuous love and support. My sister, Amruta Thombare who has played an
important role in shaping up my career and I would take this opportunity to convey
immense thankfulness and appreciation.
I would like to express my sincere gratitude to my advisor Dr. Federico Aguayo
for his support since the day I have known him. His immense knowledge, enthusiasm,
motivation and patience has helped me throughout the process of research. I could not
have imagined a better advisor and mentor for my thesis study.
I would also like extend my appreciation to Texas Department of Transportation
(TxDOT) for their assistance and support. Finally, I would like to thank the committee:
Dr. Anthony Torres and Dr. Yoo-Jae Kim for their insightful suggestions and
encouragement.

v
TABLE OF CONTENTS
Page
ACKNOWLEDGEMENTS ............................................................................................... iv
LIST OF TABLES ............................................................................................................ vii
LIST OF FIGURES ......................................................................................................... viii
ABSTRACT .........................................................................................................................x
CHAPTER
I. INTRODUCTION ................................................................................................1
Background ..................................................................................................1
Problem Statement .......................................................................................2
Research Significance ..................................................................................3
Thesis Organization .....................................................................................3
II. LITERATURE REVIEW ....................................................................................5
Carbonation of Concrete ..............................................................................5
Effects of Use of SCMs on Carbonation of Concrete ..................................6
Ground granulated blast furnace slag (GGBFS) ..............................6
Silica fume .......................................................................................7
Fly ash ..............................................................................................8
Effects of Relative Humidity on Carbonation of Fly Ash Concrete ............9
Effects of Curing and Porosity on Carbonation of Fly Ash Concrete .........9
III. MATERIALS AND EXPERIMENTAL METHOD .......................................12
Materials Used ...........................................................................................12
Mixture Proportions ...................................................................................14
Mixing Procedure.......................................................................................15
Accelerated Carbonation Setup..................................................................16
Chamber .........................................................................................16
De-humidifer ..................................................................................17
vi
CO2 cylinder...................................................................................17
Preparation and Casting of Test Specimens...............................................18
Carbonation Test ........................................................................................19
Compression Test.......................................................................................21
IV. RESULTS AND DISCUSSION .....................................................................23
Compression Test.......................................................................................23
Accelerated Carbonation Test ....................................................................25
Assessment based on type of fly ash..............................................25
Assessment based on moist curing ................................................28
Comparison based on water-cementitious materials ratio .............30
Comparison based on amount of cementitious material ................35
Comparison between Slag and Fly Ash .....................................................41
Correlation between Compressive Strength and Carbonation ...................43
V. CONCLUSIONS AND RECOMMEDATIONS ..............................................47
APPENDIX SECTION ......................................................................................................49
REFERENCES ..................................................................................................................76

vii
LIST OF TABLES
Table Page
1. Chemical Properties of Cementitious Materials ............................................................12
2. Physical Properties of Aggregates .................................................................................13
3. Concrete Mix Matrix......................................................................................................15
4. Carbonation Depth Comparison between Control, 30% Class C
& F Fly Ash, and 30% Slag ...........................................................................................43

viii
LIST OF FIGURES
Figure Page
1. Sieve Analysis of Fine Aggregates ................................................................................13
2. Sieve Analysis of Coarse Aggregates ............................................................................14
3. Accelerated Carbonation Chamber ................................................................................16
4. Accelerated Carbonation Setup......................................................................................18
5. Mechanical Cutter ..........................................................................................................20
6. Carbonation Depth Recording Method ..........................................................................21
7. Compressive Strength of Class C Fly Ash (310 kg/m3 and 0.50 w/cm) ........................23
8. Compressive Strength of Class F Fly Ash (310 kg/m3 and 0.50 w/cm) ........................24
9. Compressive Strength Comparison of Class C & F Fly Ash
(340 kg/m3 and 0.45 w/cm) ............................................................................................24
10. Comparison of Class C Fly Ash Specimens with Control (1-day curing) ...................26
11. Comparison of Class C Fly Ash Specimens with Control (7-days curing) .................26
12. Comparison of Class F Fly Ash Specimens with Control (1-day curing) ...................27
13. Comparison of Class F Fly Ash Specimens with Control (7-days curing) ..................27
14. Comparison between 1-day and 7-days Curing for Control ........................................28
15. Comparison between 1-day and 7-days Curing for Class C Fly Ash ..........................29
16. Comparison between 1-day and 7-days Curing for Class F Fly Ash ...........................29
17. Comparison between 0.50 and 0.45 w/cm Ratio for Control (1-day curing) ..............30
18. Comparison between 0.50 and 0.45 w/cm Ratio for Control (7-days curing) .............31

ix
19. Comparison between 0.50 and 0.45 w/cm Ratio for Class C Fly Ash
(1-day curing)...............................................................................................................32
20. Comparison between 0.50 and 0.45 w/cm Ratio for Class C Fly Ash
(7-days curing) .............................................................................................................33
21. Comparison between 0.50 and 0.45 w/cm Ratio for Class F Fly Ash
(1-day curing)...............................................................................................................34
22. Comparison between 0.50 and 0.45 w/cm Ratio for Class F Fly Ash
(7-days curing) .............................................................................................................35
23. Comparison between 310, 340, and 370 kg/m3 Cementitious Content
for Control at 0.50 w/cm (1-day curing) ......................................................................36
24. Comparison between 310, 340, and 370 kg/m3 Cementitious Content
for Control at 0.50 w/cm (7-days curing) ....................................................................37
25. Comparison between 340 and 400 kg/m3 Cementitious Content for Class
C Fly Ash at 0.45 w/cm (1-day curing) .......................................................................38
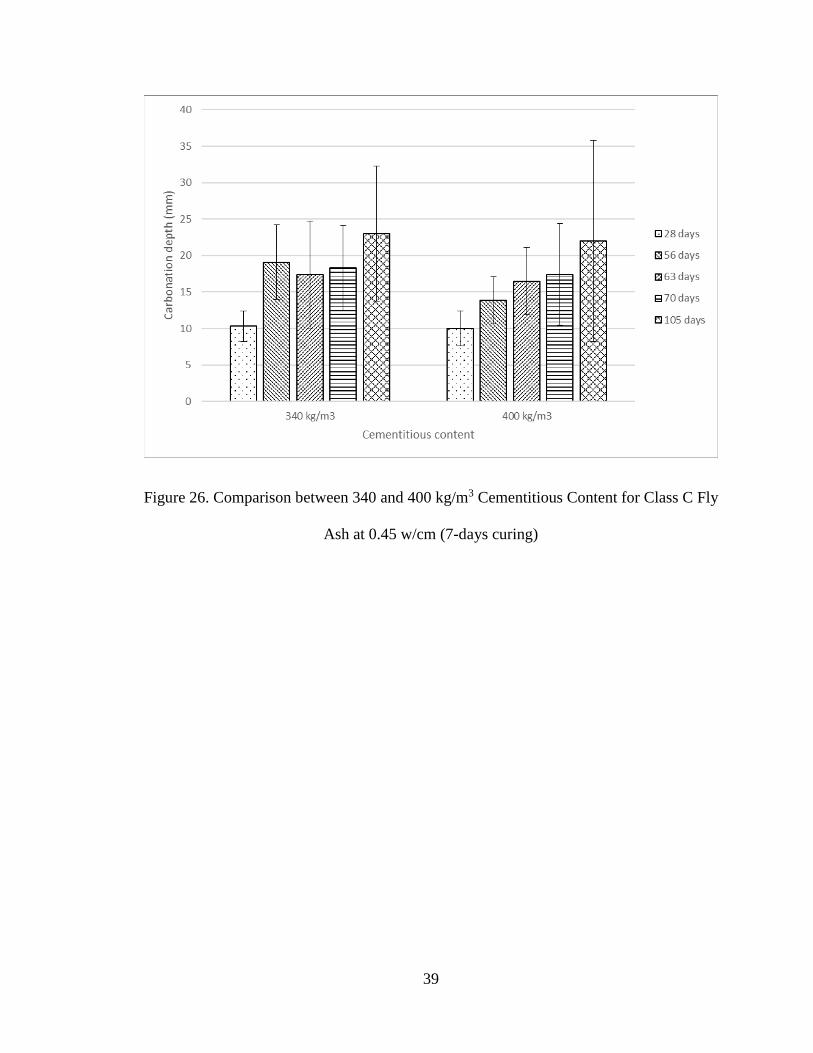
26. Comparison between 340 and 400 kg/m3 Cementitious Content for Class
C Fly Ash at 0.45 w/cm (7-days curing) ......................................................................39
27. Comparison between 340 and 400 kg/m3 Cementitious Content for
Class F Fly Ash at 0.45 w/cm (1-day curing) ..............................................................40
28. Comparison between 340 and 400 kg/m3 Cementitious Content for
Class F Fly Ash at 0.45 w/cm (7-days curing).............................................................41
29. Pictorial Comparison between Control, Fly Ashes, and Slag ......................................42
30. 2-days Compressive Strength vs 28-days Carbonation Depth .....................................44
31. 28-days Compressive Strength vs 105-days Carbonation Depth .................................45
32. 90-days Compressive Strength vs 105-days Carbonation Depth .................................46
x
ABSTRACT
This investigation deals with determining the effect of 57% relative humidity and
4% CO2 concentration on class C and class F fly ash concrete specimens under
accelerated carbonation. Fly ash concrete specimens were differentiated based on the
cementitious content (310, 340, 370, and 400 kg/m3) and water-cementitious materials
ratio (0.50 and 0.45). The specimens were allowed 1 and 7 days of moist curing and
moved to the accelerated carbonation chamber maintained at 57% relative humidity and
4% CO2 ingress. The specimens were tested for carbonation at an age of 28, 56, 63, 70,
and 105 days. The accelerated carbonation test results indicate that with addition of
supplementary cementitious materials the depth of carbonation also increases. It was
evident that increase in the duration of moist curing from 1 day to 7 days had a positive
effect, reducing the carbonation depth of control and fly ash concrete mixes. When both
types of fly ashes were compared, class C fly ash was observed to be more resistant
against carbonation than class F fly ash due to the higher calcium oxide content. Based on
the compressive strength results obtained, carbonation depth appeared to decrease with
increase in compressive strength, but this correlation was not significant.
Keywords: accelerated carbonation, fly ash concrete, relative humidity

1
I. INTRODUCTION
Background
The need for innovative infrastructures and urban housing is enormous and the
burden of fulfilling these necessities is heavily reliant on the concrete industry. In order
to meet these expectations, 3.7 billion tons of ordinary portland cement (OPC) is mass
produced every year contributing approximately 3.0 billion tons of CO2. These emissions
add up to 7% of the total emissions from all sources indicating the enormity of the impact
on environment (Malhotra & Mehta, 2008). CO2 emissions released during the
manufacturing of cement are prominently due to the calcination of limestone and usage
of fuels at high temperatures required during the sintering process. Hence, the
construction industry is under an immense burden to decrease these emissions of
greenhouse gases, and seek alternatives to produce reliable materials having identical
properties as cement (Lu, Wang, Li, Hao, & Xu, 2018). Considering the magnitude of
environmental impact cement production has, there is a need to use alternative materials
to replace cement partially or completely. Such materials are called supplementary
cementitious materials (SCMs). Fly ash, ground granulated blast furnace slag (GGBFS),
and silica fume are commonly used SCMs worldwide. A study on supplementary
cementitious materials indicated that GGBFS and fly ash can potentially reduce CO2
emissions by 22% and 14% respectively (Yang, Jung, Cho, & Tae, 2015). Lastly, a
majority of the SCMs are by-product materials and hence their addition in concrete can
be an efficient way of disposal.

2
Problem Statement
The use of SCMs in reinforced concrete such as fly ash has proved to be
beneficial in mitigating the effect of alkali-silica reaction, sulfate attack, and chloride
penetration. However, at the same time, the threat of carbonation in reinforced concrete
can be detrimental. Fly ash is a byproduct obtained from the combustion of pulverized
coal in an electrical generating station (Siddique, 2004). Fly ash is also recognized as an
eco-friendly material and its usage can contribute to lowering the carbon footprint to a
large extent. The partial replacement of OPC by fly ash offers greater resistance against
chemical threats such as alkali-silica reaction and sulfate attack (Collepardi, Collepardi,
Olagot, & Simonelli, 2004). In addition to that, it provides advantages such as better
mechanical properties, lower water demand, lessen heat evolution and reduced bleeding.
Durability is a key factor to assess the service life of concrete structures and fly ash
assists to improve it by decreasing the permeability of concrete (Lu et al., 2018).
Furthermore, during the designing phase of concrete structures, carbonation is considered
to be one of the key factors for the determination of the service life. While fly ash can
impart several beneficial qualities of concrete, several previous studies indicate that the
addition of fly ash has a negative impact on the carbonation results. Carbonation is a
serious threat to the concrete structure as the ingress and diffusion of CO2 can corrode the
reinforcement making the structure vulnerable to failure. The aim of this study is to
evaluate and characterize the carbonation patterns in fly ash concrete under accelerated
carbonation conditions exposed to various relative humidity conditions.

3
Research Significance
Carbonation of concrete is a lengthy diffusion process with chemical interaction
of atmospheric CO2 and calcium hydroxide (Ca(OH)2) liberated during the hydration
process (Bouzoubaâ, Bilodeau, Tamtsia, & Foo, 2010). It is important to study the
carbonation because when the carbonated surface reaches the steel reinforcement inside
the concrete, significant corrosion may be initiated which may ultimately reduce the
service life of the structure (Stefanoni, Angst, & Elsener, 2018). In a high-quality
concrete with a lower water-cementitious material ratio, typically the rate of penetration
of carbon is about 0.039 inches per year (NPCA, 2015). Considering the duration
required for the carbonation process, researchers adopt an accelerated carbonation
method to yield the results in a short period of time. In this method, concrete specimens
are subjected to carbonation at a much faster rate in a controlled environment. The rate of
carbonation usually depends on several factors such as relative humidity, temperature,
concentration of CO2, porosity, and curing age of concrete. These factors are further
explored in the study.
Thesis Organization
The study will further investigate the effect of 57% relative humidity on fly ash
concrete specimens in an environmentally controlled accelerated carbonation chamber
and access the carbonation pattern. Chapter 2 of this study covers a detailed literature
review on carbonation, the effects of carbonation on concrete structure, and the factors
that influence the rate of carbonation. In addition to that, a comparative study between
natural and accelerated carbonation is discussed. Chapter 3 explains the types of mixtures
and mixing matrices that were utilized in the present study along with detailed

4
experimental procedures. Chapter 4 summarizes and discusses the results obtained from
the tests carried out i.e. accelerated carbonation and compression test. It also converses
the effects of use of SCMs in concrete on carbonation with the help of graphical
representations. Finally, chapter 5 consists of the key takeaways from the research.

5
II. LITERATURE REVIEW
Carbonation of Concrete
Concrete structures are constructed considering primarily the compressive and
tensile forces acting on the structure. Concrete is known for its resistance against the
compressive forces and on the other hand, steel reinforcement is used inside concrete to
negate the tensile forces. The steel reinforcement in concrete is in a highly alkaline
environment (pH≈13) and a passive film of iron oxide is formed around the
reinforcement which protects the steel from corrosion (Aguayo, Drimalas, & Folliard,
2015). The corrosion of reinforcing steel in concrete is considered one of the most serious
problem considering the durability of the structure. It is the main reason for the
degradation of concrete structures and it negatively affects its service life (Reis,
Malheiro, Camões, & Ribeiro, 2015). Corrosion can occur if the moisture and oxygen
penetrates the concrete and reach the steel resulting in the development of cracks, rust
stains, and spalls of concrete cover (Khunthongkeaw, Tangtermsirikul, & Leelawat,
2006). When atmospheric carbon dioxide penetrates in the hardened concrete it dissolves
in the pore water to form carbonation acid and further it reacts with calcium hydroxide
(Ca(OH)2) released during the cement hydration and produces calcium carbonate (NPCA,
2015).
CO2 + H2O H2CO3
H2CO3 + Ca (OH)2 CaCO3 + 2H2O
This reaction is slow, and it deleteriously affects the passivation layer making the
steel vulnerable to corrosion and this process is known as carbonation (Bouzoubaa et al.,
6
2006). Carbonation is a vital reason for the reduction in pH value to less than 9, which
can significantly weaken or could eliminate the steel protective layer. This reduction of
pH is due to the carbonation reaction which consumes calcium hydroxide, and it is then
partially replaced by calcium carbonate reducing its concentration. Hence, the weaker
hydrogen ion concentration assists the reduction in pH value.
Effects of Use of SCMs on Carbonation of Concrete
Utilization of SCMs such as fly ash and GGBFS has been increasing around the
world, particularly due to the enhanced mechanical properties and to reduce the usage of
cement to decrease CO2 emissions. These SCMs are more resistant to chemical threats
such as alkali-silica reaction, sulfate attack, and chloride penetration (Collepardi et al.,
2004). However, several studies have indicated that the use of SCMs have presented
greater depth of carbonation when compared with the control mixture. For this study, fly
ash was the primary SCM used but the effects of other SCMs on carbonation are also
studied further. Since the process of carbonation takes years to get the results, the
majority of researchers adopt the accelerated carbonation method to hasten the process
under a controlled environment. In this study, the accelerated carbonation method was
implemented due to the time constraint.
Ground granulated blast furnace slag (GGBFS)
GGBFS is known to improve the resistance of concrete to alkali-silica reaction,
sulfate attack and chloride ingress. However, it possess a higher risk of carbonation at
higher replacement levels as compared with fly ash and OPC concrete (Lye, Dhir, &
Ghataora, 2016). The reduction in the amount of Ca(OH)2 is believed to play a vital role

7
in carbonation of GGBFS concrete as carbonation depths obtained are observed to be
higher in comparison with OPC concrete. The primary reason for this reduction can be
because some part of calcium hydroxide is utilized for its reaction with GGBFS (Sulapha,
Wong, Wee, & Swaddiwudhipong, 2003). Also, the water required for cement production
and the reactive CaO in GGBFS expresses the CO2 buffer capacity. This is indicative of
the microstructure of the mixture and shows a good correlation to the carbonation of
concrete produced (Leemann & Moro, 2017).
Silica fume
An experimental study conducted by Papadakis (2000), concluded that silica fume
with 10% addition replacing cement yielded the highest carbonation depth than high and
low CaO content fly ashes. This indicates that the use of silica fume can be detrimental
towards the passive oxide film protecting the reinforcement under controlled environment
(Papadakis, 2000). However, it was noticed that the impact on the use of silica fume in
concrete was very minimum as compared to ordinary Portland concrete at 0.29 w/cm
ratio. Carbonation resistance was observed to weaken at higher w/cm ratios prominently
at 0.7 and above (Czarnecki, Woyciechowski, & Adamczewski, 2018). Silica fume was
also found very effective for resistance against carbonation in comparison with GGBFS
and fly ash at 0.5 w/cm ratio and 28 days moist curing. The reason for strong resistance
against carbonation is believed due to the denser pore structure which makes it difficult to
penetrate the concrete made with silica fume (Sulapha et al., 2003).

8
Fly ash
Inclusion of fly ash in concrete reduces the calcium hydroxide content due to the
pozzolanic reactions which decreases the alkalinity level required for steel protection.
Also, it can reduce the pH level, consequently accelerating the carbonation which
produces high risk of corrosion (Bouzoubaâ et al., 2010). Hence, researchers have found
out that increase in replacement by fly ash has a negative effect on the depth of
carbonation. The calcium content in fly ashes is an important indicator of how fly ash
will perform in concrete. Low calcium fly ashes are produced from anthracite and
bituminous coals. These fly ashes require alkali or lime to react to form cementitious
hydrates which has no significant hydraulic behavior. However, high calcium fly ashes
are produced from lignite and sub-bituminous coals and they react with water rapidly
producing a pozzolanic and hydraulic mixture. It was also found that higher calcium
oxide content fly ash can solely achieve higher mechanical strengths when used as a
supplementary cementitious material (Thomas, 2007). High calcium fly ashes tend to
have an advantage over the low calcium fly ashes in terms of the mechanical properties
and hence it is better resistant against the threat of carbonation.
In a research conducted by Khunthongkeaw et. al. (2006), they concluded that fly
ash containing higher calcium oxide (CaO) content tends to have lower carbonation
depths as compared with low CaO fly ash (Khunthongkeaw et al., 2006). Another
research carried out by Sanjuan and Cheyrezy confirms that the partial addition of high
CaO content fly ash to the OPC offers a good resistance against carbonation (M.A.
Sanjuan & Cheyrezy). Considering the claims made in the above research, calcium oxide
(CaO) content in fly ash is believed to have an influence on the carbonation. However, in
9
a research it was observed that the addition of fly ash without reducing the original
cement content has a positive effect rather than the addition of fly ash to replace cement
(Branca, Fratesi, Moriconi, & Simoncini, 1992). Carbonation of fly ash concrete depends
upon the influence of several distinct factors and few of them are discussed further.
Effects of Relative Humidity on Carbonation of Fly Ash Concrete
Relative humidity is an important parameter to be considered while studying
accelerated carbonation in a controlled environment. In case of fly ash concrete, it was
observed that higher relative humidity improves the resistance against carbonation.
Concrete being a porous material allows the internal water to saturate in its pores, leaving
no space for CO2 to occupy. Due to this, the ingress of CO2 inside the concrete is limited
and subsequently the resistance against carbonation is increased (Ruixia, 2010). This
pattern can be validated from a study performed where specimens were allowed to moist
cure for 1 day and then moved to a controlled environment (20°C and 65% RH).
Carbonation was observed to decrease when relative humidity was increased from 65% to
80% and 65% to 90%. It was also observed that the significant effect of lack of moist
curing time provided to the specimens was compensated by increasing the relative
humidity (Thomas & Matthews, 1992).
Effects of Curing and Porosity on Carbonation of Fly Ash Concrete
Multiple researches suggest the importance of moist curing and its effect on the
carbonation depths of fly ash concrete. If the concrete is adequately cured, it significantly
reduces the large pores inside the concrete making it less penetrable. In a research on
concrete incorporating high volumes of fly ash, the results suggested that with an increase

10
in the moist curing period from 7 to 28 days, the carbonation depth was observed to
decrease. However, the effect was not substantial when the curing period was further
prolonged from 28 to 91 days (Bouzoubaa et al., 2006). Contrasting results were found in
a study which indicated that 90 days curing had a positive effect against carbonation of
fly ash concrete in comparison with 28 days curing (Zhao, He, Zhang, & Jiang, 2016). In
an accelerated carbonation of fly ash concrete study, it was clearly evident that, the
longer the specimens are allowed to moist cure before placing in the accelerated
carbonation chamber, lesser will be the carbonation depth. This emphasizes the
importance of moist curing conditions before exposing to the CO2 infused environment
(Atiş, 2004).
A linear relationship was found between porosity and carbonation depths
indicating that the carbonation value increases as porosity increases (Atiş, 2004). It can
be predicted that denser concrete mixtures would be more resistant against the threat of
carbonation since lesser the porosity, slower will be the ingress of CO2. This was
supported by research done by Bouzoubaa et. al. (2010) suggesting that increase in w/cm
ratio will increase the coefficient of carbonation both at 3 and 7 days of curing
(Bouzoubaâ et al., 2010). Similar results were observed in a research suggesting the
lower w/cm ratio mixtures offer better resistance against carbonation due to its denser
pore structure (Khunthongkeaw et al., 2006). Fly ash concrete with higher w/cm ratios
have higher carbonation depth due to the lack of calcium hydroxide content in the fly ash
(Hussain, Bhunia, & Singh, 2017). A similar trend was observed in a research where
three w/cm ratios (0.35, 0.50, and 0.65) were considered. An increase in carbonation

11
depth was observed with an increase in w/cm ratio for specimens exposed in an
accelerated carbonation chamber with a 75% relative humidity (Branca et al., 1992).
It is vital to understand the carbonation behavior of specimens exposed to natural
environments to recognize the relationship between accelerated and natural carbonation.
In a study by Jia, Yan, and Aruhan (2012), they found out that the replacement of cement
with SCMs and amount of cementitious materials have an influence on both natural and
accelerated condition. Another important research finding was that more than half of the
carbonation depth achieved in 2 years by the specimens that are naturally carbonated
takes place in the first 56 days if the specimens are insufficiently cured (Jia, Aruhan, &
Yan, 2012). Hence, initial curing of specimens plays a vital role against carbonation in
both natural and accelerated environments. Also, it was observed that a common trend
existed between natural and accelerated carbonation, i.e. with an increase in fly ash
content, carbonation also increased (Bouzoubaâ et al., 2010).

12
III. MATERIALS AND EXPERIMENTAL METHOD
Materials Used
The cement used for this study was a Type I/II OPC which conforms to the
ASTM C150 specifications (ASTM International, 2019). Fly ash and GGBFS were the
two SCMs used for the tests. Two types of fly ash namely Class C and Class F fly ashes
conforming to ASTM C618 were used (ASTM International, 2019). Class C fly ash
consisted of higher calcium oxide (CaO) content as compared to class F fly ash. The
chemical properties of the cementitious materials used are indicated in Table 1. The
coarse and fine aggregates used for this research were crushed limestone rock and
limestone sand respectively. The aggregate properties results are specified in Table 2 and
the sieve analysis for fine and coarse aggregates are shown in Figure 1 and Figure 2.
Table 1. Chemical Properties of Cementitious Materials
Material SiO2
Al2O3
Fe2O3 CaO MgO
SO3
Na2O K2O
Cement
20.8
4.4 4.3 63.62
1.1
2.9 0.11 0.67
Class C FA
41.05
17.80 3.84 20.69
3.63
1.29 1.89 0.62
Class F FA
49.40
22.02 12.64 2.99
1.04
0.79 0.75 1.52
GGBFS
32.76
6.99 0.46 48.07
10.37
0.04 0.30 0.33

13
Table 2. Physical Properties of Aggregates
Aggregates
Bulk
specific
gravity
(OD)
Bulk
specific
gravity
(SSD)
Apparent
specific
gravity
Absorption
(%)
Dry rodded
unit weight
(kg/m3)
Limestone
Sand 2.55 2.61 2.73 2.63 1819.64
Limestone
Rock 2.52 2.58 2.68 2.44 1574.89
Figure 1. Sieve Analysis for Fine Aggregates
14
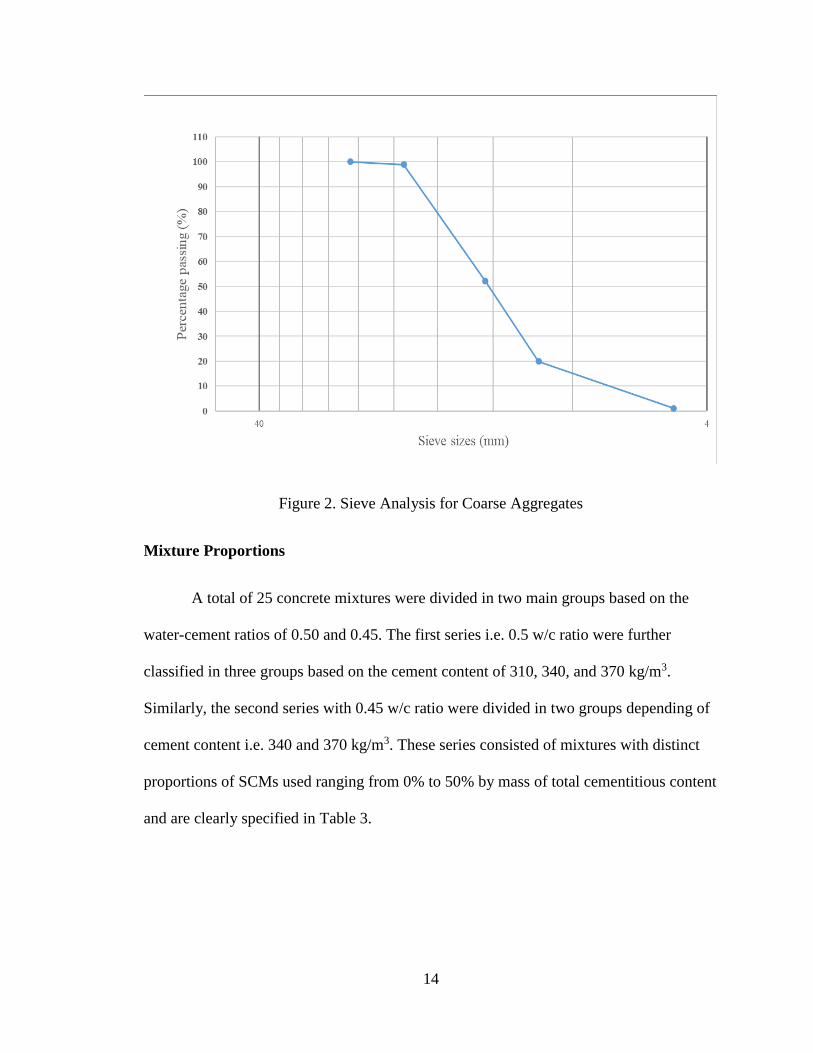
Figure 2. Sieve Analysis for Coarse Aggregates
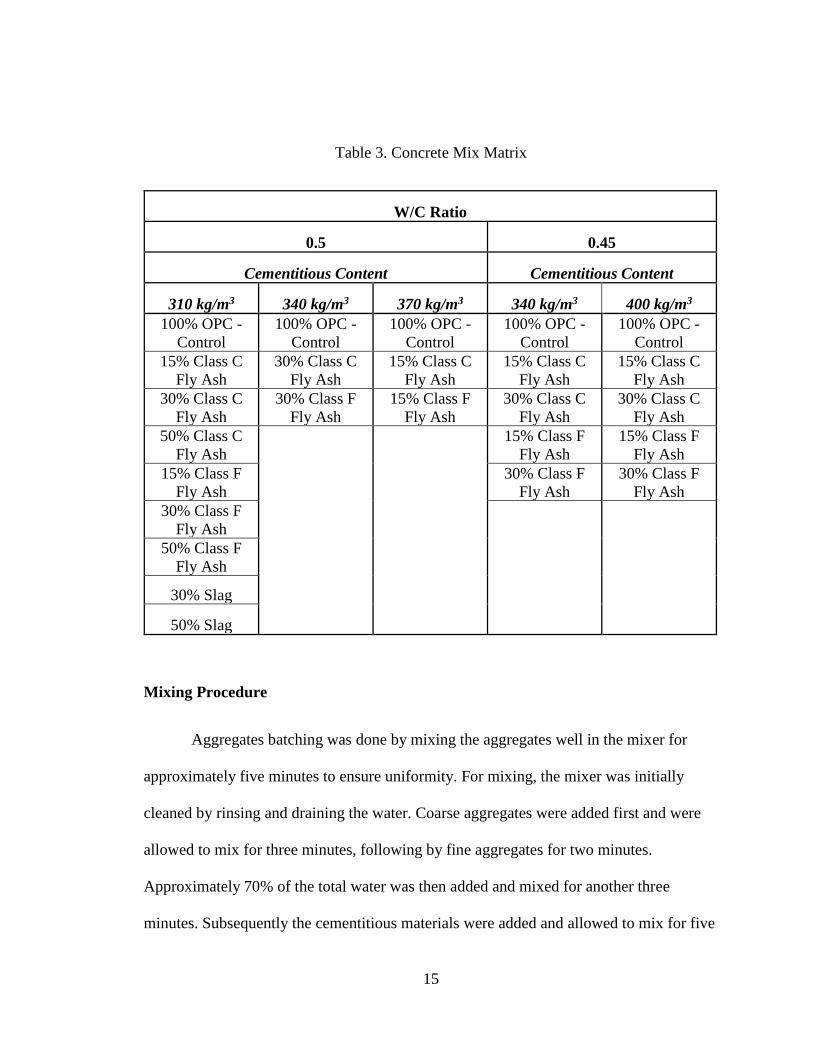
Mixture Proportions
A total of 25 concrete mixtures were divided in two main groups based on the
water-cement ratios of 0.50 and 0.45. The first series i.e. 0.5 w/c ratio were further
classified in three groups based on the cement content of 310, 340, and 370 kg/m3.
Similarly, the second series with 0.45 w/c ratio were divided in two groups depending of
cement content i.e. 340 and 370 kg/m3. These series consisted of mixtures with distinct
proportions of SCMs used ranging from 0% to 50% by mass of total cementitious content
and are clearly specified in Table 3.
15
Table 3. Concrete Mix Matrix
W/C Ratio
0.5 0.45
Cementitious Content Cementitious Content
310 kg/m3 340 kg/m3 370 kg/m3 340 kg/m3 400 kg/m3
100% OPC -
Control
100% OPC -
Control
100% OPC -
Control
100% OPC -
Control
100% OPC -
Control
15% Class C
Fly Ash
30% Class C
Fly Ash
15% Class C
Fly Ash
15% Class C
Fly Ash
15% Class C
Fly Ash
30% Class C
Fly Ash
30% Class F
Fly Ash
15% Class F
Fly Ash
30% Class C
Fly Ash
30% Class C
Fly Ash
50% Class C
Fly Ash
15% Class F
Fly Ash
15% Class F
Fly Ash
15% Class F
Fly Ash
30% Class F
Fly Ash
30% Class F
Fly Ash
30% Class F
Fly Ash
50% Class F
Fly Ash
30% Slag
50% Slag
Mixing Procedure
Aggregates batching was done by mixing the aggregates well in the mixer for
approximately five minutes to ensure uniformity. For mixing, the mixer was initially
cleaned by rinsing and draining the water. Coarse aggregates were added first and were
allowed to mix for three minutes, following by fine aggregates for two minutes.
Approximately 70% of the total water was then added and mixed for another three
minutes. Subsequently the cementitious materials were added and allowed to mix for five

16
minutes following by the remaining water for another three minutes. The mixture was
allowed to rest for another three minutes after removing from the mixer. The mixing
procedure was followed in accordance with ASTM C192 (ASTM International, 2018).
Accelerated Carbonation Setup
Chamber
The carbonation chamber was large enough to accommodate 50 prisms when
specimens were placed vertically. One mechanical fan was placed in the chamber to
ensure air circulation. A humidity probe inside the chamber provided the information of
the humidity inside the chamber. The prisms were positioned in the chamber in such a
manner that a gap of at least 5 mm between prisms and chamber walls were maintained
as shown in the Figure 3.
Figure 3. Accelerated Carbonation Chamber

17
De-humidifier
For this experiment, a Drieaz Revolution LGR Dehumidifier was used. It reduces
the humidity in the enclosed environment by removing water vapor from the air. It also
consists of a Humidistat mode which allows users to maintain the desired humidity level.
The relative humidity level was maintained by the means of this de-humidifier placed
above the carbonation chamber. The ventilation ducts were cut in such a way that the
inflow and outflow of CO2 through the system is smooth and the relative humidity is
maintained. The relative humidity was controlled at 57 +/- 5%.
CO2 cylinder
A CEA 288 CO2 analyzer was used to monitor the carbon content inside the
chamber. It consisted a digital readout with standard ranges of 0-1%, 0-10%, or 0-100%.
The CO2 level inside the chamber was adjusted to 4% with the help of a gas regulator. A
digital display was placed above the carbon tank which indicated the CO2 level and the
temperature inside the carbonation chamber. Figure 4 demonstrates the entire accelerated
carbonation setup.
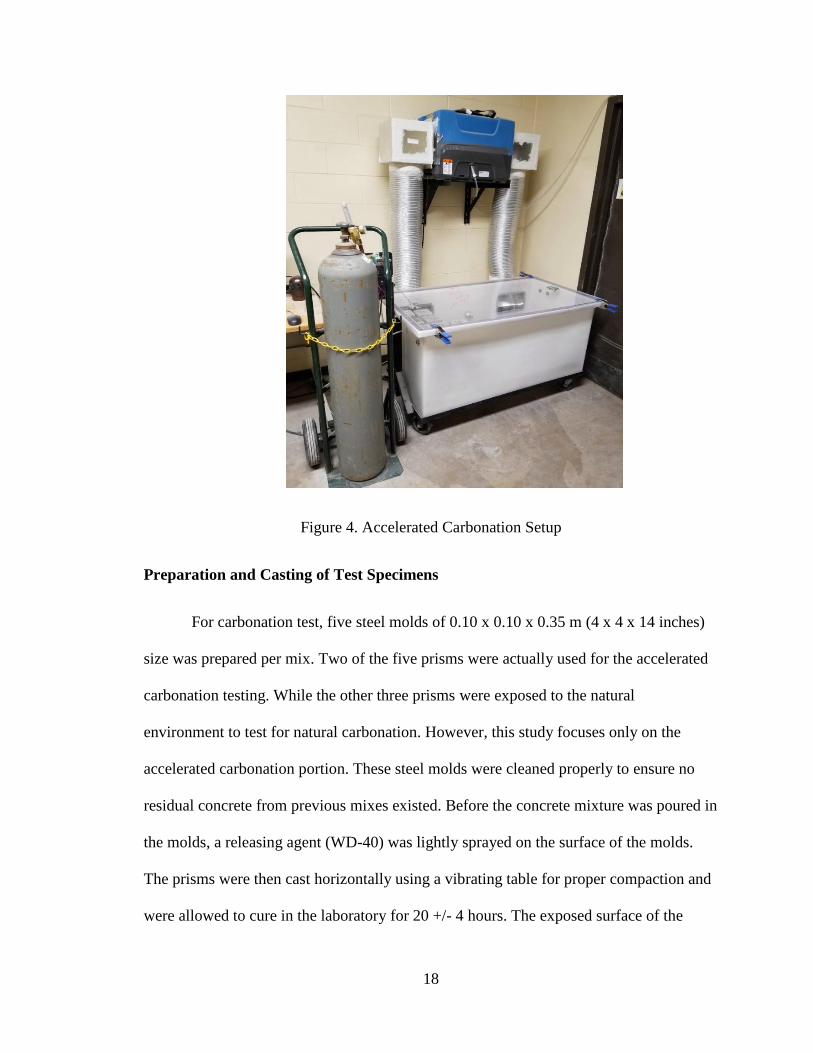
18
Figure 4. Accelerated Carbonation Setup
Preparation and Casting of Test Specimens
For carbonation test, five steel molds of 0.10 x 0.10 x 0.35 m (4 x 4 x 14 inches)
size was prepared per mix. Two of the five prisms were actually used for the accelerated
carbonation testing. While the other three prisms were exposed to the natural
environment to test for natural carbonation. However, this study focuses only on the
accelerated carbonation portion. These steel molds were cleaned properly to ensure no
residual concrete from previous mixes existed. Before the concrete mixture was poured in
the molds, a releasing agent (WD-40) was lightly sprayed on the surface of the molds.
The prisms were then cast horizontally using a vibrating table for proper compaction and
were allowed to cure in the laboratory for 20 +/- 4 hours. The exposed surface of the

19
prism was covered with partially wet polythene to avoid drying. After sufficient time of
curing, the molds were stripped and one of the prisms (Day 1) was directly transferred to
the carbonation chamber while the other prism (Day 7) was immediately transferred into
a moist curing chamber with a temperature control of 23 +/- 2 °C. In case of compression
test, twelve 4 x 8 in. cylinders were cast per mix. Standard procedure according to ASTM
C31 were followed for making the specimens (ASTM International, 2019). These
cylinders were allowed to cure in the laboratory for 20 +/- 4 and were then demolded.
After demolding, the cylinders were transferred to the moist curing chamber and tested
after desired age of curing was obtained (2, 7, 28, and 90 days).
Carbonation Test
The prisms were removed from the moist curing chamber at an age of 1 and 7
days and were allowed to air dry in a controlled environment (23 °C, 50 to 65% RH) for a
minimum of 3 hours. The prisms were then vertically placed into the carbonation
chamber with CO2 level of 4.0 +/- 0.5% by volume, temperature of 23 +/- 2 °C and
relative humidity (RH) of 57 +/- 5%. The ages of measuring carbonation depth were 28,
56, 63, 70, and 105 days after placing them in the carbonation chamber. For measuring
the carbonation depth, a slice of approximately 50 mm thick was broken off the prism at
each stage of testing with a mechanical cutting machine shown in Figure 5.
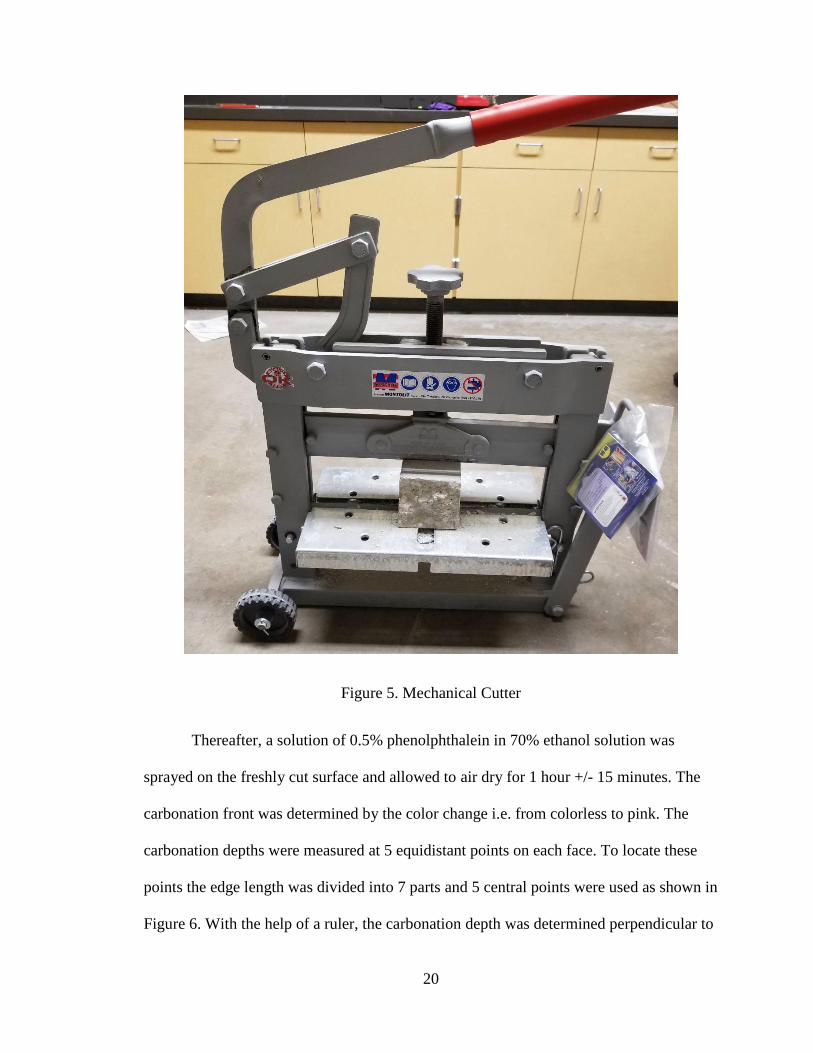
20
Figure 5. Mechanical Cutter
Thereafter, a solution of 0.5% phenolphthalein in 70% ethanol solution was
sprayed on the freshly cut surface and allowed to air dry for 1 hour +/- 15 minutes. The
carbonation front was determined by the color change i.e. from colorless to pink. The
carbonation depths were measured at 5 equidistant points on each face. To locate these
points the edge length was divided into 7 parts and 5 central points were used as shown in
Figure 6. With the help of a ruler, the carbonation depth was determined perpendicular to

21
the surface of the prism with a precision of 0.5 mm. This procedure was repeated on the
four faces to yield 20 measurement points. The mean depth is calculated and recorded for
each face and the arithmetical average is calculated for the entire specimen.
Figure 6. Carbonation Depth Recording Method
Compression Test
Compressive strength testing of concrete is a common quality control procedure
to ensure that the concrete is hydrating properly, and that strength is gained at the
necessary rate. In this research, it was also important to characterize and evaluate what
influence the strength development plays in regards accelerated carbonation resistance for
each mixture, especially those with high fly ash replacement (i.e., 50% fly ash). Concrete
cylinders (4x8 in.) were cast for the evaluating the compressive strength. Cylinders were

22
moist cured under wet-burlap for 24 hours after which they were placed in a moist curing
room (100% RH at 23 +/- 3C) until they were to be tested. Compression test was
performed at curing ages of 2, 7, 28, and 90 days according to ASTM C39 (ASTM
International, 2018).

23
IV. RESULTS AND DISCUSSION
Compression Test
Control mixtures were observed to have higher initial compressive strength (2 and
7 days curing) as compared with mixes containing SCMs. From Figure 7, 8 and 9 it can
be observed that Class C fly ash yielded higher strengths in comparison with class F fly
ash. The strength development of class C fly ash specimens is initially slower but
achieves greater strength at later ages (90 days). The optimum replacement level of class
C fly ash is 30% in terms of compressive strength. While in case of class F fly ash, 15%
is the maximum replacement level that yields better strength when compared with control
at an age of 90 days however, high strength could be observed at later ages with
continued hydration and strength development. From the results, it can be deduced that
0.45 w/cm ratio yields better strength as compared to 0.50 w/cm.
Figure 7. Compressive Strength of Class C Fly Ash (310 kg/m3 and 0.50 w/cm)

24
Figure 8. Compressive Strength of Class F Fly Ash (310 kg/m3 and 0.50 w/cm)
Figure 9. Compressive Strength Comparison of Class C & F Fly Ash (340 kg/m3 and 0.45
w/cm)

25
Accelerated Carbonation Test
Assessment based on type of fly ash
Figure 10 and 11 demonstrates the carbonation patterns for specimens consisting
class C fly ash at 0.50 w/cm ratio of moist cured for 1 and 7 days respectively. Based on
the information obtained from both the graphs, the control mixture has more resistance
against carbonation as compared with class C fly ash. It can be also observed that
carbonation depth increases with increase in fly ash dosage. 50% class C fly ash
replacement has a detrimental effect as the specimens are completely carbonated at later
ages of testing. Similarly, Figure 12 and 13 signifies the effect of carbonation on class F
fly ash specimens moist cured for 1 and 7 days respectively. A similar pattern can be
observed as class C fly ash, indicating an increase in carbonation with increase in
quantity of class F fly ash. However, the rate of CO2 ingress in class F fly ash specimens
is more rapid as compared with class C fly ash specimens.
It can be clearly inferred that class C fly ash is more resistant against carbonation
as compared with class F fly ash at a given fly ash replacement percentage. This pattern
was observed in majority of the cases at different cementitious content and w/cm ratios.
The reason for this can be due to the higher calcium oxide (CaO) content present in the
chemical composition of class C fly ash acting a buffer capacity for reducing the rate at
which carbonation progress.

26
Figure 10. Comparison of Class C Fly Ash Specimens with Control (1-day curing)
Figure 11. Comparison of Class C Fly Ash Specimens with Control (7-days curing)

27
Figure 12. Comparison of Class F Fly Ash Specimens with Control (1-day curing)
Figure 13. Comparison of Class F Fly Ash Specimens with Control (7-days curing)

28
Assessment based on moist curing
It was also observed that specimens with 1-day moist curing are more prone to
carbonation ingress as compared with 7-day moist curing specimens. Figure 14 highlights
the specimens with 0.45 w/cm ratio and 340 kg/m3 cementitious content and it evident
that longer moist curing period helps the concrete to improve resistance against
carbonation. Figure 15 and 16 describes the effect of 1-day and 7-days moist curing on
both class C and class F fly ash at different cementitious material concentrations.
Several such cases we tested, and it can be clearly inferred that specimens with 1-
day moist curing highlights more carbonation depth as compared to specimens with 7
days of moist curing regardless of w/cm ratio or cementitious materials content.
Figure 14. Comparison between 1-day and 7-days Curing for Control

29
Figure 15. Comparison between 1-day and 7-days Curing for Class C Fly Ash
Figure 16. Comparison between 1-day and 7-days Curing for Class F Fly Ash
30
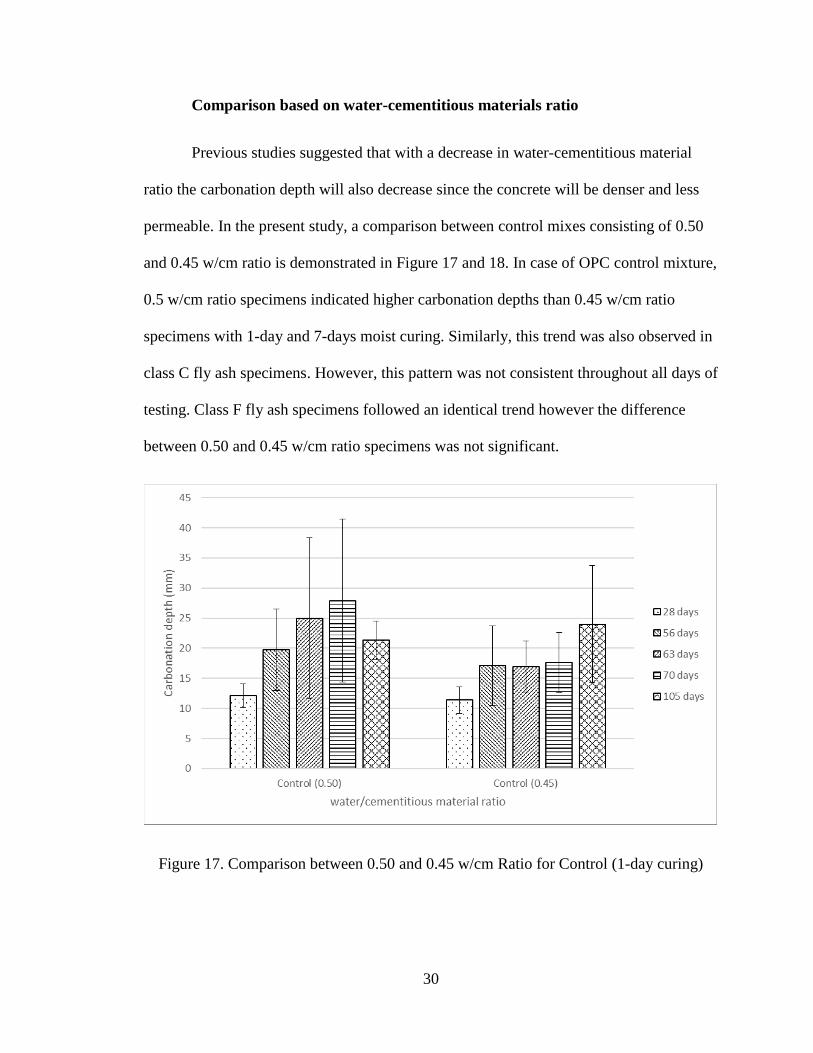
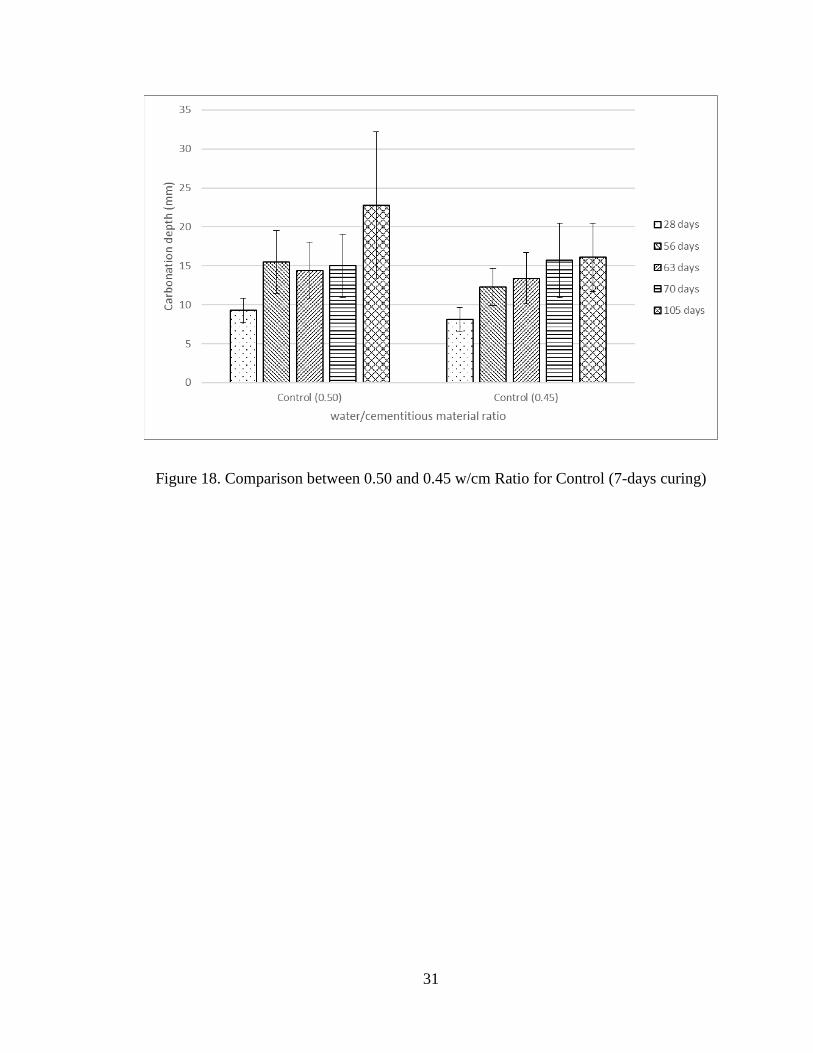
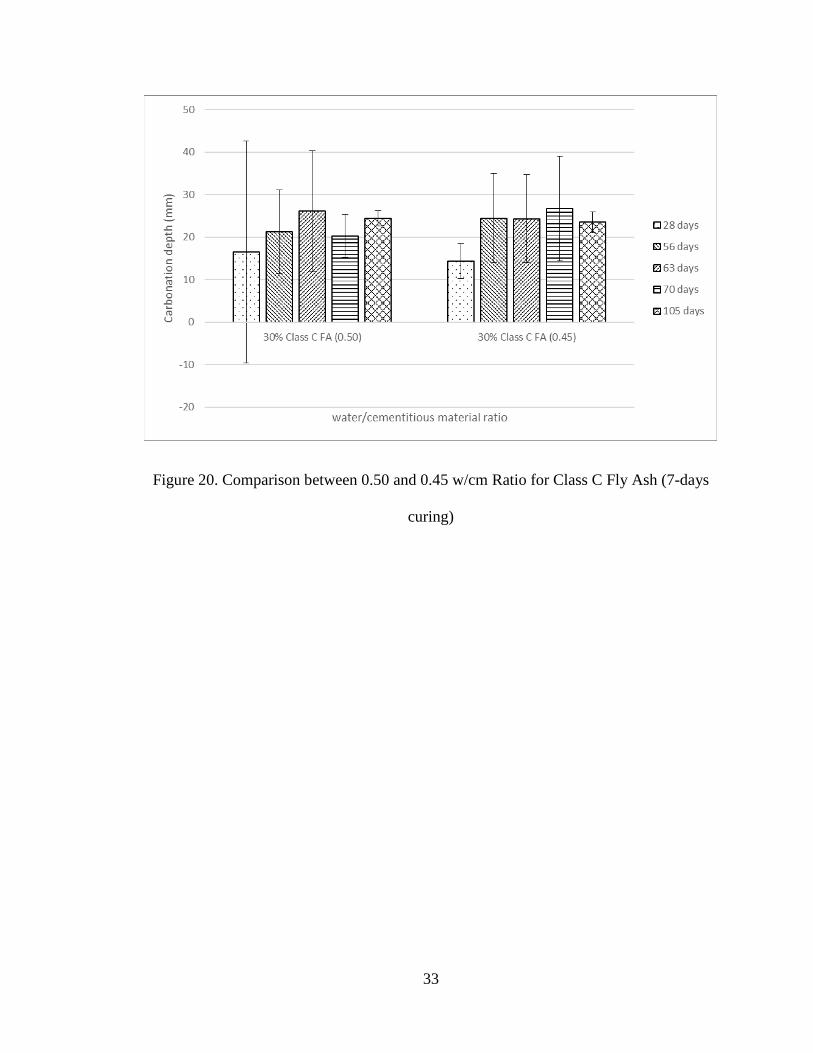
Comparison based on water-cementitious materials ratio
Previous studies suggested that with a decrease in water-cementitious material
ratio the carbonation depth will also decrease since the concrete will be denser and less
permeable. In the present study, a comparison between control mixes consisting of 0.50
and 0.45 w/cm ratio is demonstrated in Figure 17 and 18. In case of OPC control mixture,
0.5 w/cm ratio specimens indicated higher carbonation depths than 0.45 w/cm ratio
specimens with 1-day and 7-days moist curing. Similarly, this trend was also observed in
class C fly ash specimens. However, this pattern was not consistent throughout all days of
testing. Class F fly ash specimens followed an identical trend however the difference
between 0.50 and 0.45 w/cm ratio specimens was not significant.
Figure 17. Comparison between 0.50 and 0.45 w/cm Ratio for Control (1-day curing)
31
Figure 18. Comparison between 0.50 and 0.45 w/cm Ratio for Control (7-days curing)

32
Figure 19. Comparison between 0.50 and 0.45 w/cm Ratio for Class C Fly Ash (1-day
curing)
33
Figure 20. Comparison between 0.50 and 0.45 w/cm Ratio for Class C Fly Ash (7-days
curing)

34
Figure 21. Comparison between 0.50 and 0.45 w/cm Ratio for Class F Fly Ash (1-day
curing)

35
Figure 22. Comparison between 0.50 and 0.45 w/cm Ratio for Class F Fly Ash (7-days
curing)
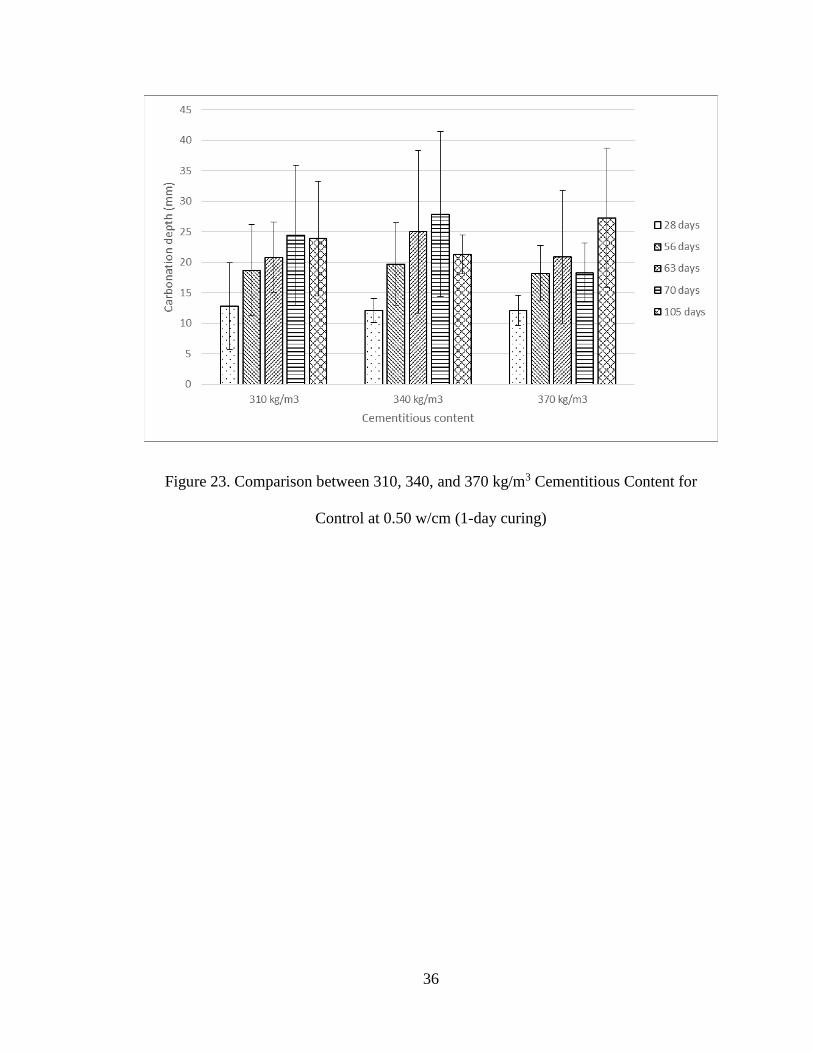
Comparison based on amount of cementitious material
A comparison between different cementitious contents was made at a given w/cm
ratio and fly ash replacement. Figure 23 and 24 indicate the comparison between
specimens consisting of 310, 340 and 400 kg/m3 at 0.50 w/cm ratio with 1 and 7 days of
moist curing respectively. These results indicated no significant differences between the
carbonation depths. Since the difference is very small, it is difficult to establish any
specific pattern from the results. However, in case of class C and class F fly ash concrete
specimens a general trend can be observed that higher cementitious content specimens
have more resistance against carbonation.
36
Figure 23. Comparison between 310, 340, and 370 kg/m3 Cementitious Content for
Control at 0.50 w/cm (1-day curing)

37
Figure 24. Comparison between 310, 340, and 370 kg/m3 Cementitious Content for
Control at 0.50 w/cm (7-days curing)

38
Figure 25. Comparison between 340 and 400 kg/m3 Cementitious Content for Class C Fly
Ash at 0.45 w/cm (1-day curing)
39
Figure 26. Comparison between 340 and 400 kg/m3 Cementitious Content for Class C Fly
Ash at 0.45 w/cm (7-days curing)

40
Figure 27. Comparison between 340 and 400 kg/m3 Cementitious Content for Class F Fly
Ash at 0.5 w/cm (1-day curing)

41
Figure 28. Comparison between 340 and 370 kg/m3 Cementitious Content for Class F Fly
Ash at 0.5 w/cm (7-days curing)
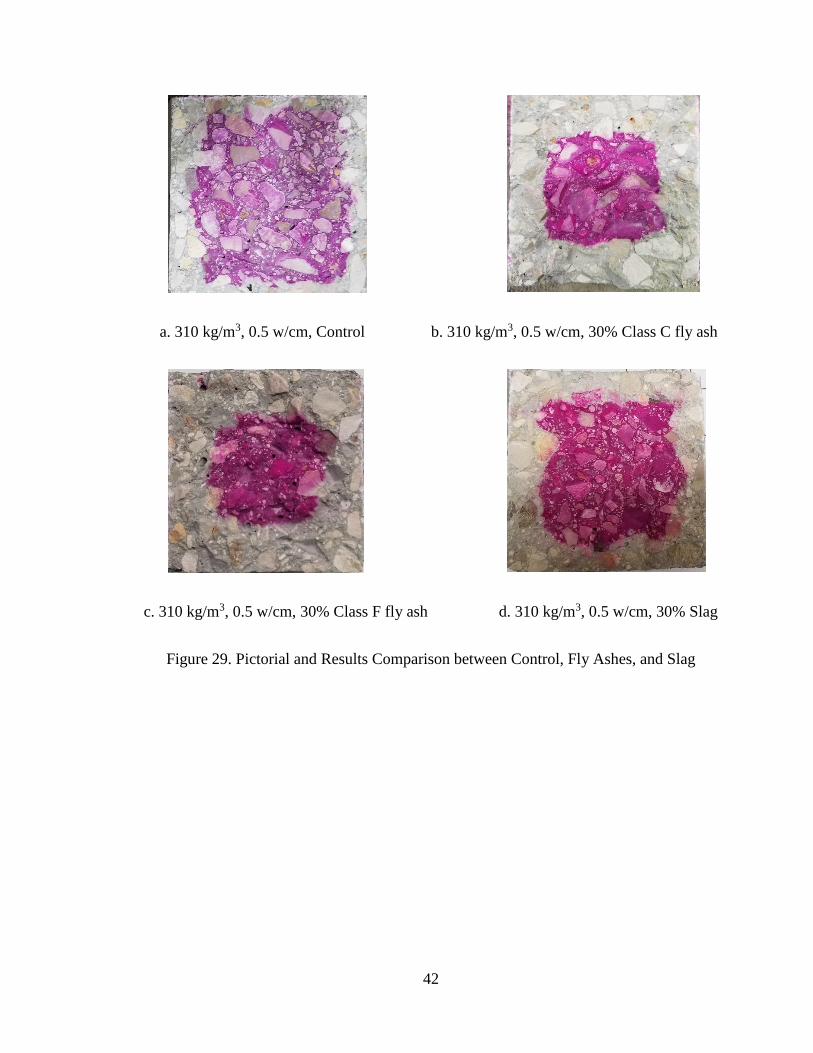
Comparison between Slag and Fly Ash
Lastly, GGBFS was also briefly tested for carbonation with replacement levels of
30 and 50% for cementitious content of 310 kg/m3 and 0.5 w/cm ratio. It was observed
that GGBFS offered more resistance against carbonation at given replacement levels as
compared with both types of fly ash at the given replacement levels as represented below
in Figure 29.
42
a. 310 kg/m3, 0.5 w/cm, Control b. 310 kg/m3, 0.5 w/cm, 30% Class C fly ash
c. 310 kg/m3, 0.5 w/cm, 30% Class F fly ash d. 310 kg/m3, 0.5 w/cm, 30% Slag
Figure 29. Pictorial and Results Comparison between Control, Fly Ashes, and Slag

43
Table 4. Carbonation Depth Comparison between Control, 30% Class C & F Fly Ash,
and 30% Slag
Control 30% Class C 30% Class F 30% Slag
1 d
(mm)
7 d
(mm)
1 d
(mm)
7 d
(mm)
1 d
(mm)
7 d
(mm)
1 d
(mm)
7 d
(mm)
28 d 12.8 7.0 20.8 13.9 23.3 23.5 18.8 10.8
56 d 18.7 11.4 30 24.4 41.6 24.6 21.6 16.4
63 d 20.8 21.6 32.3 23.4 38.9 28.2 25.4 16.2
70 d 24.1 13.3 36.2 24.7 38.3 32.1 23.3 18.2
105 d 23.9 21.4 40.1 28.8 70 41.3 26.3 17.1
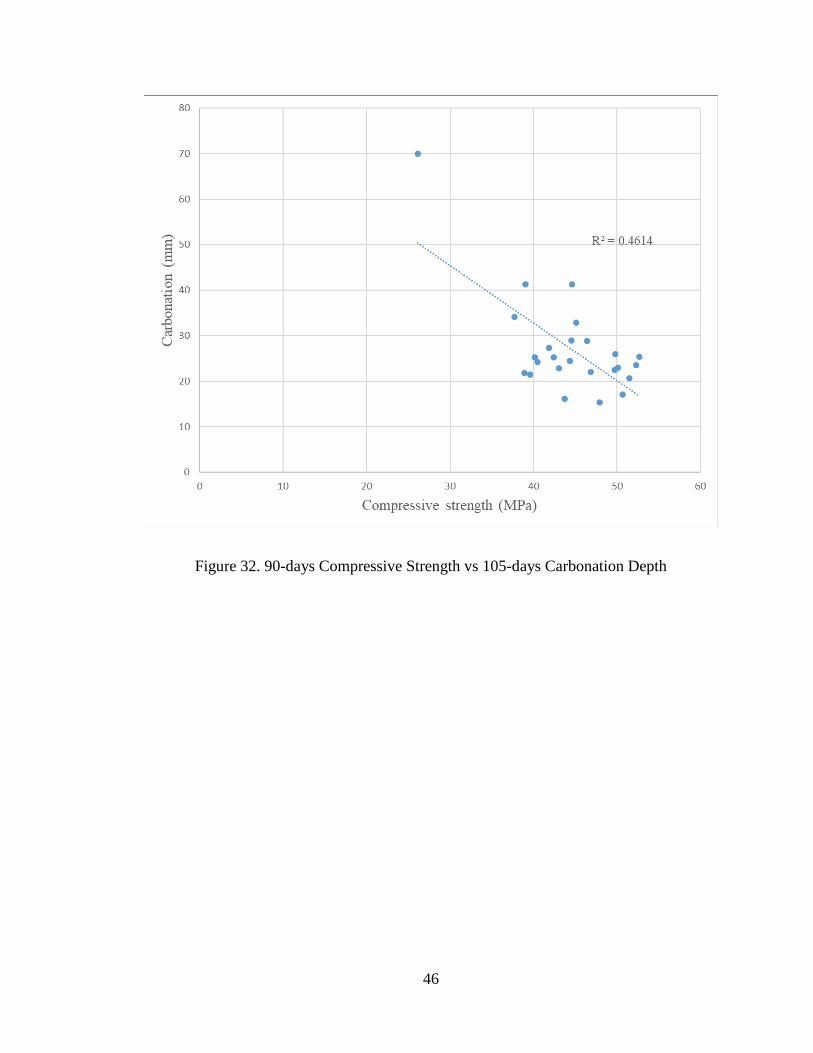
Correlation between Compressive Strength and Carbonation
Several previous studies have established a correlation between compressive
strength and depth of carbonation. Researchers claim that with an increase in
compressive strength, the depth of carbonation decreases. A comparison between 2 days
compressive strength and 28 days carbonation is demonstrated in Figure 30. It
demonstrates a correlation between carbonation and compressive strength, and it can be
inferred that with increase in compressive strength, carbonation decreases. However, no
such correlation can be observed, and it cannot be said that greater compressive strength
specimens offer better resistance against carbonation. Further, the correlation between
28-days compressive strength verses 105-days carbonation depths and 90-days
compressive strength verses 105-days carbonation depths are shown in Figure 31 and 32

44
respectively. It can be concluded that this correlation gets weaker and weaker as the
curing time for compression and carbonation increases.
Figure 30. 2-days Compressive Strength vs 28-days Carbonation Depth

45
Figure 31. 28-days Compressive Strength vs 105-days Carbonation Depth
46
Figure 32. 90-days Compressive Strength vs 105-days Carbonation Depth

47
V. CONCLUSIONS AND RECOMMENDATIONS
The following conclusions can be drawn from the present study.
1. Regardless of the type of fly ash used, the depth of accelerated carbonation
increased with an increase in fly ash content. Class C fly ash was more resistant
against the threat of carbonation as compared to class F fly ash.
2. GGBFS offers greater resistance against carbonation at a given replacement
percentage as compared with both types of fly ash. Additionally, it also yields
greater compressive strengths (7, 28, and 90 d) as compared to class C, class F fly
ash and control mix.
3. The depth of accelerated carbonation decreased as the moist curing period
increased from 1 to 7 days.
4. Accelerated carbonation was decreased with a decrease in water-cementitious
material ratio from 0.5 to 0.45 in case of control mixes. However, no clear pattern
was observed in case of fly ash concrete mixes.
5. Cementitious content did not seem to affect the carbonation severely and no fixed
pattern can be determined from the results for control mixes. In case of class C
and class F fly ashes, increase in cementitious content seemed to have a positive
effect against carbonation.
6. Better compressive strength results were obtained with mixtures containing SCMs
at 0.45 w/cm ratio as compared to 0.5 w/cm ratio at a given cementitious content.

48
The following future recommendations are proposed.
1. Accelerated carbonation results can be compared with natural carbonation and a
model can be established to relate the two methods.
2. Future studies can explore the results at different relative humidity and at different
CO2 concentrations.
3. GGBFS resistance against carbonation was observed to be better as compared to
fly ash in this study. A detailed investigation with GGBFS used as a SCM can be
useful information.
4. Effect of moist curing was clearly evident in this study. Future researchers can
investigate this effect at extended moist curing periods along with different w/cm
ratios.

49
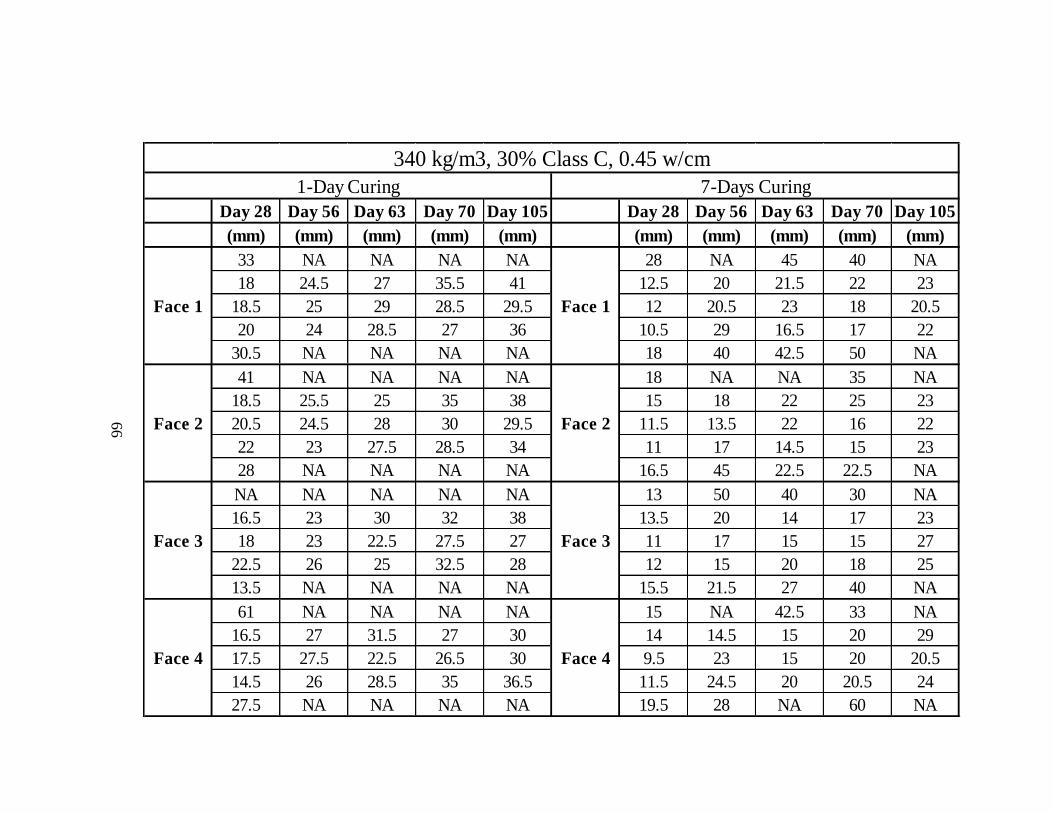
APPENDIX SECTION
Carbonation Results
Day 28 Day 56 Day 63 Day 70 Day 105 Day 28 Day 56 Day 63 Day 70 Day 105
(mm) (mm) (mm) (mm) (mm) (mm) (mm) (mm) (mm) (mm)
10.5 40.5 38.5 43.5 57.5 7 13 29 16 21
10.5 14.5 17.5 17 25 6.5 10.5 17 14 16
8 15.5 16 15.5 22 7.5 8 15 12.5 20
9.5 12.5 14.5 16.5 20 8 7 17.5 11 17
40 33 27 31.5 NA 8.5 11.5 34 17 25
12.5 25 24 23.5 NA 11.5 14 38.5 19.5 43
17 15 17.5 17 20.5 5.5 10 19.5 19 15
8 15.5 23 17.5 24.5 6 9 14.5 18.5 14.5
10 12.5 21.5 22 21.5 8.5 11.5 11 11.5 17
13 26 22 56 23 4.5 10 19.5 11 20
9 21 19 45.5 20 5.5 9 29.5 10 25
11 11 18 20.5 18.5 8 15 13 12.5 17.5
6 9.5 17.5 20.5 18 5 11 11 9 18
7 19 14 17 16.5 4 10.5 17.5 7 20
16.5 20 30.5 18.5 35 8 16.5 41 16.5 22.5
18 19.5 22 20.5 24.5 7 10.5 18 16 45
14.5 12.5 15.5 14 17 3 13 17 8 13.5
9.5 13 17 15 19 9.5 15 14.5 11.5 12.5
10 18.5 19 20.5 24 8 7.5 12.5 11 15
16 19.5 22 35.5 NA 8 15 42 14.5 30
310 kg/m3, Control, 0.5 w/cm
1-Day Curing 7-Days Curing
Face 1
Face 2
Face 3
Face 4
Face 1
Face 2
Face 3
Face 4
50
Day 28 Day 56 Day 63 Day 70 Day 105 Day 28 Day 56 Day 63 Day 70 Day 105
(mm) (mm) (mm) (mm) (mm) (mm) (mm) (mm) (mm) (mm)
11 NA NA NA NA 11 20 14 39.5 44
15 22 25.5 26 27 11.5 20.5 15.5 17.5 24
13.5 22 22.5 21.5 23.5 10.5 17 13 24.5 17.5
14.5 20.5 23 24 31 9.5 15.5 10 21.5 23.5
26 NA NA NA NA 9 18.5 24.5 33 NA
14.5 NA NA NA NA 9.5 31 18.5 17.5 NA
14.5 23 23 24 33 8 14 15 17 31
19 22.5 24.5 24.5 29 8.5 14.5 9.5 17 21.5
16.5 26 21.5 21 32.5 9 15 11 16.5 25
18.5 NA NA NA NA 10 17 13 19 58.5
15.5 NA NA NA NA 9 12 12 NA NA
13 26 23 28 33 8.5 11.5 11 17 25
19.5 17.5 21.5 29 28 7 9.5 10 18 22
17 19.5 23 29.5 31.5 8.5 10.5 11.5 15.5 21
19 NA NA NA NA 11.5 13 16.5 35 42
15.5 51.5 NA NA NA 11 15.5 17.5 33 NA
12.5 22 26 23.5 31.5 8 13.5 13 18 20
15 24.5 27 24 27.5 8.5 13.5 16 16 15
17 23.5 23.5 28 29.5 8 16.5 12.5 17 20
18.5 NA NA NA NA 9 21.5 15 23.5 NA
Face 2 Face 2
Face 3 Face 3
Face 4 Face 4
310 kg/m3, 15% Class C, 0.5 w/cm
1-Day Curing 7-Days Curing
Face 1 Face 1

51
Day 28 Day 56 Day 63 Day 70 Day 105 Day 28 Day 56 Day 63 Day 70 Day 105
(mm) (mm) (mm) (mm) (mm) (mm) (mm) (mm) (mm) (mm)
NA NA NA NA NA 17 20.5 NA NA NA
21.5 27 34 45.5 NA 11.5 19 18 24 24
20 25.5 27 30 42 12 17 16.5 18 20
22.5 31.5 30.5 40.5 NA 11.5 16 22.5 18.5 30
NA NA NA NA NA 16 NA NA NA NA
NA NA NA NA NA 15.5 27 64.5 NA NA
18.5 33.5 29.5 38 NA 15 18 18.5 21 29
17.5 31.5 31 33 41.5 15 21 20 22 28.5
18.5 30.5 33 31.5 40 10.5 22 21.5 20.5 30
NA NA NA NA NA 11 38 NA 68.5 NA
NA NA NA NA NA 13 NA NA NA NA
22 31 35.5 NA NA 14.5 21 14.5 21 40
21 29 31 34.5 39 14 18 22 19.5 28
24 28 38 38.5 NA 14 17.5 19.5 19 30
NA NA NA NA NA 17 60.5 NA NA NA
NA NA NA NA NA 14.5 27.5 NA 25.5 NA
19.5 31.5 34.5 39 NA 17 17.5 19.5 23 25
21 31.5 30.5 30 38 14 17.5 17 22 31.5
23 29 33.5 38 NA 12 16 17.5 23.5 30
NA NA NA NA NA 13 46 35.5 NA NA
310 kg/m3, 30% Class C, 0.5 w/cm
1-Day Curing 7-Days Curing
Face 1 Face 1
Face 2 Face 2
Face 3 Face 3
Face 4 Face 4

52
Day 28 Day 56 Day 63 Day 70 Day 105 Day 28 Day 56 Day 63 Day 70 Day 105
(mm) (mm) (mm) (mm) (mm) (mm) (mm) (mm) (mm) (mm)
NA NA NA NA NA NA NA NA NA NA
35.5 NA NA NA NA 18 25 30 28 NA
26 53.5 NA NA NA 15.5 23 25.5 26.5 30
29.5 NA NA NA NA 20.5 26 28 32.5 45
NA NA NA NA NA NA NA NA NA NA
NA NA NA NA NA 43 NA NA NA NA
31 NA NA NA NA 20.5 30 27.5 30 45
28.5 NA NA NA NA 17.5 27.5 29.5 32.5 40
32 NA NA NA NA 18.5 37.5 30.5 35.5 45
NA NA NA NA NA NA NA NA NA NA
NA NA NA NA NA NA NA NA NA NA
33.5 NA NA NA NA 21 36 31 40 40
27.5 46 NA NA NA 19.5 29 26.5 32 35
34 NA NA NA NA 21 33.5 32.5 32.5 NA
NA NA NA NA NA 51.5 NA NA NA NA
NA NA NA NA NA NA NA NA NA NA
34 NA NA NA NA 21.5 34 33 30 50
29 NA NA NA NA 18 26.5 28.5 28.5 42.5
33.5 NA NA NA NA 18.5 33.5 30.5 27 40
NA NA NA NA NA 22.5 NA NA NA NA
Face 1 Face 1
Face 2 Face 2
Face 3 Face 3
Face 4 Face 4
1-Day Curing 7-Days Curing
310 kg/m3, 50% Class C, 0.5 w/cm

53
Day 28 Day 56 Day 63 Day 70 Day 105 Day 28 Day 56 Day 63 Day 70 Day 105
(mm) (mm) (mm) (mm) (mm) (mm) (mm) (mm) (mm) (mm)
31.5 NA NA NA NA 11.5 25.5 38 59 NA
17.5 25.5 27.5 32 50 8.5 15.5 16 18 27.5
14 24 27 29 35 9.5 14 14.5 16 23
16.5 26 32 30.5 50 9.5 17.5 15 17.5 22
29 NA NA NA NA 15.5 18 47 41 NA
23.5 NA NA NA NA 14.5 28.5 28 37 NA
15.5 24.5 32 31 40 9.5 10.5 18 21.5 23
14 25 23 25.5 30 14 26.5 15.5 15.5 24
15 22 23.5 36 28 15 16 17.5 18 30
21 NA NA NA NA 9 19 20 18.5 NA
33 NA NA NA NA 14 22 44.5 41 NA
13 26.5 20.5 36.5 33.5 15.5 13.5 17.5 18.5 28
14.5 23.5 21.5 26.5 32.5 9.5 14 16 15 27
15.5 21.5 29 23.5 40 12.5 14 14 17 25
24 NA NA NA NA 9.5 16.5 10 22 NA
20.5 NA NA NA NA 5 13 15 42 NA
15 23.5 24 23 45 10.5 14 14.5 18.5 25
14.5 22.5 22 21.5 34 8.5 13.5 17 20.5 24.5
15 22.5 28.5 27 38 11 14 17 19.5 25
29.5 NA NA NA NA 11.5 14.5 19.5 32 NA
Face 2 Face 2
Face 3 Face 3
Face 4 Face 4
Face 1 Face 1
310 kg/m3, 15% Class F, 0.5 w/cm
1-Day Curing 7-Days Curing

54
Day 28 Day 56 Day 63 Day 70 Day 105 Day 28 Day 56 Day 63 Day 70 Day 105
(mm) (mm) (mm) (mm) (mm) (mm) (mm) (mm) (mm) (mm)
NA NA NA NA NA 57.5 NA NA NA NA
24.5 NA NA NA NA 20 24 32 34.5 NA
22.5 33.5 38 39 NA 14.5 20.5 26.5 34 40
24 51.5 NA NA NA 15 24.5 30.5 34 NA
NA NA NA NA NA 24.5 NA NA NA NA
NA NA NA NA NA 24 NA NA NA NA
24 NA NA NA NA 15.5 25 31.5 37 NA
20.5 46.5 35.5 36 NA 16 25.5 28 28 37.5
21 NA NA NA NA 19.5 22.5 31 40 NA
NA NA NA NA NA 31.5 NA NA NA NA
NA NA NA NA NA 26 NA NA NA NA
24.5 48.5 NA NA NA 17 23.5 23.5 37.5 NA
22.5 34.5 46.5 40 NA 16.5 21.5 26 29.5 50
28 NA NA NA NA 14.5 29.5 29.5 27 NA
NA NA NA NA NA 28.5 NA NA NA NA
NA NA NA NA NA 34.5 NA NA NA NA
24 NA NA NA NA 16 26.5 30.5 28 NA
20.5 38 35.5 38 NA 21 24 23.5 26.5 37.5
24 39 NA NA NA 19 28.5 26 29 NA
NA NA NA NA NA 39.5 NA NA NA NA
310 kg/m3, 30% Class F, 0.5 w/cm
1-Day Curing 7-Days Curing
Face 1 Face 1
Face 2 Face 2
Face 3 Face 3
Face 4 Face 4

55
Day 28 Day 56 Day 63 Day 70 Day 105 Day 28 Day 56 Day 63 Day 70 Day 105
(mm) (mm) (mm) (mm) (mm) (mm) (mm) (mm) (mm) (mm)
NA NA NA NA NA NA NA NA NA NA
NA NA NA NA NA 39.5 NA NA NA NA
47 NA NA NA NA 32 NA NA NA NA
NA NA NA NA NA 37.5 NA NA NA NA
NA NA NA NA NA NA NA NA NA NA
NA NA NA NA NA NA NA NA NA NA
NA NA NA NA NA 40 NA NA NA NA
41 NA NA NA NA 29.5 NA NA NA NA
NA NA NA NA NA 36 NA NA NA NA
NA NA NA NA NA NA NA NA NA NA
NA NA NA NA NA NA NA NA NA NA
NA NA NA NA NA 44.5 NA NA NA NA
39.5 NA NA NA NA 31 NA NA NA NA
NA NA NA NA NA 31.5 NA NA NA NA
NA NA NA NA NA NA NA NA NA NA
NA NA NA NA NA NA NA NA NA NA
NA NA NA NA NA 32.5 NA NA NA NA
45 NA NA NA NA 29.5 NA NA NA NA
NA NA NA NA NA 38 NA NA NA NA
NA NA NA NA NA NA NA NA NA NA
Face 1 Face 1
Face 2 Face 2
Face 3 Face 3
Face 4 Face 4
1-Day Curing 7-Days Curing
310 kg/m3, 50% Class F, 0.5 w/cm

56
Day 28 Day 56 Day 63 Day 70 Day 105 Day 28 Day 56 Day 63 Day 70 Day 105
(mm) (mm) (mm) (mm) (mm) (mm) (mm) (mm) (mm) (mm)
27 NA NA NA NA 10 16 17 45 NA
12.5 23 30.5 25 25 12 16.5 16 14.5 15
9.5 18 22.5 27 20 13.5 18 16 18.5 15
17.5 17.5 24 21.5 30 17 16 13 13 16.5
31.5 NA NA NA NA 11 19.5 31 21.5 NA
21 NA NA NA NA 13 23 31.5 47 NA
14.5 19 25 20.5 35 12 15 17 15 20
11 18.5 30.5 21 29.5 10.5 16 19.5 16 15
17 21 24 26 27.5 12 13 12 14.5 17.5
18.5 NA NA NA NA 8.5 14.5 11 10 25
18 NA NA NA NA 12 27.5 12.5 15 NA
17.5 21.5 28 25.5 22.5 8.5 14.5 16 13 20
17 24.5 27 24.5 24 8.5 13 14 10.5 9.5
18 27.5 22 25 30 10 16 16.5 15 5.5
22.5 NA NA NA NA 10.5 15.5 10.5 12 NA
20.5 NA NA NA NA 9.5 19 13 14.5 20
24 24.5 24 23.5 25 11 15.5 15 15 20
18 22.5 21.5 19.5 25 8 13 12 16.5 25
17 22 25.5 21 22.5 8.5 14 13.5 17 15
23 NA NA NA NA 10.5 11.5 16 20 NA
Face 2 Face 2
Face 3 Face 3
Face 4 Face 4
Face 1 Face 1
310 kg/m3, 30% Slag, 0.5 w/cm
1-Day Curing 7-Days Curing

57
Day 28 Day 56 Day 63 Day 70 Day 105 Day 28 Day 56 Day 63 Day 70 Day 105
(mm) (mm) (mm) (mm) (mm) (mm) (mm) (mm) (mm) (mm)
41 63.5 NA NA NA 11 15 20 26 30
20.5 24.5 30 28 60 11.5 12.5 16 17 21
19 26 27 24.5 30 11 17.5 18 17.5 20
19.5 28 24 35 50 13.5 14 17.5 17.5 17.5
50.5 62.5 NA NA NA 12 28.5 27.5 28.5 30
NA NA NA NA NA 15.5 26 29 19.5 21
20 22 28.5 34 40 11.5 8 9 17.5 15
16 20 18 28 35 7.5 10 14.5 14 20
19.5 17 20 24 35 3 16.5 9.5 14 20
33.5 NA NA NA NA 13 27 16 11.5 30
43.5 29.5 NA NA NA 14.5 36.5 13 14.5 32
16 22 20.5 25.5 35 10.5 16 11 13 14
19 28 20 27 27.5 10 12 13 16.5 15
17.5 21 27 25 20 15.5 13.5 13.5 13.5 16
46.5 38 NA NA NA 10.5 26 13 25 12
23.5 NA NA NA NA 9.5 23.5 15 22.5 20
17.5 21.5 18 28 30 9 14.5 15.5 18 15
15.5 25 20 26 40 9 11.5 17 18.5 20
18.5 21 26.5 30.5 35 7.5 9 16.5 22.5 15
NA NA NA NA NA 9 17.5 25 27 30
Face 3 Face 3
Face 4 Face 4
310 kg/m3, 50% Slag, 0.5 w/cm
1-Day Curing 7-Days Curing
Face 1 Face 1
Face 2 Face 2

58
Day 28 Day 56 Day 63 Day 70 Day 105 Day 28 Day 56 Day 63 Day 70 Day 105
(mm) (mm) (mm) (mm) (mm) (mm) (mm) (mm) (mm) (mm)
13 24.5 41 58 NA 8.5 11 18.5 23 40
11.5 14.5 17 17.5 15 10 14 8 13 15
11 17 16.5 17 18.5 7 12.5 12.5 10.5 15
14 14.5 18 17 21.5 8 13 12.5 10.5 15
16.5 36.5 25.5 41 NA 7.5 18.5 22 21 30
16.5 31.5 27.5 44 NA 11 23 19.5 24 30
10.5 19.5 20.5 19.5 25 8.5 12.5 11.5 12 16
12 17 24 21 20 8 14 15.5 13.5 13.5
10 16 18 17 22.5 8 14 12 16.5 15.5
11.5 24 22 36 NA 12 18.5 11 13.5 20
13.5 23 71 59 NA 9 22 14.5 15 40
13 13 18 20.5 25 8 12 15 10.5 16
11.5 18 17 15.5 23 10.5 12.5 14 15.5 14.5
11 13.5 15.5 17.5 25 10.5 10 9.5 10.5 20
12 28 46 40.5 NA 8.5 21 15 13.5 35
8.5 21 28.5 25.5 NA 12.5 23 18 11.5 40
11 12.5 19.5 20 22 11.5 14 12.5 15.5 18
11.5 12 11.5 20 21.5 9.5 11.5 12 15 15
13 12 17.5 19 16 9 15 14 13.5 19.5
10.5 25.5 24.5 33 NA 7.5 17.5 20.5 21 28
340 kg/m3, Control, 0.5 w/cm
1-Day Curing 7-Days Curing
Face 1 Face 1
Face 2 Face 2
Face 3 Face 3
Face 4 Face 4

59
Day 28 Day 56 Day 63 Day 70 Day 105 Day 28 Day 56 Day 63 Day 70 Day 105
(mm) (mm) (mm) (mm) (mm) (mm) (mm) (mm) (mm) (mm)
38 NA NA NA NA 8.5 23 NA NA NA
18.5 27 26 29 41 9 15.5 18.5 17.5 23
19 25.5 25 27.5 34 10 14.5 18 20 23.5
18 26 27.5 31 47.5 9.5 18 16 14.5 29.5
61.5 NA NA NA NA 13 19 32 25 NA
NA NA NA NA NA 12 24 26 32.5 NA
19.5 24.5 27 29.5 46 11 17 16 19 25.5
20 29 25 28.5 29 130 19 20 18 25
15 24 27.5 28.5 34 12 19.5 20 17.5 22
12 NA NA NA NA 12.5 38 28.5 NA NA
14.5 NA NA NA NA 8 58.5 63.5 NA NA
16 26 22 27 34 11 16.5 15.5 21.5 23.5
17 21 20.5 25 30.5 6.5 13.5 17.5 28 24.5
14.5 22 21.5 33 44.5 9.5 15.5 18 16.5 23
15.5 NA NA NA NA 13.5 22 24 NA NA
17 NA NA NA NA 12.5 19.5 55 NA NA
15.5 23 22 30 39.5 10.5 17 18.5 13.5 25
16 23.5 22.5 25 33.5 10.5 18.5 18.5 18 24.5
19 23 23 28 36 9 18.5 20 18.5 24
NA NA NA NA NA 11.5 19 53 25 NA
Face 1 Face 1
Face 2 Face 2
Face 3 Face 3
Face 4 Face 4
1-Day Curing 7-Days Curing
340 kg/m3, 30% Class C, 0.5 w/cm

60
Day 28 Day 56 Day 63 Day 70 Day 105 Day 28 Day 56 Day 63 Day 70 Day 105
(mm) (mm) (mm) (mm) (mm) (mm) (mm) (mm) (mm) (mm)
72.5 NA NA NA NA 22 NA NA NA NA
21 61 46 NA NA 12 19 23 18.5 30.5
20 28.5 31 34.5 47.5 14 20 25 16.5 27.5
18 35.5 35 41 NA 14 20.5 25.5 17 34
NA NA NA NA NA 39 NA NA NA NA
NA NA NA NA NA 21 NA NA NA NA
20 34.5 38 55 NA 18.5 22 26.5 28 37
22 30.5 32 33 43.5 17.5 25 26 32 29
20.5 34 41 41 NA 14.5 26 25 30 37.5
61 NA NA NA NA 17.5 NA NA NA NA
NA NA NA NA NA 19.5 NA NA NA NA
22 33 38 NA NA 25.5 28.5 25.5 25.5 44
23 30.5 33 33 44.5 14 24.5 20 22.5 29.5
16.5 35 34 43 NA 18.5 24 23 23 37
NA NA NA NA NA 18.5 NA NA NA NA
28 NA NA NA NA 19 NA NA NA NA
17.5 36.5 33.5 40.5 NA 17 24 27 25.5 46
20 40 31 34.5 46 15.5 19.5 21.5 22.5 27
21.5 35 48 39.5 NA 12.5 21.5 24.5 24 30
NA NA NA NA NA 19.5 NA NA NA NA
Face 2 Face 2
Face 3 Face 3
Face 4 Face 4
Face 1 Face 1
340 kg/m3, 30% Class F, 0.5 w/cm
1-Day Curing 7-Days Curing

61
Day 28 Day 56 Day 63 Day 70 Day 105 Day 28 Day 56 Day 63 Day 70 Day 105
(mm) (mm) (mm) (mm) (mm) (mm) (mm) (mm) (mm) (mm)
9.5 24.5 20 17 40.5 9.5 18 26 36.5 31
9 17 15.5 16.5 22 11 11.5 15 16 16
9.5 16.5 15 17.5 16.5 8.5 16.5 14.5 16.5 17.5
12 15.5 15.5 17.5 18.5 9 16 12 12.5 14
12 24.5 24.5 36.5 NA 7 17.5 15.5 25.5 49
12.5 32 33 NA 49 13.5 12.5 18 42 32
13.5 14 15 22 23.5 10 12 13 20 21
12 23.5 17 17.5 26 8 14 14 18.5 17.5
13 16 18 22 21.5 8.5 8 12.5 16.5 17
12 17 20.5 19 51.5 7.5 11 21 26.5 47
12 14 63.5 NA NA 10 14 17 58.5 37.5
12.5 14.5 15 17.5 21.5 9.5 13 11 8 15.5
11 15.5 17 14.5 18 8 14 11.5 14.5 13
8.5 14.5 17 16.5 16.5 9.5 15 14.5 13 17
15.5 18 22.5 15 35 9.5 13.5 37 21 35
19 15 25 16 37 11 13.5 28.5 22.5 27.5
14.5 17 18 16 20 9 14.5 21 17 20
9.5 16 13 15 16 10.5 15 12.5 17 17.5
10 17 12.5 17 18 9.5 19 16.5 21.5 17
14.5 22 20 16.5 41 10.5 20 22 55 43
370 kg/m3, Control, 0.5 w/cm
1-Day Curing 7-Days Curing
Face 1 Face 1
Face 2 Face 2
Face 3 Face 3
Face 4 Face 4

62
Day 28 Day 56 Day 63 Day 70 Day 105 Day 28 Day 56 Day 63 Day 70 Day 105
(mm) (mm) (mm) (mm) (mm) (mm) (mm) (mm) (mm) (mm)
19 NA NA NA NA 15 32.5 21 50 NA
13 18 23.5 20 26 10.5 13 17 17 19.5
15.5 17.5 20 21 26 14.5 17.5 16.5 21 19
12 14 23 21 23.5 14 18 18.5 18.5 22
15 51.5 NA NA NA 10.5 28 34 30 NA
17.5 NA NA NA NA 14 38 43 NA 57
13 21 19.5 21 26.5 10 13 18 17 24.5
14 18 20.5 20 25 9.5 13 16.5 16.5 22
15 18 23.5 25.5 25.5 13 13.5 16 20.5 23
14.5 NA NA NA NA 16 22.5 32.5 27.5 NA
14 35 NA NA NA 11 21 29 45 NA
17 23 20.5 25 26.5 10.5 14.5 17 15 22
14 19 20 18 24.5 8.5 16 10 14.5 21
17.5 17 23.5 26.5 24 10 12.5 14 25 21
15.5 NA NA NA NA 9.5 25 30 30 NA
18.5 NA NA NA NA 13.5 27.5 36.5 50 NA
13 22 27 25 30.5 14 16.5 17.5 17 20.5
16 21 20.5 25.5 29 12.5 15 15 18.5 20
15 20.5 23 27 30.5 15 15.5 14.5 18 20.5
23.5 NA NA NA NA 12 19 20.5 NA 26.5
Face 1 Face 1
Face 2 Face 2
Face 3 Face 3
Face 4 Face 4
1-Day Curing 7-Days Curing
370 kg/m3, 15% Class C, 0.5 w/cm

63
Day 28 Day 56 Day 63 Day 70 Day 105 Day 28 Day 56 Day 63 Day 70 Day 105
(mm) (mm) (mm) (mm) (mm) (mm) (mm) (mm) (mm) (mm)
59.5 NA NA NA NA 12 32 69.5 45 NA
16 22 27.5 28 32 12.5 17.5 22 18 23
16 25.5 22.5 26 27.5 11 18.5 20 17.5 22
15.5 24 29 27 46.5 14 17 19.5 20 23
41.5 NA NA NA NA 16 42 45 33.5 NA
22 NA NA NA NA 16.5 35 27 NA NA
17.5 26 29 27.5 43 12 18.5 20 20 24.5
16 20.5 28 24.5 32.5 12.5 17 18 25 24
14 21 25 25 34.5 8 16.5 20 16.5 20.5
17.5 46 NA NA NA 8 25.5 26.5 23.5 NA
18 NA NA NA NA 12 25 46.5 56 NA
12 20.5 25.5 27 35 14 15 13 25 17
13.5 17 19.5 22 28 10 14 12 15 19
14 21 22 27.5 30.5 10.5 16 18 21 19.5
19.5 NA NA NA NA 15.5 29.5 19 25 NA
21 48.5 NA NA NA 16 38 37.5 27 NA
13.5 20.5 20.5 27.5 28.5 11.5 15.5 20 28 21
23 23 25.5 22.5 28.5 6.5 15 18.5 15 24.5
18 23 26 22 31.5 8.5 17 22 25 23.5
44 NA NA NA NA 12.5 32 67 NA NA
Face 2 Face 2
Face 3 Face 3
Face 4 Face 4
Face 1 Face 1
370 kg/m3, 15% Class F, 0.5 w/cm
1-Day Curing 7-Days Curing

64
Day 28 Day 56 Day 63 Day 70 Day 105 Day 28 Day 56 Day 63 Day 70 Day 105
(mm) (mm) (mm) (mm) (mm) (mm) (mm) (mm) (mm) (mm)
11 32 17 21.5 43 6 11 15.5 16 18
12 14.5 12 15.5 19 7.5 15 11.5 10 13.5
14 11.5 14 13 17.5 7 10 12 12 12.5
7.5 14 14 13.5 15.5 10.5 14 13.5 8.5 12
12 28 20 33.5 33 10 13.5 19 20 14.5
13 25.5 21 22.5 31.5 8 11 22 27 14
10.5 12 16 15.5 16 7 11 9 16 14.5
9 11 15.5 11 17.5 6.5 12 8 14.5 15.5
7 9.5 14 15 17 7 13.5 8.5 13.5 10.5
8 15 18 21 31 8 12 14.5 18 21.5
12.5 15.5 18.5 20 34.5 7 18.5 14.5 25 24
10 11 16 20 18 6 11.5 14.5 15 14
10 14.5 13 13.5 15.5 8.5 6 12.5 8.5 11.5
12 14.5 13.5 14.5 18 9.5 13.5 12 16 14.5
14.5 21.5 31 17 24.5 9.5 10 14 19 23.5
14 30.5 23.5 15.5 46.5 8.5 12 14 18 26
11 15 14 14 15 7 13 11 17.5 13
14.5 13 14.5 16 14 8.5 14.5 13 10 12.5
13 14 14 16.5 19.5 8 13 12.5 13.5 17
12.5 18.5 18 23 34 12 11.5 17 15 19
340 kg/m3, Control, 0.45 w/cm
1-Day Curing 7-Days Curing
Face 1 Face 1
Face 2 Face 2
Face 3 Face 3
Face 4 Face 4

65
Day 28 Day 56 Day 63 Day 70 Day 105 Day 28 Day 56 Day 63 Day 70 Day 105
(mm) (mm) (mm) (mm) (mm) (mm) (mm) (mm) (mm) (mm)
44.5 56 NA NA NA 11 16 32.5 32 48
16.5 20.5 23.5 23.5 31.5 8.5 23 16.5 16.5 21.5
17 18.5 21.5 21.5 28 9 24.5 18 25 19
17 23.5 18 25 31 16.5 23.5 15 20 20.5
16.5 37 33.5 42 NA 12 30 16.5 28.5 29
16 NA NA NA NA 8.5 NA 32.5 27.5 45
14 18 20 21.5 25 9 13 16 16.5 16
14 16 21.5 20 25.5 8 15 15.5 18 13
13 13.5 17 25 20 10 17 8.5 13.5 17.5
11 28 20 25 47.5 10.5 21.5 15 20 28
13 25 40 22.5 NA 10 25 15 20 28.5
13.5 24.5 17.5 17.5 23.5 10.5 17 10 10 18
13 17 18 16 21.5 7.5 12.5 5 10 14.5
13 15.5 23 15.5 18.5 10.5 18 15.5 13.5 13
22 20 NA NA NA 9 24.5 21.5 15 23
21 21 NA 35 NA 8.5 17 25 15 28
13 15.5 18 21.5 25 12 12.5 10 15 17.5
12 19 20 24 28 9 13.5 13.5 15 16.5
17 20 18.5 25 29.5 14 15 15.5 15 18
25.5 NA NA NA NA 11.5 25 30 20 25
Face 4 Face 4
Face 1 Face 1
Face 2 Face 2
Face 3 Face 3
1-Day Curing 7-Days Curing
340 kg/m3, 15% Class C, 0.45 w/cm
66
Day 28 Day 56 Day 63 Day 70 Day 105 Day 28 Day 56 Day 63 Day 70 Day 105
(mm) (mm) (mm) (mm) (mm) (mm) (mm) (mm) (mm) (mm)
33 NA NA NA NA 28 NA 45 40 NA
18 24.5 27 35.5 41 12.5 20 21.5 22 23
18.5 25 29 28.5 29.5 12 20.5 23 18 20.5
20 24 28.5 27 36 10.5 29 16.5 17 22
30.5 NA NA NA NA 18 40 42.5 50 NA
41 NA NA NA NA 18 NA NA 35 NA
18.5 25.5 25 35 38 15 18 22 25 23
20.5 24.5 28 30 29.5 11.5 13.5 22 16 22
22 23 27.5 28.5 34 11 17 14.5 15 23
28 NA NA NA NA 16.5 45 22.5 22.5 NA
NA NA NA NA NA 13 50 40 30 NA
16.5 23 30 32 38 13.5 20 14 17 23
18 23 22.5 27.5 27 11 17 15 15 27
22.5 26 25 32.5 28 12 15 20 18 25
13.5 NA NA NA NA 15.5 21.5 27 40 NA
61 NA NA NA NA 15 NA 42.5 33 NA
16.5 27 31.5 27 30 14 14.5 15 20 29
17.5 27.5 22.5 26.5 30 9.5 23 15 20 20.5
14.5 26 28.5 35 36.5 11.5 24.5 20 20.5 24
27.5 NA NA NA NA 19.5 28 NA 60 NA
340 kg/m3, 30% Class C, 0.45 w/cm
1-Day Curing 7-Days Curing
Face 3 Face 3
Face 4 Face 4
Face 1 Face 1
Face 2 Face 2

67
Day 28 Day 56 Day 63 Day 70 Day 105 Day 28 Day 56 Day 63 Day 70 Day 105
(mm) (mm) (mm) (mm) (mm) (mm) (mm) (mm) (mm) (mm)
26 63 NA 60 NA 9.5 25 25.5 40 NA
16 20.5 24 18 26 9 12.5 13.5 15.5 17
16 21.5 22.5 16.5 24 13 13.5 14 13 17
12 23 20 20 25.5 12 14 16.5 15 18
15.5 28 45 NA NA 13 25 21 30 NA
17.5 NA NA 45 NA 10 23 25 20 28
16.5 18 23.5 16.5 26 12 18 15 15 18
14 16.5 16 17.5 24.5 10.5 15.5 13 20 18.5
11 21.5 22.5 20 29 10.5 16 24.5 16 20.5
22 20 24 50 NA 11 20 17.5 25 NA
24.5 52 50 NA NA 10.5 23 15 23.5 NA
12 16.5 14.5 20 24 11.5 11 12.5 15 19
13.5 18 16 15 22.5 13 17.5 13.5 12.5 20
12.5 18 17.5 20 30 9 13 12.5 15 19.5
22.5 15.5 NA 37.5 NA 9.5 18 22 20 NA
20.5 NA 45 45 NA 8.5 17.5 20 27 56.5
17 16.5 20 23.5 27 9 16 23.5 17.5 18
18 17 20 20 22 11 15.5 15 16.5 18.5
15 22 20.5 22.5 25 10 17 20 20 19.5
22 NA NA 30 NA 10.5 18 18.5 20 30
Face 1 Face 1
Face 2 Face 2
Face 3 Face 3
Face 4 Face 4
1-Day Curing 7-Days Curing
340 kg/m3, 15% Class F, 0.45 w/cm

68
Day 28 Day 56 Day 63 Day 70 Day 105 Day 28 Day 56 Day 63 Day 70 Day 105
(mm) (mm) (mm) (mm) (mm) (mm) (mm) (mm) (mm) (mm)
47.5 NA NA NA NA 25.5 NA NA NA NA
22 36 45 45 NA 14.5 23.5 30 30 47
19 28 32 33.5 44.5 13 20 22.5 25 28
21.5 35 41.5 40 NA 11.5 25 22 25 31.5
NA NA NA NA NA 15.5 NA NA NA NA
NA NA NA NA NA 16.5 NA NA NA NA
22 37.5 45 50 NA 17 20 23.5 22.5 33
21 30.5 30 33.5 45 15 21.5 21.5 23 24
20.5 32 37.5 35 NA 15 23.5 23 30 34
NA NA NA NA NA 9 NA NA NA NA
NA NA NA NA NA 17.5 NA NA NA NA
21 35 45 35 NA 15 25 19 20 36
21.5 27 25 28.5 41.5 14 21.5 20 18.5 29
22.5 28.5 35.5 40 NA 12 21 21.5 25 34.5
52 NA NA NA NA 15 NA NA NA NA
NA NA NA NA NA 13.5 NA NA NA NA
19 30.5 40 36.5 NA 15 26 20 20 35.5
18 27.5 28.5 28.5 48 17.5 21.5 20 20 26
19.5 35 40 40 NA 16 20 25.5 25 36
NA NA NA NA NA 22 NA NA NA NA
Face 2 Face 2
Face 3 Face 3
Face 4 Face 4
Face 1 Face 1
340 kg/m3, 30% Class F, 0.45 w/cm
1-Day Curing 7-Days Curing

69
Day 28 Day 56 Day 63 Day 70 Day 105 Day 28 Day 56 Day 63 Day 70 Day 105
(mm) (mm) (mm) (mm) (mm) (mm) (mm) (mm) (mm) (mm)
10.5 24 27.5 20 44.5 8.5 15 12.5 18 19.5
11 12 18 17.5 18 9 9.5 10 12.5 15
11.5 12.5 14 16 16 9 15.5 13 10 14.5
14.5 14 15 15 17 8 14.5 15 12.5 15
11.5 40.5 25.5 17.5 37 6 8 10 22.5 25
13 22 20 20 37.5 9 15 15 20 21
12.5 19 13.5 14.5 19.5 6.5 10.5 8 19.5 14
13 14 17 13.5 14.5 8 8.5 13.5 10 13
8 12 20 22.5 15.5 7 17 13 8.5 11
13 13.5 20 16 20 7.5 7.5 17 12 15.5
7.5 14 26.5 20 36 7.5 13.5 18 15 15.5
11.5 13 12 13.5 13 9 14 11.5 14.5 11.5
13 11 10.5 12 15.5 9 12.5 12.5 8 12
11 14 12.5 12.5 16.5 8 11 20 15 11.5
12 18 13 20 16 7 11.5 10 20 14
14.5 14.5 15 22.5 17.5 7 8 20 17.5 14
11.5 15 13 12.5 19.5 9 10.5 13.5 7.5 11
12 12 12 13 23.5 10 8 16 10 14.5
12 11.5 13.5 18 16.5 8 10 10 13.5 16
12.5 16.5 25 17.5 24 9 11.5 12.5 15 24.5
400 kg/m3, Control, 0.45 w/cm
1-Day Curing 7-Days Curing
Face 1 Face 1
Face 2 Face 2
Face 3 Face 3
Face 4 Face 4

70
Day 28 Day 56 Day 63 Day 70 Day 105 Day 28 Day 56 Day 63 Day 70 Day 105
(mm) (mm) (mm) (mm) (mm) (mm) (mm) (mm) (mm) (mm)
17.5 14 40 25 43.5 14.5 17 26.5 30 77
10 15.5 17.5 15.5 21 9.5 15 12.5 13.5 16.5
12.5 15 18.5 17.5 19.5 12 13.5 13.5 12 16.5
9 20.5 19 20 26 13.5 12 10 15 16
22 34.5 20 50 65 7 18 20 40 37
17.5 36 19.5 53 56 9.5 23.5 20 16 26
11.5 16 17.5 20 25 9 12.5 12.5 17 19.5
9.5 15 15 16.5 24.5 7.5 14.5 13.5 10 15
8 13.5 15 23 18 8 13.5 17.5 15.5 14
5 17 21.5 25 44 9.5 11 20.5 15 18
12 20 22 50 37 7.5 13.5 27.5 15 18
7.5 13 13 20 21.5 9.5 12 13.5 20 17
13 15.5 16.5 20 18.5 7 11.5 12.5 19 17
12.5 18 16.5 16 19 13 8 13.5 10 17
12 27.5 15.5 35 26 9.5 12.5 14 17.5 12.5
11.5 24 14 43 23 10 11.5 17.5 23.5 12
11 16 15 17 13 10.5 10.5 15 14 19.5
12.5 15.5 16.5 16 16 14 15 20 10 22
11 14 18.5 22 22 7 15.5 13.5 15.5 21.5
16.5 22.5 21 25 43.5 12 16.5 17 20 28
Face 1 Face 1
Face 2 Face 2
Face 3 Face 3
Face 4 Face 4
1-Day Curing 7-Days Curing
400 kg/m3, 15% Class C, 0.45 w/cm

71
Day 28 Day 56 Day 63 Day 70 Day 105 Day 28 Day 56 Day 63 Day 70 Day 105
(mm) (mm) (mm) (mm) (mm) (mm) (mm) (mm) (mm) (mm)
26.5 NA NA NA NA 13.5 26 25 30 69.5
15 22 23 23.5 28 10.5 16 15 16 23.5
14.5 21.5 22 18 26 10.5 24.5 17.5 15 22
19.5 22 23 17.5 26.5 9.5 19 16.5 17 26.5
22 NA NA NA NA 13 28 27 40 NA
33.5 38 NA NA NA 16.5 27 20 40 NA
17 23.5 21.5 26.5 26 15 19.5 15 20 22
19 23 21 21 25 10.5 19 13.5 16.5 22
15.5 24 20 20 31 12 22 15 22.5 23.5
15.5 62 25.5 NA NA 8 23 20 30 NA
18.5 NA NA NA NA 11.5 NA 35 45 NA
15.5 23 22 22.5 28 11 16.5 20 18.5 20
16 21.5 22 18 25.5 10 17.5 17.5 13.5 23.5
13.5 17.5 25 25 30 11.5 14.5 20 14 19.5
31 NA NA NA NA 14 16 20 45 23.5
18.5 34 NA NA NA 11.5 18 45 20 NA
16 16.5 25 25 30 9 20 18 18 18
18 23 27.5 26 25.5 10.5 16.5 20 17.5 20.5
18.5 23 25 23.5 34 14 18 16 15 22
23 38 NA NA NA 15 27.5 20 45 NA
Face 2 Face 2
Face 3 Face 3
Face 4 Face 4
Face 1 Face 1
400 kg/m3, 30% Class C, 0.45 w/cm
1-Day Curing 7-Days Curing

72
Day 28 Day 56 Day 63 Day 70 Day 105 Day 28 Day 56 Day 63 Day 70 Day 105
(mm) (mm) (mm) (mm) (mm) (mm) (mm) (mm) (mm) (mm)
15.5 55.5 NA 35 NA 11 22.5 20.5 20 53
12 12 20 20 24.5 9 17 17 15.5 18
10.5 16.5 19.5 18.5 25 7 16 15 15 22
13.5 17 18.5 20 24.5 9 15 15 13.5 22.5
14.5 26 41 30 NA 12.5 20 31 25 49
14 27 NA NA NA 11.5 22 27 30 39.5
13 18 21 18.5 21 8.5 11 15 15 20
11 17.5 17 21.5 22 9.5 11.5 10 13.5 17.5
13 17 17 16.5 22 8 11 16.5 12 20
9 17 22.5 15 58 7 20 15 12 28
12 27 35 20 NA 7.5 30 20 15 47
13 16 12 16.5 23 6.5 10.5 12 14.5 15.5
11.5 14 15 15 20 7 13 15 10.5 18.5
10 13.5 20 18.5 18.5 11 14.5 10 10 17.5
11.5 18.5 21 25 NA 14 20 15 15 25
11.5 23 22 40 22 10 21 15 15 27
20.5 13.5 20.5 10.5 22 9.5 16.5 15 10 14
14 19 19 20 22.5 9.5 18.5 13.5 13.5 16
11 20 19 15 21 11 13.5 16.5 15 23
15.5 25.5 36 NA NA 13 18.5 13.5 15 26
400 kg/m3, 15% Class F, 0.45 w/cm
1-Day Curing 7-Days Curing
Face 1 Face 1
Face 2 Face 2
Face 3 Face 3
Face 4 Face 4

73
Day 28 Day 56 Day 63 Day 70 Day 105 Day 28 Day 56 Day 63 Day 70 Day 105
(mm) (mm) (mm) (mm) (mm) (mm) (mm) (mm) (mm) (mm)
62 NA NA NA NA 47 61 NA NA NA
20 26.5 32.5 33.5 40 14 23.5 25 23.5 32
16.5 25 27 26.5 36 13 19 17.5 20 30.5
16.5 27 35 42.5 54 11.5 20.5 20 23.5 28
48 NA NA NA NA 15.5 NA NA NA NA
NA NA NA NA NA 15 NA NA NA NA
20 26 33 32.5 40 16 24.5 18 23 30
16 20 25 27 34 12.5 21 20 22 31
18.5 21.5 26 26.5 35 14 22 22.5 20 26.5
17 36 NA NA NA 12 21.5 NA NA NA
NA NA NA NA NA 13 NA NA NA NA
11.5 25.5 33 28.5 37.5 16 17 20 21.5 30
16 20 23 23.5 35.5 14 20 20 23.5 27
21.5 22 26.5 30 41.5 10.5 15 18.5 20 30.5
24 NA NA NA NA 14 36.5 NA NA NA
58.5 45.5 NA NA NA 10 32 NA NA NA
15 27 24.5 30 56.5 11 15.5 18 20 26
26.5 22.5 25.5 35.5 38 12 20 26.5 20 28
23 24.5 29 34 43 18.5 22 18 20 28
33.5 NA NA NA NA 17 43.5 NA NA NA
Face 4 Face 4
Face 1 Face 1
Face 2 Face 2
Face 3 Face 3
1-Day Curing 7-Days Curing
400 kg/m3, 30% Class F, 0.45 w/cm

74
Compressive Strength Results
Mix ID Cement Fly Ash w/cm ratio
(Kg/m3) (Kg/m3) 2 d 7 d 28 d 90 d
310
Control 310 0 0.5 19.52 27.22 34.50 39.60
15% Class C 263.5 46.5 0.5 15.49 23.13 35.82 41.85
30% Class C 217 93 0.5 14.49 23.08 37.71 46.45
50% Class C 155 155 0.5 8.69 19.31 35.61 44.60
15% Class F 263.5 46.5 0.5 17.44 24.18 35.05 40.19
30% Class F 217 93 0.5 10.31 16.93 29.16 39.03
50% Class F 155 155 0.5 4.59 8.50 18.50 26.14
30% Slag 217 93 0.5 14.64 31.06 44.36 50.65
50% Slag 155 155 0.5 13.75 31.41 44.85 51.48
340
Control 340 0 0.5 21.07 32.15 42.29 43.06
30% Class C 238 102 0.5 16.38 25.89 35.38 44.37
30% Class F 238 102 0.5 13.27 19.21 29.02 37.75
370
Control 370 0 0.5 18.71 26.54 35.54 42.39
15% Class C 314.5 55.5 0.5 17.53 24.22 34.91 40.51
15% Class F 314.5 55.5 0.5 16.91 23.03 35.36 38.89
340
Control 340 0 0.45 20.92 31.89 39.29 43.75
15% Class C 289 51 0.45 22.93 31.70 44.99 50.13
30% Class C 238 102 0.45 16.52 26.06 40.20 52.28
15% Class F 289 51 0.45 20.45 28.26 39.30 49.73
30% Class F 238 102 0.45 12.82 21.50 34.76 45.11
400
Control 400 0 0.45 25.21 33.99 43.59 47.93
15% Class C 340 60 0.45 20.74 30.50 43.65 46.87
30% Class C 280 120 0.45 15.47 28.39 45.84 52.66
15% Class F 340 60 0.45 20.23 30.49 40.69 49.83
30% Class F 280 120 0.45 14.68 25.11 39.74 44.52
Compressive strength (MPa)
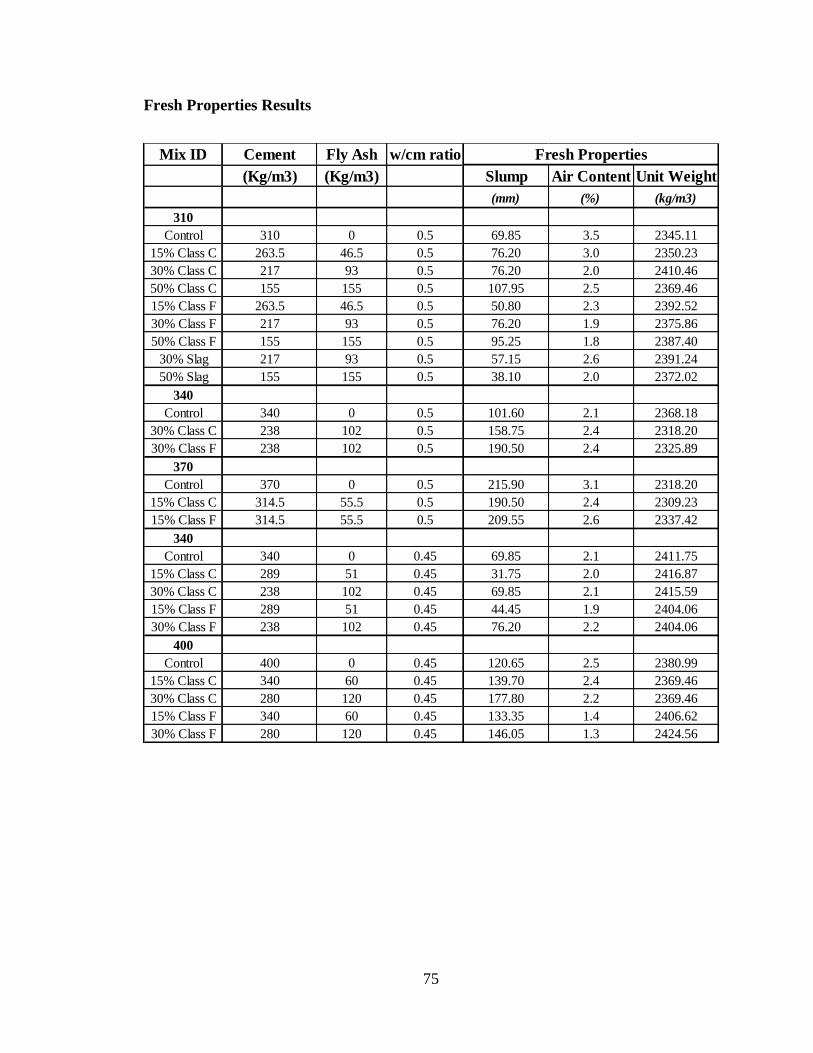
75
Fresh Properties Results
Mix ID Cement Fly Ash w/cm ratio
(Kg/m3) (Kg/m3) Slump Air Content Unit Weight
(mm) (%) (kg/m3)
310
Control 310 0 0.5 69.85 3.5 2345.11
15% Class C 263.5 46.5 0.5 76.20 3.0 2350.23
30% Class C 217 93 0.5 76.20 2.0 2410.46
50% Class C 155 155 0.5 107.95 2.5 2369.46
15% Class F 263.5 46.5 0.5 50.80 2.3 2392.52
30% Class F 217 93 0.5 76.20 1.9 2375.86
50% Class F 155 155 0.5 95.25 1.8 2387.40
30% Slag 217 93 0.5 57.15 2.6 2391.24
50% Slag 155 155 0.5 38.10 2.0 2372.02
340
Control 340 0 0.5 101.60 2.1 2368.18
30% Class C 238 102 0.5 158.75 2.4 2318.20
30% Class F 238 102 0.5 190.50 2.4 2325.89
370
Control 370 0 0.5 215.90 3.1 2318.20
15% Class C 314.5 55.5 0.5 190.50 2.4 2309.23
15% Class F 314.5 55.5 0.5 209.55 2.6 2337.42
340
Control 340 0 0.45 69.85 2.1 2411.75
15% Class C 289 51 0.45 31.75 2.0 2416.87
30% Class C 238 102 0.45 69.85 2.1 2415.59
15% Class F 289 51 0.45 44.45 1.9 2404.06
30% Class F 238 102 0.45 76.20 2.2 2404.06
400
Control 400 0 0.45 120.65 2.5 2380.99
15% Class C 340 60 0.45 139.70 2.4 2369.46
30% Class C 280 120 0.45 177.80 2.2 2369.46
15% Class F 340 60 0.45 133.35 1.4 2406.62
30% Class F 280 120 0.45 146.05 1.3 2424.56
Fresh Properties

76
REFERENCES
Aguayo, F. M., Drimalas, T., & Folliard, K. J. (2015). Natural Carbonation Of Concrete.
Special Publication, 305, 2.1-2.12.
ASTM International. (2018). ASTM C192/C192M-18 Standard Practice for Making and
Curing Concrete Test Specimens in the Laboratory. Retrieved from https://doi-
org.libproxy.txstate.edu/10.1520/C0192_C0192M-18
ASTM International. (2019). ASTM C150/C150M-19a Standard Specification for
Portland Cement. Retrieved from https://doi-
org.libproxy.txstate.edu/10.1520/C0150_C0150M-19A
ASTM International. (2019). ASTM C618-19 Standard Specification for Coal Fly Ash
and Raw or Calcined Natural Pozzolan for Use in Concrete. Retrieved
from https://doi-org.libproxy.txstate.edu/10.1520/C0618-19
ASTM International. ASTM C31/C31M-19 Standard Practice for Making and Curing
Concrete Test Specimens in the Field. West Conshohocken, PA; ASTM
International, 2019. doi: https://doi-
org.libproxy.txstate.edu/10.1520/C0031_C0031M-19
ASTM International. ASTM C39/C39M-18 Standard Test Method for Compressive
Strength of Cylindrical Concrete Specimens. West Conshohocken, PA; ASTM
International, 2018. doi: https://doi-
org.libproxy.txstate.edu/10.1520/C0039_C0039M-18

77
Atiş, C. D. (2004). Carbonation-porosity-strength model for fly ash concrete. Journal of
Materials in Civil Engineering, 16(1), 91-94.
Bouzoubaâ, N., Bilodeau, A., Tamtsia, B., & Foo, S. (2010). Carbonation of fly ash
concrete: laboratory and field data. Canadian Journal of Civil Engineering,
37(12), 1535-1549.
Bouzoubaa, N., Tamtsia, B., Zhang, M., Chevrier, R., Bilodeau, A., & Malhotra, V.
(2006). Carbonation of concrete incorporating high volumes of fly ash. Special
Publication, 234, 283-304.
Branca, C., Fratesi, R., Moriconi, G., & Simoncini, S. (1992). Influence of fly ash on
concrete carbonation and rebar corrosion. Special Publication, 132, 245-256.
Collepardi, M., Collepardi, S., Olagot, J. O., & Simonelli, F. (2004). The influence of slag
and fly ash on the carbonation of concrete. Paper presented at the Proc. of 8th
CANMET/ACI Int. Conf. on Fly Ash, Silica Fume, Slag, and Natural Pozzolans
in Concrete, held May.
Czarnecki, L., Woyciechowski, P., & Adamczewski, G. (2018). Risk of concrete
carbonation with mineral industrial by-products. KSCE Journal of Civil
Engineering, 22(2), 755-764.
Hussain, S., Bhunia, D., & Singh, S. B. (2017). Comparative study of accelerated
carbonation of plain cement and fly-ash concrete. Journal of Building
Engineering, 10, 26-31. doi:https://doi.org/10.1016/j.jobe.2017.02.001
Jia, Y., Aruhan, B., & Yan, P. (2012). Natural and accelerated carbonation of concrete
containing fly ash and GGBS after different initial curing period. Magazine of
Concrete Research, 64(2), 143-150. doi:10.1680/macr.10.00134
78
Khunthongkeaw, J., Tangtermsirikul, S., & Leelawat, T. (2006). A study on carbonation
depth prediction for fly ash concrete. Construction and building materials, 20(9),
744-753.
Leemann, A., & Moro, F. (2017). Carbonation of concrete: the role of CO 2
concentration, relative humidity and CO 2 buffer capacity. Materials and
Structures, 50(1), 30.
Lu, C.-f., Wang, W., Li, Q.-t., Hao, M., & Xu, Y. (2018). Effects of micro-environmental
climate on the carbonation depth and the pH value in fly ash concrete. Journal of
Cleaner Production, 181, 309-317.
Lye, C.-Q., Dhir, R. K., & Ghataora, G. S. (2016). Carbonation resistance of GGBS
concrete. Magazine of Concrete Research, 68(18), 936-969.
M.A. Sanjuan, C. A., & Cheyrezy, M. Comparison Beween Accelerated and Natural
Carbonation Results in Different Concretes. Special Publication, 207.
doi:10.14359/12395
Malhotra, V. M., & Mehta, P. K. (2008). High-performance, high-volume fly ash
concrete for building sustainable and durable structures. Ottawa, Canada:
Supplementary Cementing Materials for Sustainable Development.
NPCA. (2015). Understanding Carbonation - NPCA. Precast Inc. Magazine. Retrieved
from https://precast.org/2015/07/understanding-carbonation/#
Papadakis, V. G. (2000). Effect of supplementary cementing materials on concrete
resistance against carbonation and chloride ingress. Cement and Concrete
Research, 30(2), 291-299.

79
Reis, R., Malheiro, R., Camões, A., & Ribeiro, M. (2015). Carbonation resistance of
high volume fly ash concrete. Paper presented at the Key Engineering Materials.
Ruixia, H. (2010). A study on carbonation for low calcium fly ash concrete under
different temperature and relative humidity. The Electronic Journal of
Geotechnical Engineering, 15, 1871-1877.
Siddique, R. (2004). Performance characteristics of high-volume Class F fly ash concrete.
Cement and Concrete Research, 34(3), 487-493.
Stefanoni, M., Angst, U., & Elsener, B. (2018). Corrosion rate of carbon steel in
carbonated concrete–A critical review. Cement and Concrete Research, 103, 35-
48.
Sulapha, P., Wong, S., Wee, T., & Swaddiwudhipong, S. (2003). Carbonation of concrete
containing mineral admixtures. Journal of Materials in Civil Engineering, 15(2),
134-143.
Thomas, M. (2007). Optimizing the use of fly ash in concrete (Vol. 5420): Portland
Cement Association Skokie, IL.
Thomas, M., & Matthews, J. (1992). Carbonation of fly ash concrete. Magazine of
Concrete Research, 44(160), 217-228.
Yang, K.-H., Jung, Y.-B., Cho, M.-S., & Tae, S.-H. (2015). Effect of supplementary
cementitious materials on reduction of CO2 emissions from concrete. Journal of
Cleaner Production, 103, 774-783.

80
Zhao, Q., He, X., Zhang, J., & Jiang, J. (2016). Long-age wet curing effect on
performance of carbonation resistance of fly ash concrete. Construction and
building materials, 127, 577-587.
doi:https://doi.org/10.1016/j.conbuildmat.2016.10.065


![Carbonation PH-Final-Meheen [Read-Only] · PDF fileI. The Basics of Carbonation - Dave Meheen, President, Meheen Manufacturing II. Principles of Natural Carbonation Marty Velas, Director](https://static.fdocuments.in/doc/165x107/5a6fa97c7f8b9a9d538b49c7/carbonation-ph-final-meheen-read-only-nbsppdf-filei-the-basics-of.jpg)